Devolution, integration and franchising Local public transport in the Netherlands - Urban Transport Group
←
→
Page content transcription
If your browser does not render page correctly, please read the page content below
Devolution, integration and franchising
Local public transport in the Netherlands
Didier van de Velde, David Eerdmans [inno-V, Amsterdam]
Commissioned by:

www.urbantransportgroup.org

Title:
Devolution, integration and franchising
Local public transport in the Netherlands

Version 30 March 2016

Authors:
Didier van de Velde, David Eerdmans

Layout:
Evelien Fleskens
Illustration credits:
[cover] flickr user Alfenaar, [4] Wikipedia user Jorden Esser, [6]
Frank van de Velde , [8] KpVV-CROW, [9] Harrie van Veen (Flickr),
[10] NS OV-fiets, Fietsersbond, [11 ] Wikipedia, [12] Mary Berkhout
(Flickr), [13] Nationaal Archief (open data), Provincie Limburg, [14]
Wikipedia user EHH, [15] Wikipedia user Spoorjan , [16-17] Wiki-
peda users Maurits90, Bonaber, Smiley.toerist, Franklin Heijnen
(Flickr), [18-19] inno-V, Alper Çugun, iphoned.nl, [20] Mirko Tobias
Schaefer, [22] NS, [25] KpVV-CROW, [26] Bas Meijer, [28-29]
gags9999 (Flickr), [32,34,35] Alfenaar (Flickr), [37] Esther West-
erveld (Flickr), [41] Daniel Farrell, [45] NS

                        Prins Hendrikkade 170-2
                          1011 TC Amsterdam
                            The Netherlands
                          Tel: +31 20 423 1323
                         E-mail: mail@inno-v.nl
                          Web: www.inno-v.nl

    For more information contact us at mail@inno-v.nl or see
                        www.inno-v.nl.

  inno-V a member of the Chamber of Commerce Amsterdam,
                        No. 30177512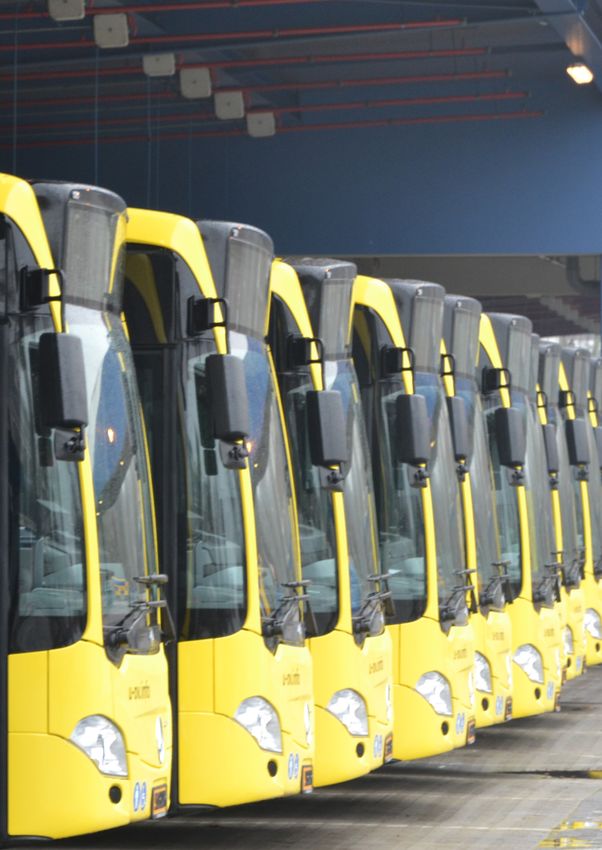
Public Transport Tendering in the Netherlands

Table of Contents
Why look at the Netherlands?                                                                                            4

The Netherlands                                                                                                         7

•   Public transport authorities and funding                                                                            7
•   Bicycles 											                                                                                                 9
•   Mobility policies                                                                                                  10

Public transport services in the Netherlands									 13

•   Typical supply level                                                                                               13
•   Integration of services                                                                                            14
•   Vehicles and branding											                                                                                    15
•   Ticket integration and public transport fares                                                                      16
•   Travel information                                                                                                 18

Passenger transport legislation										 21

•   Public transport until 2001                                                                                        21
•   The Passenger Transport Act 2000                                                                                   21
•   Urban and regional public transport                                                                                22
•   Rail services                                                                                                      23

Main franchising formats											 27

•   Service design by the operator under ‘superincentive’                                                              28
•   Service design by the operator under net cost contracting                                                          31
•   Service design by the authority under gross cost contracting                                                       34

Outcomes												 38

Comments on contracting approaches and recent trends						                                                              42

                                                                                                                    3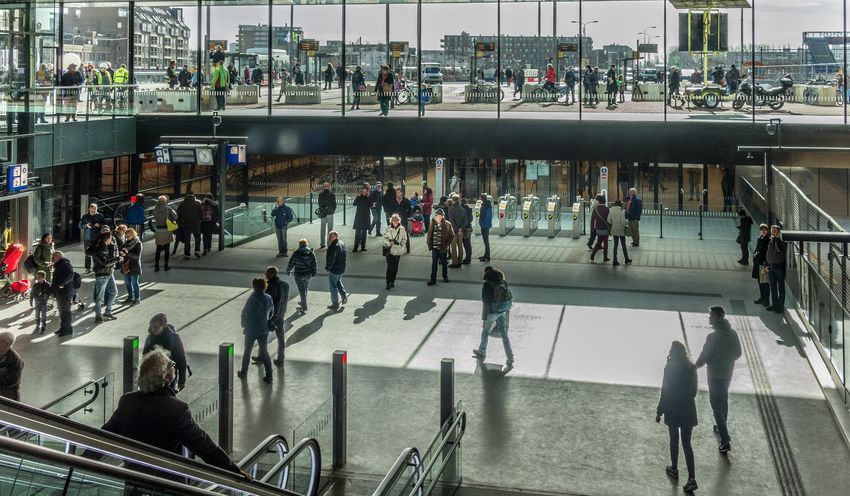
inno-V

  Why look at the Netherlands?
  Outside the three largest cities all local public transport in the   in the Netherlands already had a focus on ensuring integrated
  Netherlands has been subject to contracting under competitive        outcomes including on ticketing and services. This imperative
  tendering by local transport authorities since 2001. A wide          has been maintained under franchising and was in several cases
  variety of approaches have been taken, all within the basic          even extended to regional rail.
  tenants of transport planning in the Netherlands. These include
  a strong commitment to integrated public transport networks          In comparison, the current debate in the UK discusses a move
  and ticketing as part of a wider suite of policies that favour the   from deregulation to franchising in order to bring in more public
  bicycle and the integration of land use and transport planning.      sector influence and determination of bus services. One of the
                                                                       aims of franchising would be to realise levels of integration that
  The Netherlands now has 15 years of experience with                  are difficult to realise under bus deregulation. Another would be
  competitively tendering area contracts with in most cases            to allow local authorities to specify key features of franchised
  operators bearing responsibilities for service planning and          services - like vehicle standards, integrated fares and networks -
  marketing. As such in many ways the Netherlands has acted            and bring about the possibilities of such a contracting approach,
  as a laboratory for different approaches to contracting              similar to what is the case in the Netherlands.
  integrated public transport networks – from which others
  can learn. The diversity of environments – from deep rural to        This report aims to provide the reader with an overview of how
  larger conurbations – also provides a series of useful parallels     local public transport in the Netherlands is developing. For this to
  for local transport authorities to learn from. This experience,      be successful, it is important to correctly interpret the contextual
  which is presented in this report, is of high relevance for the      differences summarised above and further elaborated upon in
  current debate in the UK about the potential for franchising bus     the report. This will help to overcome the difficulty presented by
  networks outside London.                                             the fact that data on issues like fares, ridership, service levels are
                                                                       not available in the Netherlands to the same degree as in the UK.
  One important remark in interpreting the findings of the report      It will also help to avoid oversimplified extrapolations upon the
  is that the context, starting point and motivation for introducing   results of franchising in the Netherlands, assuming that identical
  franchising in the Netherlands were different from the current       effects would result in Great Britain in terms of functioning or
  situation in Great Britain. The 2001 Dutch reform implied a          in terms of costs, ridership or fare levels. With these remarks
  move from public operation under government regulation               in mind, it is hoped that this report will help those actively
  to devolved franchising. Bus services in the Netherlands             exploring the franchising option for bus services in the British
  were not fully deregulated but franchising was introduced            context to understand the different forms of franchising that
  to improve efficiencies and to allow the use of private sector       have been adopted in the Netherlands and the lessons learned
  expertise in generating more customer focus and service              over the last 15 years.
  innovation. Furthermore, the prior regime of public operation

Passengers alighting at Delft train and bus station.

        4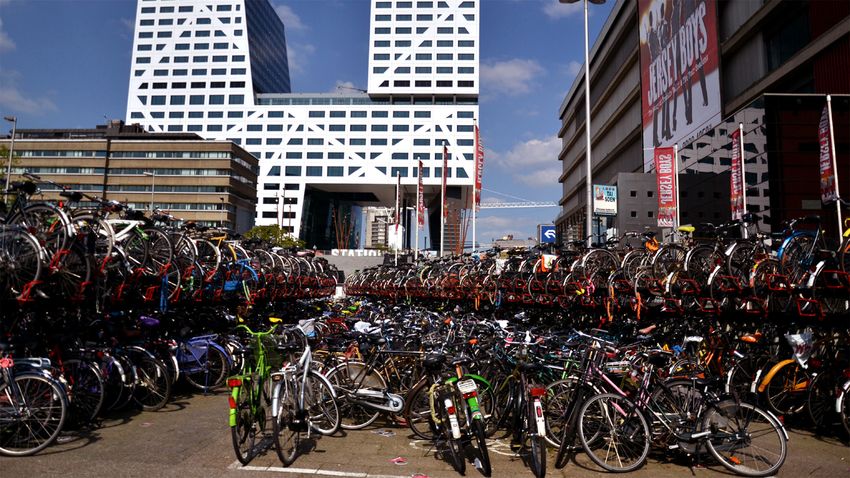
Public Transport Tendering in the Netherlands

The context

The Netherlands has a population density similar to England,           • Ensuring adequate levels of competition for contracts
although a third of the population is concentrated in the              • The lack of uniformity of approach can also be a challenge for
Randstad where the challenges of traffic growth and congestion           bidders and for evaluating the success and failures of so many
are particularly acute. Responsibility for local transport provision     different variations on the contracting theme
is devolved to the appropriate tier of regional government.            • Ensuring that lessons are learnt by local transport authorities
Funding is centrally distributed rather than locally raised              from the diversity of approaches being taken
but local transport authorities have significant freedoms to
determine how that funding is spent in line with local priorities.     Over time a trend towards greater contractual specification of
                                                                       service detail by local transport authorities could be observed.
Key features of local transport in the Netherlands are:                This was in response to perceived risks and uncertainties
• A very strong commitment to integrated public transport              involved in contract based more on objectives than detailed
  networks and inter-connecting hierarchies of public transport        specification of services. However, new approaches have been
  services supported by integrated ticketing                           developed – including greater co-development of services
• High levels of bicycle use and provision and a very strong           between operators and authority.
  cycling culture
• A land use planning system that promotes linkages with               The outcomes and benefits for passengers and local transport authorities
  transport planning
                                                                       The experience of the competitive tendering of public transport
• Free public transport for students
                                                                       networks in the Netherlands, coming from the former non-
• Increasing focus on public transport lines with high passenger       competitive environment, is characterised by:
  demand, while on lines with low passenger demand traditional
                                                                       • Significant investment in vehicles leading to a modern bus
  bus services are increasingly replaced with small scale mobility
                                                                         fleet meeting high emission and accessibility standards
  systems
                                                                       • Significant enhancements in service levels and the overall local
• Nationwide ‘OV-chipkaart’ smart card system giving
                                                                         public transport offer
  passengers access to the entire public transport network with
  one card                                                             • Though there are tensions between the local and national,
                                                                         and operators and authorities, integration remains a key
• Outside the largest cities extensive experience of contracting
                                                                         feature
  local public transport networks by local transport authorities
  under competitive tendering                                          • Patronage data is not sufficiently robust to allow for a
                                                                         sophisticated analysis of impacts but the data suggests that
• A number of contracts have included both local rail and bus
                                                                         local bus patronage remains stable
  networks
                                                                       • Substantial improvements in labour productivity
Approaches to regional public transport tendering                      • Falling costs of provision, although market prices have been
                                                                         rising again recently
Local transport authorities have adopted and implemented a             • Rising levels of customer satisfaction
wide range of contracting formats ranging from conventional            • High degree of fares integration with a degree of local
highly specified contracts, to contracts which set objectives            specification of fares offers, all within the overall context of
(rather than specify service details) and which utilise                  fares rising above inflation
sophisticated incentive regimes to encourage operator
                                                                       • Formal role for passenger groups in service development and
innovation to reward hierarchies of objectives (such as
                                                                         changes
patronage growth).

                                                                       There has also been significant innovation and diversity in
These different formats bring with them their own challenges
                                                                       approaches – ranging from small contracts for only one line or a
and tensions. This includes:
                                                                       group of lines to contracting of large public transport networks
• Finding the right balance between encouraging private                (rail and bus). There have been several cases where regular public
  sector innovation (rather than passive contract compliance),         transport contracts have been integrated with social, disabled
  protecting minimum standards (without ossifying transport            and educational transport. This, however, has not always turned
  networks) and realising the public sector’s legitimate social,       out to be successful: efficiency gains were lower than expected
  environmental, and economic objectives for its local public          and organisation turned out to be rather complex due to the
  transport network (but in a way that provides good value)            number of actors involved (both provinces and municipalities).
• Trade offs between the sophistication of incentive regimes and       The tendency towards replacing traditional buses with small-
  the ability of the market to respond to that complexity              scale transport systems in rural areas does, however, bring new
• Managing the transition to radically new service patterns that       possibilities to integrate these systems with similar small-scale
  operators could introduce                                            social, disabled and educational transport.
• Dealing with the implications of external shocks for the
  economics of the contracts (such as economic downturns)

                                                                                                                                              5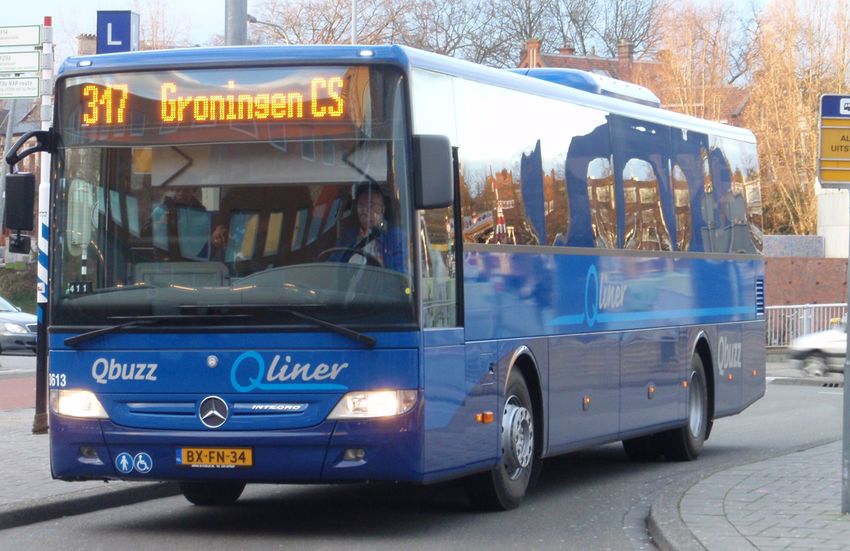
inno-V
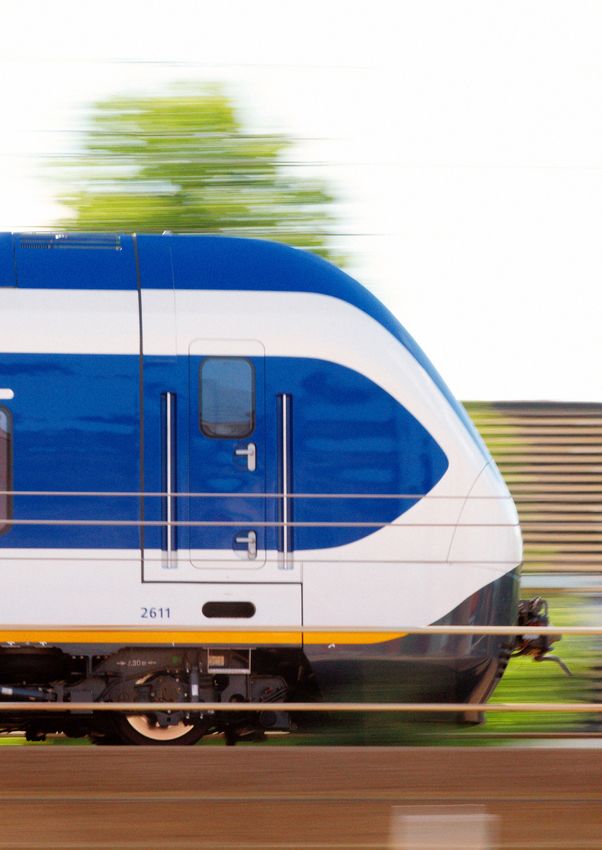
The new Sprinter trains from the NS gradually replaced
rolling stock from the 1960’s.
6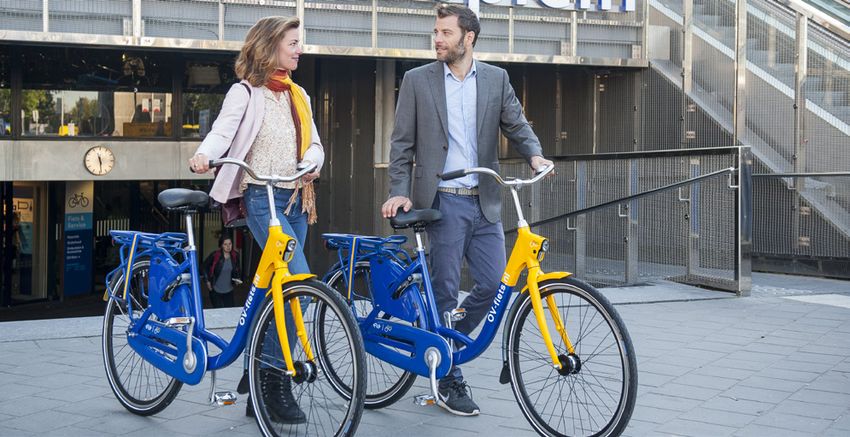
Public Transport Tendering in the Netherlands

The Netherlands
•   Responsibility for local public transport networks devolved to regional tier of government
•   Funding for transport centrally distributed but with significant freedoms for local transport authorities to determine their own
    transport priorities
•   High levels of bicycle use and provision – and very strong cycling culture
•   Land use planning system that seeks to promote linkages with transport planning
•   Significant challenges on traffic growth and congestion particularly in the main Randstad conurbation
•   Free public transport for students, funded by central government
•   Experiments of pooling of social, healthcare, education and public transport budgets and services

The western half of the Netherlands is characterised by a                     Eindhoven, Arnhem/Nijmegen and Hengelo/Enschede. These
polycentric urban structure with Amsterdam, Rotterdam,                        public bodies used to be responsible for several policy areas that
The Hague and Utrecht forming the main conurbation known                      would otherwise be covered by the province, such as land-use
as Randstad (or ‘edge city’). This area has a population of                   planning, public transport, infrastructure funding (though not
approximately 7 million inhabitants which is almost half of the 17            maintenance), but also economic affairs, and housing and youth
million inhabitants of the country, and has an average population             welfare. Their budget came mostly from national government
density of about 1,000 inh./km2. The Netherlands as a whole has               with a smaller proportion coming from the participating
an average population density that is approximately 20% higher                municipalities. These city regions were abolished by law in
than the population density of England.                                       2015 and their responsibilities returned to the provinces. Two
                                                                              exceptions remain: in the Amsterdam and in the Rotterdam/
                                                                              The Hague areas the responsibility for public transport is now
                 Netherlands        England           United Kingdom          allocated to new ‘transport regions’ (vervoerregio) as successors
 Inhabitants                 16.8              54.3                    64.6   to the city regions in these two metropolitan areas.
 (in millions)
 Size (km2)               41,528           130,306               242,514      Public transport authorities and funding
 Density                     498                417                    266
 (inh/km2)                                                                    Regular public transport
Source: Office for National Statistics (UK), CBS (NL), 2014
                                                                              The allocation of responsibilities between the various levels
There are three levels of government in the Netherlands:                      of government mean that fourteen regional authorities are by
• National government: State                                                  law responsible for local and regional public transport in the
                                                                              Netherlands: twelve provinces and two transport regions. Their
• Regional government: Provinces
                                                                              responsibilities include both local public transport services and
• Local government: Municipalities                                            some regional train services operated mainly on branch lines
                                                                              of the national train network, while the State is the transport
The twelve provinces are responsible for land-use planning,                   authority responsible for national rail services, including both
public transport, infrastructure (roads, bus stops), health policy            intercity services and most local train services operating
and recreation, within policy boundaries prescribed by national               alongside those services.
government. The provinces also oversee the policy and finances
of municipalities and water boards (these government bodies,                  Two provinces, Groningen and Drenthe, decided to establish
called waterschappen and charged with managing dikes,                         a common public transport bureau (OV-bureau) which acts as
waterways, water levels and sewage water treatment, are                       public transport authority for bus transport in these provinces.
among the oldest forms of local government in the Netherlands).               However, both provinces continue to act as independent
There are some provincial taxes but national government covers                public transport authority for regional rail transport in their
most of the budgetary needs of the provinces through transfers                respective areas. The province of Flevoland voluntarily allocated
from national funds.                                                          responsibilities for public transport in the city of Almere (the
                                                                              largest city in the province) to the municipality of Almere. In
The 393 municipalities have various responsibilities such as                  the future, Almere may become a part of the wider Amsterdam
education, spatial planning, and local infrastructure (roads,                 transport region.
bus stops), this within policy limits prescribed by national and
provincial governments. The municipalities have some local                    As a result , there are seventeen public transport authorities:
taxes but again national government provides most of their                    twelve provinces, two transport regions, one public transport
funding.                                                                      bureau, one municipality and the State.

Until 2014 there used to be ‘city regions’ (stadsregio), which                Local authorities (provinces and municipalities) have only very
were compulsory municipal cooperations in the urban areas                     limited taxation powers in the Netherlands. Funding for public
of Amsterdam, Rotterdam, The Hague, Utrecht, Rotterdam,
                                                                                                                                                    7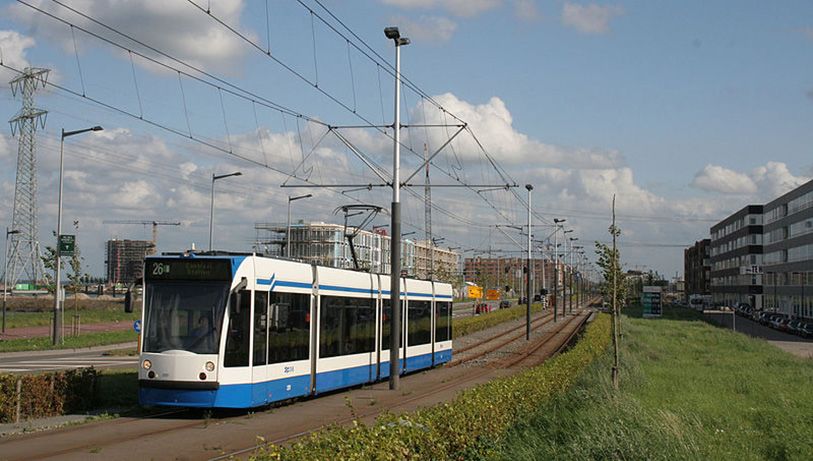
inno-V

transport services comes directly from the transfers from central        School transport
government and is allocated to the regional transport authorities
according to specific apportionment criteria. Since 2005 funding         Most Dutch tertiary education students benefit from free public
for public transport services became part of a wide transport-           transport. This system was introduced in 1991 as a commercial
dedicated financial transfer from central government to the              contract between the Ministry of Education and the transport
transport authorities (Brede Doeluitkering, BDU). Since then,            operators, replacing former travel allowances to the students.
local authorities have the freedom to allocate funding as they           This contract amounts to about € 700 million per year, which is
see fit between public transport and infrastructure (roads, public       constitutes a very substantial source of revenue for the public
transport infrastructure, bike lanes, etc.) In the near future, this     transport system.
transport-dedicated funding will be merged with the general
financial transfer from the State to the provinces (the provincial       The free travel scheme does not include secondary education
fund, provinciefonds), which means that provinces will have even         students; however, all persons under the age of 18 enjoy rebates
more freedom to allocate funding between transport and their             on tickets and passes.
other responsibilities. On rare occasions local government (or
even chambers of commerce, businesses, etc.) provide funding             Only specific groups of pupils qualify for dedicated schools
for specific local public transport services such as additional peak     transport in the Netherlands. These are only provided to pupils
hour operation of shuttle services between a railway station and         who cannot make use of schools in their own neighbourhood
a peripheral industrial area. These services and their funding           (up to 6 km) for religious reasons or because they need special
represent only a minute part of overall funding for transport.           care (such as for health reasons), and also for those who live in
                                                                         areas where there are no schools in the neighbourhood. These
                                                                         bus or taxi services are usually not integrated with regular public
     Authority               Type               Modal responsibilities
                                                                         transport and the funding source is also separate.
 1   Groningen / Drenthe     Public transport   Bus
                             bureau                                      Note that some school transport provision falls within
 2   Groningen               Province           Train                    mainstream public transport funding. This includes conventional
 3   Drenthe                 Province           Train                    public transport services that are marketed especially for pupils
                                                                         or students (such as schedules that are aligned with school
 4   Fryslân                 Province           Bus, train               hours, or services with special branding) and regular routes
 5   Gelderland              Province           Bus, train               with additional bus trips for pupils or students at peak hours.
 7   Flevoland               Province           Bus                      For example, a number of initiatives have been introduced to
                                                                         improve or combine services or to reduce costs. The Collegeliner
 8   Almere                  Municipality       Bus
                                                                         was developed by Arriva in the province of Fryslân to reduce
 9   Utrecht                 Province           Bus, tram                the overcrowding of some train and bus services at peak hours.
 10 North Holland            Province           Bus                      Students avoid having to transfer while these services also
 11 Amsterdam                Transport region Bus, tram and metro        reduce the peak loading on regular bus and train services.
                                                                         Sometimes special contractual arrangements between public
 12 South Holland            Province           Bus, train               transport authority and operator are made, often with a yearly
 13 Rotterdam/The Hague      Transport region Bus, tram                  re-evaluation of the usage of the school lines. One example of
 14 Zeeland                  Province           Bus                      this can be found for some routes in the Province of Gelderland.
                                                                         Here, if the cost-coverage drops under 50%, the operator has
 15 North Brabant            Province           Bus
                                                                         to work with secondary schools along the route to create an
 16 Limburg                  Province           Bus, train               additional marketing plan to raise ridership, but the line can be
 17 Department of            State              National rail            discontinued if this does not lead to sufficient improvements. In
    Infrastructure and the                                               some cases, the authority exempts buses serving schools from
    Environment                                                          meeting the general fleet age requirements and environmental
                                                                         standards.

                                                                         Special transport services

                                                                         The Social Support Act (Wet Maatschappelijke Ondersteuning,
                                                                         WMO) aims to allow the elderly and the disabled to live
                                                                         independently at home and take part in society for as long as
                                                                         possible. The Dutch government allocates general funds to
                                                                         municipalities out of which they also provide for the needs of
                                                                         their inhabitants fulfilling the WMO-criteria. The Ministry of
                                                                         Health, Welfare and Sports provides for an equivalent national
                                                                         mobility system (Valys), which allows elderly and disabled to
                                                                         travel from door-to-door on longer distances (usually with a
                                                                         combination of taxi and train services).

      8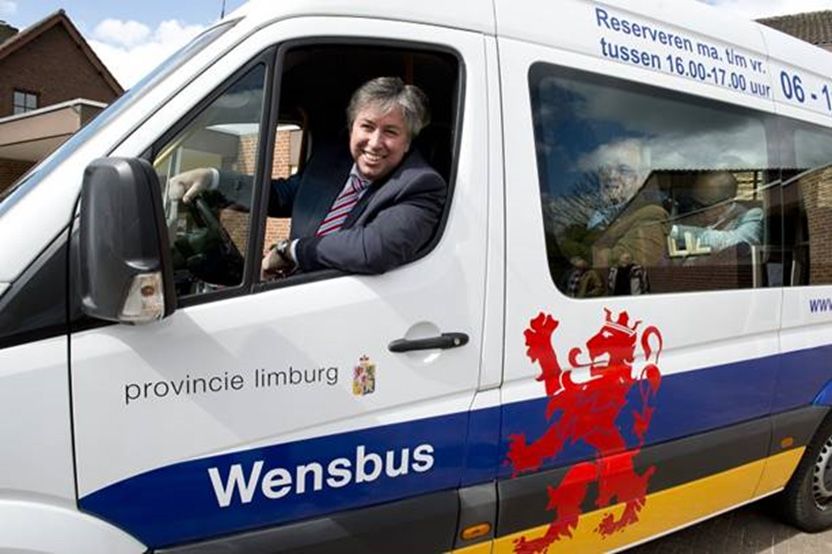
Public Transport Tendering in the Netherlands

                                                                           to cover the rest of the costs).

                                                                           In general, though, the usage of WMO transport services by its
                                                                           target groups receives priority and most authorities discourage
                                                                           its usage as public transport for the general public due to its
                                                                           higher cost compared to regular services. As a result, mostly
                                                                           few non-WMO users make use of these RegioTaxi services,
                                                                           with a general balance between regular WMO users and other
                                                                           passengers using WMO services of about 85% - 15%.

                                                                           As we will describe in the next chapter, regular public transport
                                                                           has in the recent years become increasingly focused on lines with
                                                                           high passenger numbers. Partly due to budget constraints, public
                                                                           transport authorities tend to allocate an increasing share of their
                                                                           budgets to those lines. Doing so, they aim at improving public
Note: this scheme shows financial relations in net cost contracts, which   transport supply on those relations that can be competitive to
is the most common type of contract in the Netherlands. In gross cost      the car and thus increase public transport usage. This approach,
contracts passenger revenues as well as the compensation for the student
free travel passes go to the public transport authority.                   however, does lead to a decrease in public transport supply in
                                                                           more rural areas where demand is anyhow low. This raises the
The municipalities provide equipment or services (such as                  question of whether and how public transport authorities and
domestic support, special toilets, wheel chairs etc.) but also             municipalities should provide mobility solutions for people in
dedicated local and regional door-to-door transport as part of             those rural areas who cannot drive or who do not own a car.
their WMO-services. People falling in specific categories can              Several initiatives have been developed in the last few years
make use of these services. These WMO transport facilities are             to address these issues: see the text box ‘Small scale public
usually taxi or minibus services that have to be ordered one hour          transport services’ in the next chapter.
in advance.
                                                                           Bicycles
Demand responsive regular public transport services open as
WMO transport services are usually branded as RegioTaxi.                   The Dutch transport scene is of course characterised by the
Sometimes regular public transport users may also use these                major role played by the bicycle, which is the primary mode for
services. In such cases, the public transport authority allocates          distances up to 5 kilometres. A dense bike lane network is usually
part of the public transport budget to the municipalities                  available within cities as well as between cities and villages. The
responsible for those WMO-services as compensation for the                 bike is not regarded as a poor man’s transportation mode and is
transportation of these passengers (for instance the passenger             used by all sections of society. A challenge, however, is the lower
pays €1.75 per zone, which is above the usual public transport             bicycle usage amongst immigrants.
fare, and the transport authority pays €3.25 to the municipality

                                                                                            Even though there are thousands of bicycle parking
                                                                                           places around Utrecht Central Station, this still is not
                                                                                            enough for the demand, and thousands of bikes are
                                                                                       illegaly parked next to official parking places. Currently,
                                                                                         the largest indoor bicycle parking in the world is being
                                                                                       built at this station, creating 12,500 new bicycle parking

                                                                                                                                              9
inno-V
100% trips kilometers
1% 2%
90% 3%
1% Car (driver)
80% 17% 3% 8%
Car (passenger)
70% 39% Train
10% Bus/Tram/Metro
60% Fietsnet Fietsnet
HOUTEN Scooter
HOUTEN 56%
50% 26% Bicycle
17%
Walking
40% 11% Other
30% 1% 3%
3%
20% Modal split in the Netherlands. These graphs clearly show that, although
10% Fietsnet Welkom
the modal share of bicycles op measured in kilometres is relatively small due to
the shorter Vind
HOUTEN distances covered
snel en eenvoudig by
de weg mostviacyclists,
in Houten cycling
acht duidelijk has
aangegeven a very significant
Fietsnetroutes
36
0% 2
Amsterdam Den Haag Rotterdam Utrecht modal share in the total number of trips. Source: Kennisinstituut voor
33
UTRECHT / DE UITHOF / BUNNIK BUNNIK / ZEIST A12 DE UITHOF
Mobiliteit (2015), Mobiliteitsbeeld 2014.
NIEUWEGEIN / UTRECHT WEST
Speelbos Nieuw Wulven
Car Bicycle
VELDEN 99
Sportcomplex 2 8 1
Public Transport Other Oud Wulven SLOTEN
ODIJK
Bedrijventerrein
Doornkade WEIDEN
5 6
5a
KADEN
HAGEN
Modal split in the four largest cities in the Netherlands (measured in 4
Hier staat u HOEVEN
CENTRUM-
BERMEN
number of trips). In Amsterdam and Utrecht more than one third of all trips
BORCHEN OOST
GAARDEN
AKKERS
1 GILDEN
are made by bicycles. Source: Kennisinstituut voor Mobiliteit (2015), CAMPEN
CENTRUM-
A27
WEST
3
NIEUWEGEIN
Mobiliteitsbeeld 2014.
Manifestatie- HOVEN
OORDEN
terrein
SLAGEN
BOGEN
OUDE MOLENS
Bedrijventerrein POORTEN
DORP Sportpark De
Het Rondeel Kruisboog
3
Cycling is consequently a very common form of transport in the VESTEN ERVEN
Netherlands for short-distance trips (shopping, school trips,
BRUGGEN
1 LANDEN
BOTEN Sportcomplex
67 Weteringhoek
SCHAFTEN
commuting and recreation), representing a substantial share
Bedrijventerrein MEREN
HONEN SPOREN
De Meerpaal
Am
BOUWEN TUINEN Rietplas
WERKHOVEN
s te
Sport- en
rd a
of short distance travel in urban areas; a market that is covered
m-
werklandschap
Rij
SCHEPEN HOUTEN
Meerpaal
nk
7
an
CASTELLUM-
aa
OOST
l
mainly by public transport in other countries.
WATERS CASTELLUM-
WEST
GRASSEN MOSSEN 5
‘T GOY / WIJK BIJ DUURSTEDE
POLDERS
90
8
Fietsnetroutes MUREN STENEN
In recent years, transport authorities have tried to to increase 2
Andere fietsroutes
7 4 6
Wegen, niet toegankelijk voor fietsers 63
1 Fietsknooppunten
usage of both traditional and electric bicycles on longer Plattegrond Houten
Fietstransferium 66 0 250 500 meter
distances, such as for trips between suburban towns and larger Dedicated cycling routes in Houten TULL EN ‘T WAAL SCHALKWIJK / CULEMBORG
64
De buurten in Houten worden door de volgende routes aangedaan:
cities. In some urban areas, bicycle ‘superhighways’ (snelfietspad) 8 Akkers 4 7 Castellum West 2 4 Hoeven 2 7 Muren 5 6 Sporen
HoutenBermen
is a new town in the
1 8 vicinity
Centrum Oost of UtrechtHoven
which counts 49,000
1 6 Oorden inhabitants. The
Stenen 1 2 4 1 2 5 2 4
have been built to accommodate cycling on these longer 3 8
Bogen
railwayBorchen
Centrum West
station and the shopping
Houten
centre form the
1 4 Oude Dorp 2 4 7 2 3 4 5 5 7 8
Kadencore of the city, around whichVelden
a large
Tuinen
5 5a Erven 4 5 Polders 5a 7 8
distances. Examples include the RijnWaalPad which connects the office and facility area (sports,
Bouwen
4 5
Bruggen
2 3 Gilden medical, etc) are
Gaarden
situated. The residential
Landen
Molens
3 6 8
4 5 Poorten
Schaften areas are situated
Vesten
Waters
5 8
3Fietsnet
6
1 3 5
4 5
3
2
Fietsnet
cities of Arnhem, Nijmegen and the rapidly growing suburban
HOUTEN HOUTEN
aroundCastellum
the centre with a decreasing housing density. From the centre a star-shaped
Fietsnet
Campen
5a
Fietsnet
Grassen Meren
2 6 8 Slagen Weiden 7 1 1 6 8
HOUTEN
HOUTEN
6 7 Oost Hagen Mossen 6 Sloten 5 8 1 8
towns in between these cities. bicycle and pedestrian network branches out into direct routes to the residential areas. All
Zo maakt u gebruik van is een initiatief van de
gemeente Houten en de Fietsersbond en is
Het staat
areas can still be reached by car, though car traffic must use the ring road to get from one
in ontwikkeling. Dit bord is onderdeel van
Zoek de fietsroute die u het dichtst bij uw bestemming brengt
ook online! Met deze code kunt een proefopstelling. Meer informatie vindt u
u de kaarten snel raadplegen Plan uw route en volg de genummerde en gekleurde routes naar uw bestemming op www.houten.nl
via uw smartphone of tablet Op elke kruising van fietsnetroutes kunt u uw locatie en route controleren
The relationship between bike and public transport is ambivalent residential neighbourhood to another, or to the centre. Thus in many instances walking
Fietsnet
Vind de weg in de buurt met behulp van een kaart op uw smartphone of tablet HOUTEN
as they are the main competitors within cities for short distance or cycling is more attractive and quicker. The result in Houten is that there is relatively
trips. On the other hand, bikes can function as a feeder for the more walking and particularly more cycling, than in comparable centres. [Cycling in the
railways and for buses in rural areas. That role is stimulated by Netherlands (2009), Fietsberaad]
creating large parking lots for thousands of bikes near railway
stations or near bus stops at the edge of a village.
Mobility policies
An interesting development is the substantial growth of bicycle
The road network of the Netherlands is very dense and most
hiring in recent years, mainly through OV-fiets (‘Public transport
major cities are connected to the motorway system. This system
bicycle’), a subsidiary of the Dutch Railways. It is now possible
suffers from congestion during peak hours – not only in the
through this scheme to hire a bike at a station and other
Randstad area. The government has tried to address this issue
locations in major cities. The system is relatively cheap, costing
for many years including through proposals for a kilometre-
€3.15 for 24 hours plus a yearly €10 subscription fee, and is very
based road user-charging scheme. However, this proposal
easy to use: the subscribers use a personal pass (usually their OV-
was cancelled due to public resistance and dwindling political
chipcard) and in less than a minute they are ready to cycle.
support. Instead, many motorways were widened, relieving
some of the worst congestion.
Ministerie van Infrastructuur en Milieu
A brief historical perspective on the Dutch car mobility policy
is needed to understand these shifts. Around the turn of the
century the Netherlands saw a major shift in mobility policies on
both the national and regional level. In the 90s the Government’s
mobility policy – as formulated in 1988 White Paper – aimed at
creating a modal shift from car usage towards public transport
and bicycle usage.
The latest OV-fiets
10Public Transport Tendering in the Netherlands
This was considered desirable from both economic (reducing The 90s saw the introduction of large new suburbs next to many
congestion) and environmental perspectives. However, this large cities, following the policy conducted by the ministry
modal shift was not realised: despite various efforts, car usage responsible for land-use planning. These suburbs are designed
increased by 45% between 1986 and 2001. This also meant that in such a way that bus and bicycles traffic has the most direct
both the economic and environmental goals where not met: connections to the city centre, whereas car traffic often has to
congestion kept increasing and the desired CO2-reduction was follow a longer route. In addition, some of these new suburban
not realised (CO2-emissions from traffic increased by 40 % areas have also a station on the national rail network or tram
between 1986 and 1997). and light rail connections. However, this policy alone could
not completely stop urban sprawl and high car usage in these
These disappointing results led to a shift in policies. The 1988 new – often very large – suburbs. Although many of these new
plan was, with hindsight, considered too ambitious; it was felt residential areas are situated as close to the city centres as
that policy makers had had too much faith in the extent to which possible, distances to the city centres remained often rather long
society could be influenced by such policies. This resulted in a for bicycles. In addition, these new suburban areas suffered from
new White Paper on mobility: the National Traffic and Transport the fact that many new traffic flows were not directed towards
Plan 2001 – 2020 (NVVP), adopted in 2000. The NVVP follows a the city centre anymore but towards surrounding urban areas.
more pragmatic strategy to reduce congestion and to promote The proximity of many of these new suburbs to motorways
sustainability and safety. The policy no longer aims to reduce car and the increasingly sprawling office areas on the outer edges
use, but instead seeks to reduce its negative impacts. of towns further contributed to this effect. Many suburban and
rural areas are therefore still conducive to a high modal share
This policy was continued with the adoption of the White Paper for the private car due to rather a rather low housing density in
on Infrastructure and Spatial Planning in 2012. From then on, these areas, the long distances to public transport stops, and an
emphasis was placed on a balanced mix of modalities, investing insufficient realisation of the aim of providing public transport
in both car and public transport, instead of aiming at a modal services from day one to the first residents of these new areas.
shift from car to public transport. An important focus is the Now that these suburban areas have almost all been realised,
accessibility of economically important areas. Therefore, new more recent policies regarding spatial planning have shifted
major investments were made to increase capacity on both the towards inner-city development, rather than the creation of
national motorway network and the main railway lines, aiming new suburbs. At the same time, responsibilities regarding urban
to increase frequencies on some of these lines to 6 Intercity and planning have shifted from national and provincial level to the
6 local services per hour. municipalities.
The Dutch railway service is arguably one of the best in Europe, A relatively new element in the national mobility policy is
already providing high frequencies on much of the network with mobility management, where the national government works
at least two trains per hour on all routes and at least four intercity together with regional authorities as well as the private sector
services and four local services in the Randstad area. The modal to make mobility – especially commuting – more flexible such
share of railways is relatively high in the Netherlands: 8.8% of all as to decrease the negative effects of congestion. A Taskforce
land passenger kilometres are made by train (8.2% in the UK and Mobility Management was in place between 2007 and 2014,
7.4% in the entire EU [Source: Eurostat, 2014]). aiming for a reduction of 5 % of car kilometres in rush hours.
One of the most important measures which could be introduced
Urban planning is generally considered in the Netherlands as in various companies is that of a ‘mobility budget’ for employees,
the best means of reducing the need for travelling by car. The from which all work-related journeys can be paid, regardless of
Netherlands has a rather strict urban planning policy, aiming modality. This means that for each individual journey employees
at relatively compact suburbs with good provisions for bicycles can choose how they want to travel, instead of being bound
and urban transport. Large suburban shopping malls hardly exist to either a lease car or public transport pass. Other measures
in the Netherlands and shopping needs are covered by smaller include flexible working hours and stimulating working from
neighbourhood-oriented supermarkets. home.
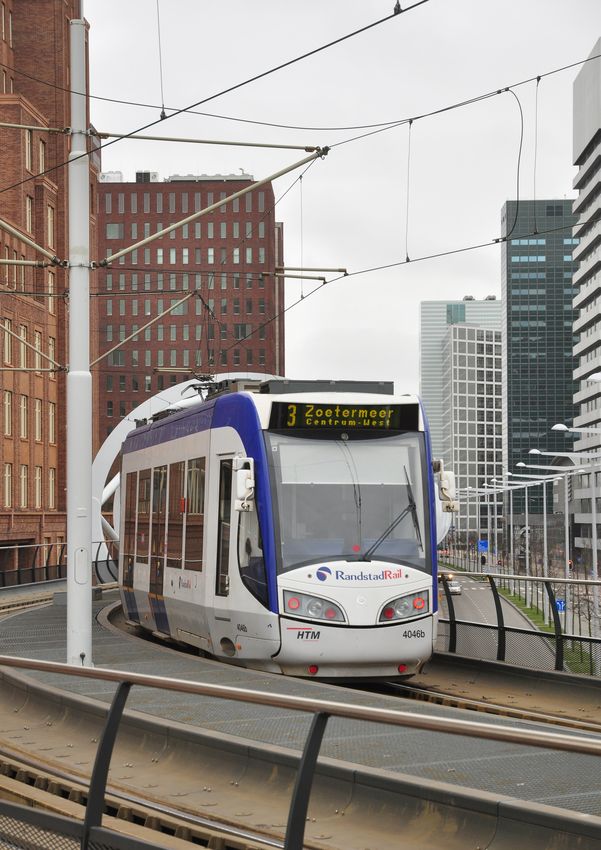
A new tram lines connects the new suburban area ‘IJburg’
11
with the centre of Amsterdam.inno-V
HTM is one of the three remaining publicly-owned passenger
transport operators in the Netherlands.
12Public Transport Tendering in the Netherlands
Public transport services in the Netherlands
• Highly integrated public transport network with hierarchies of interconnecting services
• Increasing focus on improving public transport on corridors with high passenger demand
• Decreasing public transport supply on lines with low demand; authorities and operators are developing alternative mobility
solutions for these connections
• Nationwide ‘OV-chipkaart’ smart card system giving passengers access to entire public transport network with one card
• One number, one website provides national public transport information service for passengers, and nationwide real-time
passenger information is available through open data
• Modern, low emission bus fleet
• Contracting of regional and local bus and rail services is well established
Typical supply level decrease in network coverage due to straightening of lines
and the decrease in service on lines with very low passenger
Traditionally much emphasis was placed on network coverage demand. This development raises the question of knowing to
in the Netherlands and the speed of services was, before the what extent public transport authorities should be responsible
introduction of competition, generally slow. Typical service levels for supplying transport services in areas with very low demand.
were every 20 or 30 minutes in urban and suburban areas and These areas are in most cases rural, but low demand services
every 30 to 60 minutes in rural areas. Cuts in national funding for do also include some bus services in medium sized towns and
public transport were introduced together with the introduction larger cities. An increasing number of public transport authorities
of the Transport Act 2000 (see next chapter). This forced come to the conclusion that it is no longer financially sustainable
authorities to make choices that resulted in more focus on fast to keep operating larges buses on routes with only a handful of
and frequent urban connections and less priority for rural areas passengers. However, it is often felt that there should at least be
where infrequent bus lines were further cut back in frequency, some form of transport for those without cars or driving licences.
replaced with neighbourhood buses or cancelled altogether. Several initiatives have been developed in recent years, and
At the same time, the first round of tendering resulted in an more are expected in the near future (see textbox).
increased value for money for the taxpayer: the contract price
per bus hour decreased. This efficiency increase often allowed
for an increase in frequencies in urban areas; in many cases from
every 30 minutes to every 15 minutes.
Currently typical service levels are:
• Urban: every 10 - 15 mins
• Suburban: every 15 - 30 mins
• Rural: every 30 - 60 mins The first Buurtbus in 1977 The first Wensbus in 2014
In recent years, even more emphasis was placed on improving Small scale public transport services
services with high passenger demand. Public transport
authorities and operators tried to improve the competitiveness Several initiatives have been developed to provide transport in areas with very little
of these services to car usage, hoping that this would lead to an passenger demand to improve efficiency compared to a regular bus service:
increase in passenger numbers. Measures that have been taken
typically include increasing frequencies and increasing speed, Neighbourhood buses (Buurtbus) (left picture) are the oldest of these initiatives.
either by straightening routes or by building dedicated public First introduced in 1977, these minibuses are operated by volunteers, organised in a
transport infrastructures. In some cases, ‘HOV’ (Hoogwaardig non-for-profit Buurtbus organisation. The local public transport operator facilitates
Openbaar Vervoer or High Quality Public Transport) corridors the maintenance of the vehicles as part of its contract with the transport authority,
have been designated, on which dedicated frequent and fast and also provides for service integration with regular public transport in the area (e.g.
services are operated. Often, these HOV corridors have separate integration in passenger information systems, in the smart card system, etc.) A Buurtbus
bus infrastructure on part of the route, or even the entire route. runs according to a regular timetable (in most cases once per hour) and there is no
Sometimes, services on such corridors have their own branding, pre-notification time for customers. There are approximately 200 Buurtbus lines in the
such as Volans in the province of North Brabant or Qlink in Netherlands. Bus drivers from regular public transport services often see the buurtbus as
Groningen. The prime example is the R-net 300 tangential unfair competition as volunteers drive the buses.
service (formerly known as Zuidtangent) in the Amsterdam area,
connecting the southeast area of Amsterdam with Schiphol A similar but more recent initiative is the Wish Bus (Wensbus) (right picture), operating
Airport, the suburban town of Hoofddorp and the city of in several municipalities in Limburg where the regular bus service was cancelled. These
Haarlem. minibuses are also operated by volunteers and here too the vehicles are provided by
the operator and funded by the authority. However, the operation is more flexible: the
While these measures do increase the attractiveness of public Wensbus usually does not have fixed schedules (except at some busy times), rather
transport for a majority of passengers, they do also lead to a passengers call the driver or coordinator to make an appointment to take them from A to B.
13inno-V
In other areas, initiatives have been taken to bring people from villages to stops or stations On most journeys where no direct connection is possible, there
of regular public transport. One example is the Opstapper service in Fryslân (derived from is often a convenient connection with a short transfer between
the verb opstappen, which means ‘to board’) and the very similar Overstapper service in trains or between train and bus. Although bus-bus connections
North Holland. This is a taxi service that brings people from their home or from a central are less common, several rural areas are characterised by stand-
stop in a village to a centrally located transfer point where people can transfer to regular alone interchanges points that do not serve any local demand
public transport. The Opstapper is part of the public transport contracts in the area but is but are provided purely to facilitate interchange between
subcontracted by the bus operators to local taxi companies. The service is not heavily used inter-connecting rural services. These interchange points, that
but the province states that the goal is not to attract as many passengers as possible here, pre-existed the introduction of competitive tendering, continue
but rather to provide a service for people without other means of transport. People are to be provided in the tendered setting in various rural parts of the
also encouraged to ride a bike to a transfer point instead and the province is to this effect country. Some of these interchanges are provided in the evening
investing in bicycles parking at transfer points. hours such as to allow passengers from several smaller rural
routes into one bus continuing to the next regional centre.
On the island of Texel all bus lines except the busiest one have been replaced with the
flexible Texelhopper system that allows passengers to travel directly from any bus stop to In fact, when setting up a timetable, bus operators often start
any bus stop on the island after notifying the operator at least one hour in advance. with building a ‘transfer scheme’ in which the most convenient
ways to connect to the railways can be found. Public authorities
This is also very similar to the which operates in several parts of the Netherlands and also place great emphasis on connections when tendering
which is a form of Wmo-transport for disabled people (see previous chapter) that can public transport services. However, although a high degree
also be used by regular public transport users. In most cases, these Regiotaxi services of connectivity can open up many journey opportunities for
are contracted by municipalities (who are responsible for Wmo-transport). In Limburg, passengers because of shorter transfer times, a small delay on
Regiotaxi was contracted and operated as part of the regular public transport contract, but the first part of the journey may result in missing the next bus
as the service was rarely used by non-Wmo users, it was decided that Regiotaxi would no or train. To a degree the introduction of competitive tendering
longer be integrated in the next public transport contract. In the provinces of Groningen in regional public transport has introduced tensions between
and Drenthe there are several further small contracts which combine Wmo-transport with performance aims: an example is the conflict that arises between
small-scale regular public transport. realising punctuality and realizing connections with services from
neighbouring contract areas.
Finally, several public transport authorities are considering completely new
forms of mobility services as a solution for rural areas. These include car-sharing Long distance coaches hardly exist in the Netherlands as trains
solutions (possibly with volunteer drivers for passengers without a driving licence), provide fast and frequent long distance services al over the
encouraging the use of (electric) bicycles, and further ride-sharing services. However, country. Express buses fill the gaps in the network in those few
these mobility services and especially ride-sharing services currently often face cases where there is no rail service. In the 90s, the national bus
legal problems, as it is illegal to transport people for a fee without a taxi licence. holding company VSN introduced upon its own entrepreneurial
initiative a national branding scheme for these long distance
buses, called the Interliner. These services had higher vehicle
Integration of services and bus stop specifications, such as higher levels of passenger
comfort on vehicles and real time information and bike parking
One of the traditional key features of Dutch public transport at bus stops. These services were well integrated with train times
is the integration of services. Over the decades, the public and railway tickets could also be used on these services. The
transport system increasingly came to operate as one system Passenger Transport Act 2000, by introducing regional tendering,
based on a clear hierarchy of regular interval services: with abolished the possibility for innovation through the autonomous
intercity, semi-fast and stopping rail services complemented commercial market initiative that had generated this Interliner
by express buses (where there is no rail service), and local bus concept. As a result, the power given to the regional authorities
services. Within the bus network there can also be hierarchies of meant that the focus shifted on how such express bus services
fast (peak hour), local and community and demand responsive could fit within regional service concepts; as a side effect
services. Much effort is put into ensuring good connections, both the national brand of longer distance bus services and the
within these systems as well as between rail and bus. corresponding ticket integration with the railways disappeared.
However, many of the original Interliner-connections still exist
A Brabantliner connecting the province of North-Brabant with the city of Three authorities in the north of the Netherlands use a blue ‘Qliner’ brand
Utrecht. for their long distance bus services.
14Public Transport Tendering in the Netherlands
nowadays, in most cases operating under a regional brand name The downside of specifying new vehicles was that buses from
for express buses, such as Qliner (north of the Netherlands) and previous concessions were scrapped at a relatively young age.
Brabantliner (province of North-Brabant). Furthermore, the Because of this, some authorities now allow second hand buses
recent deregulation of long-distance coaching in Germany and to operate as well.
France is stimulating private operators to attempt to find ways
Number %
to enter in this market, both for international connections – that
already operate nowadays – but also for national connections. Euro III 233 5%
This constitutes one of the next challenges but also opportunities Euro IV 87 2%
for Dutch regional public transport. Euro V 496 10%
EEV 3,475 70%
Almere: Substantial growth with Maxx high-frequent services on dedicated
tracks Euro VI 603 12%
Electric 51 1%
One example of a highly frequent urban bus network can be found in the city of Almere.
This could be considered the first Rapid Bus Transit network in the Netherlands. Total 4,945
Source: based on data from KpVV (2015) ‘Milieukwaliteit OV bussen’
At the moment, the ‘average’ bus in regional public transport
is a Mercedes, VDL, Van Hool or MAN 12-meter long low-floor
vehicle. On busy routes, single or double articulated (‘bendy’)
buses can also be found. Regarding passenger comfort, most
buses have simple seating, comparable to what is usual in the
urban areas, except for a few longer-distance routes where
coach-style seats are common. Environmental standards are
usually Euro-5, Euro-6 or EEV; in some concessions the authority
demands the use of CNG-buses.
Almere. Turquoise: bus infrastructure. Grey, pink, yellow and white: road infrastructure.
In the most recent tenders, bidders are often stimulated to offer
Although Almere is a young city – it was founded in 1976 in an area reclaimed from at least some zero emission vehicles from the start of operations
the sea – it has grown to become the seventh largest city of the Netherlands (200,000 or to offer a large scale transition towards zero emission vehicles
inhabitants), sprawling across a vast area. Many of its inhabitants work either in during the contract period. The number of zero emission vehicles
Amsterdam or Utrecht. Right from its conception, bus transport played a major role currently operating is mostly limited to a few pilot projects. The
in the planning of the city: there is a large network of dedicated bus lanes connecting
only exception is the small-scale public transport on the island of
neighbourhoods with the city centre often via routes that are not open to cars. When the
bus network in the city was for the first time competitively tendered, the winning operator Schiermonnikoog, which is entirely operated with electric zero
(Connexxion) introduced a new brand for its new highly frequent bus services: Maxx. emission buses (built by the Chinese manufacturer BYD). These
Frequencies typically are every 10 or 15 minutes, or better on routes with multiple bus buses are operated by Arriva but were acquired and are owned
lines. High-capacity low floor vehicles were introduced and – in order reduce dwell times – by the province of Fryslân.
passengers were allowed to board through all doors.
The introduction of Maxx has been highly successful: in the first year alone, ridership In most areas bus operators carry their own brands, using
numbers went up by 40%. In 2004, Maxx was awarded the ‘Passengers’ Award’ from the name, logo and livery of the company itself. However,
passenger advocate organisation ROVER. The brand Maxx has since also been applied to increasingly authorities specify a regional brand for all public
other urban services operated by Connexxion (in Alkmaar and Amersfoort), albeit often at transport in the area. In some cases, the brand is developed
lower frequencies and speeds. by the authority and in others by the operator. Usually this is a
uniform brand for the entire area without differentiation in lines
Vehicles and branding or product types. However, in some cases a special brand is used
to distinguish some faster or more frequent lines from regular
The introduction of competitive tendering has led to a large- bus lines. Examples include Breng Direct (a variant of the Breng
scale renewal of bus fleets. In many areas a brand new fleet was brand used in the Arnhem Nijmegen area), Volans (Noord-
introduced after each tendering round. This was partly the result Brabant) and the above-mentioned brands for long-distance
of (national) laws requiring accessibility for the disabled and services. Similarly to Breng, the local authority-owned brand
other objectives set by the authority regarding the environment U-OV (OV = Public Transport) is used in the city of Utrecht, as well
and accessibility. as the ‘sub-brands’ U-Bus and U-Tram.
Breng (which means ‘bring’) in the City Region Arnhem – Nijmegen was Electric BYD bus on the island of Schiermonnikoog.
developed by Connexxion for the City Region.
15inno-V
EBS-bus in R-net livery A Qbuzz light rail vehicle in the ‘U OV’ livery, which was developed by the Utecht City Region
In the densely populated Randstad area in the west of the 2005 onwards: OV-chipkaart: National Public Transport Smartcard
country, the public transport authorities are introducing a
The introduction of competitive tendering in 2001 and the
common brand name R-net for their most important lines. The
associated contractual revenue risk allocated to the operators
aim is to create an integrated R-net network consisting of lines
required a more precise revenue allocation method. This was
with higher quality standards (frequency, reliability, speed) all
realised with the introduction of a national public transport
over the Randstad area, regardless of the operator or mode of
smartcard (OV-Chipkaart) that gradually replaced the
transport: the R-net brand is used for regional trains, trams, light
strippenkaart and the corresponding zonal system. The OV-
rail and buses. The number of R-net lines is gradually increasing
chipkaart was first introduced in Rotterdam in 2005. It was
as R-net is often introduced after a new round of tendering. This
gradually extended to other areas and the strippenkaart system
growth is also accompanied by a growing difference between
was ultimately abolished in 2011. Unlike the strippenkaart,
R-net lines in terms of speed, frequencies and hours of operation,
the OV-chipkaart is also valid on the national railway network,
leading to some questions on the clarity of the brand message.
although NS kept its own fare system.
Ticket integration and public transport fares
A major advantage of the OV-chipkaart is that it allows
authorities and/or operators to devise their own fares to be
1980 - 2011: Strippenkaart nationwide ticketing system more responsive to local needs than what could be done under
the former national system. Another main advantage under the
In 1980 the Netherlands saw the
current tendering regime is that this system gives operators and
introduction 0f a national fare and ticket
authorities – in principle – more precise information on their
system for urban and regional public
revenues by providing detailed information over all journeys
transport. With the exception of most train
made. While the smartcard technology was meant to allow
journeys, this covered virtually the entire
fare flexibility and innovation, political consensus meant that
public transport network, regardless of
the current fare system remained very traditional, with the
public transport operator. By using the
difference that unlike the strippenkaart, the OV-chipkaart is
‘strippenkaart’ (zoned multi-ride ticket)
based on a kilometre-based tariff. Upon boarding local transport,
or the ‘sterabonnement’ (zoned seasonal
passengers touch in and are charged a fixed check-in tariff of
passes), passengers had the benefit
€4.00 (for rail journeys with NS this tariff is €10.00 or €20.00).
that they could travel throughout the
When exiting the vehicle or the system, the user touches out
country using the same ticketing and fare
and the correct fare is automatically calculated, deducted and
system. Fares were based on the number
displayed (similar to the Oyster Card in London). The ministry
of geographical zones ‘crossed’ (which
has set a uniform base fare of €0.88 (2015), leaving each region
were about 4-5 km in diameter). Ticket
or province to set the price per kilometre. Prices per kilometre in
revenues were apportioned to authorities
bus contracts vary between €0.125 and €0.168, with an average
and/or operators on the basis of a complex
of approximately €0.145. The base fare does not have to be paid
nationwide passenger enquiry. Authorities
again when a passenger exits a vehicle and re-boards another
were allowed to introduce regional tickets
vehicle within 35 minutes (even if not re-boarding at the same
(themselves or through their operator)
stop).
alongside the nationwide strippenkaart Types of strippenkaarten.
system. The one on the left is for
reduced-rate travel
The major advantages of the strippenkaart
meant that passenger could travel anywhere in the country
with the same ticket, the disadvantages were the complexity
of the system from a passenger’s point of view (such as how to
know the number of zones of a trip to stamp the correct number
of strips). More importantly, it led to reduced incentives for
the operators as revenue apportionment was slow, complex
and imprecise, being based on yearly passenger surveys, with
operators complaining that they received less money from the An OV-chipkaart issued by Trans Link System, the company responsible for
operating the nationwide system. In addition, most operators also issue
revenue allocation system than they should have received. their own OV-chipkaart, which are also valid nationwide.
16You can also read