THEOUT-OF-STATEUNIVERSITY - EMRA Research
←
→
Page content transcription
If your browser does not render page correctly, please read the page content below
RECRUITING
       THE OUT-OF-STATE UNIVERSITY
               Off-campus recruiting by public research universities

Public High School                     Private High School                        Community College                    Other

Crystal Han, UCLA                                                                                              March
Ozan Jaquette, UCLA                                                                                           Prepared for:
Karina Salazar, University of Arizona

             * For full interactive results that accompany this report, please see ozanj.github.io/joyce_report.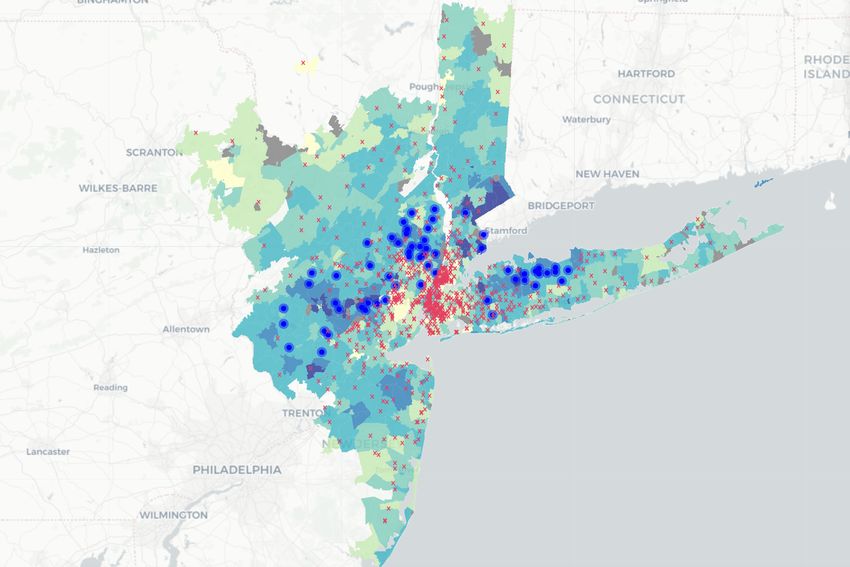
x
emraresearch.org

ACKNOWLEDGMENTS

We gratefully acknowledge the Joyce Foundation for supporting this research on off-campus recruiting by
colleges and universities and for supporting the publication of this policy report. The Joyce Foundation is
a private, non-partisan foundation based in Chicago that supports policy research to advance racial equity
and economic mobility for the next generation.

This research was also made possible by the following funding sources:

   ▷ A National Academy of Education/Spencer Foundation Postdoctoral Fellowship (Ozan Jaquette)
   ▷ An American Educational Research Association (AERA) Dissertation Grant (Karina Salazar)
   ▷ A Faculty Career Development Award from the UCLA Office of Equity, Diversity, and Inclusion (Ozan
     Jaquette)
   ▷ UCLA research “start up” funds (Ozan Jaquette)

We are grateful to the core members of our research team responsible for data collection, data quality
checks, integration of secondary data, and data analysis: Sean Beaton, Patricia Martin, Die Hu, and Xin
Li. Finally, we thank UCLA undergraduate research assistants who contributed to this project: John Ather-
ton, Henna Dialani, Xinru Fang, Jiaqing Gu, Qianying Huang, Vidya Krovvidi, Stephen Lee, Tomson Mathai, Caitlin
Shener, Jack Wu, and Connie Zhou.

Suggested Citation:

Han, C., Jaquette, O., & Salazar, K. (2019). Recruiting the Out-of-State University: Off-Campus Recruiting by Pub-
lic Research Universities.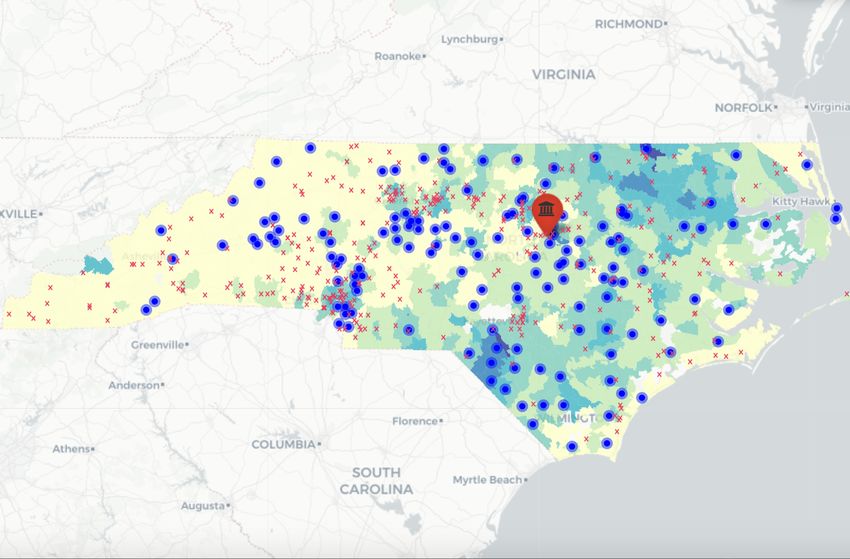
emraresearch.org

AUTHORS

Crystal Han is a data scientist in the Department of Education within the Graduate School of Education
and Information Studies at UCLA.

Ozan Jaquette is an assistant professor in the Department of Education within the Graduate School of
Education and Information Studies at UCLA.

Karina Salazar is a doctoral candidate in the Center for the Study of Higher Education within the College
of Education at the University of Arizona.
emraresearch.org

EXECUTIVE SUMMARY

Despite a historical mission of social mobility for meritorious state residents, public research universities
increasingly enroll an affluent student body that is unrepresentative of the socioeconomic and racial di-
versity of the states they serve. Mainstream policy debates about the causes of access inequality focus on
“deficiencies” of students and K-12 schools (e.g., the “achievement gap,” “under-matching”). Public universi-
ties position themselves as remaining committed to access despite state funding cuts and despite student
deficiencies, pointing to the adoption of access-oriented policies (e.g., need-based financial aid, outreach
programs) as evidence of this commitment. In turn, policy discourse assumes that doubling the number of
high-achieving, under-represented students who apply to a university will double their enrollment. There-
fore, policy interventions to increase college access tend to focus on changing student behavior rather
than university behavior.

An alternative explanation for access inequality is that the enrollment priorities of some public research
universities are biased against poor communities and communities of color. Decades of research on or-
ganizational behavior finds that formal policy adoption is often a ceremonial effort to appease external
stakeholders, while internal resource allocation is a reliable indicator of organizational priorities, suggest-
ing a “trust but verify” approach to university rhetoric about access. Scholarship on “enrollment manage-
ment” shows that universities are very purposeful about which students they pursue and expend substan-
tial resources crafting their class. Therefore, knowing which student populations are targeted by university
recruiting efforts can yield insights about university enrollment priorities.

This report analyzes off-campus recruiting visits (e.g., visit to a local high school) by 15 public research uni-
versities as a means of understanding university enrollment priorities. We collected data on recruiting vis-
its by “scraping” data from university admissions websites (e.g., webpages advertising admissions repre-
sentatives coming to a “neighborhood near you”) and by issuing public records requests.

      Findings

      Out-of-state recruiting

          ▷ Most public research universities prioritize recruiting out-of-state students
            rather than students from their home state. 12 of 15 universities made more
            out-of-state visits than in-state visits and 7 of 15 universities made more than
            twice as many out-of-state visits than in-state visits.
          ▷ Out-of-state visits are concentrated in affluent communities within major
            metropolitan areas, ignoring rural communities.

                                                                                   EXECUTIVE SUMMARY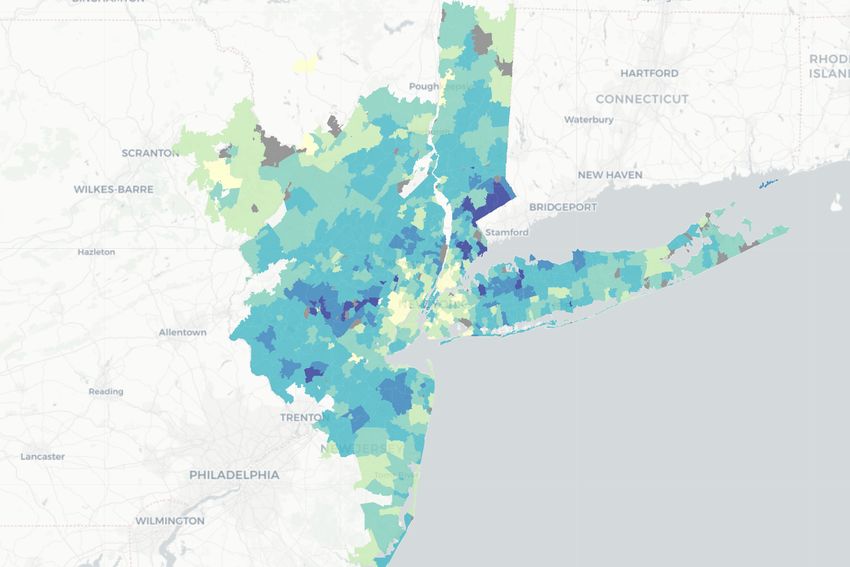
emraresearch.org

        ▷ All universities were much more likely to visit out-of-state public high schools
          in high-income communities than schools in low-income communities, even af-
          ter controlling for factors related to recruiting visits such as enrollment size and
          student achievement.
        ▷ Most universities were significantly less likely to visit out-of-state public high
          schools with a high percentage of Black, Latinx, and Native American students,
          even after controlling for other factors.
        ▷ Most universities visit a disproportionate number of out-of-state private schools.

     In-state recruiting

        ▷ “Coverage” of in-state public high schools and community colleges varied dra-
          matically across universities, even after considering state size and population
          (e.g., University of Nebraska visited 88% of high schools while University of Al-
          abama visited 33%).
        ▷ Most universities were more likely to visit in-state public high schools in high-
          income communities than schools in low-income communities, even after con-
          trolling for other factors. However, income bias for in-state visits was smaller
          than income bias for out-of-state visits.
        ▷ The presence of racial bias in in-state visits to public high schools varied across
          universities, with some universities less likely to visit schools with a high share
          of Black/Latinx/Native students and other universities more likely to visit schools
          with a high share of Black/Latinx/Native students.

     Overall patterns

        ▷ Recruiting patterns are tied to state funding. Universities with the weakest
          state funding (e.g., University of Alabama, University of South Carolina) heavily
          focused recruiting efforts to out-of-state schools and communities. These univer-
          sities made the largest number of out-of-state visits and these visits made up the
          largest proportions of total recruiting visits for each university. Universities with
          stronger state funding (e.g., NC State, Nebraska) tended to have better coverage
          of in-state public high schools and/or more equitable coverage of in-state pub-
          lic high schools. The only three universities that made more in-state visits than
          out-of-state visits – NC State, UC Irvine, UC Berkeley – were in states with strong
          nonresident enrollment caps.
        ▷ However, universities facing similar state funding and demographic trends (e.g.,
          UC Berkeley and UC Irvine) often exhibited substantially different recruiting pat-
          terns with respect to out-of-state focus, income bias, and racial bias.

2   RECRUITING THE OUT-OF-STATE UNIVERSITY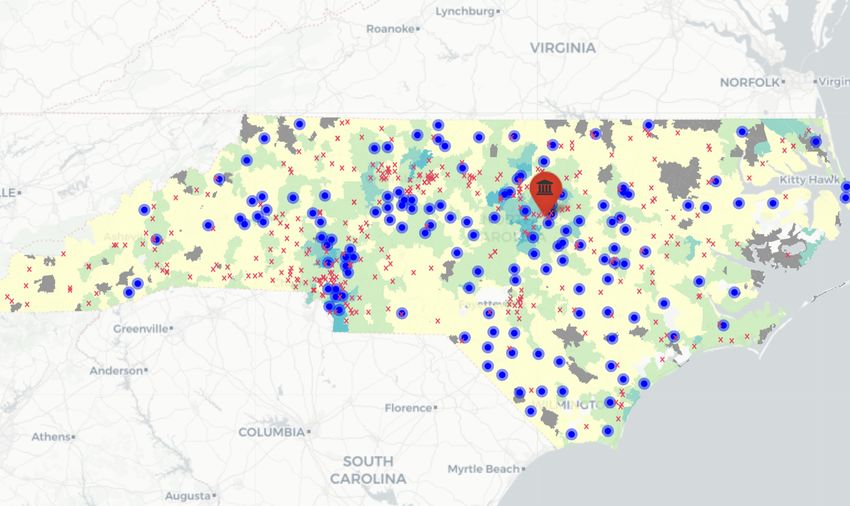
emraresearch.org

             Therefore, university enrollment priorities are choices made by leadership
             rather than mere functions of environmental conditions.

Summary and implications. In contrast to rhetoric from university leaders, our findings suggest strong
socioeconomic and racial biases in the enrollment priorities of many public research universities. A small
number of universities exhibit recruiting patterns broadly consistent with the historical mission of so-
cial mobility for meritorious state residents. However, most universities concentrated recruiting visits in
wealthy, out-of-state communities while also privileging affluent schools in in-state visits. Although most
universities did not exhibit racial bias in in-state visits, out-of-state visits consistently exhibited racial bias.
Since most universities made many more out-of-state visits than in-state visits, overall recruiting visit pat-
terns for most universities contribute to a student composition where low-income students of color feel
increasingly isolated amongst growing cohorts of affluent, predominantly White, out-of-state students.

These recruiting patterns and enrollment priorities are a function of a broken system of state higher ed-
ucation finance, which incentivizes universities to prioritize rich out-of-state students with lack-luster aca-
demic achievement. This is not a meritocracy. We suggest recommendations to policymakers, access ad-
vocates, and university leaders to reverse this vicious cycle.

   ▷ State policymakers. 14 of the 15 universities in our sample experienced dramatic declines in state
     funding after 2008 and state funding has not returned to pre-recession levels despite 10 years of eco-
     nomic recovery. Universities make up for state budget cuts by prioritizing affluent students. If state
     policymakers want flagship public universities to prioritize meritorious state residents, they must re-
     invest in public higher education by growing state appropriations and/or by boosting the purchasing
     power of poor students through growth in need-based grant aid.
   ▷ Access advocates. Advocates for access can use our research to start a dialogue with university
     leaders about the disconnect between stated commitments and actual enrollment priorities. Armed
     with systematic data about university recruiting behavior, access advocates will no longer be de-
     terred by lofty rhetoric or the adoption of opaque programs with unclear resources. Therefore, the
     data and findings from this report enable access advocates to hold universities accountable, creating
     a foundation for an authentic debate about university priorities.
   ▷ University leaders. Research shows that generous need-based financial aid combined with aggres-
     sive outreach dramatically increases the number of high-achieving, low-income students who apply
     to and attend public research universities. Therefore, access inequality is not simply a consequence
     of student deficiencies, but rather a deficit of will by universities. University leaders serious about ac-
     cess for under-represented students must put their money where their mouth is, rather than putting
     their money where the money is.

For full interactive results that accompany this report, please see ozanj.github.io/joyce_report.

                                                                                      EXECUTIVE SUMMARY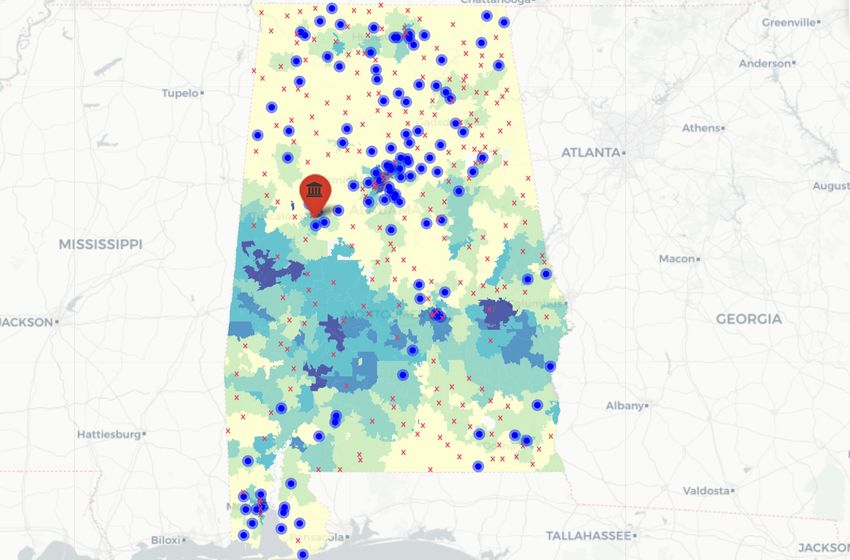
emraresearch.org

                                                            pertise of enrollment management consulting firms,
INTRODUCTION
                                                            the University identifies desirable “prospects” and plies
                                                            these prospects with a targeted cocktail of emails,
                                                            brochures, paid advertising (e.g., pay-per-click ads
The University of Alabama-Tuscaloosa exemplifies that        from Google), off-campus recruiting visits to “feeder”
transformation from state flagship university to out-        high schools, and a savvy social media campaign.
of-state flagship. Nonresident freshman enrollment
exploded from 626 in 2002-03, to 1,895 in 2008-09, and      Figure 1 provides descriptive statistics about off-
to 5,001 by 2017-18, while resident freshmen declined       campus recruiting visits (e.g., visits to local high
from 3,221 in 2008-09 to 2,406 by 2017-18 (Author cal-      schools, community colleges, hotel receptions) by
culations based on IPEDS data). This period also wit-       the University of Alabama in the 2017 calendar year.
nessed the erosion of state appropriations, which de-       Admissions representatives made 4,349 off-campus
clined from $232 million in 2007-08 to $153 million in      recruiting visits. However, only 392 of these visits oc-
2010-11, increasing only modestly to $158 million by        curred in Alabama. Further, the University visited only
2016-17 despite years of economic recovery following        33% of Alabama public high schools. These in-state
the Great Recession (2018 CPI). By contrast, net tuition    public high school visits were concentrated in relatively
revenue increased dramatically – driven by nonresi-         affluent, predominantly White communities, largely
dent enrollment growth – from $105 million in 2002-03       avoiding high schools in Alabama’s “Black Belt,” which
to $225 million by 2007-08 to $493 million by 2016-17.      enroll the largest concentration of students of color.
                                                            In-state recruiting efforts were dwarfed by the 3,957
Nonresident enrollment growth at the University of Al-      out-of-state recruiting visits, which spanned metropoli-
abama also coincided with declining socioeconomic           tan areas across the U.S. The University made 2,312
and racial diversity. The percent of full-time freshmen     visits to out-of-state public high schools. These visits
receiving Pell Grants declined from 21.2% in 2010-11        focused on schools in affluent communities, with vis-
to 17.0% in 2016-17. Additionally, while the percent of     ited schools having a much higher percent of White
18-24 year-olds in Alabama who identify as Black in-        students than non-visited schools. Incredibly, the Uni-
creased from 31.4% in 2010 to 32.3% in 2017, the per-       versity made 934 visits to out-of-state private high
cent of full-time freshmen at the University of Alabama     schools, more than double the total number of in-state
who identify as Black declined from 11.9% in 2010-11 to     recruiting visits.
7.5% in 2017-18.
                                                            The University of Alabama represents an extreme
While most research on college access focuses on stu-       case of a transformation occurring at many public re-
dent behavior, the transformation of student compo-         search universities across the nation. Public research
sition at the University of Alabama did not result from     universities were founded to provide upward mobil-
sudden, unexpected shifts in student demand. Rather,        ity for high-achieving state residents (Haycock, Mary,
the University developed arguably the most sophisti-        & Engle, 2010) and designated the unique responsi-
cated and extensive approach to student recruiting in       bility of preparing the future professional, business,
public higher education. Utilizing the “data science” ex-   and civic leaders of the state. Quoting 19th century

4   RECRUITING THE OUT-OF-STATE UNIVERSITY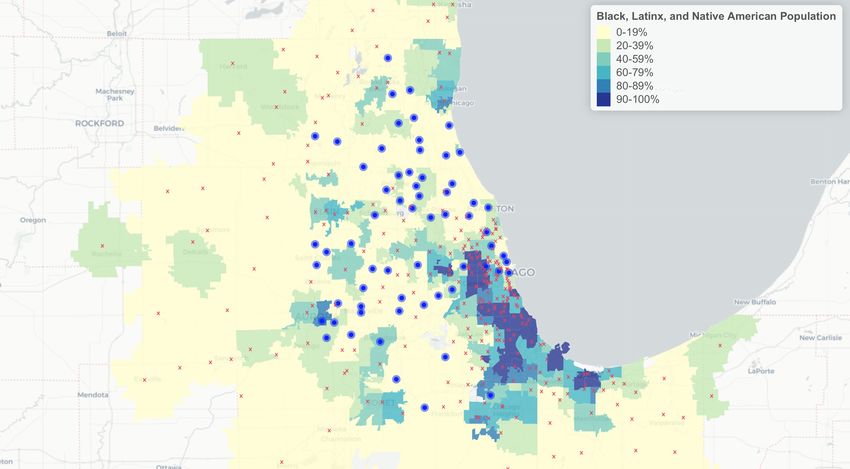
emraresearch.org

University of Michigan President James Angell, these        Jardins, 2001; Leeds & DesJardins, 2015). Meanwhile,
institutions provided “an uncommon education for            many high-achieving, low-income students are fun-
the common man” (as cited in Rudolph, 1962, p. 279)         neled to community colleges (Dillon & Smith, 2017),
who could not afford tuition at elite private institu-       which dramatically lower their probability of obtaining
tions. Unfortunately, public research universities in-      a BA (B. T. Long & Kurlaender, 2009; Mountjoy, 2018).
creasingly enroll an affluent student body that is un-        These trends raise concerns that public research uni-
representative of the socioeconomic and racial diver-       versities have transformed from “engine[s] of social
sity of the states they serve (Huelsman, 2018; Jaque-       mobility” (Gerald & Haycock, 2006, p. 3) to “engines of
tte, 2017; Jaquette, Curs, & Posselt, 2016; Nichols &       inequality.”
Schak, 2019). Many public research universities have
dramatically increased nonresident enrollment (Ja-          Contemporary policy debates about racial and socioe-
quette & Curs, 2015) and adopted financial aid poli-         conomic inequality in college access tend to focus on
cies that specifically target nonresident students with      the “achievement gap” and on “undermatching,” the
modest academic achievement (Burd, 2015, 2018; Des-         idea that high-achieving, low-income students fail to

            FIGURE : UNIVERSITY OF ALABAMA               OFF-CAMPUS RECRUITING CHARACTERISTICS.

                                                                                              INTRODUCTION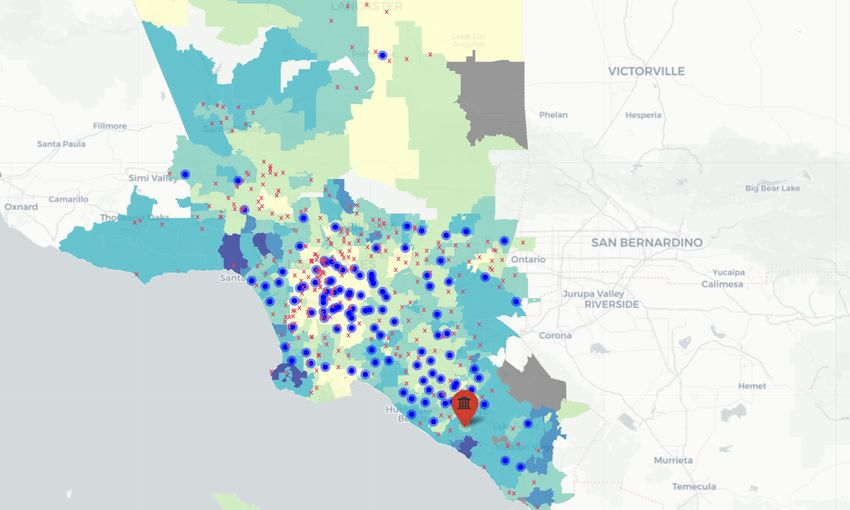
emraresearch.org

apply to good colleges because they have bad guid-          credible indicator of enrollment priorities than univer-
ance at home and at school (The White House, 2014b).        sity rhetoric or policy adoption. In turn, scholarship
These explanations focus on “deficiencies” of stu-           that analyzes recruiting behavior as an indicator of en-
dents and K-12 schools. As such, policy interventions       rollment priorities has important policy implications;
to increase college access mostly focus on student          if university enrollment priorities – the “supply side” of
academic achievement and decision-making (Page &            higher education – are biased against low-income stu-
Scott-Clayton, 2016). Policy debates also highlight af-     dents and communities of color, then policy solutions
fordability as an important barrier to access. In recent    that focus solely on students and K-12 schools – the
decades, particularly following the Great Recession         “demand side” – will fail to overcome access inequality.
of 2008, states disinvested in public universities, and
these state budget cuts have been associated with           Unfortunately, research on recruiting is rare because
steep rises in tuition price.                               data on university recruiting behavior are difficult to
                                                            obtain. This report represents the first systematic,
Within this policy discourse, public research univer-       quantitative analysis of university recruiting behav-
sities position themselves as progressive actors that       ior. Specifically, we investigate off-campus recruiting
remain committed to the access mission despite state        visits by 15 public research universities. We collected
funding cuts and despite the deficiencies of students        data on recruiting visits by “scraping” the “travel sched-
and K-12 schools. Universities point to the adoption        ules” of admissions officers from university admissions
of policies such as holistic admissions, need-based         websites (e.g., webpages advertising admissions repre-
financial aid, and outreach/pipeline programs as ev-         sentatives coming to a “neighborhood near you”) and
idence of their commitment to access (The White             also by issuing public records requests to public uni-
House, 2014a). However, decades of research on orga-        versities. We merged recruiting visit data to secondary
nizational behavior shows that formal policy adoption       data on high schools, community colleges, and com-
(e.g., outreach, financial aid programs) is often a sym-     munities in order to investigate the characteristics of
bolic effort to appease external stakeholders rather         schools and communities that receive visits.
than a substantive effort to solve the problem (Davis,
2005).                                                      This report is organized as follows. First, we provide
                                                            an overview of the “enrollment management” industry
Recent trends in enrollment and funding suggest an          and situate off-campus recruiting within the broader
alternative explanation for growing racial and socioe-      set of recruiting interventions employed by univer-
conomic inequality in access to public research univer-     sities. Next, we describe our research methodology
sities: university enrollment priorities privilege affluent   and present our findings. The majority of public uni-
students and are biased against low-income students         versities in our sample made far more out-of-state
and communities of color. Drawing from scholarship          recruiting visits than in-state visits. We find that uni-
on organizational behavior (e.g., Meyer & Rowan, 1977;      versities with weak state funding (e.g. The University
Thompson, 1967; Weber, Davis, & Lounsbury, 2009), we        of Alabama, University of South Carolina, University
argue that knowing which student populations are ac-        of Pittsburgh, CU Boulder) heavily focus their recruit-
tually targeted by university recruiting efforts is a more   ing efforts in out-of-state schools and communities.

6   RECRUITING THE OUT-OF-STATE UNIVERSITY
emraresearch.org
Out-of-state visits consistently revealed dramatic in-
ENROLLMENT MANAGEMENT
come bias and strong racial bias against schools with
predominantly students of color. For most universi-
ties, in-state recruiting visits revealed significant in- Understanding the relationship between university en-
come bias but not racial bias. However, since most rollment behaviors and access inequality requires a
universities made many more out-of-state visits than basic understanding of the enrollment management
in-state visits, overall recruiting patterns for most uni- industry. Enrollment management (EM) is a profes-
versities revealed bias against state residents, low- sion that integrates techniques from marketing and
income students, and communities of color. A handful economics in order to “influence the characteristics
of universities (e.g., University of Nebraska, North Car- and the size of enrolled student bodies” (Hossler &
olina State University) – notably those with stronger Bean, 1990, p. xiv). EM is also a university administra-
state funding – had better coverage of in-state schools tive structure (e.g., “The Office of Enrollment Manage-
and/or more equitable in-state coverage. ment”) that coordinates the activities of admissions,
financial aid, and marketing and recruiting.
Finally, we discuss implications for policymakers and
university leaders, with the goal of reversing the vi- The broader enrollment management industry con-
cious cycle of states disinvesting in public universities sists of professionals working within universities (e.g.,
and public universities disinvesting in the state. State vice president for enrollment management, admis-
policymakers often rationalize funding cuts to public sions counselors), the associations EM professionals
research universities on the grounds that these or- belong to (e.g., National Association for College Admis-
ganizations can generate their own revenue sources sion Counseling), and the marketing and EM consul-
(Delaney & Doyle, 2011). Policymakers concerned about tancies universities hire (e.g., Hobsons, Ruffalo Noel
access must understand that state funding cuts incen- Levitz).
tivize public research universities to prioritize affluent,
out-of-state students.
The enrollment funnel
Collecting concrete data on university recruiting be-
haviors also has important implications for university Figure 2 depicts the “enrollment funnel,” a conceptual
leaders. University leaders can no longer trumpet a tool the EM industry uses to describe stages in stu-
commitment to access and simultaneously focus re- dent recruitment in order to inform targeted recruit-
cruiting efforts on affluent prospects because we are ing interventions. While scholarship and policy de-
releasing these data to the public. Armed with these bate about college access focuses on the final stages
data, internal and external constituents committed to of the enrollment funnel – when applicants are admit-
access will not be placated by lofty rhetoric and cere- ted (e.g., Alon, 2009) and financial aid “leveraging” is
monial action. Therefore, the time is now for leaders used to convert admits to enrollees (e.g., McPherson &
of public research universities to resurrect the historic Schapiro, 1998) – the EM industry expends substantial
role as the state’s preeminent engine of opportunity resources on earlier stages of the funnel. “Prospects”
and social mobility. are “all the potential students you would want to at-
ENROLLMENT MANAGEMENTemraresearch.org
Alabama, 2019) (2018 CPI).
Universities identify prospects primarily by purchas-
ing “student lists” from College Board and ACT. For ex-
ample, from 2010 to 2018, the University of Alabama
paid $1.9 million to College Board and $349k to ACT,
Inc (University of Alabama, 2019).1 Ruffalo Noel-Levitz
(2017) found that the median public university pur-
chases about 64,000 names. Student lists contain
contact details and background information (demo-
graphic, socioeconomic, and academic) about individ-
ual prospects. Universities control which prospects are
included in the list by selecting on criteria such as zip
code, race, and academic achievement.
Once identified, prospects are plied with recruiting in-
terventions aimed at soliciting inquiries and applica-
tions (Clinedinst & Koranteng, 2017). Non face-to-face
interventions include emails, brochures, and text mes-
sages. Face-to-face interventions include on-campus
visits and off-campus visits. Additionally, universities
utilize paid advertising (e.g., pay-per-click ads from
FIGURE : THE ENROLLMENT FUNNEL. Google, cookie-driven ads targeting prospects who
visit your website) and social media (e.g., Twitter, In-
stagram, YouTube) as a means of generating inquiries
tract to your institution” (Campbell, 2017). “Inquiries” and creating positive “buzz” amongst prospects (Noel-
are prospects that contact the university. These in- Levitz, 2016). Given the rise in “stealth applicants” who
clude inquiries who respond to initial solicitation by do not inquire before applying (Dupaul & Harris, 2012),
the universities (e.g., email, brochure) and unsolicited social media enables universities to tell their story to
inquiries who reach out on their own (e.g., sending prospects who do not want to be contacted.
SAT/ACT scores to the university, completing a form on
the university admissions website). Most universities Given the focus of this report, what is the role of off-
hire EM consulting firms, which utilize sophisticated, campus visits in student recruitment? In the admis-
data-intensive methodologies, to help universities sions world, “travel season” refers to the mad dash
identify prospects, solicit inquiries, convert prospects between Labor Day and Thanksgiving when admis-
and inquiries into applicants, etc. For example, from sions officers host hotel receptions, college fairs, and
2010 to 2018 the University of Alabama paid $4.4 mil- 1 The total for College Board include payments made to “College
lion to the EM consulting firm Hobsons (University of Board“ and “CollegeBoard Search”.
8 RECRUITING THE OUT-OF-STATE UNIVERSITYemraresearch.org
visit high schools across the country (Stevens, 2007). where students applied and where they enrolled. The
Research by both EM consulting firms and by scholars strength of this finding was modest for affluent stu-
describe off-campus recruiting as a means of simul- dents with college-educated parents. These students
taneously identifying prospects and connecting with tended to be more concerned about college prestige
prospects already being targeted through mail/email and less influenced by overtures from colleges. How-
(e.g., Clinedinst & Koranteng, 2017; Ruffalo Noel-Levitz, ever, high school visits strongly influenced decisions
2016; Stevens, 2007). With respect to efficacy, Ruffalo by first-generation students and under-represented
Noel-Levitz (2018) found that off-campus visits were students of color. These students often felt that school
the second highest source of inquiries (after student counselors had low expectations of them, were not
list purchases), accounting for 19.0% of inquiries for supportive of their college aspirations, and were quick
the median public university. Off-campus visits were to suggest they attend a community college (Holland,
also the third highest source of enrollees (after stealth 2019). While Holland (2019) shows that college choice
applicants and on-campus visits), accounting for 16% for underserved student populations often hinges
of enrollees (Ruffalo Noel-Levitz, 2018). on which colleges and universities take the time to
visit, prior research has not systematically investigated
Additionally, research finds that high school visits are which high schools receive visits by which colleges and
instrumental for maintaining warm relationships with universities.
guidance counselors at “feeder schools.” Ruffalo Noel-
Levitz (2018) found that face-to-face meetings were the
most effective means of engaging high school guid-
Enrollment goals and recruiting
ance counselors. Stevens (2007) worked as a regional
admissions recruiter for a selective liberal arts college While the EM industry provides tools for identify-
as part of his broader ethnography on college admis- ing and targeting prospects at each stage of the en-
sions. Relationships with counselors were essential rollment funnel, university enrollment priorities dic-
because “The College’s reputation and the quality of tate which prospects universities actually pursue.
its applicant pool are dependent upon its connections The “iron triangle” of enrollment management states
with high schools nationwide” (Stevens, 2007, p. 53). that universities pursue the broad enrollment goals
The College visited the same schools year after year of academic profile, revenue, and access (Cheslock
because successful recruiting depends on long-term & Kroc, 2012). “Academic profile” refers to enrolling
relationships with high schools. Further, the College high-achieving students – particularly with respect
tended to visit affluent schools, and private schools in to standardized test scores – who help the university
particular, because these schools enroll high-achieving move up the rankings. “Revenue” refers to students
students who can afford tuition and because these who generate high net tuition revenue. For public uni-
schools have the resources and motivation to host a versities, the “access” goal refers to access for state
successful visit (Stevens, 2007). residents, first-generation students, low-income stu-
dents, and students of color from historically under-
Holland (2019) analyzed high school visits from the represented racial/ethnic groups. Because resources
student perspective. High school visits influenced are scarce, the imagery of the iron triangle suggests
ENROLLMENT MANAGEMENTemraresearch.org
that pursuing one goal involves trade-offs with other schools and communities that receive recruiting visits
goals: “most enrollment management policies...do to those that do not can yield insights about univer-
not advance all three objectives; instead they lead to sity enrollment priorities. By contrast, speeches and
gains in some areas and declines in others” (Cheslock policy adoption (e.g., holistic admissions, “outreach”
& Kroc, 2012, p. 221). Enrollment managers view these programs) (The White House, 2014a) show which goals
trade-offs as an inevitable consequence of organiza- are publicly adopted, but do not indicate which goals
tional enrollment priorities, thereby motivating the have been adopted substantively versus symbolically.
question, “what are the enrollment priorities of pub-
lic universities?”
DATA AND METHODS
Drawing from theories of organizational behavior, we
argue that university recruiting behavior is an indicator This report presents descriptive results from a broader
of enrollment priorities. New institutional theory ar- project that collects data on off-campus recruiting by
gues that organizations face pressure to publicly adopt colleges and universities. Many universities adver-
goals demanded from constituencies in the external tise off-campus recruiting events on their admissions
environment (e.g., move up in the rankings, increase websites (e.g. “coming to your area” links). We used
socioeconomic and racial diversity) (DiMaggio & Pow- “web-scraping” to collect data on recruiting events. We
ell, 1983; Meyer & Rowan, 1977). However, organiza- “scraped” webpages containing recruiting event data
tions have scarce resources and cannot easily pur- once per week from 1/1/2017 to 12/31/2017, thereby cap-
sue goals that conflict with one another. Rather than turing recruitment of spring juniors and fall seniors.
publicly rejecting a goal demanded by the external en- Here, we provide a broad overview of our data collec-
vironment, organizations resolve conflicts between tion, data processing, and analysis sample.
stated goals by substantively adopting some goals and
symbolically adopting others. Under substantive adop- The data collection sample for the broader project
tion, organizations allocate substantial resources to- was drawn from the population of public research-
wards achieving the goal. Under symbolic adoption, extensive universities (2000 Carnegie Classifica-
organizations adopt policies and rhetoric that signal tion). Out of all public research-extensive universi-
commitment to the goal, but do not allocate substan- ties (N=102), the project collected data for those that
tial resources to achieving the goal. This perspective posted off-campus recruiting events on their admis-
on organizational priorities is stated succinctly by the sions websites (N=49). We also collected recruiting visit
Joe Biden quote, “don’t tell me what you value. Show data from selective private research universities and
me your budget and I’ll tell you what you value” (Biden, from selective private liberal arts colleges.2 For each
2008). university in the data collection sample, we investi-
gated the entire university website, searching for URLs
Off-campus recruiting visits by university admissions 2 Out of all private universities in the top 100 of U.S. News and
staff represent a substantial allocation of resources World Report National Universities rankings (N=58) and all private
colleges in the top 50 of U.S. News and World Report Liberal Arts
(e.g., staff salary and benefits, travel costs). There-
Colleges rankings (N=47), we collected data on 49 private research
fore, we argue that comparing the characteristics of universities and 42 private liberal arts colleges.
10 RECRUITING THE OUT-OF-STATE UNIVERSITYemraresearch.org
that contain data on off-campus recruiting events. This events targeted at guidance counselors. We also in-
process was conducted independently by two mem- cluded virtual events (e.g., webinar, video call) with a
bers of the research team to avoid missing any rele- target audience at a specific off-campus location (e.g.,
vant URLs. Our programs also scraped data about par- students from a particular high school). However, our
ticipation in national college fairs from the National definition excludes admitted and committed student
Association for College Admission Counseling (NACAC) events. Additionally, we excluded formal one-on-one
website. We also collected data about participation interviews because these events focus on determin-
in “group travel tours” from websites advertising joint ing admissions eligibility of a particular prospect; they
recruiting events by multiple universities (e.g., Peach are not events that focus on soliciting applications
State Tour by Georgia State University, Georgia Tech, from many prospective students. We excluded events
and the University of Georgia). Since URLs contain- hosted by alumni or student volunteers because the-
ing data on off-campus recruiting events often change ories of organizational behavior suggest that the ac-
(e.g., a university creates a new URL or changes the tivities of paid staff are better indicators of organiza-
formatting of an existing URL), we completed this in- tional priorities than activities allocated to volunteers
vestigation process for each university every three (Thompson, 1967).
months and data collection scripts were updated ac-
cordingly.
Analysis sample
Defining off-campus recruiting The analysis sample for this report consists of 15 pub-
lic research universities. These cases were selected
We categorized off-campus recruiting events based on from the larger project sample and selected based
event type, host, and location. Event type includes col- on “completeness” of recruiting event data posted
lege fairs (in which multiple colleges attend), day-time on admissions websites. Based on prior market and
high school visits, group travel visits, formal admis- scholarly research (e.g., Holland, 2019; Ruffalo Noel-
sions interviews, admitted student events, and com- Levitz, 2017, 2018; Stevens, 2007) and conversations
mitted student events. Event hosts include paid staff, with admissions professionals, nearly all colleges and
paid consultants (e.g., a regional recruiter contracted universities convene three broad types of off-campus
by the university), alumni, and current students. Event recruiting events: (1) receptions/college fairs at hotels
locations include high schools, community colleges, and convention centers; (2) evening college fairs at lo-
hotels, conference/convention centers, and other pub- cal high schools; and (3) day-time visits at local high
lic places (e.g., cafes). schools. However, some institutions we collected data
from did not post all three types of recruiting events.
For the purpose of our research, we define off-campus Of the 49 public research universities we collected
recruiting events as those that focused on soliciting data on, these 15 universities posted all three broad
undergraduate admissions applications and were types of off-campus recruiting events on their website.
hosted by paid personnel or consultants at any off-
campus location. This definition includes off-campus Table 1 shows how the median university in our sam-
DATA AND METHODSemraresearch.org
ple compares to the median university in the pop- Geocoding scripts take location information, query the
ulation of public “Doctoral/Research Universities- Google Maps Application Program Interface (API), and
Extensive,” as defined by the 2015 Carnegie Classifica- return more detailed geographic information for each
tion. Overall, our analysis sample appears fairly similar event (e.g., latitude and longitude coordinates, county,
to the population. However, our sample institutions city, state, full street address, zip code).
are slightly larger in size and have a higher tuition and
state revenue. We conducted two additional data quality checks.
First, we manually checked each scraped recruiting
event, ensuring that event “type” (e.g., public high
Data processing and data quality school visit) was correctly categorized and that each
event was merged to the correct secondary data
We took a multi-step approach to processing informa- source (e.g., the correct NCES school ID).
tion scraped from admissions webpages. First, auto-
mated Python scripts scrape all text from admissions Second, we checked the completeness of web-scraped
webpages, storing the information as HTML text in a data by issuing public records requests to universi-
Structured Query Language (SQL) database on a re- ties for their list of off-campus recruiting events and
mote server. Separate scripts parse the HTML text into then comparing the two data sources. But before we
tabular data (e.g., columns for event date, event time, issued the request, we sent a courtesy email to the en-
school name, address). Third, we “geocode” recruiting rollment management VP of each university to see if
events, converting limited location information (e.g., they would be willing to provide us with this data di-
school name, city, state) into geographic coordinates. rectly. The University of Georgia was the only univer-
Sample (N=15) Population (N=80)
Academic Profile
US News & World Report Ranking 92 94
25th Percentile SAT/ACT Composite Score 1,126 1,085
75th Percentile SAT/ACT Composite Score 1,334 1,300
Enrollment
Total Enrolled Freshmen 5,433 4,957
Percent Out-of-State Freshmen 26.9% 25.4%
Percent Pell Recipients 20.3% 24.0%
Tuition and Fees
In-State Tuition + Fees $11,706 $11,026
Out-of-State Tuition + Fees $30,414 $29,441
Revenues
Total Net Tuition Revenue $463,142,400 $379,065,984
Percent of Total Revenue from Tuition 25.5% 26.3%
Total State Appropriations $286,740,832 $267,926,000
Appropriation per Student $9,548 $7,903
Percent of Total Revenue from State Appropriations 19.5% 16.7%
Total State Revenue $295,350,848 $290,634,448
Revenue per Student $11,347 $8,970
Percent of Total Revenue from State (All Sources) 21.1% 19.4%
TABLE : MEDIAN 6- CHARACTERISTICS OF STUDY SAMPLE COMPARED TO POPULATION OF PUBLIC RE-
SEARCH UNIVERSITIES CATEGORIZED AS HIGHEST RESEARCH ACTIVITY BY CARNEGIE CLASSIFICATION.
12 RECRUITING THE OUT-OF-STATE UNIVERSITYemraresearch.org
sity that sent us the data directly, and we issued the campus recruiting data from more than one source
public records request for all remaining 14 universi- to validate completeness, our data may not capture
ties. Our request was denied by the University of Al- all off-campus recruiting events by each university.
abama and University of Arkansas because statutes Third, prior research suggests that the capacity of a
in these states only permit public records requests high school to host an event (e.g., having high school
from state residents. The University of Pittsburgh also guidance counselors focused on college access) af-
cited that state-related universities are exempt from fects which universities visit it (Stevens, 2007). Unfor-
Pennsylvania’s Right-to-Know Law, and the University tunately, the National Center for Education Statistics
of Nebraska claimed they do not have the records we collects high school finance data and personnel data
requested and are not required by law to produce on guidance counselors at the district-level rather than
them. Of the remaining 10 universities, we have re- the school-level. Therefore, our analyses do not ac-
ceived data from eight at the time of this report. How- count for differences in high school-level capacity to
ever, public records data we received from North Car- host recruiting visits. Fourth, for events hosted at com-
olina State University cannot be used because these munity colleges, we cannot infer whether the event
data did not contain event date. For the seven univer- targets all prospective students in the local community
sities that sent us complete data – as well as for the or whether the event specifically targets prospective
University of Georgia – the analyses below use the transfer students enrolled at that community college.
“requested data” we received rather than “scraped
data.” Requested data was also manually checked to
ensure that event type was correctly categorized and STATE AND INSTITUTIONAL CONTEXT
that each event was merged to the correct secondary
data source. A summary of the data collection sources
and quality checks performed is provided in Appendix Before presenting results on university recruiting be-
Table A1. Broad patterns were similar across requested havior, we provide a brief overview of state and insti-
data compared to scraped data, and results based on tutional contexts across universities. Revenue sources
scraped data are available upon request. Detailed in- for public universities have shifted in recent decades.
formation about our data methodology is available at Figure A2 in the Appendix shows change over time
emraresearch.org/methodology. in state appropriations and tuition revenue for all 15
universities from 2003-04 through 2016-17. Many uni-
versities experienced declines in state appropriations
Limitations and growth in tuition revenue. However, generosity of
state appropriations differs substantially across uni-
Our data collection has several limitations. First, off- versities. For example, Figure 3 shows that state ap-
campus visits encompasses only one university re- propriations per full time equivalent (FTE) student de-
cruiting effort. Universities may also be recruiting clined from $25,000 in 2003-04 to $21,000 in 2016-17 for
students via other interventions (e.g., direct mail- SUNY-Stony Brook. Figure 4 shows the University of
ings, emails, specific outreach programs). Second, Pittsburgh experienced smaller declines in state ap-
despite our best efforts to collect and triangulate off- propriations than Stony Brook during this same time;
DATA AND METHODSemraresearch.org
Stony Brook University University of Pittsburgh
State Revenue per FTE Student State Revenue per FTE Student
Tuition Revenue per FTE Student Tuition Revenue per FTE Student
$17k
$25k
$21k $12k
$8k
$11k
$6k
$6k
2003-04 2009-10 2014-15 2003-04 2009-10 2014-15
FIGURE : STONY BROOK REVENUES PER FTE STU- FIGURE : UNIVERSITY OF PITTSBURGH REVENUES
DENT, - THROUGH 6- . PER FTE STUDENT, - THROUGH 6- .
however, the University of Pittsburgh only received revenue (Y Axis) per full-time equivalent student. Four
$6,000 per student FTE in 2016-17. universities receive more revenue from state appropri-
ations than tuition (Stony Brook, North Carolina State
Figure 5 plots all universities according to their 2016-17 University, Nebraska, Arkansas). Three universities re-
revenue from state appropriations (X Axis) and tuition ceive about equal revenue from state appropriations
and tuition (Kansas, Georgia, UMass Amherst). The re-
maining seven universities receive more revenue from
$22k tuition than state appropriations per FTE student. Of
these, CU Boulder, the University of Pittsburgh, Univer-
UC Berkeley
CU Boulder
$20k
$18k
sity of South Carolina, University of Alabama, and Uni-
versity of Cincinnati are particularly reliant on tuition
U of Pitt
Tuition Revenue per FTE Student
$16k UC Irvine
U of Alabama UMass Amherst
revenue in that they receive very low state appropria-
$14k
tions per FTE student.
U of S.Carolina
U of Georgia
$12k U of Cincinnati U of Kansas
SUNY Stony Brook
UNL
Appendix Figure A3 shows the percent of freshmen
$10k NCSU
U of Arkansas
who are nonresident and the percent of freshmen
$8k
who are federal grant recipients for all 15 universities
$6k
from 2003-04 to 2016-17.3 Many universities experi-
$4k
$2k
enced significant nonresident enrollment growth, con-
$0k
$0k $2k $4k $6k $8k $10k $12k $14k $16k $18k $20k $22k
State Revenue per FTE Student 3 Appendix Figure A3 uses the percent of full-time freshmen that
receive federal grants rather than the percent of full-time freshmen
FIGURE : STATE AND TUITION REVENUE PER FTE that receive Pell grants because data on freshman Pell recipients is
not available for years prior to 2007-08. However, the measures of
STUDENT FOR SAMPLE INSTITUTIONS IN 6- . federal grant recipients and Pell grant recipients are extremely close.
14 RECRUITING THE OUT-OF-STATE UNIVERSITYemraresearch.org
University of Pittsburgh growth in the share of nonresident students is asso-
ciated with declines in the share of federal grant aid
Out-of-State Freshmen
Freshmen Federal Grant Recipient
30.6% recipients. This relationship can be seen in Figure 6 for
the University of Pittsburgh, where the the percent of
28.7%
full-time freshmen receiving federal grants decreased
20.3%
from 29% in 2003-04 to 20% in 2016-17.
14.2%
The racial composition of state populations and fresh-
man enrollments have also shifted over time for many
2003-04 2009-10 2014-15
universities. Appendix Figure A4 shows change over
time in the percent of freshmen at each university who
FIGURE 6: UNIVERSITY OF PITTSBURGH PERCENT identify as Black and the percent of 18 year-olds in the
OUT-OF-STATE FRESHMEN AND FEDERAL GRANT RE- state who identify as Black. Appendix Figure A5 shows
CIPIENT, - THROUGH 6- the same trends for people who identify as Latinx.4
Most universities experienced modest (or no change)
in the proportion of Black freshman-aged students in
sistent with research showing that public universities their state, but nearly all experienced relatively larger
respond to state disinvestment by pursuing nonresi- increases in the proportion of Latinx freshman-aged
dent students who pay higher tuition (Jaquette & Curs, students. While changes in the proportion of Black
2015). For example, Figure 6 shows that the percent and Latinx freshman enrollments have trended similar
of nonresident freshmen at the University of Pitts- to state populations for most universities, no univer-
burgh increased from 14% in 2003-04 to 31% in 2016- sity matched the proportion of Black and Latinx fresh-
17. Some universities experienced similar increases man enrollments to the proportion of Black and Latinx
in the percent of nonresident freshman enrollment freshman-age populations in their state.
(Stony Brook, Alabama, Nebraska, South Carolina, UC
Berkeley, UC Irvine, Kansas, Arkansas), whereas other
universities had more moderate increases in enroll- RESULTS
ment from nonresident freshman students (Rutgers,
Cincinnati, Georgia, North Carolina State University, CU For full interactive results that accompany this report,
Boulder, UMass Amherst). please see ozanj.github.io/joyce_report.
Nationally, enrollment of Pell recipients increased sub- Table 2 presents the total number of off-campus re-
stantially in 2008-09 following the expansion of Pell cruiting visits by visit “type” and by in-state or out-of-
Grant funding by the Obama administration. Since state location for each university. Nearly all univer-
2010-11, however, the percent of full-time freshmen re- sities made more out-of-state recruiting visits than
ceiving federal grant aid – a strong proxy for Pell recip-
4 We use Latinx as a gender-inclusive alternative to Latino or
ients – declined at several universities in our sample,
Latina. We also use Latinx in place of Hispanic within secondary data
as shown in Figure A3. Jaquette et al. (2016) show that sources.
RESULTSemraresearch.org
Total Events Out-of-State In-State
Total Pub HS Priv HS Other Total Pub HS Priv HS CC Other
NC State 371 124 72 20 32 247 157 3 55 32
Rutgers 1,629 954 560 231 163 675 477 72 89 37
Stony Brook 1,101 664 496 105 63 437 326 41 33 37
Alabama 4,349 3,957 2,312 934 711 392 157 54 124 57
Arkansas 1,013 788 483 204 101 225 162 21 16 26
UC Berkeley 906 420 188 134 98 486 269 35 121 61
UC Irvine 939 172 77 40 55 767 330 20 322 95
Cincinnati 1,369 815 491 204 120 554 408 79 22 45
CU Boulder 1,568 1,102 607 362 133 466 256 17 154 39
Georgia 885 587 287 233 67 298 203 69 1 25
Kansas 1,419 1,004 613 213 178 415 304 22 28 61
UMass 1,137 784 504 230 50 353 238 62 36 17
Nebraska 1,421 874 645 104 125 547 446 55 20 26
Pittsburgh 1,233 906 559 210 137 327 211 51 37 28
S.Carolina 1,495 1,245 676 328 241 250 197 22 2 29
TABLE : NUMBER OF OFF-CAMPUS RECRUITING EVENTS BY TYPE AND IN-STATE, OUT-OF-STATE.
in-state recruiting visits. The majority of out-of-state
Out-of-state Recruiting
visits are made to public high schools and private
schools. While in-state visits also include a large pro-
portion of visits to public high schools, many universi-
ties also make a substantial number of in-state visits Table 2 shows that most cases in the study made more
to community colleges. out-of-state recruiting visits than visits within their
respective states. Alabama showcased the upper ex-
We organize results around these initial findings. First, treme of this trend with 3,957 out-of-state visits, which
out-of-state analyses focus on the characteristics of made up more than 90% of total recruiting visits by
public and private high schools because these events the university. While other universities made a rela-
comprise the vast majority of out-of-state recruiting tively modest number of out-of-state visits in com-
visits. Because public universities hold unique respon- parison to Alabama, these visits still made up large
sibilities to serving state residents and providing path- proportions of total visits by each university: Rutgers
ways for community college transfer students, we then (59%), Stony Brook (60%), Arkansas (78%), Cincinnati
assess each university’s “coverage” of visiting in-state (60%), CU Boulder (70%), Georgia (66%), Kansas (71%),
public high schools and in-state community colleges. UMass Amherst (69%), Nebraska (62%), Pittsburgh
Given our interest in using recruiting data to under- (73%), South Carolina (83%). However, three univer-
stand university enrollment priorities with respect to sities made less out-of-state visits than in-state visits.
the iron triangle of enrollment management, our anal- UC Berkeley’s 420 out-of-state visits made up less than
yses focus on the income, race, and achievement char- half of all recruiting visits (46%). NC State’s 124 out-of-
acteristics of schools and communities that receive state visits made up only 33% of total recruiting visits.
visits. Lastly, UC Irvine’s 172 visits out-of-state visits made up
only 18% of total recruiting visits.
16 RECRUITING THE OUT-OF-STATE UNIVERSITYemraresearch.org
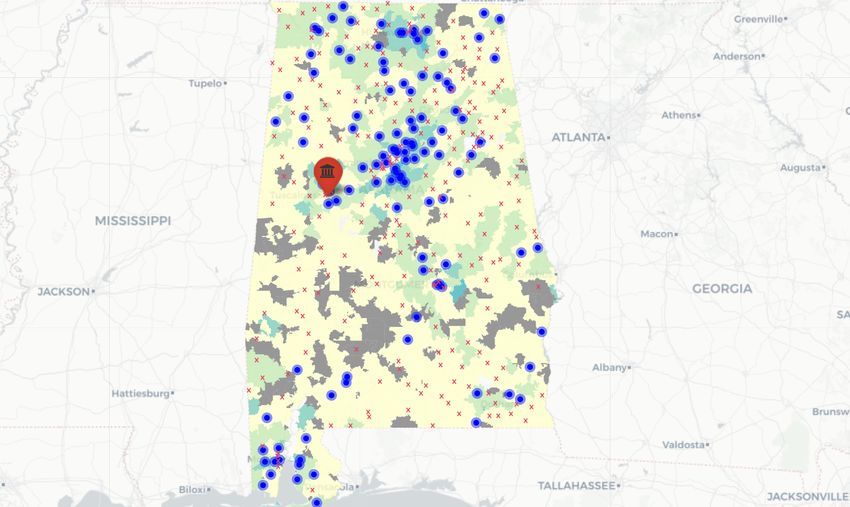
Figure 7 shows small-multiple maps of recruiting pat- For each university, the total number of out-of-state
terns for each university. Out-of-state recruiting visits high schools in Table 3 includes all high schools in
focus on populous metropolitan areas, ignoring rural states that received at least one visit to a public or pri-
communities entirely. However, the geographic focus vate high school from that university. Our rationale for
of these visits differed across universities. this decision is that it is unhelpful to compare visited
out-of-state schools to non-visited schools in states
The University of Alabama and CU Boulder imple- that the university ignored entirely. Thus, total number
mented a truly “national approach” to out-of-state re- of out-of-state high schools differs across universities
cruiting, visiting every major metropolitan area in the depending on the number of states the university vis-
country. The University of Alabama is unique in that ited. For example, the University of South Carolina vis-
it also made a substantive number of visits to smaller ited high schools in 25 different states. All 12,086 public
metropolitan areas across the country (e.g., Spokane high schools in those states are included in the out-of-
Washington). Most universities (e.g., Rutgers, Kansas, state public high school sample for South Carolina. An
Georgia, Cincinnati) followed a “regional and targeted indicator is used to identify whether each school re-
national” approach, meaning that they visited major ceived at least one visit by South Carolina (576 visited
metropolitan areas in nearby states as well as specific and 11,510 non-visited).
metropolitan areas in far-away states (e.g., visits to Los
Angeles by the University of Georgia). Four universities Income. Table 3 shows that out-of-state public high
followed a “regional approach” (Stony Brook, Arkansas, schools that received a visit were in zip codes with
Nebraska, and NC State), meaning that they focused much higher median household incomes, on average,
visits in-state and in nearby major metropolitan areas. than schools that did not receive a visit.6 For exam-
With respect to specific metropolitan areas visited, all ple, CU Boulder visited out-of-state public high schools
universities visited Chicago. The majority of universi- in zip codes where the average median household in-
ties also visited New York, Los Angeles, Dallas, Hous- come was $115,000, whereas schools that did not re-
ton, Atlanta, Washington D.C., San Francisco, Boston, ceive a visit were located in areas with an average me-
and Denver. dian household income of $63,000. This income dis-
parity between visited and not visited schools ranged
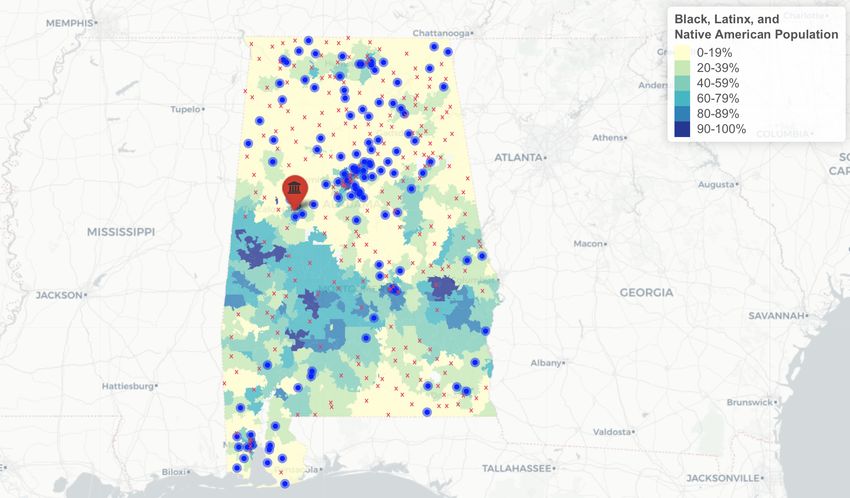
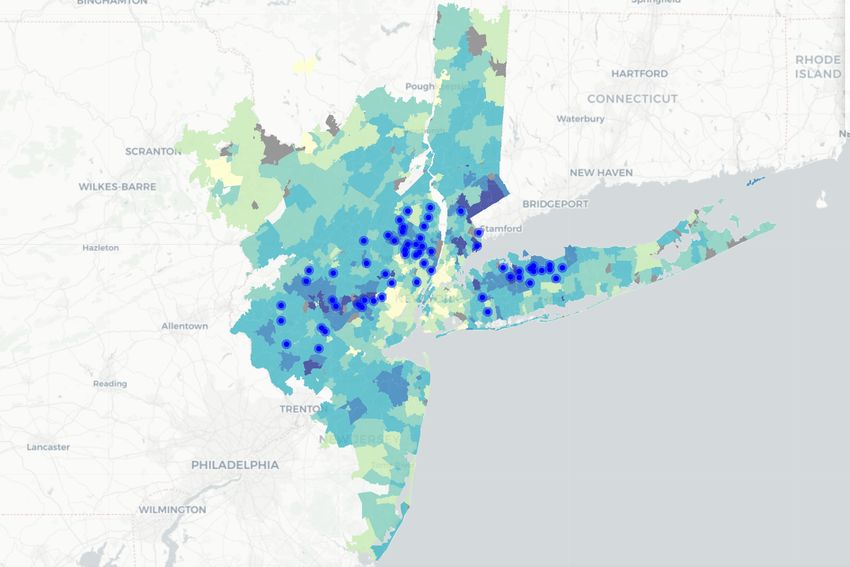
Public high school visits. The majority of out-of-state from a low of $24,000 for University of Nebraska to a
visits were visits to public high schools. Table 3 shows high of $54,000 for NC State.
the characteristics of out-of-state public high schools
that received and did not receive a visit by each univer- To show this income disparity at the local level, Fig-
sity.5 ure 8 maps visits to public high schools in the New
5 Schools that satisfied the following criteria were included in the 6 Zip code-level income data for homeowners between 25-64
sample: offers grades 9-12 and enrolls at least ten students in each years old is used. This was calculated by taking the average of the
grade; located in the 50 U.S. states, the District of Columbia, or land median income for age group 25-44 and age group 45-64 years olds,
regulated by the Bureau of Indian Affairs; is not a special education as reported in the 2016 American Community Survey (ACS) 5-year
school, alternative school, virtual school, or independent school; is estimates. However, disaggregated income data is not available for
an open status school and reports enrollment to the Federal Depart- all zip codes, so zip codes with missing data do not appear in our
ment of Education. results.
RESULTSemraresearch.org
FIGURE : MAP OF VISITS.
North Carolina State University at Raleigh Rutgers University-New Brunswick Stony Brook University
Public HS Private HS Community College Other Public HS Private HS Community College Other Public HS Private HS Community College Other
University of Alabama University of Arkansas University of California-Berkeley
Public HS Private HS Community College Other Public HS Private HS Community College Other Public HS Private HS Community College Other
University of California-Irvine University of Cincinnati University of Colorado-Boulder
Public HS Private HS Community College Other Public HS Private HS Community College Other Public HS Private HS Community College Other
University of Georgia University of Kansas University of Massachusetts-Amherst
Public HS Private HS Community College Other Public HS Private HS Community College Other Public HS Private HS Community College Other
University of Nebraska-Lincoln University of Pittsburgh University of South Carolina-Columbia
Public HS Private HS Community College Other Public HS Private HS Community College Other Public HS Private HS Community College Other
18 RECRUITING THE OUT-OF-STATE UNIVERSITYYou can also read