Living Under The Health Protection Umbrella - Should We Be Worried? - University of ...
←
→
Page content transcription
If your browser does not render page correctly, please read the page content below

Living Under The Health Protection Umbrella –
          Should We Be Worried?

                                                1
Authors
Kailash Bahirathan, Angela Bauman, Chok Chan, Dahi Choi, Brytt Frunt (Group
Leader), Namratha Giridharan, Emma Gray, Maira Haimona, Libby Kofoed, Rex
     Liao, Maggie Lin, Sean McPetrie, Nick Parish (Group Leader), Bianca
                Prendergast, Abhinav Swarup, Andy Yeomans

                                 Supervisors
            Michael Baker, Philippa Howden-Chapman, Simon Hales

                            Acknowledgements
   The authors of this report would like to acknowledge the contributions and
          support provided from the following individuals and groups:
Key informants, Dalice Sim, Kerry Hurley, all participants and University of Otago
                                       Staff

                           Competing Interests
                    The authors have no competing interests

                                                                                 2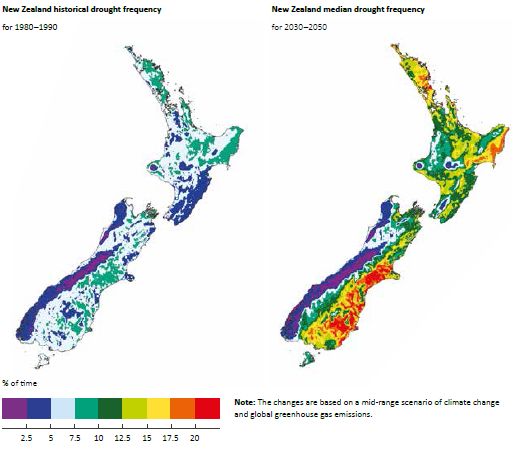
Table of Contents

Title ............................................................................................................................. 1
Acknowledgements ..................................................................................................... 2
Table of Contents ....................................................................................................... 3
Abstract ....................................................................................................................... 4
Introduction ................................................................................................................. 5
Aims and Objectives ................................................................................................... 6
Literature ..................................................................................................................... 6
Methods .................................................................................................................... 18
Results – Quantitative Analysis ................................................................................ 22
Results – Qualitative Analysis .................................................................................. 61
Discussion ................................................................................................................ 71
Strengths .................................................................................................................. 76
Limitations ................................................................................................................. 77
Conclusions .............................................................................................................. 78
Recommendations .................................................................................................... 80
Recommendations for Future Study ......................................................................... 82
References ............................................................................................................... 83
Appendix 1 – General Public Means ........................................................................ 88
Appendix 2 – Key Informant Means .......................................................................... 88
Appendix 3 – Confidence Intervals (General Public) ................................................ 89
Appendix 4 – Confidence Intervals (Key Informants) ............................................... 89
Appendix 5 – P-Values ............................................................................................. 90
Appendix 6 – Rationale for Choice of Hazards ......................................................... 90

NB: Appendices 7 & 8 (Quantitative and Qualitative Surveys) attached separately.

                                                                                                                                        3
Abstract

Background
There is a discrepancy between the scientific evidence and the public perception of hazards,
their risks and the appropriate management. Public opinion plays a vital role in impacting
decisions around how we as a society allocate resources to deal with these hazards. The
national hazardscape published in 2007 by the Ministry of Civil Defence & Emergency
Management summarised the evidence surrounding the risks and consequences of 17 key
hazards. The objectives of this study were to assess whether public opinion differs from the
scientific evidence and whether as a society we are focusing on investing resources into the
hazards that pose the greatest actual threat.

Methods
This was an observational cross-sectional study undertaken from 3rd – 11th October 2017.
Quantitative information was gathered from 155 members of the public via a public specific
online survey and face-to-face recruitment within Wellington City. Quantitative information was
gathered from 7 key informants via a key informant specific online survey. Qualitative
information was gathered from 6 key informants via a semi-structured phone interview. These
surveys and interviews were used to people’s views on the likelihood of exposure, severity of
consequences, personal locus of control, Government locus of control and level of worry
regarding 10 major hazards. Various demographic data was also collected.

Results
We had a total of 155 respondents to the general public survey, 7 respondents to the key
informant survey and 6 key informant interviews. There were statistically significant differences
found in general public perception of likelihood of exposure, severity of conseuquences,
personal locus of control and level of worry for a range of different hazards. There were no
statistically significant differences for perception of level of government control between the
general public and key informants for each of the hazards. A common theme that emerged from
the key informant interviews was that none of the key informants believed that the general
public had a realistic understanding of the human health hazards.

Conclusion
The degree of difference in perception between the public and key informants were not as great
as anticipated. Our expectation was that there would be less concordance in the perception of
likelihood of exposure, severity of consequences, personal locus of control, government control,
and the level of worry over a range of hazards between the general public and the key
informants. This study highlighted the mismatch between what the actual burden of various
hazards is compared to the public perception. Analysis of surveys and key informant interviews
produced various themes which warrant further detailed research. Additionally, the vast nature
of the topic endears itself to a huge range of areas which could be further looked into.

                                                                                               4
Introduction
An overarching challenge that emerges ubiquitously in all societies is how to identify and best
manage hazards that pose a threat to the safety and wellbeing of their members. Societies are
tasked with the challenge of determining which hazards pose a level of unacceptable risk and
how best to allocate resources to mitigate this. Ideally the level of resources allocated would
mirror what the best evidence shows, however in reality there are other influences at play
including, but not limited to: political will, public perception of risk, shared values and beliefs of
society and the interests of key stakeholders.
The concept of how society protects its members from harm is often described as ‘health
protection’. Health protection is defined as “the avoidance or reduction of potential harm from
exposures through organised efforts, including direct action with individuals or communities,
regulation, legislation, or other measures”.1
A large component of health protection is risk management which can be defined as “the steps
taken to alter (i.e. reduce) the levels of risk to which an individual or population is subject. The
managerial, decision making, and active hazard control process to deal with the environmental
agents of disease, such as toxic substances, for which risk evaluation has indicated an
unacceptably high level of risk”.2
One way to systematically assess which hazards pose the greatest risk to a society is through a
hazardscape assessment. The hazardscape is defined as “the net result of both natural and
human-made (anthropogenic) hazards and the cumulative risks that they pose across a given
geographical area. This includes the interactions among nature, society, and technology at a
variety of spatial scales, creating a mosaic of risks that affect places and the people who live
there”.3
In September 2007, the NZ Government through the Ministry of Civil Defence & Emergency
Management (MCDEM) published its first ever National Hazardscape Report. The purpose of
this report was to provide a “summary of the physical nature, distribution, frequency of
occurrence and impacts and consequences of 17 key hazards affecting New Zealand”.4 This
data was intended to be used to influence policy makers, hazard managers and citizens in
management of the various risks posed by such hazards in NZ.
This project is aimed at identifying strengths and inconsistencies between the perceived
hazardscape and the science and institutional hazardscape. To elaborate, the perceived
hazardscape is what people perceive to be the major hazards that pose the greatest risk to
society, whereas the science and institutional hazardscape examine the evidence surrounding
these hazards as well as Governmental responsibility of management of them. Our aim is to
examine the gaps between these groups to identify areas where there is potential for further
development in regards to classification, prioritisation and management of the major hazards
faced by everyday New Zealanders.
5Aims and Objectives
The public sector in New Zealand is tasked with allocating its limited resources in a way that
best protects the public from current and emerging hazards to health and wellbeing. However,
the distribution of resources does not always accurately correlate to the level of risks these
hazards pose. Other influences such as public perception can also alter how resources are
distributed. Hence, the goal of our project is to identify opportunities for improving the way in
which we manage and prioritise these hazards.
The aims of our project are:
To summarise the current science and evidence to form a consensus about which hazards are
most important for active management
To describe how health hazards are perceived by the public in terms of their importance and
modifiability (the perceived/popular hazardscape)
To identify strengths, gaps and inconsistencies in the management of human health hazards
and potential improvements in the way these hazards are identified, assessed and managed in
a modern, high income society like NZ.
Literature Review
Relevance of Risk Perception
Previous research has shown that perception of hazards does not necessarily match likelihood
of occurrence, consequences of its impact or ability to mitigate the risks involved.5,6 This
disparity between perceived risk and actual risks may seem inconsequential, but a multitude of
case studies and expert analyses suggest that public opinions and perception play a vital role in
the impacts and management of risk.5,7
Individuals are less likely to prepare for risks and more likely to experience harm if they believe
that their personal risk is low. An example of this is the Canterbury earthquakes of 2011, where
much of the general public did not acknowledge or understand their own risk. This resulted in
catastrophic damage to infrastructure and (potentially preventable) loss of life.8
Another factor that influences an individual’s likeliness to prepare for a certain risk is their locus
of control.5,6 Feeling a lack of control materialises in an emotional response to preparedness
rather than a practical one, resulting in individuals preferring to ignore the possibility of harm
and not adequately prepare themselves.
Public perception of risks is influenced by a large variety of personal and environmental factors
including personal experience of similar events, media coverage, government and political
actions and communication from the scientific community.6 Comprehensive and accurate
communication to the public is key in shaping perception of personal risk and this is vital to the
success of any widespread community risk reduction strategies.7,9 In addition to practical
motives, many would also believe that the public have the right to know their likelihood of being
6affected by a variety of natural and manmade hazards if that information is available. Biased
and untrue information about risks in the media or from government could be considered
unethical, as this type of reporting affects risk perception, preparation and therefore, morbidity
and mortality.
Risk and Management of Ten Major Hazards
Housing
Lead-based paint
Definition: Chipped and peeling lead paint in residential homes is the leading cause of lead
poisoning for children in large urban areas.10 In New Zealand, lead poisoning is notifiable to the
Medical Officer of Health if blood levels reach ≥0.48 µmol/L from non-occupational lead
exposure.11
Physical Risk: International experts report that for children there is no safe level of lead in the
blood therefore, it is difficult to quantify the magnitude of the problem in New Zealand today.10
High levels of exposure causing acute illness are detected through disease notifications, but low
levels may go undetected and are associated with a range of behavioural and mental health
problems, low IQ levels, cardiovascular complications and immunological changes.12 Evidence
specific to New Zealand shows that the problem of lead-based paint is likely to be having a very
real effect on the wellbeing of individuals and society as a whole, with childhood exposure to
lead-based paint associated with 93% of the variation in our crime rates.13
Management: This issue is managed by a range of authorities in New Zealand.14 The Ministry of
Health manages the public health aspects of lead poisoning, including disease notification and
public health measure. The Department of Labour regulates occupational exposure to lead and
enforces use of protective equipment and testing in properties built before 1980. The Ministry of
Consumer Affairs and the New Zealand Food Safety Authority are involved in restricting lead
levels on imported foods and children’s toys.14 Experts believe, however, that New Zealand
should be doing more to understand the breadth of the problem in our country, including
inspections of our rental housing stock.15
Damp housing
Definition: When discussing damp homes, many experts refer to quality measurement tools
such as the Healthy Home Index and the Respiratory Hazard Index.16,17 These measures
quantify several features in the home such as insulation, heating, ventilation and draft
stopping.18 Each of these aspects contributes to the dampness of a home and mould growth,
which are associated with a range of respiratory complications.
Physical Risk: Damp housing affects people of all ages, mostly through respiratory disease,
which has a dose-response relationship with poor housing quality.19 There are also correlations
with mental health issues and child development. It is estimated that damp housing is
7responsible for a large part of New Zealand’s burden of child illness, including a large proportion
of child hospitalisations, mostly for asthma.20 According to recent literature, children admitted to
hospital with a condition associated with damp housing have higher mortality rates. They also
have an 85% chance of being readmitted to hospital when compared to 56% for children
admitted for other reasons.21 The magnitude of this problem in New Zealand is severe, with
50% of our houses inadequately insulated, 50% without mechanical ventilation in bathrooms
and kitchens, 5% using no form of heating in the winter and nearly half of houses containing
visible mould.22
Management: Recent legislation has reflected the need for improved housing quality in New
Zealand, including the ‘Warm up New Zealand’ insulation program and changes to the minimum
standards of rental housing.23 In addition, public health campaigns and media coverage has
widely publicised the issue of damp housing with the aim of increasing public awareness and
personal action to improve the ventilation and heating of homes. Regardless of these efforts, the
majority of experts believe that the New Zealand Government should be managing this issue
more aggressively, for example introducing housing quality assessments and social welfare
measure to alleviate poverty.17,19,24,25
Methamphetamine contamination
Definition: Methamphetamine contamination is defined in New Zealand as surface levels of
0.5µg/100cm2 in a residential household that has been used for manufacture, or 1.5µg/100cm2
in a home where methamphetamine has been used. This is a somewhat arbitrary measure, and
the estimated minimum level that has the potential to cause harm is 12µg/100cm2.26
Contamination can be caused by manufacture of methamphetamine in a clandestine lab, or
lower levels can be attributed to smoke from methamphetamine use. It is impossible to tell the
difference from surface readings alone.27
Physical Risk: There is no evidence that contamination from houses where methamphetamine
has only been used causes health problems.26 In contrast, there is good evidence that
contamination from a home that was previously used as a lab causes health problems,
particularly in children.28 Much of this harm is due to the exposure to a variety of toxic
ingredients used in the manufacturing process, but also includes some harm from the
methamphetamine itself. In the long term, these harms primarily involve neurological disorder
(including mental illness, developmental delay and behavioural problems) and respiratory
illness.28–30 Suggestions that exposure may increase likelihood of future drug addiction are not
well supported. Methamphetamine residues may remain at high levels on surfaces for at least
several months after manufacture has ceased.28
Management: Housing New Zealand has taken a strong stance against methamphetamine
contamination in the social housing pool, with an estimated 500 houses undergoing
decontamination measures.31 In the private residential market, homeowners are guided by
Standards New Zealand on appropriate measurements and action.32 Contamination levels are
reviewed and updated regularly under the guidance of the Ministry of Health and the Institute of
8Environmental Science and Research.26 Decontamination is usually conducted by private
companies, and has developed into its own industry in recent years.
Infectious Diseases
Seasonal Influenza
Definition: Influenza is a contagious viral infection of the respiratory tract. It can be a mild or
severe infection, with hospitalisation and death possible in severe infections.33 Influenza
infection occurs throughout each year, but the rates of infection increase significantly in the
winter months, hence the term “seasonal influenza”.
Physical Risk: The seasonal influenza virus is a large cause of morbidity and mortality each
year in New Zealand, but the mortality of influenza has commonly been under-estimated. A
study in 2014 has found that the average yearly mortality rate of influenza from 1990 to 2008
was 17 times larger than the reported value. This equates to an average mortality rate of 401
deaths per year however, this value varies significantly each year with the highest on record
being 897 deaths in 2003 and the lowest being 31 deaths in 1991.34
Management: Seasonal influenza is being managed by the Ministry of Health in many different
ways. Firstly, a vaccine is offered which is free to high risk populations. This includes pregnant
women, people over the age of 65, people from the age of 6 months to 18 who lived in some of
the areas recently exposed to earthquakes (e.g. Seddon), people with co-morbidities and health
care workers who have occupational exposure.35 The rate of coverage of health care workers
was 65 percent in 2016 which is an increase from 45 percent in 2010. This is far higher than the
coverage of the general public, which was 24 percent in 2010, although fortunately the coverage
of people over the age of 65 was higher at 63 percent.36
When a patient has got influenza, the ministry of health has subsidised various anti-viral
medications however, these are usually only given in patients who have signs of severe illness,
are pregnant, or have co-morbidities that make it likely for the virus to cause severe illness.37 In
other patients, there are instructions to help manage the symptoms and minimise spread.38
Influenza pandemic:
Definition: According to World Health Organisation an influenza pandemic occurs “when a new
influenza virus emerges and spreads around the world, and most people do not have immunity.
Viruses that have caused past pandemics typically originated from animal influenza viruses.”39
Physical Risk: Influenza pandemics occur sporadically and it is difficult to determine or predict
the effect of future pandemics. There is literature on many historic influenza pandemics
including the 1918 H1N1 pandemic that killed 8600 New Zealanders and led to the “Health Act”
of 1920 which re-organised the health system.40 The most recent pandemic is the H1N1
influenza pandemic in 2009 (“swine flu”).
In 2009 there was an estimated 1508 hospitalisations from influenza, which is a 4-fold increase
from the previous year. 1122 of these are attributed to the H1N1 influenza pandemic and 102 of
these patients required ICU treatment.41 The total mortality rate from this influenza pandemic
9was 35 in New Zealand, however, as with seasonal influenza, this number could be under-
estimated.42
Inequality: The 2009 H1N1 pandemic affected New Zealanders unequally. Māori and Pacific
Islanders had significantly higher rates of hospital admission and mortality. Also people of a
lower socio-economic status were greater affected, as 39 percent of the mortalities were in
levels 9 and 10 of the deprivation index. These inequalities were also found in the 1918 H1N1
pandemic where Māori had a mortality rate of 4.2 percent which was 6-7 times higher than non-
Māori.43
Management: The Ministry of Health has developed an action plan (NZIPAP) to deal with a
large future pandemic. The pandemic planned for could cause as many as forty percent of the
population to be ill from influenza and have a mortality rate of 2 percent, meaning approximately
38,000 deaths.44
Their six step action plan is as follows:
Plan for it (planning and preparedness)
Keep it out (border management)
Stamp it out (cluster control)
Manage it (pandemic management/response)
Manage it: Post-Peak (reponse to recovery transition)
Recover from it (recovery)
This is based on a WHO four step approach. Other features of this action plan are inter-
pandemic surveillance systems looking at trends of infectious diseases in other countries, and a
Pandemic Influenza Tracking Action Group (PITAG) which directly communicate with the
Ministry of Health regarding features of an epidemic or pandemic and make recommendations.
Finally, District Health Board emergency planning is set out in an Operation Policy Framework
that is part of DHB Planning Package that the Ministry of Health give to DHBs each year.45
This action plan also works in tandem with the “Epidemic Preparedness Act” of 2006 which
gives the prime minister of the time “special powers” to pass notices in controlling epidemics or
pandemics if accepted by the director general of health and the ministry of health. Meanwhile
the governor general has authority to make immediate modifications to these notices if suitable
or necessary.46
Antibiotic resistance:
Definition: Antibiotic resistance is defined by the World Health Organisation as the ability of
micro-organisms to stop an anti-microbial working against them.47 Currently there are three
forms of antibiotic resistance that commonly complicate hospital management of patients in
New Zealand. These are methicillin-resistant Staphylococcus aureus (MRSA), extended-
spectrum beta-lactamase producing Enterobacteriaceae (ESBL-E) and carbapenemase-
10producing Enterobacteriaceae (CPE).48 In the developing world, antibiotic resistance has a large
effect in the management of common illnesses like tuberculosis and HIV.
Physical Risk: This is an emerging issue, that’s effect on humanity in the future is hard to
measure or predict. Currently it is estimated that antibiotic resistance is the cause of 750,000
deaths in the world each year. By 2050, it is estimated to be the cause of 10 million deaths each
year worldwide. That is 1.8 million higher than all cancers combined.49 In New Zealand
however, the mortality rates of antibiotic resistance compared with cancer, both currently and by
2050 will be much lower.
In 2006 the rate of MRSA was 14.3 per 100,000 people over a 1 month testing period. This
increased to 25.3 per 100,000 by 2015.50 This meant that by 2014 one in ten cases of
Staphylococcus aureus causing disease was MRSA. Rates of ESBL-E are also increasing in
New Zealand. In 2000, the rates isolated were about 1 per 100,000 people in New Zealand. By
2008 these levels became over 150 per 100,000 people.51 Similarly, from 2004 to 2011 the
rates of bloodstream Enterobacteriaceae that produce ESBL increased from 2.6 percent to 4.7
percent.52 In 2012 there were 4000 ESBL producing E.coli and K pneumoniae infections in New
Zealand.53 The number of CPE isolated in 2016 was 45, which shows a large increase from
2012 where only 3 cases were isolated, however only 11 of those 45 isolated were from clinical
specimens. This study also investigated the source of transmission and found that overseas
travel to countries where rates of CPE is higher was a risk factor. This is particularly true of India
and China.54
Inequality: There are inequities in these numbers as the Northland, Counties Manakau and
Tairāwhiti regions have the highest rates of MRSA in New Zealand, and this may be due to
having more people of a lower socio-economic status.55
Management: The Ministry of Health released an action plan in 2017 to control antibiotic
resistance. This action plan sets out five key objectives which are priority areas in management.
These are to improve awareness and understanding, increase surveillance and research,
improve infection prevention and control, develop better antibiotic stewardship and establish
clear governance and finally, collaboration and investment into a sustainable approach to
counter antibiotic resistance.56 This action plan also sets out instructions for reviewing in
subsequent years. Part of this action plan includes working alongside other government-owned
agencies to achieve some of these objectives. A good example of this is establishing
surveillance networks for antibiotic use and resistance with the Institute of Environmental
Science and Research Limited (ESR).57
The Ministry of Health also sets out guidelines for management of multidrug-resistant organisms
(e.g. ESBL-E) and specifically MRSA, however, these documents date back to 2007 and 2002
respectively and have therefore not been sufficient to inhibit the rise in these entities.58,59 There
are currently no specific guidelines for treating CPE.60
11Natural Disasters
Earthquakes
Definition: According to the Oxford English Dictionary an earthquake is: “A shaking or
movement of the ground; especially a violent convulsion of the earth's surface, frequently
causing great destruction, and resulting from movements within the earth's crust or from
volcanic action."61
Physical Risk: Earthquakes are a common occurrence, with an estimated 20,000 an year, with
about 150-200 of them strong enough to be felt.62 Between 1960 and 2016, the number of
earthquakes with a magnitude of 4.0 or above is shown in the below graph from GeoNet.62
Table 1. Frequency of New Zealand Earthquakes (1960 to 2016)
Even when considering 2016’s record year in earthquakes, with 32,828 recorded earthquakes
(and 1,001 earthquakes of magnitude 4 or above, a number second only to 1995), there has not
been a trend suggesting the frequency of earthquakes has increased over time.63
Most earthquakes cause no lasting harm, but a few larger magnitude earthquakes have caused
severe long-lasting consequences, particularly when they are located near urban centres. On
average, between 1855 and 2016 there have been around 2.9 earthquake related deaths per
year however, the sporadic nature of severe earthquakes near urban centres must also be
considered.64
Management: On a national level, disasters such as earthquakes are handled by the Ministry of
Civil Defence and Emergency Management (MCDEM). When a disaster occurs, regional Civil
Defence Emergency Management (CDEM) groups implement their initial response plan and
coordinate with relevant agencies for the first few days until the National Crisis Management
Centre (NCMC) can direct a national action plan.65
Extreme weather events
Definition: These include flooding, droughts, extremes in temperatures, and high wind speeds.
Climate change has a variety of effects on the environment, examples including altering
average sea levels, temperature, rainfall and wind speeds.66 This has the effect of increasing
the frequency and severity of severe extremes of weather hazards, which in turn can affect the
health and security of New Zealanders.66
Climate change is defined by the New Zealand the Resource Management Act 1991 as: “A
change of climate that is attributed directly or indirectly to human activity that alters the
12composition of the global atmosphere and that is in addition to natural climate variability
observed over comparable time periods.”67
Physical Risk
Flooding: Already the most frequent natural disaster needing reparations in New Zealand, it is
also the second most expensive behind earthquakes.66,68 Flooding risk is increased with
prolonged rainfall,66 rising sea levels especially in coastal areas66 and the frequency of rainfall
which may saturate the ground beforehand, thus reducing its capacity to absorb water for
subsequent rainfall events, increasing the risk of flooding.69
Although individual cases - such as the intense rainfall in Golden Bay in 2011 - have been
associated with climate change, so far there has not been a clear association between climate
change and increased frequency of flooding.70 Despite this, there have been several projections
that predict the frequency of major floods may increase in the future. NIWA (National Institute of
Water and Atmospheric Research) estimates that the frequency of major flooding could rise
from 1 in 440 years to 1 in 100 or even 1 in 50 depending on the progression of carbon
emissions.71
Droughts: Although parts of New Zealand have been experiencing droughts more frequently,
more data is needed before it can be definitively linked to climate change, however, future
estimations can be made based on current climate data.72 Average rainfall is projected to
decrease in the northeast parts of the North Island and South Island.73 The below figure from
Royal Society of New Zealand’s 2016 report provides a graphical depiction of historical and
potential future drought frequency.66
Figure 1. Projected Changes in Draught Frequency Across New Zealand Under a Climate
Change Scenario Midway Between Low- and High- Carbon Futures
13Notably, in Canterbury and Otago, which experience drought for about 10% of a year, this figure
is estimated to rise to 20% by 2040. Furthermore, areas of New Zealand which were not
drought prone before are projected to experience an increase in droughts as shown in the
diagram.
Extremes in temperature: With a general trend towards warming temperatures, climate change
will affect the extremes of temperatures New Zealand experiences. NIWA’s report based on the
Intergovernmental Panel on Climate Change’s (IPCC) 5th Assessment provides a few specific
figures. By 2040, there is a projected 30%-50% decrease in frosty nights (0oC or lower) with a
40%-100% increase in hot days (25oC or higher).74
High wind speeds: Wind speeds are also affected by climate change. There is a projected
increase of 10% more extreme winds in parts of the country such as the southern part of the
North Island and the entirety of the South Island.74
Management: Management of these risks revolve around the “4 Rs”: reduction, readiness,
response and recovery.75 For example, reduction of flooding damage through pre-emptive
measures to establish flood-resistant infrastructure, readiness to ensure people are ready to
respond in the event of a flood, effective responses to a flood, and subsequent recovery from
the disaster.75
On a broader scale, climate change induced extreme weather is ameliorated by combating
climate change itself. New Zealand takes part in various ways. It advocates for the removal of
fossil fuel subsidies to help reduce global emissions.76 It maintains its Emissions Trading
Scheme (ETS) to encourage businesses to reduce emissions and invests in public infrastructure
(such as public transport) for the same objective.76 It also invests money into research about
climate change; in 2015-2016 it invested $31 million for this purpose.76
Violence
International Terrorism
Definition According to Encyclopaedia Britannica, terrorism is "systematic use of violence to
create a general climate of fear in a population and thereby to bring about a particular political
objective.”77 In this study, we narrowed down our hazardscape to solely research acts of
international terrorism against New Zealand.
Physical risk: In the most recent annual report from the NZSIS for the year 1 July 2015 – 30
June 2016, the following has been reported: “New Zealand is a small and geographically
isolated country with a broadly tolerant and inclusive society. The terrorism threat level in New
Zealand remains at ‘low’ – a terrorist attack is assessed as possible but not expected however,
New Zealanders also travel widely, increasing the chances of being caught up in an offshore
terrorist event.”78
According to the annual report from the Inspector-General of Intelligence and Security there has
been only one potential threat that needed to be visualized by the NZSIS in the past year.79
14Management: The New Zealand Security Intelligence Service (NZSIS) is a public service
agency that was formed in 1956. Working alongside the Government Community Services
Bureau, New Zealand Police and New Zealand Defence Force, their purpose is to cooperate
and “respond to an imminent threat to life or safety.”80 We also have a number of pieces of
relevant legislation, including:
International Terrorism (Emergency Powers) Act 1987: If an international terrorist emergency,
defined as threats or actions, with the intention to kill, injure, damage property or intimidate
either the government or persons, develops in New Zealand, this act allows the prime minister
of New Zealand to call on at least three ministers of the Crown to declare a state of emergency,
giving them “emergency powers” for 7 days unless extended by parliament.81
Terrorism Suppression Act 2002: This act made it illegal for anyone in New Zealand to
participate or recruit for terrorist groups and by inhibiting the financial assistance of these
groups, therefore the participation of New Zealanders in terrorist acts was inhibited.81
The Counter Terrorism Bill 2003: This bill was passed with the aim to increase both the powers
made available to the government in response to terrorism and the criminal penalties applied
against terrorism. One of the key amendments to this bill was the right to obtain interception
warrants; where under appropriate circumstances, the government can overrule the right to
confidentiality and access private information for the safety of New Zealanders.81 Though New
Zealand is currently at a ‘low’ risk of any act of international terrorism, the legislation and
protective groups that the government consistently have in place serve to equip and protect us
to a standard of international excellence.
Physical Assault:
Definition: According to New Zealand’s Crimes Act 1961, assault is defined as “...the act of
intentionally applying or attempting to apply force to the person of another, directly or indirectly,
or threatening by any act or gesture to apply such force to the person of another, if the person
making the threat has, or causes the other to believe on reasonable grounds that he or she has,
present ability to effect his or her purpose; and to assault has a corresponding meaning.”82
Physical Risk: In the year July 2014 – July 2015, there were 172,580 reported assaults, this
suggests that approximately 3.9% of New Zealander’s were reported as victims of assaulted. In
the year July 2015 – July 2016 approximately 3.8% were reported as victims of assault.
Comparing this to the most recent statistics for the year July 2016 – July 2017, with a population
of 4.69 – 4.79 million,83 3.7% of New Zealander’s were reported as victims of assault,
suggesting that the incidence of assault is dropping by 0.1% per year.83
Inequality: A retrospective case-only study published in 2012 concluded that males accounted
for 76% of cases of assault, with 38% of these males being 15-24 years of ages. Both male and
female cohorts had significantly larger numbers reporting as Māori ethnicity (31.7% and 47.8%
respectively). As this study looked at the severe end of the spectrum (that being only
15hospitalized assaults), the absolute numbers are not completely applicable to our wider hazard
of “physical assault”, however the demographics reported are of significant interest.84
Management: The New Zealand Police attempt to minimise and manage the threats of physical
violence through prevention programs, community involvement and victim support.85,86
Additionally, The New Zealand Violence Protection Association is a group of professionals who
are committed to seeing a reduction in any form of violent acts amongst New Zealanders. They
provide services to advocate for the individual persons, families and communities. Services
supported by NZVPA include “Man Alive” and “Manline” and have a strong emphasis on
reaching out to Māori communities.87
16Table 2: Actual Burden of Ten Major Hazards Ranked According to Current Risk to the Health of
New Zealanders
Hazard Physical risk
1 Damp housing Children admitted to hospital with a
condition associated with damp housing
have higher mortality rates. 85% chance
of being readmitted to hospital vs 56% for
children admitted for other reasons.
2 Physical assault Affects 3.9% of New Zealanders per year
3 Seasonal flu Kills an average of 401 New Zealanders
per year, widespread seasonal morbidity.
4 Lead paint contaminated Underrated, associated with 93% of
housing variation in crime rates (which has
downstream effects on physical and
mental health)
5 Earthquakes Occur frequently but rarely large enough
to cause harm, over the last 100 years
earthquakes have killed an average of 2.9
New Zealanders per year.
6 Flu Pandemic Occur infrequently. The 2009 pandemic
killed 35 New Zealanders
7 Extreme weather events Occur frequently. Increasing in frequency
and severity. Little data on harm to New
Zealanders.
8 Antibiotic resistance Emerging hazard that is currently low risk
to most New Zealanders
9 Meth contaminated housing No official record. Believed to be largely
overestimated according to experts.
10 International Terrorism One ‘potential threat’ in the past year. One
recorded death from international
terrorism in New Zealand’s history.
17Method
The hazards included in this study were limited to 10 for the purpose of time and limited
resources. These 10 hazards were divided into 4 comparable groups and chosen based on a
number of factors. The comparable groups were violence (assault and terrorism), infectious
diseases (pandemic flu, seasonal flu, antibiotic resistance), housing (lead pain contaminated
housing, methamphetamine contaminated housing, damp housing) and natural disasters
(earthquakes, climate change induced extreme weather events).
Factors influencing the choice of hazards included ensuring a range of hazard types, hazards
with likely differences in actual risk vs. perceived risk, hazards with perceived uncertainty or
unpredictability, hazards ranging in degree of perceived locus of control, and hazards managed
by a range of government agencies. A table summarising these factors can be seen in Appendix
6.
Study Design
This was an observational cross-sectional study undertaken from 3rd – 11th October 2017.
Quantitative information was gathered from 155 members of the public via a public specific
online survey and face-to-face recruitment within Wellington City. Quantitative information was
gathered from 7 key informants via a key informant specific online survey. Qualitative
information was gathered from 6 key informants via a semi-structured phone interview.
Study Participants and Recruitment
Participants from the public were approached to participate in the quantitative aspect of the
study via Facebook, in particular, free online trading and discussion forums (‘Vic deals’, ‘Otago
Flatting Goods’ and ‘Buy and Sell in Auckland’). A total of 109 participants were recruited via
social media.
Face-to-face recruitment was used within Wellington City to further increase the number and
range of participants by widening our reach past social media. Approaching a member of the
general public was defined as verbally asking for participation in the study. The purpose of the
research was explained and consent was gained before beginning the survey. Street surveys
were completed at various locations within Wellington City. Locations and response rates for
individual locations are shown in Table 3. Overall, the response rate was 46%. This is shown in
Figure 2.
18Table 2: Actual Burden of Ten Major Hazards Ranked According to Current Risk to the Health of
New Zealanders
Location Survey responses Total approached Response rate
Cuba street, Wellington CBD 16 35 46%
Courtenay place, Wellington CBD 12 25 48%
Kilbirnie shopping centre 5 13 38%
Kilbirnie Pak n Save 5 10 50%
Karori New World 4 10 40%
Newtown New World 4 8 50%
Total 46 101 46%
101 Wellington public approached
55 Declined survey
46 Completed survey
Figure 2: Recruitment of Wellington public
Key Informants were included in the study if they had a risk assessment/management role in a
relevant government agency and/or expertise about risk management and the New Zealand
literature. Key informants were identified through a review of relevant literature, consensus with
research supervisors and personal and professional networks. Snowball sampling was then
used to further recruit professionals with an involvement in risk assessment/management in
New Zealand.
Key informants were approached via an email and follow-up phone call. This contained
information regarding the purpose of the research, access to the key informant specific online
survey and invited participation in the semi-structured phone interview. 7 out of 24 key
informants approached completed the online survey (response rate 30%). 6 of these key
informants also agreed to take part in the semi-structured phone interview, 1 key informant
declined (response rate 25%). This is demonstrated in Figure 3.
1924 Key Informants Emailed and Phoned
9 No response
8 Declined survey and interview
7 Completed survey
1 Declined interview
6 Completed interview
Figure 3: Recruitment of Key Informants
Study Instruments
Short, closed-ended questionnaire
Our questionnaire (Appendix 7) was made using Google Forms, and was made for both the
general public and our key informants. The questionnaire was the same for both groups but was
hosted on two different forms, in order to keep the results separate. The questionnaire consisted
of a set of five questions with multiple-choice answers for each of the ten hazards. There were
also some optional questions at the end of the survey, which were used to collect demographic
data for analysis.
Open-ended question phone interview
After having filled out the survey, our key informants were invited to take part in a semi-
structured phone interview. This interview consisted of open-ended questions that were
concerned with the role of their organisation in the New Zealand hazardscape, their thoughts on
the government’s control over the hazardscape, and how well they think New Zealand
individuals understand and control hazards. By following a set of predetermined questions,
interviewer bias was minimised.
20It was left up to the interviewers to organise a time that suited the informants to undertake the
interview. Once a time had been agreed upon, interviewers were able to call their key informant
and interview them on speakerphone, using another device to record the interview.
At the start of the interview the informants were reminded that the interview would be recorded,
but that the recording would remain confidential and all published information would be
anonymised unless the informant wished to be referenced. After the interview was concluded
the interviewer transcribed the informants answers and anonymised them, before sending the
transcription to the analysis team and deleting the recording.
We analysed our data using a mixed method approach:
Quantitative
In this study, for all the questions we asked apart from the demographics, a Likert scale with five
word options were used. For the purpose of data analysis, the word responses were all
converted to a numerical value.
For the first question, ‘How likely is it for a typical New Zealander to be exposed to this hazard?’,
the word options are listed below with the numerical value assigned to them.
1- Rare 2- Unlikely 3- Possible 4- Likely 5- Almost Certain
For the second question, ‘How severe are the usual consequences of this exposure?’, the word
options are listed below with the numerical value assigned to them.
1- Insignificant 2- Minor 3- Moderate 4- Major 5- Catastrophic
For the third and fourth questions, ‘How much control do you think you have over this hazard
occurring and its consequences?’ and ‘How much control do you think the government has over
this hazard occurring and its consequences?’ The word options are listed below with the
numerical value assigned to them.
1- No control 2- Little Control 3- Moderate Control 4- High Control 5- Complete Control
For the fifth question, ‘How worried are you about this hazard?’ the word options are listed
below with the numerical value assigned to them.
1- Not worried 2- Slightly worried 3- Worried 4- Very Worried 5- Extremely Worried
Furthermore, using the assigned numerical values, we have calculated the mean, average of all
values, to use in our analysis.
Categorical Analysis:
Violence: Physical assault, International terrorism
Infectious Diseases: Seasonal Flu, Flu Pandemic, Antibiotic Resistance
Housing: Damp Housing, Lead paint contaminated housing, Meth contaminated housing
Natural Disasters: Earthquakes, Extreme weather events
21Qualitative
Transcriptions of the recorded phone interviews were sent to the data analysis team after each
interview was completed. The transcripts were then collaborated to identify trends and themes
within the answers to the research questions, as well as any additional information obtained
from the key informants.
Ethical Approval
Approval for this project was granted by the University of Otago Human Ethics Committee,
under the category B criteria.
Results
Quantitative Result Analysis
1. General Public Participant Demographics
As part of the survey, we collected demographic data on age-group, gender, ethnicity and
occupation. There were 155 respondents in total who participated in the survey. The results are
shown below.
1.1 Age-group
Figure 4. Age-Group Demographics
22Table 4. Age-Group Demographics
Age-group demographics Percentage
Under 18 3 1.94%
19 - 25 90 58.06%
26 - 40 32 20.65%
41 - 65 22 14.19%
Over 65 7 4.52%
Missing 1 0.65%
Total 155 100.00%
The main age-group from the survey was “19 - 25”, showing 58.06% of the total age-group
demographic. This was followed by “26 - 40”, “41 - 65”, “Over 65” and “Under 18” - 20.65%,
14.19%, 4.52% and 1.94% respectively. One respondent did not give the age-group.
1.2 Gender
Figure 5. Gender Demographics
23Table 5. Gender Demographics
Gender demographics Percentage
Total Female 116 74.84%
Total Male 34 21.94%
Other 5 3.23%
Total 155 100.00%
There was a higher proportion of female respondents (74.84%) compared to the proportion of
male respondents (21.94%). Other responses included - 1 Transgender, 2 Agender, 1 None and
one did not provide gender.
1.3 Ethnicity
Figure 6. Ethnicity Demographics
24Table 6. Ethnicity Demographics
Ethnicity demographics Percentage
Total NZ European 112 72.26%
Total Māori 13 8.39%
Total Other 21 13.55%
Total Chinese 5 3.23%
Total Indian 2 1.29%
Total Samoan 1 0.65%
Unspecified 1 0.65%
Total 155 100.00%
The majority of the respondents identified as NZ European (72.26%), followed by Other
(13.55%), Māori (8.39%), Chinese (3.23%), Indian (1.29%), Samoan (0.65%) and One
respondent did not provide ethnicity.
1.4 Occupation
Table 7. Occupation
Occupation Category Number of Respondents Percentage
Students 60 38.71%
Working 77 49.68%
Retired 7 4.52%
Other 3 1.94%
Unspecified 8 5.16%
Total 155 100.00%
The respondents had varied occupations. The majority of our respondents were Working
(49.68%) from various professions. This was followed by Students (38.71%), Retired (4.52%)
and Other (1.94%). There were 8 respondents (Unspecified; 5.16%) who did not provide their
occupation. Other category included stay at home parents (SAHM; Parent).
Key Informant Demographics
There were 7 key informants in total who responded to the survey. They were from various
areas of expertise, working at different sectors within New Zealand. 4 out of 7 were male and 3
out of 7 were female. 5 out of 7 were NZ European and 2 out of 7 were Māori.
25Survey Questionnaire Analysis
1. Likelihood of Exposure
Figure 7. Perception of the Likelihood of Exposure for a Typical New Zealander by the General
Public vs Key Informants. *Refer to appendices for exact values of confidence intervals and p-
values of all hazards
Survey results show that the general public believed that a typical New Zealander is most likely
to be exposed to ‘Earthquakes’ and ‘Seasonal Flu’, followed by ‘Damp housing’ (means around
the value ‘4’ - ‘likely’ on the Likert scale provided - means 4.24, 4.12 and 3.94 respectively; CI
95% 0.13, 0.12 and 0.14 respectively) than the rest of the hazards. The general public thought
that ‘International terrorism’ was the least likely for exposure (mean 2.34 ± 0.17; CI 95%).
As for the key informants, they thought ‘Extreme weather events’ (3.86 ± 0.79; CI 95%) was
most likely for exposure, followed by ‘Damp housing’ (3.57 ± 0.72; CI 95%), ‘Earthquakes’ and
‘Seasonal Flu’ (having the same mean values of 3.43; CI 95% 0.94 and 0.58 respectively).
Large confidence intervals should be kept in mind - the means for key informants may not
represent true mean values for these hazards. The results also indicate that ‘International
26terrorism’ (1.14 ± 0.28; CI 95%) was also least likely for exposure - close to ‘rare’ on the Likert scale. The most statistically significant difference was seen for ‘International terrorism’ (General Public = 2.34 ± 0.17 vs Key Informant = 1.14 ± 0.28; CI 95%; p-value
Categorical comparison
Violence: General public responses show the Physical assault exposure (3.14 ± 0.14; CI 95%)
was more likely than International terrorism (2.34 ± 0.17; CI 95%) for a typical New Zealander.
The perception likelihood of International terrorism was close to 2 on the Likert scale meaning
‘unlikely’. The key informant group responses show the same pattern as the general public, but
the difference is wider (Physical assault = 2.71 ± 0.56 vs International Terrorism = 1.14 ± 0.28;
CI 95%) As mentioned above, the level of perception of likelihood of exposure of International
terrorism was statistically significant between the two groups. Physical assault was not
significantly different (p-value = 0.21).

Infectious Diseases: For the general public, the order of likelihood of exposure from most to
least for the category is as follows - Seasonal flu (4.14 ± 0.12; CI 95%), Antibiotic resistance
(3.34 ± 0.16; CI 95%) and Flu pandemic (2.72 ± 0.14; CI 95%). Seasonal flu was indicated
‘likely’ and was also the second among the ten major hazards of the general public. The Key
informants responses show the same pattern as the general public - Seasonal flu (3.43 ± 0.58;
CI 95%), Antibiotic resistance (2.57 ± 0.72; CI 95%) then followed by Flu pandemic (2.14 ± 0.67;
CI 95%). Although both groups considered Seasonal flu as the highest within this category, the
group has significantly differing perception (p-value 0.021), with the general public viewing the
hazard more likely to occur. Also the perception of Antibiotic resistance was significantly
different (p-value = 0.047), higher likelihood in the general public group.

Housing: General public responses indicate that a typical New Zealander is most likely to be
exposed to Damp housing over either Meth contaminated housing or Lead paint contaminated
housing. The difference in the perception of likelihood of exposure for Damp housing was noted
as being almost a scale higher on the Likert scale - Damp housing (3.94 ± 0.14; CI 95%; closer
to ‘Likely’), Meth contaminated housing (2.66 ± 0.15; CI 95%; closer to ‘Possible’) and Lead
paint contaminated housing (2.53 ± 0.13; CI 95%; closer to ‘Possible’). Key informants
responses differed in that they showed Lead paint contaminated housing (2.71 ± 0.56; CI 95%)
was more likely than Meth contaminated housing (1.86 ± 0.79; CI 95%), but Damp housing
(3.57 ± 0.72; CI 95%) was shown to be the highest likelihood of exposure which was in
consensus with the general public within this category. Perception of meth contaminated
housing was significantly different (p-value = 0.031) with the general public rating it higher in the
likelihood of exposure.

Natural Disasters: General public responses indicate that Earthquakes (4.24 ± 0.12; CI 95%)
were slightly more likely as compared to Extreme weather events (3.59 ± 0.14; CI 95%). Both
hazards were among the higher ranked hazards on the perception of likelihood of exposure for
a typical New Zealander for both the general public and the key informants. The key informants
showed an opposite pattern to the general public, as the key informants responses indicated
that Extreme weather events (3.86 ± 0.79; CI 95%) were more likely for exposure than
Earthquakes (3.43 ± 0.94; CI 95%) - perception of Earthquakes showed significant difference
(p-value = 0.012) within the two groups. Extreme weather events as a hazard, ranked highest
among all ten hazards for likelihood of exposure for key informants while Earthquakes were
deemed to be the top hazard for likelihood of exposure for the general public.

                                                                                                  28
2. Severity of the Consequences Figure 8. Perception of the Severity of Consequences by the General Public vs Key Informants. *Refer to appendix for exact values of confidence intervals and p-values of all hazards The hazards that the general public thought was the most severe in its consequences was ‘International terrorism’ (4.02 ± 0.139; CI 95%), indicating that it was ‘major’ in severity. They considered ‘Seasonal flu’ (2.58 ± 0.12; CI 95%) to be the least severe in its consequences. As for the key informants, they thought that both ‘Flu pandemic’ (3.86 ± 0.67; CI 95%) and ‘Antibiotic resistance’ (3.86 ± 0.51; CI 95%) were most severe in its consequences. The key informants believed that the usual consequences of ‘Meth contaminated housing’ were the least severe (1.86 ± 0.79; CI 95%). There were statistically significant differences (p-value
You can also read