Risk Based Evidence Profile - A strategic assessment of risk for 2021/22 March 2021 Cornwall Fire and Rescue Service - Cornwall Council
←
→
Page content transcription
If your browser does not render page correctly, please read the page content below
Information Classification: CONTROLLED

Risk Based Evidence Profile

A strategic assessment of risk for 2021/22

March 2021

Cornwall Fire and Rescue Service
Information Classification: CONTROLLED

Acknowledgements
Produced by Sophie Coles and Vanessa Bailey with special thanks to the following
people and teams for providing data and advice to help produce this document:

Amethyst, Community Safety Intelligence Team for support in implementing the
MoRiLE methodology to assess risk.

Sarah Noakes, Senior Technician Applications and Data, Customer Access and Digital
Services, Customer & Support Services

Adrian Roberts, Traffic and Safety Engineer, CORMAC, CORSERV

Helen Galligan, Senior Highway Design Technician, CORMAC, CORSERV

Mike Cartwright, Traffic Monitoring Officer, CORMAC, CORSERV

Donald Grieg, Performance and Analysis Support Officer, Devon and Cornwall Police

                                         2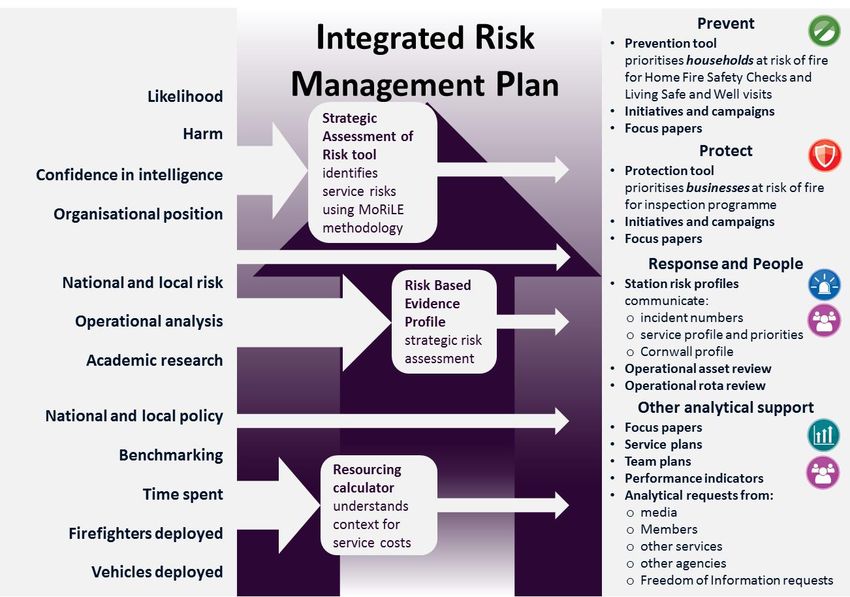
Information Classification: CONTROLLED
Introduction
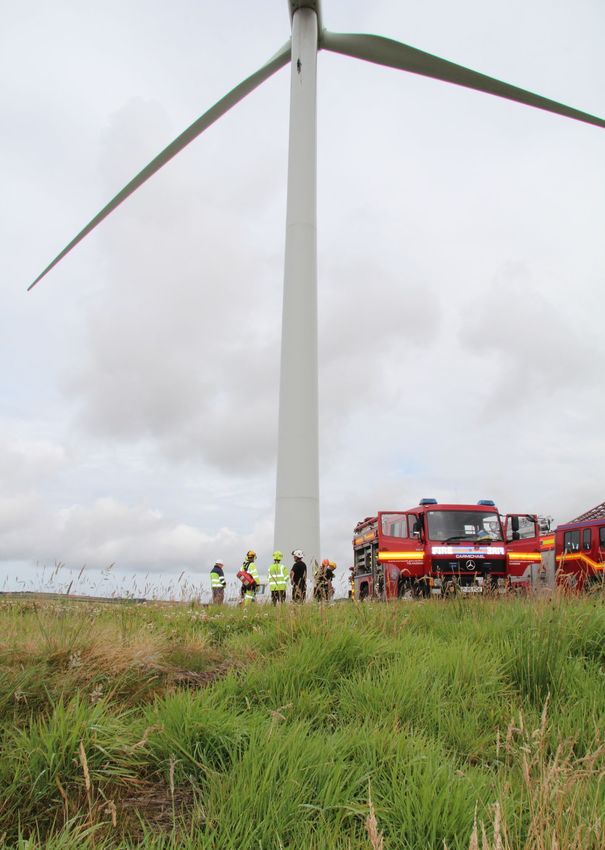
Cornwall Fire and Rescue Service is responsible for responding to a range of
emergencies. It also works to prevent a variety of issues such as road traffic
collisions, fires in homes and businesses, promoting fire safety as well as flood
prevention and water safety. Within Cornwall, Cornwall Council is the delegated fire
authority and is responsible for the leadership and governance of all fire and rescue
responsibilities.
This document is designed to provide a strategic overview of our assessment of risk.
The information provided will support the service to understand current, future and
predicted risks to ensure resources are in place to provide an efficient and effective
service for our communities.
The Risk Based Evidence Profile (RBEP) is the fire and rescue service’s strategic
assessment of risk. The information in this report will be used to inform our
Integrated Risk Management Plan review for 2021/22. It is produced to support
managers and staff within the service who are responsible for preventing and
responding to fires, rescues and road traffic collisions. It provides detailed analysis
about incidents from data recorded by the service so that we can better understand
how we can address these issues. It also includes information about potential threats
and risks affecting our community, such as terrorism and flooding, so that we are
prepared and equipped to respond to these risks in the event of them happening.
Information is also included about social, environmental, technological and
infrastructure changes so that we have a good understanding of the issues which are
likely to affect our service in future years.
This information plays a key role in the development of our Integrated Risk
Management Plan and team plans and ensures we follow an evidence-led approach
to managing our activities and resources. All fire and rescue authorities have a
statutory responsibility to produce an Integrated Risk Management Plan that sets out
how it will address locally identified risks and this document forms the first part of
this process.
3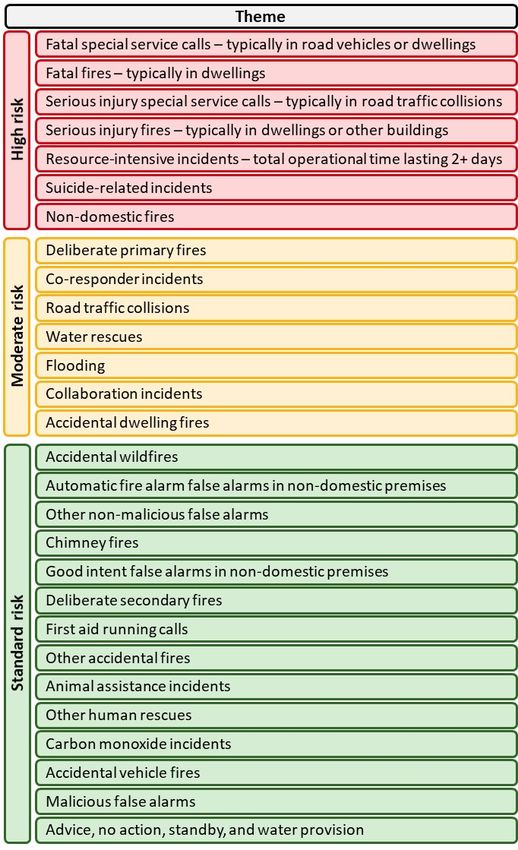
Information Classification: CONTROLLED

Executive summary
During 2019/20 there was a 3% decrease in incidents attended by fire and rescue
services nationally and a reduction in fires. This is largely due to a reduction in high
numbers of secondary fires experienced during the very dry summer of 2018. The
number of false alarms attended nationally had been declining since a peak in
2001/02 but this number increased by 4% during 2019/20. The number of non-fire
incidents or special service calls attended nationally rose by 6% last year and is 37%
higher compared with five years ago.

The number of incidents attended by Cornwall Fire and Rescue Service in 2019/20
reduced by 2% compared with the previous year. This is due to a reduction in the
number of fires which fell by 18% on the previous year. Despite an overall reduction
in the number of incidents attended, calls are still 21% higher than five years ago
(2015/16). Last year, false alarms increased by 10% while the number of special
service calls attended stayed the same.

Provisional data from 2020/21 has shown a substantial shift in demand on fire and
rescue services due to COVID-19. During the first quarter of the current financial year
(April 2020 to June 2020) we responded to 11% fewer incidents in comparison with
the average for the past five years. That is approximately 150 fewer incidents and
over 4000 fewer mobilisations of people with the most substantial reduction in on-
call staff. During the first quarter of 2020/21, we responded to 5% fewer fires, 25%
fewer special service calls but 30% more false alarms compared with the average of
the past five years.

There has been a substantial drop in the number of RTCs attended by the service
with 38 in the first quarter in comparison with 92 for the same period last year.
While the overall number of road traffic collisions has gone down during the first
quarter of 2020/21, the number of fatal collisions in Cornwall has stayed the same.
We know that when the volume of traffic on the roads decreases vehicle speeds
increase which may be why fatal collisions have not reduced in line with the total
number of collisions.

COVID-19 has had a substantial impact on the number of resources we mobilise.
During the first quarter of 2020 (April – June 2020), we mobilised 2960 fewer on-call
firefighters and 1000 fewer wholetime firefighters compared with the average for
the past five years.

                                            4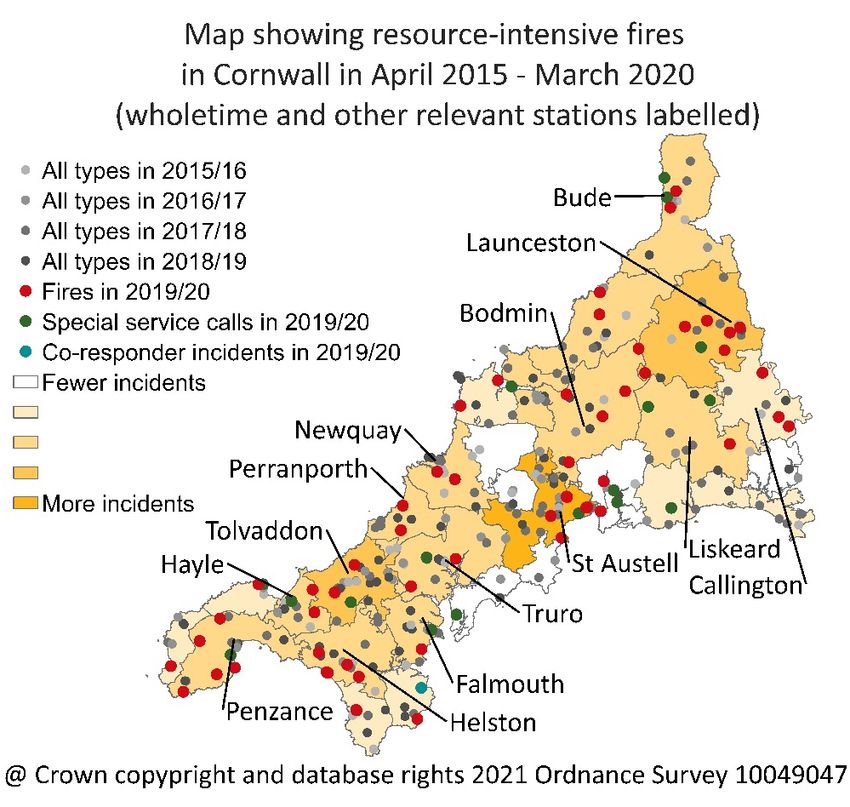
Information Classification: CONTROLLED

COVID-19 and the lockdown of 2020 has brought widespread social, economic,
political and legislative changes for all parts of society. Although everyone has been
impacted by the pandemic, it is clear that people’s outcomes and experiences are
very different depending on their circumstances. Evidence is also showing that
existing inequalities are being exacerbated further by the virus and social
restrictions.

The economic fallout of the pandemic could leave 1.1 million more people below
the pre-COVID-19 poverty line at the end of 2020 including a further 200,000
children 1. It is estimated that quarterly GVA is down 34% in Cornwall and that as
many as 72,800 jobs 2 are at risk of being lost due to the lock down. Universal Credit
numbers for March and April in 2020 confirm this picture with an overall increase of
61% more people on Universal Credit across Cornwall with some local areas faring
significantly worse 3. We know that the economic downturn will have significant
consequences on people’s health outcomes in the short- and longer-term impact
which is likely to impact on the number of vulnerable groups and people requiring
prevention work. A 1% fall in employment leads to a 2% increase in the prevalence
of chronic illness 4.

The government and wider societal measures to control the spread of the virus (the
lockdown, social distancing and cancellations to routine care) are placing a heavier
social and economic price on those already experiencing inequality. The
consequences of this action and the economic recession that is likely to follow, risk
exacerbating health inequalities now and in years to come. As we move from crisis
management to recovery, government, businesses and wider society all have a role
to play in giving everyone the opportunity to live a healthy life 5.

1 ‘1.1 million more people face poverty’, Institute for Fiscal Studies, https://www.ippr.org/news-and-media/press-
releases/1-1-million-more-people-face-poverty-at-end-of-2020-as-a-result-of-coronavirus-pandemic-finds-ippr
2 Cornwall Council Cabinet papers, 17th June 2020,

https://democracy.cornwall.gov.uk/documents/g9546/Public%20reports%20pack%2017th-Jun-
2020%2010.00%20Cabinet.pdf?T=10
3 Cornwall Council Cabinet papers, 17th June 2020,

https://democracy.cornwall.gov.uk/documents/g9546/Public%20reports%20pack%2017th-Jun-
2020%2010.00%20Cabinet.pdf?T=10
4 Recessions and health, the long term health consequences of responses to cornavirus, Institute for Fiscal Studies, April

2020, https://www.ifs.org.uk/uploads/BN281-Recessions-and-health-The-long-term-health-consequences-of-responses-
to-COVID-19-FINAL.pdf
5 Will COVID-19 be a watershed moment for health inequalities, The Health Foundation, May 2020,

https://www.health.org.uk/publications/long-reads/will-covid-19-be-a-watershed-moment-for-health-inequalities

                                                             5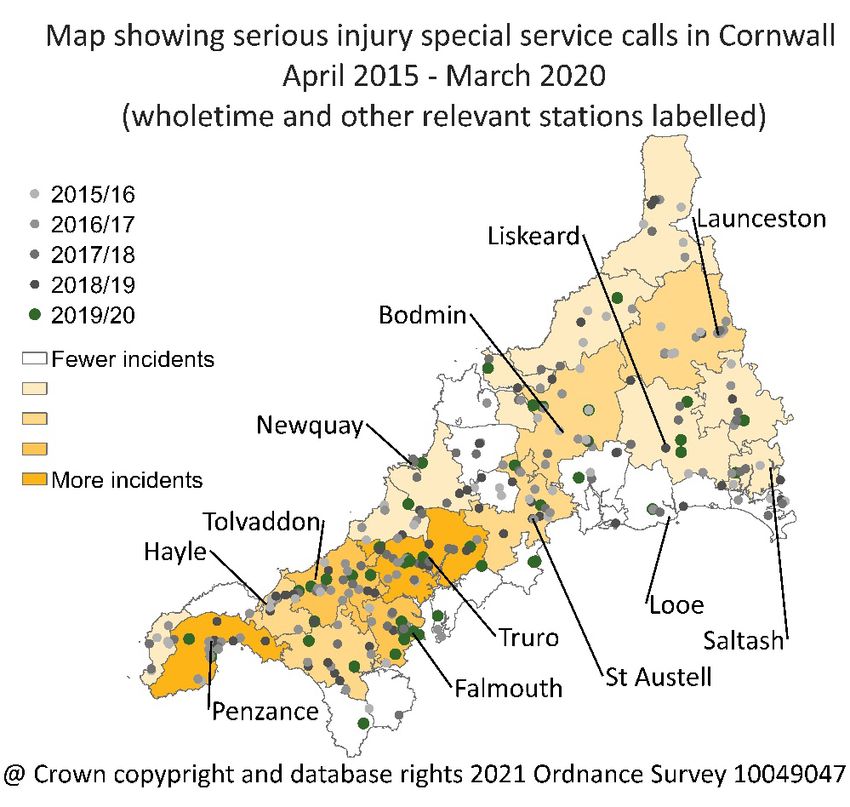
Information Classification: CONTROLLED

How we assess risk
In 2019 Cornwall Fire and Rescue Service adopted a new process to assess risk for all
fire, rescue and road safety incidents. The process uses the Management of Risk in
Law Enforcement (MoRiLE) methodology developed by the National Police Chief’s
Council. MoRiLE became a nationally accredited 6 way of working for all police forces
in 2016 and is used to inform their strategic assessments 7. The service has chosen to
adopt this methodology to provide a more complete assessment of risk. Each year
we run our Strategic Assessment of Risk workshops using this methodology.

MoRiLE provides a consistent approach to assess the level of harm presented to the
public for each fire, rescue and road safety risk in Cornwall. The tool is refreshed
every year to determine our highest priorities and to ensure our resources are
targeted at the incidents that present the greatest harm to the public. This
information is used to inform our Integrated Risk Management Planning process and
the activities we undertake to protect the public.

The approach combines data and analysis along with service expertise to provide a
thorough assessment of each risk or theme. It takes into account the level of harm
experienced by the victim and community as well as political pressures and the
service’s capacity and capability to manage the issue. The following diagram explains
the information that feeds into this methodology and helps us to understand what
our highest risks are.

The MoRiLE approach

6
  Police Authorised Professional Practice
7
  The MoRiLE methodology has been implemented with support from the Community Safety Intelligence Team
in the Safer Cornwall Partnership, www.safercornwall.co.uk

                                                  6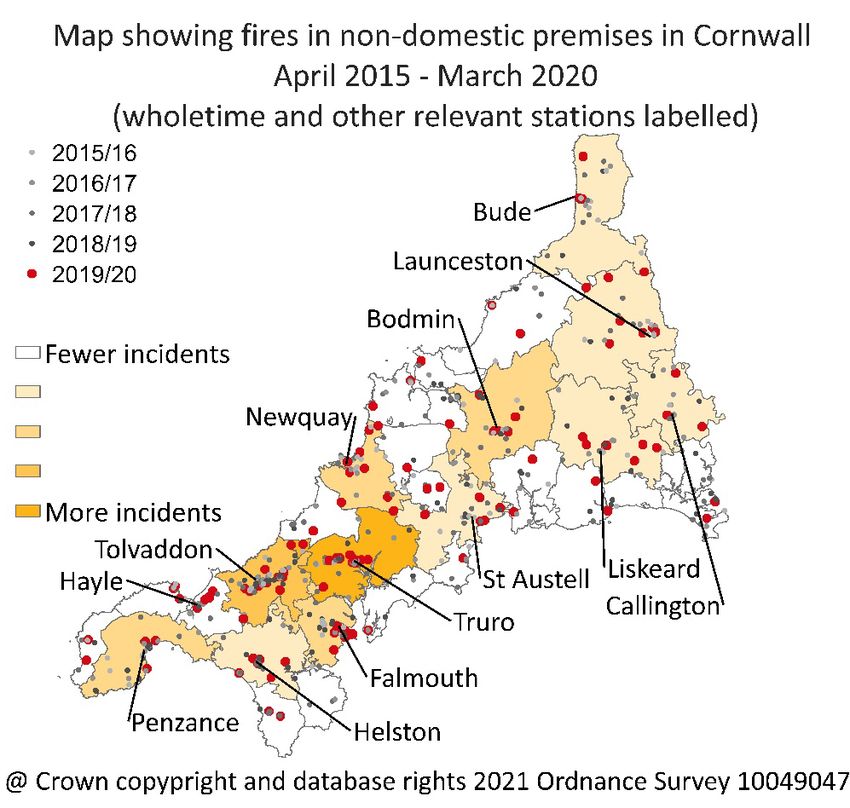
Information Classification: CONTROLLED

We also produce a range of tools and risk analysis that help us to identify where is
most at risk. These are our ‘Prevention Tool’ which looks at which areas are most
likely to experience an accidental dwelling fire. We use this information to target our
home fire safety checks and other prevention work in the community. We also
produce our ‘Protection Tool’ which looks at which properties are most likely to
experience a non-domestic fire. We use this information to target our fire safety
audit programme of work.

How our evidence informs our work

                                           7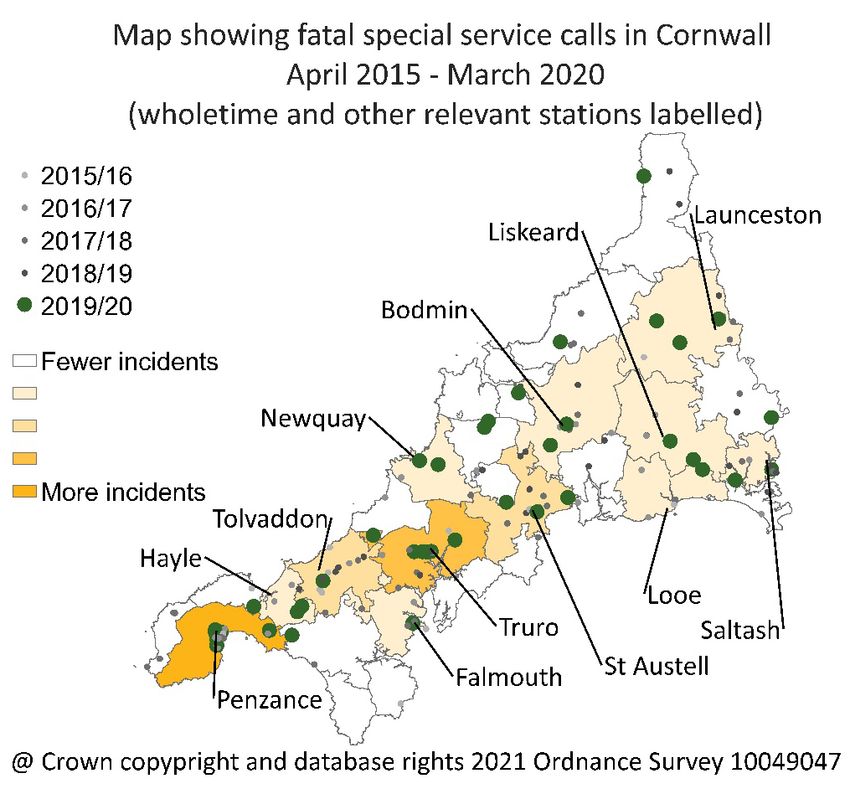
Information Classification: CONTROLLED

What are our highest risks?
The following diagram shows the results from our Strategic Assessment of Risk
workshops which were undertaken in 2020:

                                         8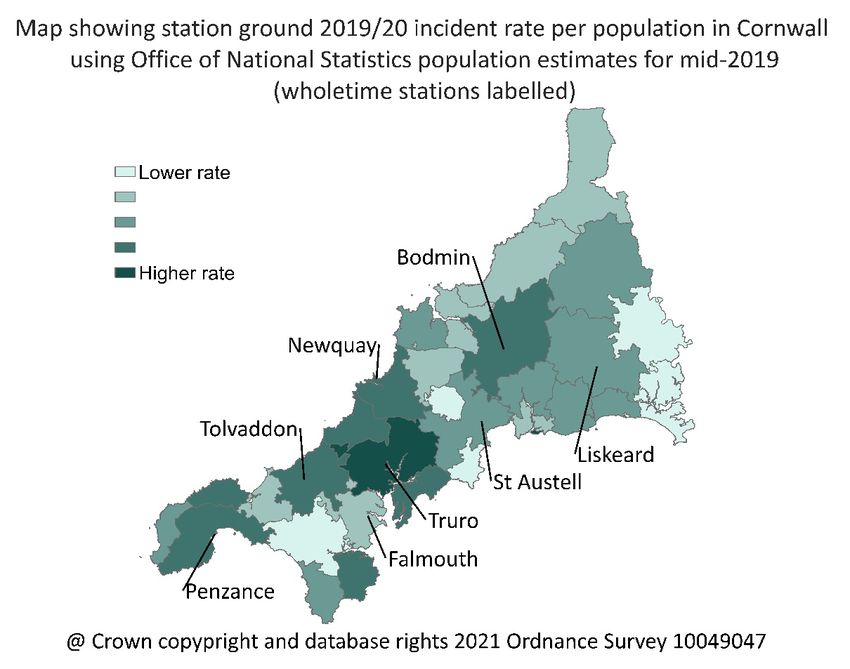
Information Classification: CONTROLLED

High risks
Fatal special service calls

In 2019/20 there                         Number of incidents
were 41 special           2015/16   2016/17  2017/18      2018/19           2019/20
service calls               18        32        39           28               41
involving a fatality in
Cornwall. Although
the numbers are low
we have seen an
increasing trend
over the past
decade. On average
the service attends
3-4 of these calls
each month.

Approximately, one
in three of these
calls are to road
traffic collisions with
30% assisting other
agencies and 12% to
suicides. Casualties
were aged between six and 95 in fatal special service calls of those recorded
between April 2017 and 30 June 2020. A typical incident involves one fatality
although there have been a small number with two fatalities in one incident. Overall,
these incidents took more vehicles, people, cover moves and time than the average
for special service calls.

                                          9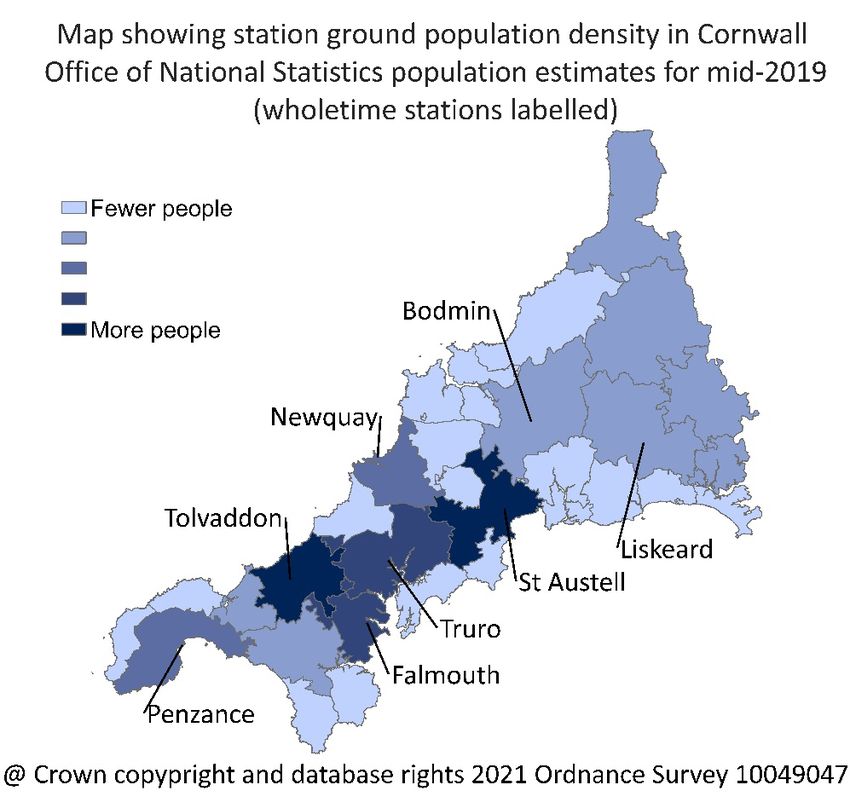
Information Classification: CONTROLLED

Fatal fires

We recorded one                          Number of incidents
fatal fire in         2015/16      2016/17   2017/18      2018/19            2019/20
2019/20 and the          3            4          1           3                  1
number of fire
deaths has
remained stable
over the past five
years. Since 1April
2015 there have
been thirteen fatal
fire incidents
resulting in
thirteen deaths
(nine were related
to the fire, two
were unrelated to
the fire and it is
not known if the
two most recent
deaths were fire-
related).

The majority of these deaths occurred in dwellings with the living room the most
common location of ignition followed by the kitchen. Smoking was the most common
ignition source followed by heating equipment, electricity supply and cooking
equipment. We also know that not all fatal fires occur accidentally and some of these
deaths are as a result of suicide. Two out of the thirteen fire related deaths since
2015 were recorded as suicide by the Coroner. The fatality ages range from 25-92,
with average age between 68 and 87 years old; the two most recent deaths were
men both aged 90.

Overall, fatal fire incidents took more       To attend one fatal fire in 2019/20 we
response and cover move resources and          deployed 8 vehicles and 27 people.
more time than the average for fires. This    Taking a total of 1.9 days (total people
means that they require greater resources      multiplied by time attending) to deal
to deal with and take us longer to attend.              with this incident.

                                         10
Information Classification: CONTROLLED
Serious injury special service calls
There were 44 special Number of incidents
service calls involving 2015/16 2016/17 2017/18 2018/19 2019/20
a serious injury in 54 79 61 61 44
Cornwall in 2019/20.
On average the
service attends 3-4 of
these calls each
month. Although, the
numbers are
relatively low there is
evidence of a
decreasing trend
over the past few
years.
Two thirds of these
calls are to road
traffic collisions with
17% of calls to assist
other agencies. A
typical incident
involves one casualty although there are a number of incidents with multiple
casualties. Fractures, back/neck/chest/abdominal/head injuries or chest pain were
typical injuries. A special service call with serious injuries takes longer to deal with,
more people, vehicles and cover moves than the average for special service calls.
11Information Classification: CONTROLLED
Serious injury fires
In 2019/20 there Number of incidents
were four fires 2015/16 2016/17 2017/18 2018/19 2019/20
involving a serious 3 3 3 4 4
injury and the trend
has been stable over
the past five years.
These incidents
happen at a rate of
around two every six
months on average.
Although the highest
number of these
fires occur in
dwellings, some
serious fires have
occurred in road
vehicles, non-
domestic premises
and outdoors. The
kitchen is the most
common source of
ignition for serious fires, followed by the bedroom. Just under half of these incidents
had a smoke alarm present.
12Information Classification: CONTROLLED
Resource intensive incidents
Number of incidents
Resource intensive
2015/16 2016/17 2017/18 2018/19 2019/20
incidents have been
41 40 75 71 74
defined as an
incident where the
total active time 8
(total number of
operational staff
multiplied by time at
incident) dealing with
an incident lasts
more than two days.
In 2019/20 the
service dealt with 74
resource intensive
incidents which is
approximately 1-2
per week.
These incidents are
predicted to
decrease and we
experienced a reduction in these calls during the first three months of lockdown.
Three quarters of resource intensive incidents are fires and the biggest category is
non-domestic fires. A quarter of incidents are special service calls with animal
assistances the most common followed by road traffic collisions, other rescue/
release of persons, assisting other agencies, flooding and rescue or evacuation from
water. Although, most incidents do not involve an injury, we recorded 10 deaths out
of 220 incidents during the last three years. These incidents require more vehicles,
people, cover move resources, and time than the average for all incidents.
8
Active time is the sum for all mobilisations to each incident recorded on Vision, excluding cover moves, of the
difference between the alert time and the available time, multiplied by the number of personnel recorded to
that appliance.
13Information Classification: CONTROLLED
Suicide related incidents
The service attended Number of incidents
25 suicide related 2015/16 2016/17 2017/18 2018/19 2019/20
calls in 2019/20 and 10 15 17 22 25
deals with
approximately two of
these calls a month.
There has been an
increasing number of
calls attended by the
service over the past
ten years and we
expect COVID-19 and
the economic and
social repercussions
to exacerbate this
further. However,
during the first three
months of lockdown
(April – June 2020),
there was a decline
in the numbers of
suicide related incidents the service was asked to attend. The Office for National
Statistics reported on 1 September 2020 that the ‘number of deaths by suicide in
Quarter 1 (Apr to Jun) 2020 dropped to
Suicide: During the pandemic we have the lowest number seen in any quarter
experienced a number of calls to office
since 2001. However, this decrease
staff within Cornwall Fire and Rescue
Service from people experiencing a probably reflects the impact of the
mental health crisis and feeling suicidal. pandemic on coroner services, rather
than a genuine decrease in suicides.
The report goes on to note that we won’t know the full scale of suicide for this
9
period until 2021. Not all suicide related calls to the service result in a fatality, out of
89 incidents over the past five year, 16 resulted in a fatality.
9
Quarterly suicide death registrations in England and Wales, Office for National Statistics, September 2020,
https://www.ons.gov.uk/peoplepopulationandcommunity/birthsdeathsandmarriages/deaths/bulletins/quarte
rlysuicidedeathregistrationsinengland/2001to2019registrationsandquarter1jantomartoquarter2aprtojune2020
provisionaldata
14Information Classification: CONTROLLED
Non-domestic fires
Number of incidents
In 2019/20 the
2015/16 2016/17 2017/18 2018/19 2019/20
service dealt with 134
non-domestic fires 126 130 143 128 134
which is a slight
increase on the
previous year.
However, during the
first three months of
lockdown this year
there was a reduction
in the number of
incidents. On average
the service attends 2-
3 non-domestic fires
each month.
Non-domestic fires
most frequently
occur in: permanent
agricultural premises
(18%), food and drink
premises (13%),
hospitals and medical
care premises (11%), hotels and motels (10%) and retail premises (8%).
Most of these fires do not produce injuries, there have been no deaths, no serious
injuries and 22 slight casualties over the past five years. Out of 661 incidents, 651
resulted in no human rescue but we assisted with evacuation in a quarter of
incidents. Overall, non-domestic fires require more vehicles, more people, more
cover move resources, and more time dealing with them than the average for fires.
Non-domestic fires are the most resource-intensive incident type. A typical incident
requires 2 appliances but some agricultural incidents can last for days.
15Information Classification: CONTROLLED
Moderate risks
Deliberate primary fires Number of incidents
2015/16 2016/17 2017/18 2018/19 2019/20
124 114 139 139 127
There were 127 deliberate primary fires in 2019/20 which is an 8.6% decrease on the
previous year. On average we deal with 2-3 of these fires each week. Just under half
of these fires are to road vehicles, 18% to dwellings, 14% non-residential, 13%
outdoor structures and 7% were to outdoor fires. Injuries from deliberate primary
fires is rare, out of 634 incidents during the past five years, there were five serious
injuries and 33 slight injuries. Of all 38 casualties, six were thought to be due to self-
harm or suicide attempts.
Co-responder incidents Number of incidents
2015/16 2016/17 2017/18 2018/19 2019/20
949 819 1305 433 208
In 2019/20 the service dealt with 208 co-responder incidents which is a 52%
decrease over the past two years. Co-responder incidents happened at a rate of
around four per week on average. 70% of co-responder incidents are to people’s
dwellings with 21% to non-residential/other residential premises and 8% outdoors.
One in three calls are for people experiencing breathing difficulties, 23% are for
people unconscious/ unresponsive, 15% are for chest pain/ cardiac arrest and 12% is
for people who have collapsed. There was one serious and one slight injury recorded
in 2019/20. In the four previous years there were seven fatal incidents, seven serious
incidents, twelve slight incidents, and no non-injury human rescues.
Collaboration Number of incidents
2015/16 2016/17 2017/18 2018/19 2019/20
262 437 588 593 620
The service attended 620
collaboration incidents in 2019/20 which is 4.6% higher than the previous year and
more than double the figure for 2015/16. Following the lockdown period and due to
COVID-19 we believe there is likely to be a rise again due to additional demand on
16Information Classification: CONTROLLED
the ambulance service. On average we attend 1-2 collaboration incidents every day.
Half of collaboration calls are to ‘assist other agencies’, a quarter are for ‘effecting
entry/ exit’ to properties and 14% are for ‘making safe/ not RTC’. The majority of
calls (71%) are to dwellings, one in 10 are to non-residential properties, one in 10 are
outdoors/ outdoor structure and 4% are to road vehicles. Typical incidents involve no
human rescue or injury with only 8% of incidents involving a casualty.
Road traffic collisions (attended by Cornwall Fire and Rescue Service)
Number of incidents
In 2019/20 there were 391 2015/16 2016/17 2017/18 2018/19 2019/20
road traffic incidents which 390 375 376 408 391
is one a day on average.
There was a 4.2% decrease in the last two years, although the trend has been pretty
stable over the last decade. 82% of incidents attended by the service are to cars, 6%
are to multiple vehicles, 4% to vans, 2% motorcycles and 2% HGVs. Out of 391
incidents we recorded 15 road deaths, 42 seriously injured casualties, and 105
casualties with slight injuries last year. Our records show that the government
lockdown had no effect on the number of fatal collisions CFRS attended, however
there is some evidence that we may have attended fewer serious collisions. Lower
traffic volume is associated with higher speeds, which is likely to have contributed to
this effect. Last year, to attend 391 road traffic collisions we mobilised a vehicle 1425
times and operational staff on people6043 occasions.
The service also has a wider remit to deliver education, training, and publicity for
preventing RTCs in its role as part of Cornwall Council. We look at RTCs we
responded to as well as those Devon and Cornwall Police (D&CP) recorded in a
dataset called STATS19.
Serious collisions recorded in Cornwall have increased over the last three years but
there is some uncertainty about the validity of these numbers while the Department
for Transport investigate 10 how police record severity. The trend in fatalities
nationally and in Cornwall has been broadly flat since 2010. Devon and Cornwall are
aiming for a 50% reduction to the number of people killed or seriously injured (KSI)
on our roads by 2030. Approximately half of all KSI casualties in 2019 were car
10
Reported road casualties in Great Britain: 2019 annual report, Department for Transport,
https://assets.publishing.service.gov.uk/government/uploads/system/uploads/attachment_data/file/922717/r
eported-road-casualties-annual-report-2019.pdf
17Information Classification: CONTROLLED
occupants, so it seems likely that we will see more prevention work aimed at these
road users.
In 2019, the police recorded:
• 21 fatal collisions; that’s around one or two each month on average, and this
trend has been stable for around ten years.
• 253 serious injury collisions; or approximately four to five each week on
average: numbers have been increasing over the past ten years or so, partly
due to a change in recording.
• 857 slight injury collisions; or between 16 and 17 each week on average: the
police have recorded fewer slight injuries over the past ten years or so, and
this is thought to be partly because the police don’t have as much capacity to
spend the time recording less severe collisions rather than fewer numbers of
people being injured.
• 141 KSI collisions involving vulnerable road users 11; that’s two or three
collisions each week on average: numbers have been stable over the past few
years.
• 49 KSI collisions related to speed 12; or around one each week on average:
numbers have been stable in recent years.
• 42 KSI collisions related to alcohol or drugs 13; or three to four each month on
average: numbers are stable.
• 15 KSI collisions involving distraction 14; or between one and two each month
on average: numbers are stable.
Flooding
In 2019/20 the service attended 18 water rescues which is approximately 1-2 each
month on average. There were 108 flooding incidents 2019/20 which is a 50%
11 ). The Department for Transport (DfT) lists motorcyclists, pedal cyclists, and pedestrians as vulnerable road users.
12 Collisions where police officers recorded either ‘travelling too fast for conditions’ or ‘exceeding speed limit’ as
contributory factors for at least one road user involved in the collision.
13
Collisions involving a driver with a positive breath test and/or collisions involving at least one road user allocated at least
one of the following contributory factors: ‘impaired by alcohol’; ‘impaired by drugs (illicit or medicinal)’.
14
Collisions involving at least one road user allocated at least one of the contributory factors: ‘distraction in vehicle’;
‘distraction outside vehicle’; ‘driver using mobile phone’.
18Information Classification: CONTROLLED
increase on the previous year. This does not indicate an ongoing trend, rather that
incident numbers are volatile and have increased and decreased for the past seven
years. The service attends two of these calls each week on average. Most flooding
incidents in 2019/20 occurred in dwellings (68%). Causes are not systematically
recorded for each incident, but text fields appear to indicate that the majority of
flooding incidents are caused by a burst pipe or blocked drain. It is difficult to tell
from the incident record exactly how many are due to adverse weather and/or tidal
conditions, but a high volume of calls occurred on one day on three occasions during
the past five years.
Water rescues Number of incidents
2015/16 2016/17 2017/18 2018/19 2019/20
The service responded to 18
13 8 15 13 18
water rescues in 2019/20
which is approximately 1-2 each month on average. There were four deaths out of 70
incidents between 2015/16 and 30 June 2020.
Accidental dwelling fires
Number of incidents
2015/16 2016/17 2017/18 2018/19 2019/20
In 2019/20 there were 237 273 256 313 234 237
accidental dwelling fires in
2019/20 which is a 1.3% increase on the previous year and they occurred at a rate of
4-5 each week on average. Most accidental dwelling fires in 2019/20 started in
houses (57%), with the second most frequent dwelling type purpose-built
flats/maisonettes (16%). Most incidents started in the kitchen or the living room with
cooking appliance the most common ignition source followed by electricity supply
and then other domestic appliance. Deaths and injuries in accidental dwelling fires is
rare. 87% of accidental dwelling fires involved no injury or human rescue last year. In
2019/20 one person died at an accidental dwelling fire, three people were seriously
injured and 22 people were slightly injured.
19Information Classification: CONTROLLED
Standard risks
Accidental wildfires Number of incidents
2015/16 2016/17 2017/18 2018/19 2019/20
There were 103 accidental 63 53 69 165 103
wildfires 15 in 2019/20 which
is a 38% decrease on the previous year. In 2018/19 we experienced very high
numbers of accidental wildfires in Cornwall which we believe was due to a
particularly hot and dry summer in 2018. The longer that land does not burn for, the
more likely that larger less manageable wildfires occurs, so a decrease in numbers
does not indicate lower risk. Around 46% of fires last year caused damage up to 5m2;
48% caused damage between 6m2 and 1000m2 and less than 7% of accidental
wildfires were more than 1000m2. There have been no injuries or rescues in the last
five years, however, there is a risk of firefighters being injured.
Chimney fires Number of incidents
2015/16 2016/17 2017/18 2018/19 2019/20
122 155 143 94 105
There were 105 chimney fires in 2019/20 which is a 12% increase on the previous
year; and they occurred at a rate of around two per week on average. There has
been a downward trend in the last two years, and predictions based on data from
before April 2020 predict that this trend could continue this financial year. 78% of
chimney fires occur in single occupancy homes followed by 10% in single occupancy
bungalows and approximately 6% in non-residential premises. There have been no
injuries or rescues as a result of chimney fires over the past five years in Cornwall.
Other accidental fires
Number of incidents
Other accidental fires cover 2015/16 2016/17 2017/18 2018/19 2019/20
accidental fires that do not 172 180 182 279 239
fall within chimney fires, vehicle fires, non-residential and dwelling fires as well as
15
Wildfire definition: Accidental fire in rural areas in a range of land types including hedges, heathland,
moorland, grassland, pasture, grazing, scrub land, and wasteland. This category does not represent all wildfires
since many are deliberate fires, which we cover in the deliberate primary and secondary fires categories.
20Information Classification: CONTROLLED
wildfires. Most of these fires occur on domestic land such as in people’s gardens. In
2019/20 the service attended 239 incidents which is 4-5 each week on average.
Although the number of incidents decreased by 14% in 2019/20 compared with the
previous year we have seen an increasing trend in these fires over the past five years.
During the first quarter of 2020/21, we experienced an unusually high number of
other accidental fires during lockdown, with 144 incidents in this period in
comparison with an average of 66 over the last five years. Public interest in domestic
outdoor fires increased during the lockdown period, as we received an increasing
number of calls alerting us to bonfires and controlled burning in residential
properties, however, this has now returned to normal levels. There have been two
serious injuries and 14 slight injuries out of more than 1000 incidents over the past
five years and no fatalities in Cornwall for eight years. In order to respond to these
239 fires (18% of all fires) we mobilised 594 vehicles and deployed more than 2600
people.
Automatic fire alarms in non-domestic premises
Number of incidents
2015/16 2016/17 2017/18 2018/19 2019/20
409 436 500 395 458
There were 458 automatic fire alarm (AFA) incidents in non-domestic premises in
2019/20 which is a 16% increase from the 395 incidents the previous year. On
average the service attends around 1-2 of these incidents each day. Automatic Fire
Alarms make up 22% of the total number of false alarms. One in five AFAs occur in
hospitals and medical care premises, with 16% in retail premises, one in ten in
residential care homes, 8% in education and 7% in industrial manufacturing. A very
small proportion of automatic fire alarms are in fact due to a fire. In order to respond
to these 458 incidents we mobilised 646 vehicles and deployed 3,313 people.
Good intent false alarms in non-domestic premises
Number of incidents
There were 193 good intent 2015/16 2016/17 2017/18 2018/19 2019/20
false alarms in non- 84 100 165 170 193
domestic premises last year,
a 14% increase in the last two years, a trend that has been increasing over the past
10 years. These incidents happen approximately 3-4 times each week. 45% of good
21Information Classification: CONTROLLED
intent false alarms occur in hospitals and medical care premises, 10% in residential
homes, 6% in retail, 5% in food and drink premises and 5% in hotels. This type of
false alarm makes up approximately 9% of the total number of false alarms. In order
to respond to 193 good intent false alarms in non-domestic premises last year we
mobilised a vehicle 565 times and deployed operational staff on 2362 occasions.
Malicious false alarms
Number of incidents
2015/16 2016/17 2017/18 2018/19 2019/20
54 51 45 65 54
Malicious false alarms make up a very small proportion of false alarms in total (2.5%).
In 2019/20 the service dealt with 54 malicious false alarms. The most common
premises types for malicious false alarms are to dwellings. In order to respond to 54
malicious false alarms last year we mobilised a vehicle 100 times and mobilised
operational staff on 474 occasions.
Other non-malicious false alarms
Number of incidents
Other non-malicious false 2015/16 2016/17 2017/18 2018/19 2019/20
alarms include good intent 1066 1120 1126 1262 1376
false alarms or automatic
false alarms in domestic premises, vehicles, or outdoors. These incidents make up
65% of the total number of false alarms but are not currently included within our
performance indicator definition. We recorded 1,376 other non-malicious false
alarms last year. Incidents have risen by almost a quarter in the last five years,
occurring at a rate of 3-4 each day on average. There has been a rise in calls during
the first three months of lockdown in 2020/21 this is likely due to an increase in
domestic bonfires and controlled burning.
Deliberate secondary fires
Number of incidents
2015/16 2016/17 2017/18 2018/19 2019/20
We recorded 221 deliberate 243 234 243 379 221
secondary fires in 2019/20
which is a 43% decrease on the previous year. Data cleansing work on the Incident
22Information Classification: CONTROLLED
Recording System is likely to have impacted on this reduction. Most deliberate
secondary fires recorded last year were outdoors (84%); and almost half were people
setting fire to their own property (47%). It is not clear from our records how many
deliberate fires were cases of criminal arson.
First aid running calls Number of incidents
2015/16 2016/17 2017/18 2018/19 2019/20
There were 16 first aid 18 50 211 49 16
running calls 16 in 2019/20
down from 49 the previous year. First aid running calls happened at a rate of 1-2
each month on average. Of 65 incidents in the last two years, there were three
serious injuries, ten slight injuries, and three incidents involving human rescue.
Animal assistance incidents
Number of incidents
Cornwall Fire and Rescue 2015/16 2016/17 2017/18 2018/19
2019/20
Service attended 80 animal 84 82 71 122
80
assistance incidents in 2019/20 which is approximately 1-2 times each week on
average. This is 34% lower than the previous year which experienced 122- the
highest number of incidents recorded in the last 10 years. The most common rescue
is ‘rescue from height’ with 38%, followed by ‘trapped animal’ with 26% and ‘animal
in harm’ with 11%. Just under two-thirds of animals recued are domestic (dog, cat,
rodent, bird, horse) with 18% for wild animals and 19% for livestock. In order to
respond to 80 animal assistance incidents last year we: mobilised 186 vehicles and
deployed 753 people.
Other human rescues Number of incidents
2015/16 2016/17 2017/18 2018/19 2019/20
288 301 336 390 364
There were 364 other
human rescues in 2019/20 which is approximately one per day last year. The trend
over the past five years has been upward generally. 41% of these incidents are to
dwellings, 22% to road vehicles, 23% non-residential/other residential.
16
First aid running calls are a medical incident directly requested by the public. Individuals present at a fire
station and ask for emergency medical treatment for example with a defibrillator. These are separate from co-
responding incidents which are referrals from SWASFT.
23Information Classification: CONTROLLED
Carbon monoxide
There were twelve confirmed carbon monoxide incidents in 2019/20 which is one
each month on average. We know from past experience that carbon monoxide can
result in multiple fatalities but this is very rare. Over the last five years there were 98
incidents with no fatalities, six serious injuries, 14 slight injuries, and four human
rescues.
Accidental vehicle fires
Number of incidents
2015/16 2016/17 2017/18 2018/19 2019/20
There were 164 accidental 191 189 157 200 164
vehicle fires in 2019/20 which is approximately 3-4 each week on average. This figure
was an 18% decrease on the previous year and we have experienced between 157-
226 of these fires every year for the past 11 years. Most accidental vehicle fires in
2019/20 started in cars (65%), and the ignition source was the vehicle itself in the
majority of incidents (88%). The main causes included overheating (unknown cause),
or faulty electricity or petrol supplies. Injuries from accidental vehicle fires are rare,
out of 910 incidents in the last five years there has been one fatal incident involving a
crashed aeroplane in 2015, however, this death was not believed to be as a result of
the fire. Over the same period there has been one seriously injured casualty, 15
casualties with slight injuries and five human rescues.
Advice, no action, standby and water provision
We recorded 61 incidents Number of incidents
last year which is 2015/16 2016/17 2017/18 2018/19 2019/20
approximately 1 each week 51 47 60 41 61
on average. Most calls are to dwellings followed by road vehicles and then non-
residential properties. More than half of calls require ‘advice only’ followed by ‘no
action’ taken. Physical injuries for this type of call are rare with one fatality out of
260 incidents, six casualties with slight injuries and four rescues.
24Information Classification: CONTROLLED
Where did incidents happen?
The maps here show that our wholetime stations are located where Number of incidents
more people live: the yellow map shows that incidents are most 2015/16 2016/17 2017/18 2018/19 2019/20
frequent in the wholetime station grounds of Penzance, Tolvaddon, 5054 5153 6220 5504 5181
Falmouth, Truro, Newquay, St Austell, Bodmin and Liskeard 17.
17
Liskeard is crewed during the day on Mondays to Fridays.Information Classification: CONTROLLED
Incident rate
The following map shows that Truro has the highest number of incidents 18 per population 19 for each station ground in Cornwall.
18
Co-responder incidents are not included since they are treated separately from ordinary demand.
19
Population data is resident population from Table SAPE22DT10g: Mid-2019 Population Estimates for Census Output Areas in the South West region of England by Single
Year of Age and Sex - Supporting Information. Source: Estimates of the population for the UK, England and Wales, Scotland and Northern Ireland - Office for National
Statistics (ons.gov.uk) Accessed 10 December 2020.
26Information Classification: CONTROLLED
Seasonal analysis
The following chart shows that the service attends a higher number of incidents
during the Summer months when compared with the average for the year. Demand
on the service is greatest during the Summer months (June to August) when the
service responds to a greater proportion of incidents.
% difference between actual and average
number of incidents
10.0%
5.1%
5.0%
0.0%
-5.0% -1.8% -1.6% -1.6%
Spring Summer Autumn Winter
The following chart also illustrates that the service spends 8% longer in Summer
dealing with incidents and 3.8% longer in Autumn dealing with incidents. This could
be due to an increase in travel time during the Summer season or may be due to the
nature of incidents attended.
% difference between actual and average
active time spent responding
10.0% 8.0%
3.8%
0.0%
-10.0% -6.7% -5.1%
Spring Summer Autumn WinterInformation Classification: CONTROLLED
Local and national resilience
National risk
Under the Fire Services Act 2004, all fire and rescue authorities are required to
respond to an emergency that has arisen outside its own area if, for example, it has
more appropriate equipment and training than the authority in whose area the
emergency has occurred. Each authority has a duty to respond to particular types of
emergency, as defined by the order, such as flooding and terrorist incidents. The
intention is to ensure consistency of approach towards emergencies, particularly in
response to terrorist incidents 20.
The current national threat level for the United Kingdom from terrorism is
SUBSTANTIAL 21
The National Framework Coordination and Advisory Framework England published in
2019 further reinforces the need for fire and rescue authorities to pool resources and
skills in the event or a large-scale event. Although, the majority of emergencies are
dealt with locally, the framework recognises the need for arrangements in place to
support complex and major incidents such as terrorist attacks.
The Home Office is responsible for coordinating the response to and prevention of
major incidents such as terrorism through the National Resilience and Fire
Directorate and Office of Security and Counter Terrorism. Working with other
government departments and partner organisations to provide advice, ministerial
briefings and coordination of communications during major incidents.
The National Strategic Assurance Team and the Chair of the National Fire Chiefs
Council provide professional advice on behalf of the fire and rescue sector to
government ministers and departments on the resources the fire sector has available
and how they can be used nationally.
As one of the services that makes up the national fire sector, Cornwall Fire and
Rescue Service has a role to play within the national resilience arrangements for the
country when it comes to major emergencies. The sector has a number of specialist
teams that can respond to a wide range of national emergencies ranging from
20
Fire and Rescue Service Act 2004, Legisltion.gov.uk, http://www.legislation.gov.uk/ukpga/2004/21/notes
21
Threat level correct at December 2020, https://www.mi5.gov.uk/threat-levels
28Information Classification: CONTROLLED
collapsed buildings, terrorist attacks and most recently and prominently weather-
related incidents, including flooding and wildfires.
Our National Resilience Strategy ensures we can support national resilience through
a programme of work. This includes competency training, a testing programme for
appliances and equipment and a series of audits designed to test our preparedness in
line with the strategies set out by the National Strategic Assurance Team. As part of
our commitment to the strategy we carry out written reviews, site visits and national
exercises. We also have 10 trained National Incident Liaison Officers (NILO) which
provide additional resilience and expertise within the service 24 hours a day.
National assets within Cornwall include:
• Defra water rescue– Bude, St Austell, Falmouth and Penzance (assets available
but not capability while we work towards the new concept of operations
national standard).
• Mass Decontamination Unit in Newquay and supported by crews from
Newquay, Bodmin, Launceston, Liskeard and Saltash.
• High volume pumping capability in Newquay and three hose box units capable
of pumping water at up to 7000L/min up to 3km.
Within Cornwall Fire and Rescue Service we have specialist officers that provide
national support and expertise on particular areas. We have a trained National
Tactical Advisor for tackling waste fires that is available to support the fire sector in
providing a response to this type of incident. We are also working towards having a
National Tactical Advisor for wildfires.
Business continuity
In order to ensure our own internal resilience, we have robust and tested plans to
deal with any business continuity issues which could impact on service delivery and
our risk critical services. We have a four-tier business continuity plans to cover
essential critical functions including operational response, critical control and
workshops. This ensures we can maintain an emergency response to the community
around the clock. We also have a series of measures in place to address the current
risk posed by the COVID-19 pandemic including a COVID-19 working principles
document which supports our business continuity plans.
Local risk
We know that there are some risks which are more unique to Cornwall Fire and
Rescue Service than other fire services, this includes mining and maritime related
29Information Classification: CONTROLLED
incidents. Emergency response to this type of call can be complex and require
specialist training and skills. Cornwall Fire and Rescue Service continues to update its
training programme and ensure firefighters are prepared to deal with these local
risks.
Under the Civil Contingencies Act 2004, Cornwall Fire and Rescue Service are a
category 1 responder and a partner in the Devon, Cornwall and Isles of Scilly Local
Resilience Forum (LRF). The forum includes representatives from police, fire and
ambulance services, health service providers, local councils, the Coastguard and
Environment Agency. As well as agencies and partners in the voluntary sector, Met
Office and utility companies. We work with the LRF to develop multi-agency local
emergency plans for risks within the local resilience area. The LRF ensures plans are
in place for a range of emergencies and these risks to the community are held within
a document called the Community Risk Register. These are regularly updated and
revised through multi-agency processes, exercising and testing, identifying any
lessons learned and areas for improvement.
Supporting the Local Resilience Forum
Cornwall Fire and Rescue Service is one of the partners forming Cornwall and Isles of
Scilly Local Resilience Forum. During the response to COVID-19 the service has taken
a lead role in coordinating Cornwall’s response to the pandemic. This includes
coordinating PPE deliveries to care homes and the NHS, driving ambulances to
support the ambulance service, re-deploying staff to other services within the
Council and supporting vulnerable people with food and medical supplies.
It is recognised there are risks from COVID-19 which will impact on the service
locally, regionally and nationally. The following risks have also been highlighted by
Devon, Cornwall and Isles of Scilly Local Resilience Forum 22:
• Failure of electricity network
• Flooding
• Industrial accidents and environmental pollution
• Influenza type disease
• Major air quality incident
• Major pollution of controlled waters
• Malicious threats
• Pro-longer low temperatures/ heavy snow/ice
22
Devon, Cornwall and Isles of Scilly Local Resilience Forum, The Community Risk Register 2018,
https://www.dcisprepared.org.uk/what-we-do/local-risks/
30Information Classification: CONTROLLED
• Volcanic eruption (gas rich and ash)
The Joint Emergency Service Interoperability Principles [2] sets out good practice on
how to work together when responding to emergencies. Cornwall Fire and Rescue
Service adopts these principles when working with partners to deal with major
incidents and emergencies requiring a multi-agency response. We always aim to
improve our joint working by using more scenario-based training to test ourselves in
realistic conditions. Our joint training includes working with our blue light emergency
service partners and also working alongside volunteer groups such as those involved
in cliff, mine and cave rescues, this is all aligned to our community risks.
Cornwall Fire and Rescue Service forms part of the Local Safety Advisory Group
(LSAG). The group ensures we have up to date and tested plans in place for large
events, such as the annual Boardmasters music and surfing festival held in Newquay.
There are a number of sites in Cornwall that represent a greater risk to the public
and firefighters. Our operational staff assess the risk posed by different premises
through the assessment and collection of site-specific risk information. This
information is captured on our Operational Risk Register which sets out when these
premises require a re-visit. Across Cornwall we have identified 66 high risk and 734
medium risk sites in Cornwall 23.
The G7 summit which will be held in Cornwall in June 2021 is a new event which
brings a multitude of risks. To prepare for this event the Service is working with local,
regional and national teams to plan for, train and respond to these risks.
The Control of Major Accident Hazards (COMAH) Regulations 1999 came into force
on 1 June 2015. COMAH aims to prevent and mitigate the effects of major accidents
involving dangerous substances which can cause serious damage/harm to people
and/or the environment. COMAH treats risks to the environment as seriously as
those to people. COMAH mainly affects the chemical industry but also some storage
activities, explosives sites, nuclear sites and other industries, where the threshold of
quantities of dangerous substances identified in the regulations are kept or used.
Cornwall Fire and Rescue Service monitors the risk posed by these sites and regularly
inspects them. There are three COMAH sites in Cornwall and the authority carries
out exercises to manage these risks once every three years.
23
Cornwall Fire and Rescue Service Operational Risk Register, December 2020
31Information Classification: CONTROLLED
What does the future hold?
Each year we look at a range of issues likely to impact on the service, our
communities and the way we operate over the next few years. The following
information has been taken from a variety of sources and research to understand
what is likely to happen over the coming years so that we can plan for and adapt to
these changes.
The COVID-19 pandemic of 2020 has impacted on all areas of the service and is likely
to cause repercussions for many months and years to come. The information in this
section explains how this and other issues could impact on our service over the next
few years.
Political
The political landscape has changed significantly Public perceptions of
during 2020 as governments and international governance has
organisations shift priorities to try to tackle and significantly altered and
recover from the pandemic. It has also significantly the window of what is
altered public perceptions of governance and the politically acceptable has
window of what is politically acceptable has broadened
broadened. Some sources predict a potential shift
away from liberal democracies and trend towards nationalism 24 as citizens compare
alternative models of governance and their success in handling the pandemic.
Countries that closed their borders early and their success in tackling the pandemic,
could also influence attitudes about globalisation, borders and immigration.
COVID-19 has, however, highlighted the need for global collaboration to work
together to tackle the virus. The innovation foundation, Nesta, has highlighted how
the virus could cause a widespread political shift: “As the coronavirus exposes
society’s fragility, and the interdependence of globalised industries, it might
12 ‘There will be no ‘back to normal’, April 9th 2020, NESTA, https://www.nesta.org.uk/blog/there-will-be-no-
back-normal/
32Information Classification: CONTROLLED
fundamentally change our worldviews. The power of the state, and public
perceptions of its role, will shift dramatically” 25.
Similarly, Cornwall Council’s response to the pandemic and role in protecting the
most vulnerable during this crisis has potential to drastically shift public perceptions.
Providing an opportunity to engage with the public and redefine how residents view
the services we provide. There has been a national outpouring of support for key
workers and better recognition of the work that they do. Within the fire and rescue
sector there has been greater understanding of the diverse roles fire and rescue staff
have in supporting Local Resilience Forums.
Research published by the Health Foundation and Ipsos MORI has shown that the
COVID-19 pandemic has led to increased public recognition of the role of the state in
supporting good health. Nearly 9 in 10 people (86%) now believe the national
government has a ‘great deal’ or ‘fair amount’ of responsibility for ensuring people
generally stay healthy, significantly up from 61% in 2018. Similarly, 76% see local
government as having responsibility for people’s health (up from 55% in 2018). The
survey also shows that over three-quarters (77%) of British people are concerned
about the impact of social distancing on the health and wellbeing of the nation, a
figure that rises to 83% among over 65s 26.
National context for fire and rescue
In 2019, Kit Malthouse was announced as the Minister of State for Crime, Policing
and the Fire Service within the Home Office. The Minister has responsibility for
policing, national fire policy, emergency services collaboration and national resilience
and fire programmes. The Chair of the National Fire Chiefs Council (NFCC) welcomed
the appointment as they begin working together to progress the reform of building
regulations outcomes from the Grenfell inquiry.
The National Fire Chiefs Council (NFCC) has a number of projects underway as part of
its transformation programme. This includes work to look at the medium and long-
term implications of the pandemic for the fire sector. Once complete the NFCC will
25 ‘There will be no ‘back to normal’, April 9th 2020, NESTA, https://www.nesta.org.uk/blog/there-will-be-no-
back-normal/
26
Public perceptions of health and social care in light of Covid-19, Health Foundation, June 2020,
https://www.health.org.uk/publications/reports/public-perceptions-of-health-and-social-care-in-light-of-
covid-19
33Information Classification: CONTROLLED
look at all learning points and feed this back into its Strategic Improvement Model
and the national strategy it is developing as well as improvement objectives and
programmes of work.
In 2021 there are plans to establish a business realisation function which will work
with fire and rescue services to provide support in the implementation of NFCC
products and standards. This work aims to build on work to improve standards within
the fire and rescue sector and provide greater consistency between services.
Protection is one area that is being prioritised to create similar standards between
services and the application of fire safety legislation. Funding is being made available
by Government to support increases in protection capacity and ensure consistency
between the way that risk-based inspection programmes are implemented in all fire
and rescue services.
The NFCC is working with Nottingham Trent University to establish the value of the
UK fire and rescue service in terms of prevention, protection and other interventions
undertaken. The Value of the UK Fire Service report is scheduled to be published in
May 2021 as well as Home Office economic metrics for statutory fire and rescue
responsibilities. It is hoped that this work will help to quantify the role that fire and
rescue services play in fire safety and prevention activities and will help to secure
further funding.
Work is also ongoing to develop a consistent definition of and understanding of risk
within the fire sector. This will feed into the development of Integrated Risk
Management Planning guidance and aims to promote greater consistency between
services and more centralised support for IRMP planning and management of risk.
Grenfell
Following the first phase of the Grenfell inquiry the Home Office has announced £20
million funding for protection activities for 2020/21 to implement the
recommendations from the report. The additional funding being provided recognises
the significant challenges protection departments have faced over recent years, as
well as the concerns set out by Her Majesty’s Inspectorate of Constabulary and Fire
and Rescue Services and the critical need demonstrated for increased investment in
this area. Of this funding, £10 million will be made available to fire and rescue
authorities to support wider fire protection priorities. Funding allocations were
34Information Classification: CONTROLLED
determined based on the building stock within authority areas; however each fire
and rescue authority will be able to use the funding for their protection priorities in
line with local Integrated Risk Management Plans.
Economic
Evidence from past pandemics suggests that the economic impact of the coronavirus
will arise much less from people falling ill or dying than from the public health
restrictions and social distancing required to limit its spread. This has reduced
demand for goods and services and the ability of businesses and public sector
institutions to supply them. That means lower incomes, less spending and weaker
asset prices, all of which reduce tax revenues, while job losses will raise public
spending 27,28.
The economic fallout The Institute for Public Policy Research has published
of the pandemic analysis which shows the economic fallout of the
could leave 1.1 pandemic could leave 1.1 million more people below the
million more people pre-COVID-19 poverty line at the end of 2020 including a
below the pre-COVID- further 200,000 children 29. The increase in child poverty
19 poverty line is driven by expected falls in income for 800,000
households with children. Before COVID-19, 16% of
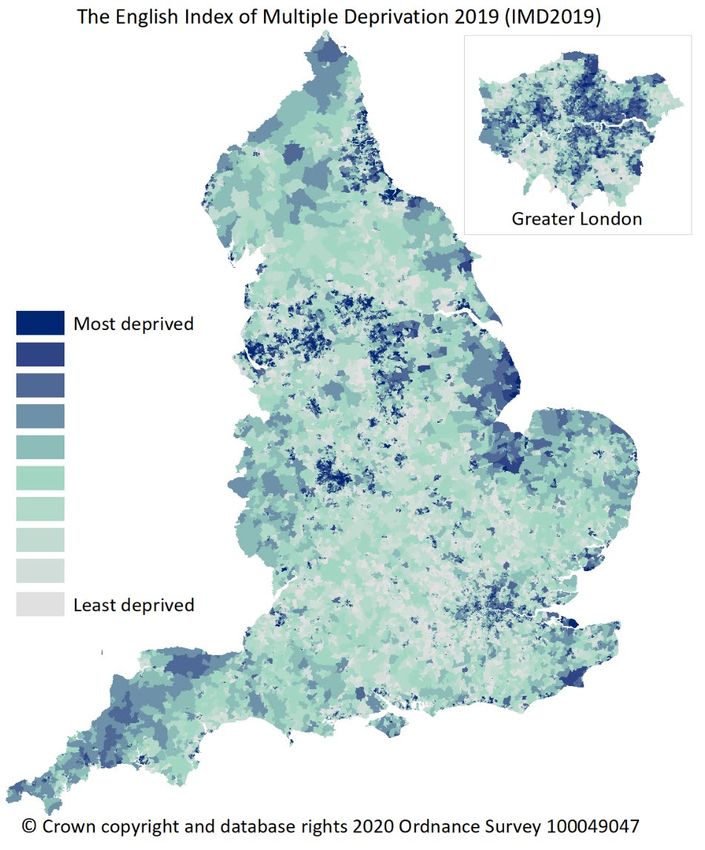
children were estimated to be living in poverty in Cornwall. Around 12.4% of the
Cornish population already live in the 20% most ‘deprived’ communities in England 30.
Evidence is already emerging that the educational gap is growing between children
from poorer and better off families. The Institute for Fiscal Studies notes that:
“children from better-off households are spending 30% more time each day on
educational activities than children from the poorest fifth of households” 31.
It is estimated that quarterly Gross Value Added (GVA) is down 34% in Cornwall and
that as many as 72,800 jobs2 are at risk of being lost due to lock down. This
constitutes 27% of all jobs in Cornwall. Universal Credit numbers for March and April
27
National Fire Chiefs Council Central Programme Office Update, Roy Wilsher, 20th May 2020
28
Office for Budgetary responsibility, April 2020, https://obr.uk/coronavirus-reference-scenario/
29 1.1 million more people face poverty at end of 2020 as a result of coronavirus pandemic, Institute for Public
Policy Research, https://www.ippr.org/news-and-media/press-releases/1-1-million-more-people-face-poverty-
at-end-of-2020-as-a-result-of-coronavirus-pandemic-finds-ippr
30
COVID-19 impact: financial precarity, Cornwall Council, May 2020
31
Education gaps are growing during lockdown, Institute for Fiscal Studies, May 2020,
https://www.ifs.org.uk/publications/14849
35You can also read


