SPAIN 2019 POVERTY WATCH - www.eapn.es - EAPN España
←
→
Page content transcription
If your browser does not render page correctly, please read the page content below
POVERTY WATCH
                      SPAIN
                            2019

Red Europea de Lucha contra la Pobreza y la Exclusión Social en el Estado
                               Español
                             www.eapn.es
POVERTY WATCH SPAIN - 2019

The European Anti-Poverty Network (EAPN) is a European Platform of Social Entities that
work and fight against Poverty and Social Exclusion in the European Union member
states. The EAPN seeks to promote the exercise of rights and duties of those people
suffering from poverty and social exclusion, breaking their isolation and improving their
situation. Its main objective is to place these issues at the centre of the political debates
of the European Union.

In Spain, the European Network for the Fight against Poverty and Social Exclusion in the
Spanish State (EAPN SPAIN) is a horizontal, plural and independent organization that
works to transfer this objective to the Spanish reality and to influence public policies, at
European, state, regional and local levels. It is currently composed of 19 regional
networks and 15 state-level organizations, all of them non-profit and with a common
component: the fight against poverty and social exclusion. In total, EAPN SPAIN
encompasses more than eight thousand social NGO throughout the State.

Among our objectives, shared with EAPN Europe, there is the implementation of a
working method to join forces with key actors in order to achieve greater and better
results in the fight for the eradication of poverty and social exclusion in Spain.

EAPN SPAIN
Red Europea de Lucha contra la Pobreza en el Estado Español
C / Tribulete, 18 Local, 28012 Madrid
+34 91 786 04 11 - eapn@eapn.es
www.eapn.es

Title:
POVERTY WATCH SPAIN 2019
Author:
Graciela Malgesini Rey
Graciela.malgesini@eapn.es

Edition:
EAPN SPAIN
October 2019

The total or partial reproduction of this document is allowed as long as the sources are
cited, respecting the content as it is edited without any misrepresentation or change.

                                                                                           2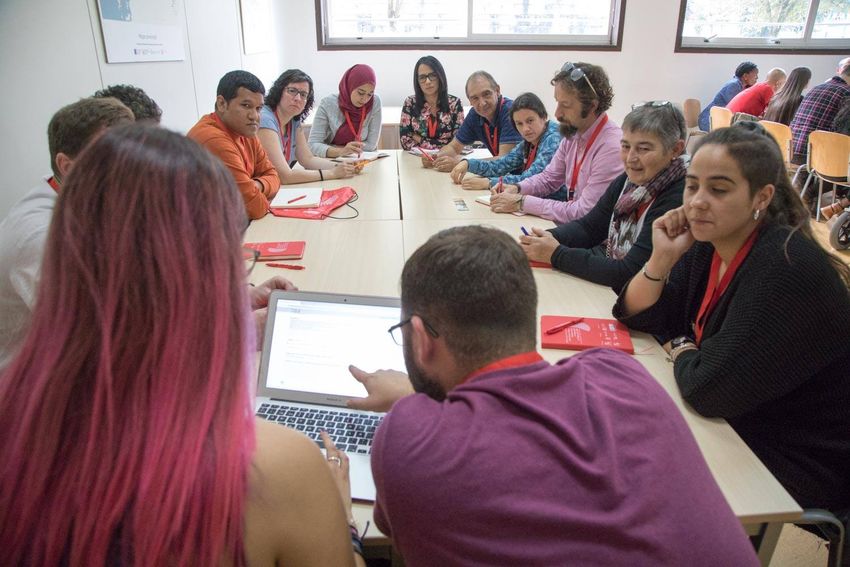
POVERTY WATCH SPAIN - 2019

Contents

   1.        EXECUTIVE SUMMARY ..................................................................................................... 4
   2.        Introduction .................................................................................................................... 6
   3.        Europe 2020 headline targets .......................................................................................... 6
   4.        AROPE, At risk of poverty and exclusion .......................................................................... 7
        4.1.           AROPE components.............................................................................................................................. 8
        4.2.           At-Risk of Poverty Gap........................................................................................................................ 12
        4.3.           “Severe At-Risk of Poverty” ................................................................................................................ 12
        4.4.           AROPE rates by sex ............................................................................................................................. 13
        4.5.           AROPE rates by age ............................................................................................................................ 14
        4.6.           AROPE rates by education attainment ............................................................................................... 16
        4.7.           AROPE rates by occupation situation ................................................................................................. 17
        4.8.           AROPE rates by nationality................................................................................................................. 18
        4.9.           AROPE rates by household type ......................................................................................................... 18
        4.10.          AROPE rates by Autonomous Communities ....................................................................................... 20

   5.        Incomeless households .................................................................................................. 21
   6.        Inequality ...................................................................................................................... 23
   7.        Poverty and Wellbeing .................................................................................................. 25
   8.        Poverty and Health ........................................................................................................ 26
   9.        Poverty and Overall Satisfaction with Life ...................................................................... 27
   10.            Poverty and Education .............................................................................................. 30
        10.1.          Regional disparities ............................................................................................................................ 30
        10.2.          Ghettoization...................................................................................................................................... 33
        10.3.          Bullying ............................................................................................................................................... 36
        10.4.          Affordability........................................................................................................................................ 41
        10.5.          Homologation of migrants’ diploma or school attainment certificates ............................................. 42
        10.6.          Examples of good practice in inclusive education .............................................................................. 45

   11.    Proposals and Recommendations made by the people experiencing poverty in the XII
   Meeting ................................................................................................................................. 50
        11.1.     Recommendations regarding the development of a Vital Minimum Income .................................... 51
        11.2.     What are the main obstacles to lower the cost of living and improve the purchasing power of
        families? What proposals can be made?............................................................................................................ 53
        11.3.     How can education prevent intergenerational transmission of poverty? How to avoid "school
        failure"? 54
        11.4.     How can we end unemployment?...................................................................................................... 56
        11.5.     Social protection against the risks of the life cycle. How can we strengthen the public social services
        system? What role should Third Sector organizations have? ............................................................................ 57
        11.6.     What are the main obstacles in housing? What proposals can we make to overcome these
        obstacles?........................................................................................................................................................... 58
        11.7.     Effectiveness and efficiency of policies. What recommendations could we make to improve
        coordination between public employment services and social services?.......................................................... 59
        11.8.     How should people in poverty and / or exclusion participate in the monitoring and evaluation of the
        policies applied? ................................................................................................................................................. 60

   12.            The Spanish Strategy Against Energy Poverty ............................................................ 61
   13.            The Spanish Anti-Poverty Strategy 2019-2023 ........................................................... 63

                                                                                                                                                                               3
POVERTY WATCH SPAIN - 2019

1. EXECUTIVE SUMMARY

The decade 2008-2018 is a great loss for social progress. To meet the Europe 2020 Strategy’s
national target, the number of people at risk of poverty and / or social exclusion should be reduced
by 2.3 million in the next year. If we do not move in the right direction, Spain will also fail to comply
with the principles of the EU Social Rights Pillar and with the United Nations Sustainable
Development Goals.

The report describes the average situation for Spain, with a reference to the territorial disparities
which are reflected in all AROPE and inequality indicators. The country is divided into two halves:
from Madrid to the north, the Autonomous Communities have low AROPE rates, between 3 and
14 percentage points below the national average, similar to those of the most advanced European
countries. Moreover, the Southern Autonomous Communities have extraordinarily high rates,
between 4 and 18 percentage points above the national average.

The current rate of AROPE, 26.1%, is 2.3 percentage points above the rate of 2008. In this decade,
the number of people in AROPE has gone from 11 to 12.2 million (of which 10 million are only at
risk of poverty, not in severe material deprivation, or in a low-work intensity household). The
chronicity of poverty is linked to the persistent inequality rate: 20% of the population with the
highest income level multiply by six the income of the 20% with the lowest income level. The
economic recovery only benefited those quartiles with higher income levels, while the groups with
the lowest purchasing power have not yet reached their 2008 level. Some 2.6 million people (5.7%)
live in severe poverty (poverty risk threshold at 30% of the median), a figure that rises to 4.3 million
people (9.2%), if the threshold is stated at 40 % of the median.

Although the AROPE rate is slowly decreasing since 2014, the situation of women does not improve
in equal terms with men (the female AROPE is 27%, 2 points more than the male AROPE, which is
25.1%); this gender inequality is repeated in all age groups. Regarding the age groups, the most
affected are young people, aged 16 to 29 (33.8 %), followed by children and adolescents (29.5%),
which are still very high. Education and employment are not totally determinant of social mobility,
a trend that consolidates through time. Although still an important factor, having a higher
educational level than the basic one does not prevent the risk of being in poverty or exclusion.
Those with lower secondary education have the highest rate of AROPE, almost 34%. A fifth of those
with tertiary education are also in AROPE (12.6 %). Unemployment is crucial to determine the risk
of falling into poverty and social exclusion, affecting almost 6 in 10. The unemployed have
registered an increase in their AROPE rate of 16.8 percentage points since 2008. However, 3 out
of 4 people in AROPE do not live in homes with low-work intensity, which means that having a job
is not enough to avoid poverty or material deprivation. The non-EU resident population has the
highest AROPE rate (56%), followed by the EU citizens (47.7%) and the Spanish (23.1%). Although
AROPE rates among the foreign population are very high, they are not many within the population
group who is in AROPE: 82.8% are Spanish and only 17.2% are foreigners. The type and
composition of households are determining factors for the risk of poverty and exclusion: 50% of
single-parent households are affected (2 percentage point increase between 2017 and 2018) and
all households with children or adolescents have higher rates than those where there are adults
only.

                                                                                                       4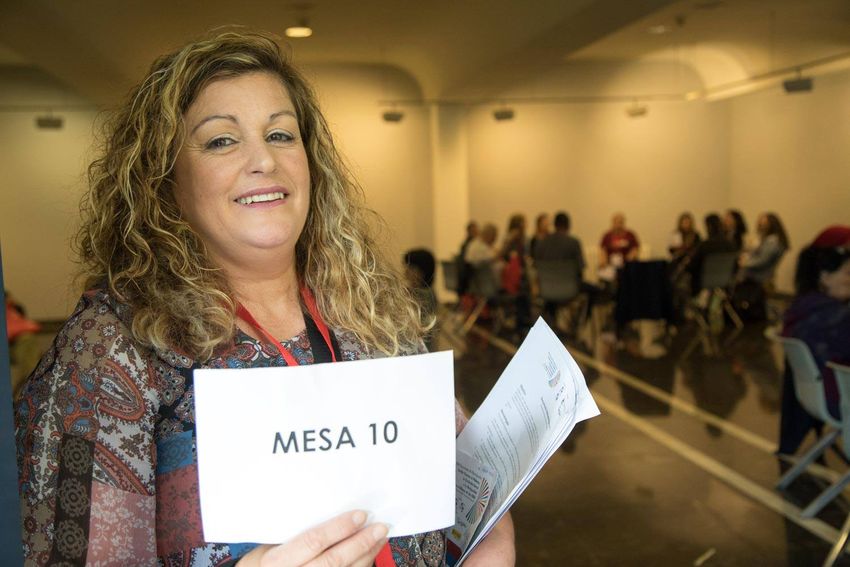
POVERTY WATCH SPAIN - 2019
For the first time this Report analyses the relationship between poverty and wellbeing, health,
satisfaction with life and education.
In order to address these complex and severe social realities, we present the proposals and
recommendations elaborated by people experiencing poverty, at the EAPN Annual meeting of
Participation, which took place in Santiago de Compostela, in June 2019. The first set is referred to
Minimum Income; the following are related to education and the inter-generational transmission
of poverty; the unemployment and precarious work; social protection (Social Services and
Employment Services); housing; the effectiveness and efficacy of policies and finally, the
participation and involvement of people experiencing poverty.
In 2019, the Spanish Government launched a Strategy Against Energy Poverty and the National
Strategy for the Prevention and Fight Against Poverty and Social Exclusion 2019-2023, which are
also described in this Report. EAPN SPAIN was involved in these Strategy’s debates and follow-up,
in representation of the Third Sector Platform and as a member of the National Council of NGOs,
a consultation body at the Ministry of Health, Consumption and Social Welfare.
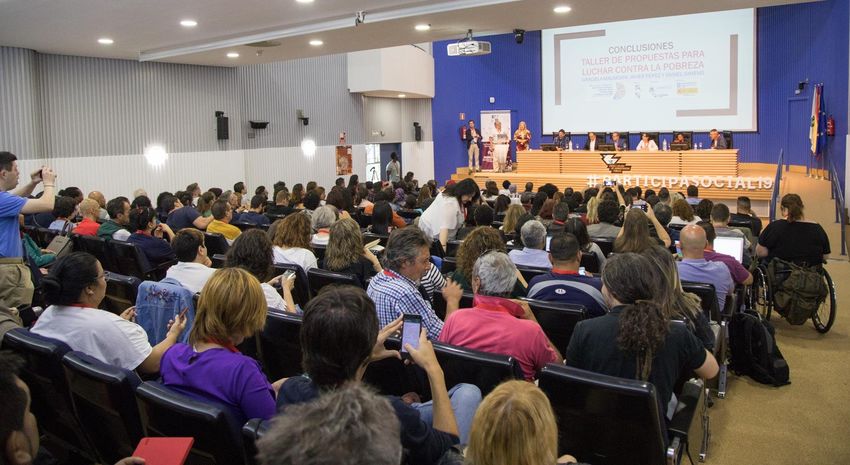
Picture of participants at the EAPN Spain XIII National Meeting of Participation “Fight Against Poverty,
Social Exclusion and Inequality, in the Framework of the Sustainable Development Goals”, presenting the
campaign “Against Aporophobia”, at the Santiago de Compostela Square, Galicia, 2019.
https://eapn.es/contraporofobia/
5
POVERTY WATCH SPAIN - 2019

2. Introduction
In Spain, the different manifestations of poverty and social exclusion are a shortage of
income, lack of decent housing, material deprivation, more difficult educational and
healthcare paths due to hardships, poverty of families living in disadvantaged
environments, and limited or truncated access to basic services. Women, non-EU
migrants, young people and single-parent families tend to be more affected by poverty.

            The Poverty Watch 2019 describes the key characteristics of poverty
              and social exclusion in Spain and presents the main features of an
            Anti-Poverty Strategy, aimed at the eradication of poverty and social
                                                 exclusion.

3. Europe 2020 headline targets
On March 3rd, 2010, the European Union presented the Commission Communication
entitled "Europe 2020, a strategy for smart, sustainable and inclusive growth", with
common headline targets for economic and social development. To meet these targets,
Member States made specific commitments and generated reform programs to achieve
them. Within these commitments, for the period 2009-2019, the Spanish government
adopted the objective of "reducing between 1,400,000 and 1,500,000 the number of
people at risk of poverty and social exclusion, according to an aggregate indicator that
includes people who live below the poverty line (relative poverty); people who suffer
severe material deprivation, and people who live in homes with low or no employment
intensity. The reduction of child poverty would be carried out in a proportion similar to
the reduction of poverty in general ".1

EUROSTAT set up the AROPE (At Risk of Poverty and / or Exclusion) indicator, including
and combining the three abovementioned sub-indicators, as well as a standardized
methodology for its annual calculation in each of the EU countries.

Since 2011, the European Network for the Fight against Poverty and Social
Exclusion (EAPN SPAIN)2 analyses the AROPE evolution in Spain and the degree of
compliance with the Spanish commitments in our annual Report “The State of

1 Programa Nacional de Reformas de España 2011. Madrid: Ministerio de Sanidad, Servicios Sociales e Igualdad.
https://www.msssi.gob.es/ssi/familiasInfancia/inclusionSocial/inclusionSocialEspana/programasNacionales/docs/pnr
Espana
2 https://www.eapn.es/

                                                                                                              6
POVERTY WATCH SPAIN - 2019

Poverty”.3 Its objective is to present a vision -as complete as possible- of the incidence
and intensity of poverty and social exclusion, at the national and regional levels, and to
evaluate the degree of progress towards our social inclusion target, specified in the
European 2020 Strategy.

4. AROPE, At risk of poverty and exclusion
A decade has been lost with respect to social progress. Months before the deadline set
by the EU2020 Strategy, we are still far from even getting to the starting 2009 figures
and today there are around 12 million people who are at risk of poverty and exclusion,
which is 26.1% of the resident population in Spain.

               In order to meet the target, set by Spain in Europe 2020, the number of
             people at risk of poverty and/or social exclusion should be reduced by 2.3
             million in the next year. The AROPE rate in Spain is 4.2 percentage points
                higher than the EU average and the seventh-highest (after Bulgaria,
             Romania, Greece, Lithuania, Italy and Latvia). It increased 2.8 percentage
                 points since 2008; this is the fifth-highest growth among the EU 28.

Although the population at risk of poverty and exclusion (AROPE) dropped from 26.6%
to 26.1%, Spain is still far from meeting the goal of the Europe 2020 Strategy and even
returning to the 2008 values.

    Graph 1.      Evolution of the AROPE rate 2008-2018 (% of the population)

                                                             29,2     28,6
                                          27,2      27,3                        27,9
                        26,1     26,7                                                      26,6        26,1
     23,8      24,7

                                                                                The AROPE rate should be
                                                                                reduced by 2.3 percentage
                                                                                points just to return to the
                                                                                     2008 situation.

     2008     2009     2010      2011     2012     2013      2014     2015     2016        2017        2018

Source: Living Conditions Survey, published in 2019, by the National Institute of Statistics of Spain

3Juan Carlos Llano (2019). XIX Informe sobre el Estado de la Pobreza. Seguimiento del indicador de
riesgo de pobreza y exclusión social en España. EAPN Spain. Madrid: EAPN Spain.
                                                                                                               7
POVERTY WATCH SPAIN - 2019

The following statistical analysis shows that the economic recovery has not reached all
the population, that inequality level remains high, that certain groups have lost a big
proportion of their purchasing power in real terms in the last decade and consequently
that the risk of poverty and exclusion rate, although descending, will not allow to deliver
on the Poverty Headline Target, committed by the Spanish Government with regard to
the EU2020 Strategy.

Despite the improvement of the AROPE rate in the last four years, which has been
reduced by 3.1 percentage points, there are still another 2.3 points to reach the situation
of 2008. In addition, achieving the objective would mean adding as minimum of three
percentage points to the outstanding figure, which means that the committed goal is
still more than five points away, that is, just over 2,3 million people. At the time,
reducing the rate by three percentage points over 10 years was not a particularly
ambitious goal. However, it does not seem possible that it can be met anyway.

This is not just the breach of the targets committed to in the EU 2020 strategy. Many of
the results offered in this report go in the opposite direction of the principles gathered
in the European Pillar of Social Rights, proclaimed in Gothenburg, in 2017, and in the
Sustainable Development Goals, of the UN 2030 Agenda.

    4.1.          AROPE components
The AROPE rate is an indicator composed by three sub-indicators that represent three
population groups: people in relative poverty or at-risk-of poverty,4 people with severe

4 We prefer to use the term “relative poverty” instead of “At risk-of-poverty” to facilitate comprehension
and to avoid often confusion between this and the AROPE, “At risk of poverty and exclusion”. The at-risk-
of-poverty rate is the share of people with an equivalized disposable income (after social transfer) below
the at-risk-of-poverty threshold, which is set at 60 % of the national median equivalized disposable income
after social transfers. This indicator does not measure wealth or poverty, but low income in comparison to
other residents in that country, which does not necessarily imply a low standard of living.
The at-risk-of-poverty rate before social transfers is calculated as the share of people having an equivalized
disposable income before social transfers that is below the at-risk-of-poverty threshold calculated after
social transfers. Pensions, such as old-age and survivors’ (widows' and widowers') benefits, are counted as
income (before social transfers) and not as social transfers. This indicator examines the hypothetical non-
existence of social transfers. The persistent at-risk-of-poverty rate shows the percentage of the population
living in households where the equivalized disposable income was below the at-risk-of-poverty threshold
for the current year and at least two out of the preceding three years. Its calculation requires a longitudinal
instrument, through which the individuals are followed over four years.
                                                                                                             8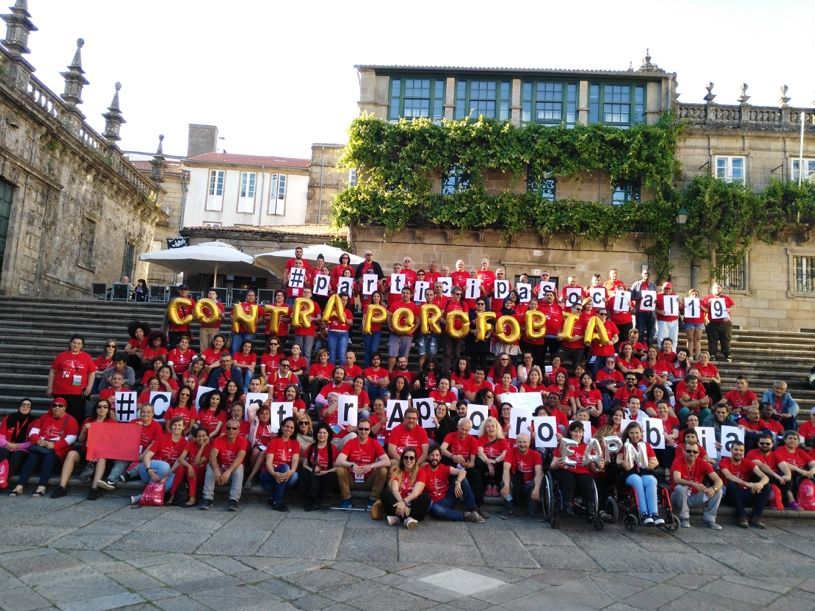
POVERTY WATCH SPAIN - 2019

material deprivation5 and people in households with low work intensity6. Someone who
is in any of the three is in AROPE as well; however, individuals can only be counted only
once, even if they are included in more than one sub-indicator.

The Venn Diagram shows the seven population groups that are obtained by combining
the AROPE sub-indicators.

In the first place, the people who are at poverty risk rate -which reaches 21.5% of the
population, that is just over 10 million people- are divided as follows:

    1. People who are in relative poverty and do not suffer from severe material deprivation
       or live in households with low work intensity. These are almost 2/3 of the group and
       account for 14.4% of the population. In 2018 they were 13.7%.
    2. People who are in relative poverty and live in households with low work intensity, but
       do not suffer from severe material deprivation. They are approximately one fifth of the
       total group and make up 3.6% of the total population. In 2018 they were 4.7%.

5 Material deprivation refers to a state of economic strain and durables, defined as the enforced inability
(rather than the choice not to do so) to pay unexpected expenses, afford a one-week annual holiday away
from home, a meal involving meat, chicken or fish every second day, the adequate heating of a dwelling,
durable goods like a washing machine, color television, telephone or car, being confronted with payment
arrears (mortgage or rent, utility bills, hire purchase instalments or other loan payments).
The material deprivation rate is an indicator in EU-SILC that expresses the inability to afford some items
considered by most people to be desirable or even necessary to lead an adequate life. The indicator
distinguishes between individuals who cannot afford a certain good or service, and those who do not have
this good or service for another reason, e.g. because they do not want or do not need it. The indicator
adopted by the Social protection committee measures the percentage of the population that cannot afford
at least three of the following nine items:
     1. to pay their rent, mortgage or utility bills;
     2. to keep their home adequately warm;
     3. to face unexpected expenses;
     4. to eat meat or proteins regularly;
     5. to go on holiday;
     6. a television set;
     7. a washing machine;
     8. a car;
     9. a telephone.
Severe material deprivation rate is defined as the enforced inability to pay for at least four of the above-
mentioned items.
6 The indicator persons living in households with very low work intensity is defined as the number of

persons living in a household where the members of working age worked less than 20 % of their total
potential during the previous 12 months. The work intensity of a household is the ratio of the total number
of months that all working-age household members have worked during the income reference year and the
total number of months the same household members theoretically could have worked in the same period.
A working-age person is a person aged 18-59 years, with the exclusion of students in the age group between
18 and 24 years. Households composed only of children, of students aged less then 25 and/or people aged
60 or more are completely excluded from the indicator calculation.
                                                                                                          9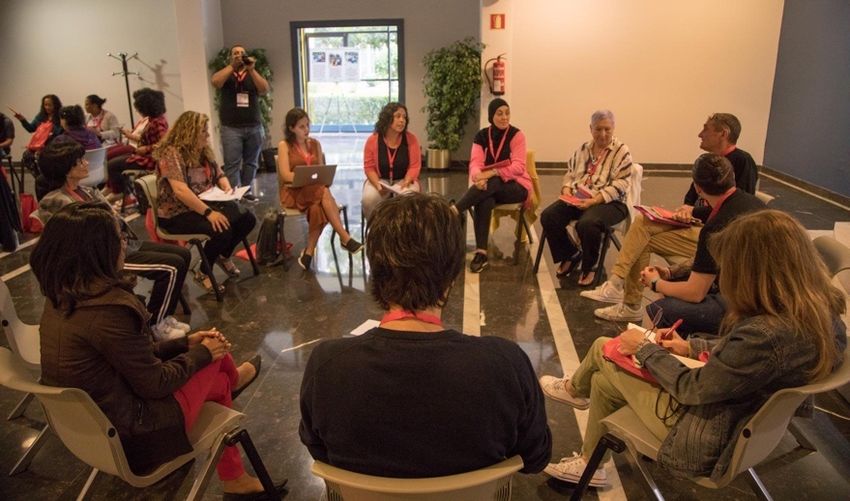
POVERTY WATCH SPAIN - 2019

   3. People who are in relative poverty and suffer from severe material deprivation but are
      not part of a household with low labour intensity. They are approximately one twelfth
      of the total group and account for 2.1% of the total population. In 2017 they were
      1.6%.
   4. The group of people who are in relative poverty, suffer severe material deprivation
      and live in homes with low labour intensity, which reaches 1.4% of the total
      population. In 2018 it was 1.7%.

Secondly, those people who are not in relative poverty, but are either in severe material
deprivation, live in a home with low work intensity, or suffer both problems. They are
4.6% of the population, that is, just over 2.1 million people. They are divided into three
groups:

   5. People who are only in low work intensity households and are not in relative poverty,
      nor in severe material deprivation. This group accounts for 2.7% of the population. In
      2017 this group was 9.7%.
   6. People who are not in relative poverty but are in low-work intensity and in severe
      material deprivation at the same time. They are very few and only represent 0.3% of
      the population. Last year they were 0.2%.
   7. People who are in severe material deprivation but are not in relative poverty and do
      not live in households with low-work intensity. They represent 1.6% of the population,
      the same figure as the previous year.

                                                                                         10
POVERTY WATCH SPAIN - 2019
Graph 2. AROPE sub-indicators and intersections
Poverty + LWI+SMD: 1.4%
+669,337 people
Poverty + SMD: 2.1%,
937,103 people
Only POVERTY 14.4%
6,735,115 people
POVERTY
SMD Only Severe
Material
Deprivation
1.6%, 736.157
Poverty + LWI:
people
3.6%
Only Low-Work LWI
1,688,401 people
Intensity 2.7%,
SMD + LWI: 0.3%
1,240,567 people 145,608 people
Population in AROPE in 2018: 26.1% 12,188,288 persons
Population not in AROPE: 73.9%
Total population: 46,722,980
SOURCE: LLANO, JUAN CARLOS (2019) LOC.CIT.
The macroeconomic recovery is far from effectively reaching all people. On the one
hand, poverty reduction has been minimal: only eight tenths below its historical
maximum. In this regard, the reduction in AROPE is mainly due to the significant
decrease in the Low-work intensity indicator, which has diminished by 6.4 percentage
points since 2014. Severe material deprivation, the third component of AROPE, has
ended with four years of uninterrupted reduction and this last year has increased to
5.4%. With respect to the initial value, it is 1.8 percentage points above. It seems little,
but it is a lot, because it amounts to a 50% increase.
The most important thing is what concerns the distribution of the consequences of the
economic crisis. This Report shows the clear worsening of the living conditions of the
poorest people, the increasing gender-based differences, the weight of socioeconomic
11POVERTY WATCH SPAIN - 2019
determinants (such as the type of household, the educational level…) and the
reinforcement of regional disparities.
4.2. At-Risk of Poverty Gap
The Relative Median At-Risk-of Poverty Gap is a measure to analyse the intensity of
poverty. In order to measure inequality, we utilize the percentages of people in
severe/extreme poverty, with two thresholds: 30% and 40% of the median income. With
these indicators, it is possible to have a clear vision on how poor the poor people are
and how far, in terms of income, they remain from the rest of the social groups.
The individual poverty gap of a poor person is equivalent to the amount of money they
would need to enter to stop being, that is, the difference between their net income and
the poverty line. In order to make comparisons possible, it is necessary that this
difference be expressed as a percentage of the poverty threshold.7 The evolution of this
indicator shows a reverse of the tendency, from 2017 to 2018. However, the effort
needed to overcome this gap is still higher than in 2008.
Graph 3. Poverty Gap
2015; 33,8%
2017; 32,4%
2014; 31,6% 2016; 31,4%
2012; 30,6% 2013; 30,9%
2011; 27,4%
2010; 26,8%
2008; 25,6% 2009; 25,7%
2018; 28,5%
SOURCE: JUAN CARLOS LLANO (2019), LOC. CIT.
4.3. “Severe At-Risk of Poverty”
Those who earn less than half of the income considered as the poverty risk threshold
are in severe poverty. That is, those who live with less than 30% of the median income
of the year.
In 2018, approximately 5.7% of the population, about 2.6 million people, live in severe
poverty. This means that approximately one third of the population at risk of poverty is
7In 2018, the poverty threshold was € 8,871 per year and, if a person earns only € 7,000 per year, he/she
may need € 1,871 more in order to stop being poor; in this case, his/her poverty gap is 21%.
12POVERTY WATCH SPAIN - 2019
in "severe poverty." The figure represents a reduction of 1.2 percentage points
compared to 2017, that is, about 500,000 people less.
If it is calculated with a threshold equivalent to 40% of the median income, 9.2% of the
Spanish population are in severe poverty, that is, about 4.3 million people, who are just
under half of the population who is at risk of poverty. In 2018, men and women are in
“severe poverty” in similar percentages.
Graph 4. “Severe poverty” by sex, considering 40% and 30% of Income Median
9,10% 9,20%
5,60% 5,80%
Men Women
Severe poverty (30% of median) Severe poverty (40% of median)
SOURCE: JUAN CARLOS LLANO (2019), LOC. CIT.
Severe poverty reaches 16.8% of the foreign population of the European Union and
18.7% of the non-EU. These figures, despite registering a decrease with respect to the
data of the previous year, are extraordinarily high and multiply by four those recorded
among the Spanish population.
4.4. AROPE rates by sex
In the last two years, female rates have been higher than men rates, which indicates
that the economic recovery is not benefitting both sexes in equal terms. In 2018, there
are 700,000 more women in AROPE, than men (6.4 and 5.7 million respectively).
13POVERTY WATCH SPAIN - 2019
Graph 5. Evolution of the AROPE Indicator 2008-2018 by sex (% of the female and male
populations)
2008 23,8 22,4 25,1
2009 24,7 23,8 25,6
2010 26,1 25,5 26,7
2011 26,7 26,1 27,4
2012 27,2 27,3 27,2
2013 27,3 27,9 26,7
2014 29,2 29,4 28,9
2015 28,6 29,0 28,3
2016 27,9 28,0 27,9
2017 26,6 26,0 27,1
2018 26,1 25,1 27,0
TOTAL MEN WOMEN
Source: Living Conditions Survey, published in 2019, by the National Institute of Statistics of Spain.
Women have higher rates in AROPE, risk of poverty, severe material deprivation, low
intensity of employment at home, severe poverty and all variables related to the labour
market. Although the differences are not very high, the evolution is increasing in most
of them and the tendency to deteriorate the situation of women with respect to men is
clear. In addition, the improvement of some indicators registered in recent years also
has clear differences by sex. Thus, for most of them, the decline has been much more
intense among the male population. A clear example is the poverty risk rate that, after
being reduced for two consecutive years, registers the highest value of the entire
historical series for women.
4.5. AROPE rates by age
In 2018, regarding the age-groups, women have higher percentages of AROPE rates in
every category. The age group most affected is composed by young people, from 16 to
29 years old; those who are less than 18 years old (minors or children) are almost 3 out
of 10 in AROPE.
14POVERTY WATCH SPAIN - 2019
Graph 6. AROPE rates by sex and age groups
37,2
33,8
29,9 30,5 30,8
28,8 29,5
27,7 27,5 27,8 27,6 28,4
25,5
24,4
23,3
18,7
17,6
16,3
Less than 16 years 16-29 30-44 45-64 65 and more Less than 18 years
old old
Men Women Total
Source: Living Conditions Survey, published in 2019, by the National Institute of Statistics of Spain.
Most of the differences between adults and children are related to their respective
poverty rates, which have been very remarkable in 2008 and less significant -by 3
percentage points- 10 years later, due to the decline of child poverty and the rise of
adult poverty rates.
Graph 7. Differences in At-risk of poverty rates between adults (18-64) and children
(under 18)
Children (under 18 years old)
30,0%
28,0%
26,0%
24,0%
22,0%
20,0%
18,0%
Adults (18-64 years old)
16,0%
2008 2009 2010 2011 2012 2013 2014 2015 2016 2017 2018
SOURCE: JUAN CARLOS LLANO (2019), LOC. CIT.
15POVERTY WATCH SPAIN - 2019
4.6. AROPE rates by education attainment
Comparing the years 2008 and 2018, there is an outstanding conclusion: education
attainment could not refrain the risk of becoming poor or excluded. In fact, those with
lower secondary education hold the highest AROPE rate, followed by those with primary
education and, thirdly, those with upper secondary education. Although with the lowest
rate, 12.6% of people with an university degree are at risk of poverty and exclusion.
In the last year there has been a certain reduction of the rates held by those with lower
secondary, upper secondary and tertiary levels, and an increase of those with primary
education level.
Graph 8. AROPE rates according to education attainment levels (people aged 16 and
over).
2018 25,6 33,7 33,8 25,5 12,6
2017 25,7 32,0 34,5 25,1 13,5
2016 27,2 31,5 37,9 26,2 14,5
2015 27,8 32,0 39,0 27,6 13,8
2014 28,1 31,6 38,7 27,5 15,3
2013 26,6 32,5 35,1 25,4 13,3
2012 26,5 33,1 33,7 24,7 13,6
2011 25,9 34,5 30,6 22,1 13,8
2010 25,2 34,7 30,1 22,1 11,2
2009 23,7 34,0 26,5 20,0 10,6
2008 22,7 32,8 25,4 18,9 9,8
Total Primary Education (or less) Lower Secondary Education
Upper Secondary education Tertiary Education
Source: Living Conditions Survey, published in 2019, by the National Institute of Statistics of Spain.
If we compare the decade 2008-2018, those with the lowest level experienced a small
worsening of their AROPE rate, less than 1 percentage point. For those with lower
secondary education, the AROPE rate increase was the highest, with 8.4 percentage
16POVERTY WATCH SPAIN - 2019
points; this tendency is steady since 2012. Considering those with upper secondary
education, the increase in AROPE is 6.6 percentage points in a decade. Finally, those
with university level also suffered a 2.8 percentage points increase of the AROPE rate.
Graph 9. Comparison between AROPE rates according to education attainment, 2008
and 2018 (people aged 16 and over).
32,8 33,7 33,8
22,7 25,6 25,4 25,5
18,9
8,4 9,8 12,6
6,6
2,9 0,9 2,8
Total Primary Education (or Lower Secondary Upper Secondary Tertiary Education
less) Education education
2008 2018 Difference 2018-2008 in percentage points
Source: Living Conditions Survey, published in 2019, by the National Institute of Statistics of Spain.
4.7. AROPE rates by occupation situation
In 2018, considering the occupational situation of the population, at present, the lowest
AROPE rate corresponds to retired persons, followed by that of occupied persons (the
differences are less than 0.4 percent for each category, except for those who are
inactive, who experienced a 2 percentage points reduction in the last year). Almost 6
out of 10 unemployed people are in AROPE; This group has registered an increase in
the risk of poverty and exclusion of 16.8 percentage points since 2008, the highest of
all.8
Graph 10. AROPE rates by relation to the activity (people aged 16 and over).
58,9 59,2
42,1
37,6 36,4 35,6
25,6 25,7 22,7 23,5
16 16,3 13,4 15,1 15,4
16,8
2,9 2,6 2
Total Occupied Unemployed Retired -8,4 Other inactive
2018 2017 2008 2018-2008
Source: Living Conditions Survey, published in 2019, by the National Institute of Statistics of Spain.
8In Europe, the countries with the highest partial employment rates are those with the lowest levels of
unemployment, a trend that is not met in Spain.
17POVERTY WATCH SPAIN - 2019
The non-EU population has the highest rate, with 56% in AROPE, followed by the EU
population, with 47.7%, and the Spanish, with 23.1%.
4.8. AROPE rates by nationality
Between 2017 and 2018, the situation of the foreign EU population worsened, with an
increase in the AROPE rate of 6.9 percentage points. At the same time, there was a 2.7
percentage points decrease in the rate of non-EU population. The Spanish, with the
lowest rate, suffered almost no change.
Although AROPE rates among the foreign population are very high, not many people in
AROPE are foreigners. In 2018, considering people in AROPE, 82.8% are Spanish and only
17.2% are foreigners.
In the last decade, the EU population experienced the largest increase in AROPE, 4.3
percentage points. The Spanish followed, with 3.7 percentage points of increase. Finally,
the non-EU grew by 3, 1 percentage points.
Graph 11. AROPE rates by nationality (people aged 16 or over)
58,7
56
52,9
47,7
43,4
40,8
25,6 25,7
22,7 23,1 23,4
19,4
2,9 3,7 4,3 3,1
Total Spanish EU Non-EU
2018 2017 2008 2018-2008
Source: Living Conditions Survey, published in 2019, by the National Institute of Statistics of Spain.
4.9. AROPE rates by household type
Household type and composition are determinant to being in AROPE. One in two
single-parent households are in AROPE. These households have the highest rates today
and throughout the decade. In second place, 33.6% of "other households with
dependent children” (adults who are not the children parents) are at risk of poverty and
exclusion as well. In all households where children live, the AROPE rate is higher than in
those with adults only.
18POVERTY WATCH SPAIN - 2019
Between 2017 and 2018, the most significant change affected single-parent households,
which suffered a rate increase of 2.1 percentage points, while in the rest of household
types there was a reduction.
Analysing the variations between 2008 and 2018, the largest increase in the AROPE rate
occurred among households without dependent children, with 8.7 percentage points,
from 14% to 22.7%. In that period, single-parent households increased 5 percentage
points, the second largest increase, from 45% to 50%. Third, the rate of "other
households with dependent children" increased from 29.6 to 33.6, that is, a rise of 4
percentage points.
Graph 12. AROPE rate by household type
50 47,9
45
33,8 33,635,5
29,6
26,1 26,6
23,8 25,9 26,9 25,8 26,624,2
22 22,1 22,3 22,7 22,9
14
8,7
5 4
2,3 1,6
-0,3
Total Single person 2 adults without Other Single parent 2 adults with 1 or Other
-7,9
household dependent households with 1 or more more dependent households with
children without dependent children dependent
dependent children children
children
2018 2017 2008 2018-2008
Source: Living Conditions Survey, published in 2019, by the National Institute of Statistics of Spain.
Graph 13. AROPE, Relative Poverty and Severe Material Deprivation by household with or
without children
deprivation
Without children 4,80%
material
Severe
With children 6,00%
Without children 17,10%
At risk of
poverty
With children 25,90%
Without children 23%
AROPE
With children 29,10%
SOURCE: JUAN CARLOS LLANO (2019), LOC. CIT.
19POVERTY WATCH SPAIN - 2019
4.10. AROPE rates by Autonomous Communities
Territorial disparities are reflected in all the AROPE and Inequality indicators and are a
fundamental factor for the breach of the targets set in the EU 2020 strategy. Spain is
divided into two halves: from Madrid to the north, the Autonomous Communities
present low rates of poverty and / or social exclusion - between 3 and 14 percentage
points below the national average - and in general compatible with those of the most
advanced European countries. The southern Autonomous Communities and Cities, on
the other hand, show extraordinarily high rates - between 4 and 18 percentage points
above the national average.
Graph 14. AROPE by Autonomous Communities in Spain
SOURCE: JUAN CARLOS LLANO (2019), LOC. CIT.
This territorial inequality has grown: Autonomous Communities with the highest and
lowest AROPE rate register a difference of 32.6 percentage points, which is the highest
of the decade. This difference, although it has reduced 0.8 points this year, is three
percentage points higher than in 2009 and seven percentage points higher than the
lowest difference recorded (23.8 p.p., in 2013).
20POVERTY WATCH SPAIN - 2019
Graph 15. Maximum distance in percentage points of AROPE values among Autonomous
Communities
44,9 44,6 44,3 44,6
43,2
40,3 40,3
37,9 38,2 38,4 38,3
30,4
28,3
31,6 32,6
29,3 30,2 30,8
27,8 26,5 25,3
23,8
13,8 13,1 14,5 14,5 13,5
12,0 13,0 13,0 12,1
10,4
8,6
2008 2009 2010 2011 2012 2013 2014 2015 2016 2017 2018
SOURCE: JUAN CARLOS LLANO (2019), LOC. CIT.
In terms of income, only six Autonomous Communities have recovered the average
income per person they had in 2009.
5. Incomeless households
According to the EPA (Survey of Active Population, National Institute of Statistics),
households without income earners are considered to be those in which none of its
members declare to have work, receive a retirement or other pension or receive
unemployment benefits, whether or not they are registered as applicants for job. They
are 544,700 in the second quarter of 2019.
The number of households with no income with at least one child or adolescent is still
much higher than before the crisis (there are 43.4% more households in this situation
than in the first quarter of 2008). In addition, their relative weight with respect to total
households without income remains 3 percentage points higher than before the crisis
(19.9%).9
Graph 16. Incomeless households (grey line) and incomeless households with at least a
child or adolescent (red line)
9 Although the indicator “Households with no income” with at least one child captures very narrowly the
economic vulnerability of childhood, it is one of the few ways to approach this type of realities within a
relatively close time frame. The quarterly nature of the EPA data offers a greater temporal proximity than
other indicators obtained annually (based on the Survey of Living Conditions) and it is also important as it
is published more frequently (more than one year after that the data has been generated).
21POVERTY WATCH SPAIN - 2019
Source: EPA, Encuesta de Población Activa, 2007 a 2019
The economic crisis and the gaps in social protection have contributed decisively to the
rise of households without income, those that have been immersed in a situation of
special helplessness. The maximum point is reached at the end of 2013 with 773,200
households, a figure which doubles the beginning of 2008 figure. Although the situation
has improved, the number of households without income is still around 29.2% higher
than at the beginning of the crisis.
Households without income with dependent children are particularly vulnerable.
Incomeless households with at least one minor represent 22.7% of the total number of
incomeless households, according to the latest data available for the second quarter of
2019. This means that practically in one of every four incomeless households lives at
least one child or adolescent.
Compared to the overall number of incomeless households, the impact of the crisis has
been greater for households with children. In 2013, at the crisis’ peak, its number
tripled that of 2008. Although from that moment there is also a downward trend, the
number of incomeless households with at least one minor is still far higher than at the
beginning of the crisis, and the reduction registered in the years of recovery is
significantly less relevant than that observed for the total number of incomeless
households. In the second quarter of 2019 the number of households in this situation
still amounts to 123,400.
22POVERTY WATCH SPAIN - 2019
6. Inequality
Between 2008 and 2018, Spain was the third European country where inequality has
increased the most, as measured by the S80 / S20 indicator, only below Bulgaria and
Lithuania. Meanwhile, many European countries such as Portugal, France, Netherlands,
United Kingdom, Germany, among others, have already managed to reduce or equalize
their inequality, compared to 2008.
In 2018, the average income per person completed four consecutive years of growth up
to € 11,412, a figure that is € 338 higher than the previous year and which consolidates
the growth started in 2014. This increase, which placing the average income per person
at its highest value of the decade is, in itself, good news. However, as always, total
average data conceals very different results for population groups.
The table shows how the poorest quarter of the population (quartile 1) has not yet
recovered the nominal income of 2008, while the rest of the groups have already
surpassed it. The members of quartiles 3 and 4 were able to resist the crisis (only in 2013
did their average incomes become lower than those of 2008). In quartiles 1 and 2 the
recovery was much faster, since it took only three years to return to their 2008 income
level.
Table 1. Average income per person and quartile
2018 2008 Variation in Variation in
Euro 2018- percentage
2008 2018-2008
Quartile 1 3.937 3.957 -20 0,5%
Quartile 2 8.040 7.494 546 7,3%
Quartile 3 11.882 11.027 855 7,7%
Quartile 4 21.788 20.468 1.320 6,4%
Total 11.412 10.737 675 6,3%
SOURCE: JUAN CARLOS LLANO (2019), LOC. CIT.
The deflated data in the following table show that the real purchasing power of all the
groups studied has been reduced compared to 2009. Although all are facing
disadvantages in terms of median income, the most outstanding decrease are
experienced by the unemployed, the young people from 16 to 29 years old, those with
upper secondary education and with lower secondary education, childless households,
people with tertiary education, and people with primary or lower education.
23POVERTY WATCH SPAIN - 2019
Table 2. Percentage variation of real average income (deflated) per capita between
2009 and 2018
Retired -1,9
65 years old and above -3,1
One adult with 1 or more children -5,5
Children under 16 years old -6,3
Foreigner, EU, above 16 -6,8
Household with children -9
Two adults with 1 or more children -9,2
Women -9,7
Inhabitants of urban areas -9,8
Other households with children -10,9
Single-person households -11,3
Men -11,4
Foreigner, non-EU, above 16 -11,5
Household without children-11,9 -11,9
Spanish, above 16 -12,2
Two adults without children -12,4
Other inactive individuals, above 16 -12,8
Occupied, above 16 -13
Inhabitants of rural areas -13,4
Aged 30 to 44 -13,5
Primary education or lower, above 16 -13,7
Aged 45 to 64 -13,7
Tertiary education, above 16 -15
Other households without children -15
Upper Secondary Education -16
Lower Secondary Education -16,5
Aged 16 to 29 -16,5
Unemployed -23,6
SOURCE: JUAN CARLOS LLANO (2019), LOC. CIT.
The income ratio S80 / S20 is defined as the ratio between the proportion of total
income received by 20% of the population with higher income and that received by 20%
with lower income. The higher the value of the indicator, the greater the inequality
between the extreme groups of the population in which it is measured.
Either measured by S80/S20 or by Gini Index, inequality has steadily increased in Spain,
reaching the highest values in the EU-28. As of 2016, a period of deceleration began
that, in three years, has managed to reduce the index by nine tenths. In 2018, the total
income of 20% of the population with the highest income multiplies by 6 the total
24POVERTY WATCH SPAIN - 2019
income of 20% with the lowest income. Between 2008 and 2018 inequality has
increased by 0.4 percentage points.
Measuring the inequality between the most extreme deciles, S90 / S10, the richest
group multiplies by 10.9 their income with respect to the poorest, that is to say that the
difference is even more extreme than in the S80 / S10.
Graph 17. Income distribution S80/S20 and S90/S10, 2008-2018
16,0
S80/S20 S90/10 14,2
13,5
14,0 12,9 12,7 12,5 12,9
11,9 12,3
12,0 10,8 10,9
9,6
10,0
8,0
6,0
6,8 6,9 6,6 6,6
6,2 6,3 6,5 6,3
5,9 6,0
4,0 5,6
2008 2009 2010 2011 2012 2013 2014 2015 2016 2017 2018
SOURCE: JUAN CARLOS LLANO (2019), LOC. CIT.
The Gini index is 33.2, almost one point lower than last year. In the period 2008-2018
and, despite the significant reduction of the last two years, the index increased by eight
tenths.
In European comparison, for 2017 (latest data published for all countries), the Gini index
can be considered as "very high": Spain is the fourth country with the highest figure,
only surpassed by Bulgaria, Lithuania and Latvia. On the other hand, the Spanish figure
is 3.4 percentage points above the EU average.
7. Poverty and Wellbeing
Living in poverty marks a difference. There is no aspect in which the situation of the
population in poverty is at least equal to that of people who do not experience it.
If we consider another set of items, besides those considered in the Severe Material
Deprivation, the percentages of people in poverty who cannot afford them multiply
between two and six times the data measured among the population that is not in
poverty. For example, in 2018, 22.9% of the population in poverty cannot replace their
damaged clothes with new ones, 8.2% cannot have two pairs of shoes, 25% cannot meet
with friends or family to eat or drink at least once a month, 14.3% do not have a
25POVERTY WATCH SPAIN - 2019
computer at home and 13.9% do not have a fixed or mobile Internet connection, 13.5%
do not have car at home and 9.9% cannot afford a meal of meat, chicken or fish at least
every two days. For all these items, the percentage of people who are not in poverty is
less than 5%. With respect to 2017, the general situation of people in poverty worsened
by 9 of the 16 items measured and the percentage of those who cannot meet them
increased as well.
Graph 18. People who cannot afford to do certain activities or afford certain items, by
condition of poverty/non-poverty, in percentage
Do you spend a small amount of money on yourself once a
34,3 9,1
week?
Do you regularly participate in leisure activities, such as
33,5 8,9
sports, movies, concerts, etcetera?
Do you meet with friends and / or family for a meal or
drink at least once a month? 25 4,6
Do your replace damaged clothes with new ones (other
22,9 5,2
than second-hand)?
Do you have an Internet connection (landline or mobile) for
13,9 3,4
personal use at home?
Does the home have a computer? 13,5 2,7
Do you have a car home? 9,9 2,8
Do you have two pairs of shoes (or a suitable pair for any
8,2 1,3
time of the year)?
In poverty Not in poverty
SOURCE: JUAN CARLOS LLANO (2019), LOC. CIT.
8. Poverty and Health
The 2017 National Health Survey indicates that the self-perceived state of health
(population aged 15 or over) is good: just over 70% of the population considers their
health to be "very good or good".
However, having a job or being unemployed are factors which have an important
influence on the self-perceived state of health. Only 18.6% of people who have a job
think that it is "regular, bad or very bad." This percentage scales nine percentage points
(27.4%) when it comes to unemployed people and more than doubles (43.6%) when it
comes to people (mostly women) devoted to reproductive and care work (“household
chores” as stated by the Survey).
26POVERTY WATCH SPAIN - 2019
37.4% of people at risk of poverty consider that their health is "regular, bad or very bad",
a figure that is just over 11 percentage points above the measure for people who do not
suffer that risk (26.2%).
The situation of poverty also determines important differences in the ability to perform
basic activities of daily life, since one in four people at risk of poverty (24%) manifests
some kind of difficulty, a figure that contrasts with 15.6% in the case of non-poor people.
In Spain universal access to the National Health System and healthcare under equal
conditions are currently guaranteed, although some restrictions were introduced by a
Royal Decree-Law 16/2012, in the context of austerity measures and there were already
medical specialties that were never been covered through the public system. In 2018,
the repeal of this Royal Decree-Law has been partial, and some important consequences
still remain.
In 2019, a study conducted by EAPN SPAIN on the National Health Survey data shows
two trends that affect inequality. First, there are a greater number of people in poverty
who do not pass medical tests and this situation is the same, when broken-down by age,
sex, nationality or employment status. Second, the lack of access for economic reasons
to both prescription drugs and medical, dental, and mental health care is three to five
times higher among people at risk of poverty than among those who are not.
Around 5% of people in poor households who needed medical assistance, 25.5% of
those who needed dental care and 3% of those who needed mental health services were
unable to receive care for economic reasons. A 6.9% were unable to access prescription
drugs, a figure that amounts to 8.3% among unemployed people.
Regarding preventive practices, the National Health Survey indicates that between 9%
and 10% of people at risk of poverty are not involved in them. These figures almost
double those registered among people residing in households that are not at risk of
poverty.10
9. Poverty and Overall Satisfaction with Life
Inequalities clearly show in the assessment of satisfaction with life, particularly with
regard to middle aged and elderly women, non-EU foreigners, the unemployed and
lower income quartile of the population.
10 Llano, Juan Carlos (2019), La desigualdad en la Salud. EAPN. www.eapn.es
27POVERTY WATCH SPAIN - 2019
The following information, which proceeds from the Special Module from the Survey of
Living Conditions of 2019, allow to understand how the former statistics combine with
more qualitative inputs.
Although the overall satisfaction with life average was slightly higher in men than in
women, 7.4 and 7.3 out of 10 in average, broken-down by age there was a higher
percentage of women aged 16 to 29 and 30 to 44 at the top scores (9-10). Instead,
beginning with the middle life mark, the percentage of men in the 45 to 64 and the 65
and above is higher (with a 4.1 percentage points difference with regard women).
Table 3. Overall satisfaction with life by sex and age
Men 0 to 4 5 to 6 7 to 8 9 to 10
16 to 29 years old 3,9 14,6 49,3 32,2
30 to 44 years old 4 17,2 53,2 25,6
45 to 64 years old 6,8 20,1 51,6 21,5
65 years old or above 8 21,5 49,3 21,2
Women 0 to 4 5 to 6 7 to 8 9 to 10
16 to 29 years old 2,1 15,3 49,8 32,8
30 to 44 years old 3,9 15,7 50,9 29,5
45 to 64 years old 7 20,7 50,9 21,4
65 years old or above 11,3 25,8 45,8 17,1
Source: Living Conditions Survey, published in 2019, by the National Institute of Statistics of Spain
Considering the type of household, the highest percentage corresponded to adults with
children score at the top, 28.4%. The second group with the highest percentage is
composed by two adults under 65 years old. The less satisfied are elderly women and
the households integrated by two adults, one of them an elderly, with 14.4% and 19.8%
respectively.
28POVERTY WATCH SPAIN - 2019
Table 4. Overall satisfaction with life by type of household
0 to 4 5 to 6 7 to 8 9 to 10
Women 65 years and over 11,8 27,5 46,3 14,4
Two adults, at least one 65 8,8 22,8 48,6 19,8
years or above
Other types of households 7,2 23,2 49,4 20,2
Men who live alone, under 65 6,8 21,7 51,2 20,3
Men 65 years and over 10,8 23,1 44,6 21,5
Women who live alone, under 8,3 18,7 48,2 24,8
65
Adults only with dependent 7,6 23,1 42,6 26,7
children
Two adults, both under 65 5,1 16,4 51,3 27,2
Two or more adults with 3,9 15,5 52,2 28,4
dependent children
Source: Living Conditions Survey, published in 2019, by the National Institute of Statistics of Spain
People living in high-income households: out of 10, they scored 7.9 points, with 33.4%
of this group scoring at the top, compared to 6.7 points of those with lower incomes,
with only 16.1%.
Table 5. Overall satisfaction with life by type of household
0 to 4 5 to 6 7 to 8 9 to 10
First quintile 11,7 27,2 45 16,1
Second quintile 8,6 24,1 47,8 19,5
Third quintile 5,2 19,5 51,4 23,9
Fourth quintile 3,3 15,1 53,3 28,3
FIfth quintile 2,2 10,7 53,7 33,4
Source: Living Conditions Survey, published in 2019, by the National Institute of Statistics of Spain
Regarding the level of education, the average degree of overall satisfaction with their
lives was 7.8 points, while those with Primary or lower education had an average score
of 6.6 points.
The average satisfaction with the economic situation is similar, but most the
differences are more dramatic: those with high-income households scored of 7.5
points out of 10. The same happened with those with higher education, 7.1 points out
of 10. At the opposite extreme were unemployed people, with an average rating of
4.7 points out of 10, and 39.9% of the unemployed declared a degree of satisfaction
of 4 points or less.
29POVERTY WATCH SPAIN - 2019
10.Poverty and Education
10.1. Regional disparities
The Spanish education system currently has a high level of development, in line with
that of the surrounding countries, both due to the universal practice of compulsory
studies and the large enrolment rates in non-compulsory ones. Its expansion has
continued during the 21st century, especially in early childhood education. The global
evolution of its resources has experienced significant oscillations as it was significantly
affected by the last economic crisis and the financial difficulties experienced during it by
families and public administrations. The education system is contrasting, both in terms
of efficiency and equity, due to the important sociodemographic and economic
differences among the Autonomous Communities and a highly decentralized public
sector in education. In the largest Community (Andalusia) live more than 8.4 million
inhabitants, and in the smallest (La Rioja) only 300,000, so that the former multiplies by
28 the size of the latter. The levels of the Gross Domestic Product (GDP) per capita are
also very different (that of the Community of Madrid doubles that of Extremadura) and
the GDP of Catalonia or the Community of Madrid is 25 times higher than that of La
Rioja.
In Spain, the period of compulsory schooling goes from 6 to 15 years, as early childhood
education is not mandatory and only after 16 years of age is access to the labour market
authorized. This regulation homogenizes the conditions of access to compulsory primary
and secondary education of the entire population regardless of the territory in which
the families reside, but before 6 and after 16 years of age, access to education is not
uniform.
Early childhood education consists of two cycles or stages, 0 to 2 years and after 3 years,
in which public coverage is very different and the net enrolment rates of children are
very diverse. Despite not being compulsory, in the second cycle, schooling is almost
universal for children of any Community, as a result of the wide public and free offer at
that stage and the widespread decision among families to take their children to schools
from 3 years to facilitate access to centres in primary education.
Around 50.5% of students are concentrated in pre-primary and primary education,
35.4% in secondary education (compulsory and non-compulsory) and vocational training
(certified studies orientated to the labour market), and the remaining 14% in university.
Around these average figures there are notable regional differences in the composition
of students by levels of study. The weight of the basic levels has differences of up to 12
30You can also read