THE IMPACT OF CONGESTION ON BUS PASSENGERS - NE W - PROFESSOR DAVID BEGG
←
→
Page content transcription
If your browser does not render page correctly, please read the page content below

IO ED
VE TE EW
  RS ND
      N
 EX N

 THE IMPACT
 OF CONGESTION
 ON    BUS     PASSENGERS
 PROFESSOR DAVID BEGG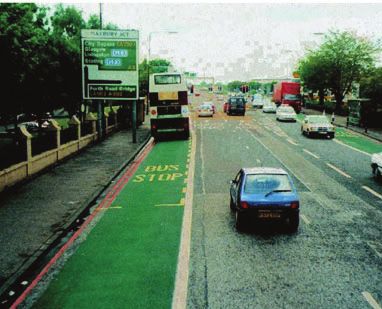
ABOUT GREENER JOURNEYS

Greener Journeys is a campaign dedicated to encouraging people to make more sustainable travel choices. It is a coalition of
the UK’s leading public transport organizations, user groups and supporters. It aims to reduce CO2 emissions from transport by
encouraging people to switch some of their car journeys to bus or coach instead. Switching from car to bus for just one journey
a month would mean one billion fewer car journeys on our roads and would save 2 million tonnes of CO2 every year. For more
information visit www.greenerjourneys.com
CONTENTS   FOREWORD BY SIR PETER HENDY

           ABOUT THE AUTHOR

           ACKNOWLEDGEMENTS

           EXECUTIVE SUMMARY

           TABLE OF CONTENTS

           1.         THE NEED FOR THIS STUDY

           2.         METHODOLOGY

                A. ECONOMIC ASSUMPTIONS

                B. CASE STUDIES

           3.         RESEARCH FINDINGS

                A. BUS JOURNEY TIMES ARE INCREASING

                B. IMPACT ON BUS PASSENGERS

           4.         THE CHALLENGE GOING FORWARD

                A. CONGESTION GETTING WORSE

                B. SPACE WARS

           5.         RECOMMENDATIONS: FIVE POINT PLAN

           6.         REFERENCES

           7.         APPENDIX: CASE STUDIES

                I. 		       BRIGHTON

                II. 		      BRISTOL

                III. 		     DUBLIN

                IV. 		      EDINBURGH

                V. 		       GLASGOW

                VI. 		      GLOUCESTERSHIRE

                VII. 		     GREATER MANCHESTER

                VIII.		     HULL

                IX. 		      LONDON

                X. 		       OXFORD

                XI. 		      WEST MIDLANDS
FOREWORD BY SIR PETER HENDY CBE

Transport connectivity creates economic growth, jobs and           Of course the bus industry itself must do better - cash
builds houses. The resurgence of our cities, the places our        handling on the bus slows the service down, costs money
children migrate to get jobs, is in direct proportion to their     and is unnecessary in the modern age of PDAs and contactless
connectivity both to the rest of the world and within the city     bank cards; schedules must be up to date, tailored to time of
itself. And the bus service, for journeys longer than a walk,      day and produce reliability without too much recovery time. The
is the most common way of creating connectivity in them.           Traffic Commissioners should have more powers and resource
So making buses work better is good for growth and jobs            to prevent poor operators getting licences and to
and good for the urban areas they serve. And both                  stop poor operation on the road.
David Begg and I said so when we chaired the late and
                                                                   But in urban areas the best operation in the world will be
much-missed Commission for Integrated Transport.
                                                                   sabotaged if congestion destroys reliability and journey
In this study David rightly highlights the crisis which has        speed. David points out eloquently that the effects of
developed in bus service reliability across the UK, and suggests   congestion are doing just that - increasing costs and
a new and urgent need to make our buses quicker and more           decreasing revenue, which leads inevitably to less service.
reliable to make our cities work better. The air quality effects   In London, fewer but faster and reliable buses will both solve
of congestion are getting much airtime just now - the economic     an acute financial problem for Sadiq Khan (the combination
effects are as obvious but left unsaid for the most part.          of his fares freeze and the complete removal of subsidy from
This study seeks to put that right.                                TfL by 2018), and restart bus passenger growth allowing
                                                                   his electorate to access work, education, health and
                                                                   leisure more easily.

                                                                   And outside London, the same proposition would produce
                                                                   more and better services, with the same results, too. Not to
                                                                   mention the beneficial effects on driver recruitment, retention
Sir Peter Hendy CBE Chair, Network Rail                            and resultant customer service.
Commissioner, Transport for London 2006/2015
Chair, Commission for Integrated                                   David isn’t advocating anything which as a politician he hasn’t
Transport 2005/2010                                                done himself with the Greenways in Edinburgh. In London,
                                                                   for Boris, we took out significant road space for cycling. Now our
                                                                   towns and cities are going to have to make the same sort
                                                                   of radical choices for more protected road space and more and
                                                                   cleverer signal priority, for buses across the UK to enable the
                                                                   growth, jobs and house building the bus service can support.

                                                                   This is a critical piece of analysis, which every local politician
                                                                   and highway authority in the country should read, absorb,
                                                                   and act on. David Begg is to be commended for it

4   Forward by Sir Peter Hendy CBE
ABOUT THE AUTHOR ACKNOWLEDGEMENTS
This report is dedicated to bus drivers and their passengers who suffer from the
impact of congestion on a daily basis.
I have been fortunate to have been able to discuss the economic analysis in this
report with some of the best transport economists in the UK: Professor Peter Mackie,
Professor Peter White and Professor Stephen Glaister. The final analysis is my
own and any errors are entirely down to me.
I have become immersed in bus timetables and observed the huge frustration bus
operators experience trying to run a punctual and reliable service in the face of
worsening congestion. Special thanks to Martin Dean (MD, Buses, Commercial Director,
Go-Ahead), Les Warneford (former MD, UK Bus, Stagecoach), Mark Yexley (Former
Professor David Begg is a former Operations and Commercial Director Arriva UK Bus), Neil Barker (First Group), Nigel
Serafini (Head of Commercial & Business Development, Lothian Buses), James Freeman
chairman of the Government’s
(First Group),Peter Shipp( Chairman and Chief Executive, East Yorkshire Motor Services)
Commission for Integrated Transport Mike Best (Brighton and Hove Bus Company) and Martin Harris (MD, Brighton
and was the chairman of the Transport and Hove Bus Company).
Committee of the City of Edinburgh
They not only have supplied me with copious amounts of data, but they have educated
Council when the radical Greenways bus
me further on the sector. Martin has gone out of his way to dig up archived bus timetables
priority measures were introduced in stored at the Kithead Trust. I am indebted to Philip Kirk, who does a fantastic job looking
the 1990s. He has been a board member after this archive, which is such a rich source of information (www.kitheadtrust.org.uk).
of First Group, Transport for Greater
Roger French, former MD of Brighton and Hove Buses has been an invaluable
Manchester and Transport for London.
mentor for me in this research. He has left a fantastic legacy in Brighton.
He is currently owner and proprietor
of Transport Times, Chairman of EAMS, Leon Daniels (MD Surface Transport), Garrett Emerson (CEO, Surface Transport) and Ben
a non-executive director of Heathrow Plowden (Strategy & Planning Director, Surface Transport) from Transport for London
have ensured that the major challenge the capital is facing, with rising congestion and
Airport and Chairman of the Greener
sharp reductions in bus speed over the last few years, is accurately covered in this
Journeys Advisory Board. He is a visiting
report. The new mayor would be well advised to listen to their concerns.
professor at Plymouth University.
Dr Jon Lamonte (Chief Executive, Transport for Greater Manchester) and his colleagues
Rod Fawcett and Mike Renshaw, have demonstrated to me in some detail the efforts they
are making to speed up bus journey time in the face of a proliferation in road works and
a rapid growth in city centre employment and demand for transport. They have been
resolute in their policy objective of expanding bus priority in the face of stern criticism
from some local politicians.
Anthony Smith and his colleagues at Transport Focus have guided me and reinforced my
concern that congestion is the main challenge facing the sector. Joan Aitken has given
me a Traffic Commissioner’s view on the factors which are slowing up traffic in Edinburgh
and how it impinges on bus operations.
David Brown (Group Chief Executive, Go-Ahead) and Giles Fearnley (Managing Director,
First Bus) have provided wise counsel as have David Leeder, Chris Cheek (TAS Partnership)
and Steven Salmon (CPT).
About the Author & Acknowledgements 5ABOUT THE AUTHOR ACKNOWLEDGEMENTS
Vince Stops from London Travel Watch has been a passionate supporter of bus users
in London and kept me right on the capital and Marshall Poulton (former director of
transport at the City of Edinburgh Council) and George Mair (CPT Scotland) have
been my go to men on Scotland’s capital.
I have been very impressed at the close cooperation in the West Midlands, between
National Express and local authorities. Particular thanks to Laura Shoaf, Managing
Director for West Midlands and her colleagues Pete Bond and Guy Craddock, and to Peter
Coates and David Bradford from National Express.
For the Glasgow case study I am indebted to Eric Stewart, Ronnie Park and Bruce Kiloh
from Strathclyde Passenger Transport. They have a wealth of experience in the bus
sector and their passion and commitment to arresting the decline in bus patronage in the
city is commendable.
Phil Southall, Managing Director, Oxford Bus Company, helped me to understand the
origins of the success story that is bus transport in Oxford.
Rupert Cox, MD for Stagecoach West, has provided valuable insights into the transport
scene in Gloucestershire.
Tim Gaston, PTS director, National Transport Authority (Ireland) and his colleague John
Keyes, kept the right on Dublin and ensured that UK cities can learn from their success.
Sir Peter Hendy has kindly written an insightful foreword. He may now be Chairman of
Network Rail but buses will always be in his DNA and he leaves behind him a fantastic
legacy from the his time 15 years at TfL , both as director of surface transport and
subsequently Transport Commissioner.
A big thanks to David Fowler and Kirsty Walton at Transport Times for making this
report read much better than it otherwise would and to Katie Allister for her vital
contribution on research and the case studies. It has been a pleasure to work with
her again.
6 About the Author & AcknowledgementsEXECUTIVE SUMMARY
EXECUTIVE
SUMMARY
TRAFFIC CONGESTION IS A DISEASE The second response is to operate at lower frequency. A 10%
deterioration in operating speeds would lead to a 10% reduction
WHICH IF LEFT UNCHECKED WILL
in frequency and 5% fewer passengers (based on a frequency
DESTROY THE BUS SECTOR. elasticity of 0.5). A combination of the two responses is also
This is a dire and sensational prediction, but the evidence likely. The end result – whether it’s a greater peak vehicle
uncovered in this research leads to no other conclusion. requirement (PVR – the number of buses required to operate
On historical, current and future trends it’s a question of the service) or reduced frequency, or a combination of both
when, not if. There is a distinct trend across our most – is pretty much the same in terms of patronage decline.
congested urban conurbations in the UK of bus journey To the above it is necessary to add the response passengers
times rising by – on average – almost 1% per annum. have to spending longer on board buses. This would lead to a
Over the last 50 years, bus journey times have increased further 5% fall in passengers (because of an in-vehicle elasticity
by almost 50% in the more congested urban areas. If we of 0.5). The net result is a direct correlation between operating
had protected bus passengers from the growth in congestion speeds and patronage: a 10% decrease in speeds reduces
there would arguably be between 48% and 70% more fare patronage by at least 10%. The figure could yet be higher
paying bus passenger journeys today. If the trend is allowed because congestion puts pressure on punctuality and reliability
to continue, then our urban buses will no longer represent which can increase waiting time at bus stops. Passengers place
a viable mode of transport for the majority of its customers a value two to three times as high on waiting at a bus stop
and will be populated largely by people with mobility as they do for in-vehicle time.
difficulties. Already in London some buses on some routes
run at close to walking speed. Chronic traffic congestion is not just a headache for passengers
it’s also a nightmare for bus drivers. It makes it much harder
to attract the very best customer-focused bus drivers into the
THE NEED FOR THIS STUDY industry, it prevents bus drivers giving the best service they
can to passengers, and those who are committed and loyal
Everyone in industry, local government and Whitehall often find the task so frustrating it encourages them to leave
knows we have a problem. Until now it has not been properly the industry - or not join in the first place. Many bus companies
quantified. This report makes clear the true extent to which are once again struggling to attract enough drivers and have
congestion has been corrosive to the bus sector. It has been significant vacancies (especially in large conurbations).
caught in the vortex of three vicious downward spirals:
1. Slower speeds leading to higher costs, higher fares, ANNUAL INCREASE IN BUS JOURNEY TIMES
fewer passengers, service decline, fewer passengers.
2. Slower speeds leading to increased journey time, Gloucestershire - where bus journey times have almost doubled
fewer passengers, service decline, fewer passengers. on some routes over the last 25 years- highlights that declining
bus speeds are not confined to urban conurbations. Rural areas
3. Slower speeds, punctuality and reliability decline,
with smaller towns are suffering from rising car ownership and
fewer passengers, service decline, fewer passengers.
traffic levels on road networks that are unable to cope.
Bus operators are forced to respond to congestion in one of
Dublin has been included, in what was intended to be a study
two ways. First, to try to maintain service frequency. If they
limited to the UK, to highlight what we can learn from other
do this, then every 10% decrease in operating speeds leads
countries. Despite congestion growing as rapidly as any UK city,
to an 8% increase in operating costs . If this is passed on to
Dublin has been very successful in limiting the impact on bus
passengers through higher fares it results in a 5.6% fall in
speeds (0.4% p.a decrease compared with average close to 1%
patronage (DfT fares elasticity of 0.7) .
p.a) through effective bus priority measures.
1
The TAS Partnership
2
DfT elasticity
8 Executive SummaryEXECUTIVE SUMMARY
Glasgow has a higher than average decline in bus speeds same frequency requires 20 buses. This results in operating
(1.5% p.a) and this alone would equate to a 15% decline in costs which are 25% higher with the resulting pressure on fares.
bus patronage every decade. If you combine this with
The West Midlands is still suffering from a policy approach in
relatively cheap subsidised competition from an impressive
the 1960’s which prioritised road building and car use over more
urban rail network, and cheap and abundant public car parking,
sustainable modes of transport such as bus, rail, walking and
it explains why Glasgow has experienced an alarming decline
cycling. This has resulted in a level of car dependency- 65% of all
in bus patronage over the last decade. First Glasgow- the main
journeys-which is significantly higher than the 35%-45% level of
operator in the city- is carrying 40% fewer passengers than it
car use experienced in German cities such as Munich, Stuttgart
did a decade ago and bus use across Strathclyde has declined
and Düsseldorf.
by 22% over the same period.
The West Midlands Bus Alliance, which brings together the
Cities that are successfully growing bus mode share have
local bus operators, Transport for West Midlands and Local
tighter parking controls with higher charges and less provision,
Authorities, is one of the best example of bus partnership
making it more likely that people will use the bus. Conversely,
working in the UK. They have worked hard to improve the
the more generous the parking provision, the less likely the
region’s bus services through focused route improvements,
bus will be used as the mode of travel and the more likely the
new low carbon buses, easier to use ticketing, better
private car will be used thus increasing the levels of congestion
information and bus priority.
on routes accessing the city as well as the level of congestion
within the central area of city. This is dramatically illustrated The West Midlands is at a cross roads when it comes to
in the Glasgow and West Midlands Case Studies where car transport policy. It should build on the excellent work of its Bus
parking is cheaper and in more abundant supply compared Alliance, continue with some of the more enlightened policies
with other towns and cities. Against this background the West to encourage walking and cycling and capitalise on the huge
Midlands deserve credit for ensuring that bus use has not benefits that HS2 will bring to the city region. What is missing is
declined in the way it has in Glasgow. the kind of car restraint measures which more successful city
regions embrace. A combination of carrot and stick is required
The West Midlands is the 5th most congested metropolitan
to ensure that the city region does not suffer from chronic
area in England with traffic speeds more than 15% worse
traffic congestion which will be bad for both its economy and its
than the UK average. This picture is set to get far worse over
environment
the next thirty years with the forecasted population growth of
almost 500,000 across the West Midlands( the size of Liverpool)
combined with increased car dependency which will result in
34% more traffic. Without radical action to tackle the dramatic
increase in congestion, the West Midlands faces economic
stagnation and air quality levels amongst the worst in the UK.
Route 126 from Birmingham to Wolverhampton (via Dudley)
epitomises the challenge facing bus companies from rising
congestion. The return journey time was 160 minutes in 1987.
Today it is 200 minutes, 40 minutes slower. In 1987 16 buses
were needed to run a 10 minute service frequency, today the
Executive Summary 9EXECUTIVE SUMMARY
LONDON “FALLING” system in the world, a level of integration which is the envy
of other UK cities, state-of-the-art passenger information
at the bus stop and on mobile devices. Add to this population
Despite London Buses being one of the Capital’s transport and employment growth and you should have a recipe for the
success stories over the past 15 years, more recently bus London bus success story continuing. But all these laudable
speeds have been declining faster than anywhere in the UK. ingredients cannot offset the rapid deterioration in bus
This comes after decades of relative success in protecting journey times.
bus passengers from traffic congestion through effective bus
priority measures, such as red routes and other initiatives, TfL are facing swinging cuts to their revenue budget.
and the central congestion charging zone introduced in 2003. London’s public transport system is expected to operate
If the average bus speed in the UK’s congested urban areas has without any revenue subsidy by 2018. Hong Kong and
historically been decreasing by almost 1% p.a., then for one- London will be the only cities in the world expected to
third of London bus routes the decline been more than meet this objective. The new Mayor has committed to a
five times this average over the past year. fares freeze which raises the question of who is going to
pay for bus services in London if it’s not coming from the
THIS HAS BECOME A CRISIS FOR THE taxpayer as passengers will not make up the difference in
CAPITAL AND SOMETHING THE NEW MAYOR, higher fares. The solution is to operate buses more efficiently
by improving their speed. If London is to eliminate the £461
SADIQ KHAN, MUST PRIORITISE. million per annum subsidy to its bus network then bus
London, which for more than a decade has been the UK’s speeds would have to improve by 24%.
bus success story, with passenger numbers doubling since
the formation of TfL in 2000, is now facing one of the
fastest declines in bus use anywhere in the UK.
There is a key lesson to be learned from this. You can get all
the other ingredients right: modern bus fleet, cashless buses
with the most advanced smartcard and contactless ticketing
10 Executive SummaryEXECUTIVE SUMMARY
Former London Mayor Boris Johnson was right to warn WHY DOES IT MATTER IF BUS JOURNEY TIMES INCREASE?
that his successor will have to use tougher congestion
charging measures to tackle London’s growth in congestion.
It can be argued this legacy was, in part at least, his creation Slow buses are bad for our city economies. If the trend for bus
journey times increasing by almost 1% per annum continues
through policies including the removal of the western
we can expect to continue to lose access to around 5,000
extension of the congestion zone and the reduction of road
jobs per year as a consequence. 3
capacity in central London by 25% on key routes through
the introduction of cycle superhighways without taking Buses are vital to the health of local economies. More people
action to curtail traffic in central London. commute by bus than all other forms of public transport
combined and those bus commuters generate £64bn in GDP.
Cycle superhighways are a radical and welcome initiative to Around 400,000 people are in better more productive jobs as a
make cycling safer, quicker and more enjoyable. However it’s a direct result of the access the bus service provides. Buses are
pity that the former Mayor did not listen to the advice of TfL and also the primary mode of access
reduce the volume of traffic in central London to accommodate to our city centres, facilitating 29% of city expenditure.
the reduction in road capacity.*
Slow buses are also bad for pollution. Fuel efficiency
measured in kilometres per litre has declined by 35% since
2000, and carbon dioxide emissions per bus km in urban
conditions have risen by 25%. While there are factors other
than congestion driving this trend, such as larger buses,
stop-start conditions caused by congestion are a key factor.
Under heavily congested conditions, tailpipe emissions can
be increased by a factor of three or four. 4
3
Daniel Johnson, Institute for Transport Studies, *
There was an error in the original report which stated
Leeds University on one page that 25% of road capacity had been removed
4
Environmental Factors in Intelligent Transport on roads on central London to accommodate Cycle
Systems, Prof Margaret Bell. IEE Proceedings: Superhighway’s. It had correctly stated on other pages Executive Summary 11
Intelligent Transport Systems, Vol 153 Issue 2, 2006 in the report that this was on “key” routes.EXECUTIVE SUMMARY
WHAT CAN WE DO ABOUT IT? If london-style cashless buses with contactless payment
and smart ticketing could be extended to the rest of the uk,
bus journey times could be improved by up to 10% by halving
THE MANTRA FROM TOO MANY POLITICAL dwell time at bus stops. In urban conditions dwell time makes
up between 25% and 33% of total journey time. The big five bus
DECISION-MAKERS AT LOCAL AND NATIONAL operators in the UK have set a target to introduce contactless
LEVEL IS TO GIVE THE PUBLIC “CHOICE”. bus transactions by 2022. They should do everything possible
to accelerate this, and it is realistic for them to achieve this
THE PROBLEM IS THAT IN URBAN AREAS
goal in the large conurbations within three years.
THIS MEANS ALL ROAD USERS HAVE NO
The Buses Bill should set out guidance encouraging local
CHOICE OTHER THAN TO PUT UP WITH authorities and bus operators to set targets for average bus
CHRONIC TRAFFIC CONGESTION WHICH speeds. The minimum requirement should be for bus speeds to
WILL CONTINUE TO GROW. stop declining. Local authorities need to give priority on roads
and at junctions to buses.
The way our road system is managed in urban areas could be
argued resemble the tools used by Communist-era countries Edinburgh is one of the few cities in the UK to have
to control production: traffic volumes are regulated by bucked the trend in falling bus speeds, at least for a
congestion (queuing) in the same way the former Soviet Union decade. Between 1986 and 1996, scheduled bus speeds
used to ration bread. It is bad for urban economies and their increased by 5% as a result of better conventional bus
environment. Without road pricing there is no solution to priority culminating in the radical Greenways bus priority
urban congestion. scheme. However, this legacy has been allowed to dissipate
through weaker enforcement, a trial on removing bus priority
There is therefore a need to return to the ethos of the 1998 during off-peak periods, and a failure to paint the lanes green
White Paper on Transport which recognised the necessity and properly maintain them. As a result, in the last 20 years
of changing travel behaviour and the importance of demand Edinburgh has reverted to the UK norm with bus speeds
management. It led to the London’s congestion charging declining by 20%.
system and dedicated the revenue raised being used mainly
to improve bus services.
SPACE WARS: POLITICAL DECISION-MAKING
More cities need to follow the lead of London, with the
implementation of congestion charging, Nottingham, with
its workplace parking levy, and Bristol, with essential car
Too little focus is placed on the importance of the bus because
parking restraint measures. All three cities have been
bus passengers carry too little weight with opinion-formers
prepared to use both the carrot (improved sustainable
and political decision-makers. The socio-economic profile of
transport) and the stick (car restraint). Public transport
bus passengers is very different from rail users, motorists
improvements on their own are not a panacea for urban
and cyclists, with a much higher percentage of those on lower
congestion. They have to be accompanied by traffic
income travelling by bus. It helps to explain why fuel duty has
restraint measures.
been frozen for six consecutive years despite rock bottom oil
prices. During this time Bus Service Operator Grant (BSOG) has
been cut by 20% which means bus operators paying more for
their fuel. The motoring lobby is significantly more powerful
and influential than the bus lobby.
12 Executive SummaryEXECUTIVE SUMMARY
MORE BUS CHAMPIONS ARE NEEDED
IN THE UK IN LOCAL, DEVOLVED AND
CENTRAL GOVERNMENT.
The bus is the most efficient user of road space, crucial
for the health of our city economies and a vital part of
an environmentally-friendly local sustainable transport
system.
Bus companies need to get better at communicating with
their customers to keep them better informed. This would
also help them to mobilise support from their customers for
pro-bus measures such as bus priority. At present, it would
be a rare event for a bus passenger to lobby politicians for
improved bus priority; it’s much more common for non-bus
users to complain about priority measures. Local politicians
who are making brave decisions to allocate road space for
bus passengers need as much support as they can get from
their local bus companies as well as bus passengers.
A sensible balance needs to be struck between making our
cities pedestrian-friendly and ensuring that bus passengers
can get close to their destination. It’s important to
remember that shopping is the purpose of around one-third
of bus journeys in the UK, and bus users spend an estimated
£27bn
on shopping and leisure. The more accommodating city
centres are to pedestrians, the more attractive they
become to retail and businesses generally. Bus routes
radiate from the city centre: the more people travel to our
city centres, the more populated our buses are. City retail
faces stern competition from out of town shopping centres
and a newer threat which is growing exponentially, that
of online shopping. Bus companies are often the first to
protest about pedestrianisation, but it would serve them
well to acknowledge that city retail is facing a major battle
to hold on to customers. The viability of city centre retail
and bus companies are inextricably linked.
5
A New Deal for Transport: Better for Everyone. White
Paper, July 1998 www.persona.uk.com/bexhill/
Core_docs/CD-05/CD-05-16.pdf
Executive Summary 1301. THE NEED FOR THIS STUDY
01.
THE NEED
FOR THIS
STUDY
There is a good deal of evidence of the impact traffic congestion There is a debate to be had about the merits of bus regulation
has had on the economy. The Cabinet Office has calculated the versus deregulation. This is not something which this research
cost of congestion to the urban economy to be at least £11bn is concerned with. Traffic congestion had an adverse impact on
per annum, while the costs to society of poor air quality, ill bus passengers prior to the 1986 Transport Act and the advent
health, and road accidents in urban areas are each similar to of deregulation; it has impacted on them since and will remain
congestion, exceeding £40bn 6 . a major problem in any future franchise regime. It is becoming
such an acute problem in London that there has been a marked
However, there has been little research on the impact rising
reversal in the upward trend in patronage.
congestion has had on the bus sector and consequentially
on city economies and their environment. This paper analyses one of the most potent headwinds facing
the bus sector: traffic congestion. It ranks as one of the top
THE BUS SECTOR HAS BEEN three most powerful headwinds that have held the bus sector
HIT THE HARDEST BY CONGESTION. back, the other two being rising car ownership (car-owning
households make 66% fewer bus trips per annum than non car
Bus operators often cite congestion as a major factor in their owning households) and the migration of retail and business to
failure to hit punctuality targets, but there is little documented out of town locations built around car access. In more recent
evidence of the link between congestion, rising operating times these trends have been exacerbated by online shopping
costs, fares and disappointing patronage figures. Motorists and the advent of Uber.
and freight and delivery drivers are able to view congestion
hot spots on satnav and take alternative routes. This is not
an option for bus drivers.
At the start of the research for this report it was clear that
growing urban congestion was a serious problem facing the
UK bus sector, but the detailed analysis undertaken revealed
just how acute and crippling the problem the problem is.
It is now a disease, and if left unchecked will irreparably
damage the sector.
6
An Analysis of Urban Transport, Cabinet
Office Strategy Unit, November 2009. http://
webarchive.nationalarchives.gov.uk/+/http:/
www.cabinetoffice.gov.uk/media/308292/ The Need For This Study 15
urbantransportanalysis.pdf01. THE NEED FOR THIS STUDY
IN LONDON BUS SPEEDS ON SOME
URBAN SPEEDS
ROUTES ARE CLOSE TO WALKING PACE
AND IF THIS TREND IS ALLOWED TO
CONTINUE IT WILL EVENTUALLY ONLY
BE THOSE WITH MOBILITY DIFFICULTIES
WHO TRAVEL BY BUS.
This report attempts to quantify what the growth in
patronage would have been if bus journey times had
remained constant over the last 50 years, using elasticity
analysis (elasticity is a means of quantifying how demand
for a service changes in response to changes in fares,
frequency and in vehicle time) It will estimate the impact
the growth in journey times has had on our city economies
and their environment. It will look at what policies we need
to implement to reverse this debilitating downward spiral
of rising congestion, higher costs, higher fares, and fewer 1x = 5mph
passengers. It will look at what operators can do to improve
1966
fare transaction times and reduce dwell time at bus stops.
2016
There are many factors outside the scope of this study
which can explain why rail patronage has doubled over
the last 20 years while bus patronage (outside London) Bus speeds have been declining faster than any other mode of transport.
has been disappointing in comparison. The graph to the Urban rail, walking and cycling have remained fairly static but urban car
right shows the trend in average speeds in urban areas speeds have been declining, but not as fast as bus.
for the different modes. Urban rail, walking and cycling
have remained fairly stable over the last 50 years; car
speeds have declined. But it’s the fall in bus speeds which
has been most marked, with an average decline of
almost 50% in the congested urban conurbations.
In the mid 1970s bus speeds became slower than cycling
and the gap has widened since. On current trends average
urban bus speeds will slower than walking in 60 years’ time.
The speed of the number 11 bus in London is already down
to 4 mph for part of its route . 7 Urban traffic congestion is
becoming worse with each passing decade.
7
Number 11 bus speed http://www.greenerjourneys.com/wp-content/
8
Daniel Johnson, Peter Mackie and Jeremy Shires: Buses uploads/2014/07/Buses_and_the_Economy_II_main_
and the Economy II, Institute for Trnsport Studies, report_july.pdf
16 The Need For This Study University of Leeds, July 201401. THE NEED FOR THIS STUDY
The bar chart below shows that public transport has made WHY IT MATTERS - THE ECONOMY
a comeback over the last 20 years, but it has been rail rather
than bus which has been achieving modal shift from the car.
This is the result of many factors: innovation in the rail Buses are crucial for the wider economy. More people commute
to work by bus (2.5 million daily plus 1 million as vital back up)
industry, especially in marketing and ticketing; the advent
than all other forms of public transport combined, and they
of wi-fi, which makes it more attractive to travel by train; and
generate £64bn in economic output every year. Buses are the
the cost of motoring relative to rail fares to mention just three.
primary mode of access to our city centres – even more than
Congestion is undoubtedly a key reason. Traffic congestion the car – and responsible for facilitating 29% of city centre
is the friend of the railways but the enemy of the bus. expenditure.
This report highlights just how corrosive congestion is to
bus patronage, and this research has given it a much higher One in ten bus commuters would be forced to look for another
weighting when ranking the factors which explain modal job or give up work all together if they could no longer commute
by bus. Around 400,000 people are in a better, more productive
split trends.
job, as a direct result of the access the bus service provides. It
If we are to emulate the success in rail, and achieve has been estimated that if bus journey times for commuters
modal shift from car to bus, then we have to protect bus in England could be improved by 10% it would be associated
passengers from congestion. with over 50,000 more people in employment. 8 If this 1% p.a.
increase in journey times continues we can expect to continue
to lose around 5,000 jobs annually as a consequence
UK PASSENGER TRANSPORT There is also a direct impact on jobs. Around 90,000 of the
MODEL SHARE OF PASSENGER 140,000 or so active holders of passenger-carrying vehicle
KILOMETRES (%) (PCV) licences are engaged in driving local buses. A 50%
increase in passengers would require 12.5% more drivers, or
1952 27 42 17 14
11,250 new jobs (appendix 3). This direct employment impact
underestimates the true figure as it doesn’t include the extra
jobs that would be created in the supply chain.
1962 57 24 12 7
1972 76 14 8 2 ENVIRONMENTAL IMPACT OF SLOWER SPEEDS
1982 81 10 6 4
Lower operating speeds are bad for pollution. Fuel efficiency
measured in kilometres per litre has declined by 35%
1992 86 6 6 2 since 2000 9 .
CONGESTION DRAMATICALLY INCREASES
2002 86 6 6 2
CARBON DIOXIDE EMISSIONS FROM VEHICLES.
2012 83 5 9 2
UNDER HEAVILY CONGESTED CONDITIONS
TAILPIPE EMISSIONS CAN BE INCREASED
OTHER
BY A FACTOR OF THREE OR FOUR TIMES 10 .
Source: Lazarus Partnership: Public Transport – Smartening up:
Technology’s role in modal shift, September 2014
9
Prof Peter White, University of Westminster: 10
Environmental Factors in Intelligent Transport
Impact of bus priorities and busways on energy Systems, Prof Margaret Bell. IEE Proceedings:
efficiency and emissions. Greener Journeys Intelligent Transport Systems, Vol 153 Issue 2,
[September 2015 ] 2006 The Need For This Study 1702. METHOD- OLOGY
02. METHODOLOGY

A. ECONOMIC ASSUMPTIONS

The assumptions made on elasticities are critical to the     If operators decide to increase headways( cut frequency)
assessment of what impact declining bus speeds have on       in response to falling bus speeds then this also has a negative
patronage. This research has been guided by some of the      impact on frequency(frequency/supply elasticity of 0.5)
best transport economists in the UK and there has been
support for the elasticities deployed in this study.         Traffic congestion has three distinct impacts on bus use:
This study looks at a 50-year period and this very long      1.      Higher operating costs and higher fares
run period results in higher elasticity levels than short
or medium term studies.                                      2.      Higher in-vehicle time

A 10% decline in bus speeds leads to an 8% increase in       3.      Deteriorating punctuality and reliability
operating costs: assuming operators try to preserve
                                                             This research looks at a low and a high scenario on
frequency levels by running extra buses. This is accepted
                                                             elasticities (see Table 1):
by academics and bus operators (ref- TAS) 11 . It is then
necessary to make the assumption that increases in
operating costs were passed onto the fare box – in reality
this would vary depending on market conditions. However,
someone has to pay for higher costs and in the long run
it is a reasonable assumption to make.

                                           LOW                                     HIGH

      Speed/operating cost                   0.8                                     0.8

      Fares/price elasticity                 0.7                                     1.0

      Fares impact                           0.8x0.7=0.56                            0.8x1=0.8

      In-Vehicle time.                       0.4                                     0.5

      Punctuality/reliability.               0                                       0.1

      Total                                  0.96                                    1.4

11
     The TAS Partnership:

                                                                                                               Methodology     19
HIGH ELASTICITY SCENARIO
BUSES 10%
SLOWER
EVERY DECADE
0.5
IN VEHICLE PUNCTUALITY HOW DO
TIME AND RELIABILITY OPERATORS
ELASTICITY DETERIORATE RESPOND?
MAINTAIN
A B
0.5 x 10%=
5%
0.2 x 10%= 0.1 x 10%=
1% 1%
FREQUENCY
BY RUNNING
MORE BUSES
FEWER
PASSENGERS
8%
IN COSTS
FREQUENCY/
SUPPLY
0.5
ELASTICITY =
IF COSTS
PASSED ON
TO FARES:
8%
IN FARES
0.5 x 10%=
FARE
ELASTICITY
= 1.0
5%
FEWER
PASSENGERS
1 x 8%= JOURNEYS
8%
FEWER
PASSENGERS
JOURNEYS IN THIS HIGHER
ELASTICITY SCENARIO
MAINTAINING FREQUENCY
LEADS TO A LARGER
FALL IN PATRONAGE
5% + 1% + 8% = 14%
FEWER
BUS JOURNEYS
EVERY DECADELOW ELASTICITY SCENARIO
BUSES 10%
SLOWER
EVERY DECADE
HOW DO
OPERATORS
RESPOND?
0.4
IN VEHICLE
TIME
ELASTICITY
B
FREQUENCY
A CUT BY
10%
MAINTAIN
FREQUENCY
0.4 x 10%= BY RUNNING
4%
MORE BUSES
FREQUENCY/
SUPPLY
0.5
ELASTICITY =
FEWER
PASSENGERS
IF COSTS
PASSED ON
TO FARES:
8% 0.5 x 10%=
5%
IN FARES
FARE FEWER
ELASTICITY PASSENGERS
= 7.0 JOURNEYS
7 x 8%=
5.6%
SIMILAR
OUTCOME
4% + 5.6% = 9.6%
FEWER
PASSENGER
JOURNEYS
EVERY DECADE02. METHODOLOGY
In the low elasticity scenario this research deploys a DfT In short, the aggregate high elasticity scenario is 1.4. If the
fares elasticity of 0.7 and the low range of the in-vehicle research were weighted towards the top end of the range it
time (TRL 2004 0.4 to 0.7) 12 . Because of the difficulty in would have been 1.8. On balance, this is judged to be too high.
estimating negative impacts on punctuality and reliability
The above elasticities are an average and would obviously
this has been given a zero value.
vary depending on what alternative modes of transport were
In the high elasticity scenario (another transport economists affordable and available. In London, for example, bus patronage
has suggested this should be labelled “medium” but this has declined by 5% over the last year, partly because for many
research is prudent and sticks with “high”) a fares elasticity – particularly those travelling on the north side of the Thames
of 1.0 has been used. The long run fares elasticity varies – there is an extensive Tube network which they can switch to.
between 0.7 and 1.2 (TRL, 2004). For the research uses The better the alternatives available, the higher the fares and
a modest estimate of 1.0 to avoid over-exaggeration. in-vehicle time elasticity.
The research also has a built-in estimate for punctuality/
Concessionary travel accounts for around one-third of bus trips
reliability in the high elasticity scenario of 0.1. It was
in the UK. Concessionary travellers are immune from the fares
important to do this as waiting at a bus stop is valued twice
effect of higher operating costs, but they will be affected by
as high as in-vehicle waiting time (ref: TRL, 2004). For in vehicle
higher in-vehicle times and poorer punctuality and reliability.
time the research used 0.5 in the high elasticity scenario,
However, because this is too challenging to calculate it has
well below the high end of the range (0.7).
been excluded from the model, which focuses on changes to
fare-paying journeys only.
STAGECOACH WEST
2002/03 2003/04 2004/05 2005/06 2006/07 2007/08 2008/09 2009/10 2010/11 2011/12 2012/13 2013/14 2014/15 2015/16
= 100 Lost miles due to congestion
12
The demand for public transport: a practical guide. R
Balcombe (ed), TRL Report TRL 593, 2004
22 Methodology02. METHODOLOGY
The chart above shows lost miles due to congestion on In areas where there is day-long congestion, operators
Stagecoach West services between 2002 and 2016. Lost are forced to increase resources to maintain the same level
mileage is defined as scheduled miles minus operating miles; of service, or look at widening headways or removing sections
it can be divided into traffic lost miles (for example delays of route in order to implement an achievable timetable.
caused by congestion) and operating lost miles (for example
If the operator response to congestion is to operate with
caused by driver shortages and vehicle breakdown).
the same level of resources at lower frequency, in effect
The chart shows a threefold increase in lost miles due to there is no change to variable driver or vehicle costs. Fewer
congestion. This results in a much less punctual and reliable miles are operated with the same number of buses and driver
service. The research has only included the impact of this hours but using less fuel and tyre costs. This would reduce
on bus use in the high elasticity scenario with a very low costs by 1.6% for each 10% reduction in miles, but a 10%
0.1 elasticity. reduction in frequency and miles might result in 5% reduction
in passengers and revenue (short run supply elasticity 0.5).
WHILE IT IS DIFFICULT TO QUANTIFY IN
If the operator response to congestion is to operate
THE MODEL, IN REALITY LOST MILES ON additional buses to maintain the same service frequency
THIS SCALE CREATE HAVOC WITH THE this would increase driver, fuel, tyre, and vehicle costs
TIMETABLE AND ERODE PASSENGERS’ (depreciation, lease, licences) and maintenance costs
(labour and materials). Stagecoach has calculated that
CONFIDENCE IN THE SERVICE.
this would increase costs by 7.9% for each 10% increase
in resources – very similar to the TAS industry average
HOW BUS OPERATORS REACT TO CONGESTION calculation of a 0.8% increase in operating cost for each
1% decline in operating speed 13 .
Bus operators either try and maintain frequencies, which THE DIFFICULT JUDGEMENT FOR AN
means more buses (a greater peak vehicle requirement),
OPERATOR FACED WITH WORSENING
or they let frequencies decline. The end result is pretty similar
in the economic model used to forecast patronage impacts. PUNCTUALITY IS WHETHER TO REDUCE
If they deploy more buses then operating costs will rise by FREQUENCY AND RISK PATRONAGE LOSS,
0.8% for every 1% decline in speed. This reduces patronage OR TO MAINTAIN FREQUENCY WITH
by 0.56% in the low elasticity scenario (0.8 x 0.7 = 0.56%).
INCREASED RESOURCES.
If they decide to reduce frequency then we get a 0.5%
On balance it is unlikely that operating at the same
reduction in patronage using a frequency/supply elasticity
frequency, albeit more punctually, will generate sufficient
of 0.5. In reality a bus operator’s response will depend on
additional revenue to offset the additional costs unless
local market conditions and often will be a combination
there are other factors generating patronage growth.
of the two reactions mentioned above.
13
Cost issues in public transport operation, CfiT,
January 2008 http://webarchive.nationalarchives.gov.
uk/20110304132839/http://cfit.independent.gov.uk/
pubs/2008/index.html Methodology 2302. METHODOLOGY
Bus use is influenced by a number of factors—these not only Policy
relate to the bus service itself, but the supporting infrastructure Modal shift
and the attractiveness of other modes Buses
Attribute Evidence of impact1
Fares Bus fare elasticities average -0.4 in the short-run to -1.0 in the long run (i.e. a 10% rise in fares will lead to a 10% fall in
patronage in the long run) – responsiveness of demand to fare changes is less sensitive in the peak
Journey time The elasticity of bus demand to in-vehicle time for urban buses has been estimated to be roughly in the range of -0.4 to -0.6
Service levels The elasticity of bus demand to vehicle kilometres is approximately +0.4 in the short-run and +0.7 in the long run
Ride quality Studies in London have indicated that a smooth vehicle motion is worth 10.5p per passenger (1996 prices and values)
Real-time information Passengers in London valued countdown boards at 9.0p per trip (1996 prices and values)
Safety Bus users value CCTV at stops and on the bus at 16.6p and 5.8p respectively (2001 prices and values)
Waiting environment The provision of information at bus stops has been valued at 4-10p per passenger
Interchange Passengers dislike having to interchange – the ‘penalty’ associated with the need to interchange is equivalent to 5 minute
journey time even before waiting time and the cost of an additional fare is factored in
Car costs Bus use is sensitive to changes in the costs of fuel. A 10% fall in petrol costs for motorists is estimated to reduce bus demand
by 21%
Income Each 10% increase in income reduces bus use by 5%-10%, this includes the impact of higher car ownership
Policy implication: there are a number of ways to influence the level of bus demand – the list above is not exclusive; and
these interventions do not just relate to bus service attributes—interventions off the bus, such as an improved waiting
environment and better information, can have a significant impact on demand
(1) TRL (2004) The demand for public transport: a practical guide
104
The above table showing the top ten factors
influencing bus use, the top three on the list are
affected by congestion: fares, journey time and
frequency. Source: An Analysis of Urban Transport,
Cabinet Office Strategy Unit, November 2009
24 Methodology02. METHODOLOGY
B. CASE STUDIES
THE UK HAS THE MOST CONGESTED ROAD The TomTom index measures the difference between
off-peak and peak traffic speeds. As Belfast has relatively
NETWORK IN EUROPE 14. good off-peak speeds compared with other cities, this
exaggerates ITS’ congestion problem.
This was the case when the Commission for Integrated
Transport benchmarked the UK against European best The INRIX data has Belfast as the third most congested
practice in 2001, and has been confirmed since by extensive city in the UK, behind London and Manchester. The INRIX
data from companies such as TomTom and INRIX through index measures urban motorway traffic delays, so would
the monitoring of live traffic flows. exclude Edinburgh and Brighton, which are mainly devoid
of urban motorways.
The latest TomTom congestion index shows seven UK cities in
Europe’s top 30 most congested: Belfast, London, Manchester, Balancing the two indexes the following cities have been
Edinburgh, Brighton, Hull and Bristol. Congestion in the UK’s included in the case studies: Brighton, Bristol, Dublin,
biggest cities is 14% worse than it was just five years ago. Edinburgh, Glasgow, Gloucestershire, Greater Manchester,
Hull, London, Oxford and West Midlands. Due to difficulty
Across the rest of Europe, average congestion is actually
in obtaining bus journey time data from Belfast it was
down 3% over the same period.
not included in the study
The annual Traffic Index from TomTom shows average UK
journeys in 2015 took 29% longer than they would in free-
flowing conditions – up from a 25% average delay in 2010.
14
European best practice in delivering integrated
transport. Commission for Integrated Transport,
November 2001 http://webarchive.nationalarchives.
gov.uk/20110304132839/http://cfit.independent.gov. Methodology 25
uk/pubs/2001/index.html03. RESEARCH FINDINGS
03.
RESEARCH
FINDINGS
A. BUS JOURNEY TIMES ARE INCREASING (NOTES TO CHART)
The trend in bus journey times is an increase of between Fig 0.98% p.a Increase in average bus journey times.
0.5% and 1.5% per-annum - for city wide services (daily
Data covers 1986-2006 except for:
average) over the past 30 years, with an average increase
of 0.98% per annum for the six case studies as shown Brighton: 2008-2016. The south coast town has experienced
in as shown in chart below. a sharp increase in congestion levels.
London: 2003/4 (from peak levels just after congestion
charging) to 2015/16. It covers central, inner and outer
London
Increase in Journey Time
2.5
1
1.5
P.A%
1
0.5
0
s
er
h
on
w
rd
in
ge
re
n
ll
ol
nd
rg
do
Hu
hi
go
st
bl
ist
fo
ra
ht
bu
la
rs
Du
e
n
as
Ox
e
Br
ig
ch
Lo
id
te
Av
in
Br
Gl
M
an
s
Ed
ce
t
M
es
ou
W
Gl
Cities
11
The TAS Partnership:
Research Findings 2703. RESEARCH FINDINGS
INCREASE IN JOURNEY TIME ON SELECTED SERVICES (AM PEAK) FROM 1966 TO 2016
100
90
80
PERCENTAGE INCREASE
70
60
70
40
30
20
10
0
LONDON: SERVICE 25 GLOUCESTER TO MANCHESTER: SERVICE 82(NOW 83) EDINBURGH: SERVICE 23. EDINBURGH: MANCHE AVERAGE
STRATFORD TO CHELTENHAM OLDHAM MARKET PLACE MORNINGSIDE TO TRINITY SERVICE 24. STER: SERVICE 41
OXFORD CIRCUS TO PACCADILLY SILVERKNOWES RUSHOLME TO ROYAL EXCHANGE
TO CITY CENTRE
Services
The data in the bar chart above is derived from archived DECLINE IN BUS SPEEDS NOT CONFINED
timetables for 1966 and compares journey times then, with a TO URBAN CONURBATIONS.
section of the same route from today’s timetable. Journey time
on the 25 from Stratford to Oxford Circus in the a.m. peak has
increased from 40 minutes in 1966 to 78 minutes today. The It doesn’t have to be this way. Bus passengers can be protected
journey time has almost doubled. It must be borne in mind that from traffic congestion if there is the political will. Indeed, the
the move to one man operated buses impacts negatively on examples below shows how we can improve journey times by
journey times for the longer term data going back to the 1960’s. bus if radical action is taken.
CHELTENHAM - GLOUCESTER (PEAK)
56
60
AVERAGE JOURNEY TIME IN MINUTES
55
50
45
40
35
30
25
20
15
1990 2000 2007 2016
YEAR
87% increase in journey time. 3.34% increase p.a. Stagecoach data.
28 Research Findings03. RESEARCH FINDINGS
EDINBURGH: % CHANGE IN AVERAGE JOURNEY TIME (AM PEAK)
25
20
15
% CHANGE
10
5
1986 - 2016
0
1986 - 2016
-5
-10
YEAR
In Edinburgh, the introduction of Greenways bus priority in
1996, following years of good conventional priority measures,
resulted in a 4% improvement in journey times between 1986
and 1996. Alas, for reasons you can read about in more depth
in the case study on Edinburgh in the appendix, this was not
sustained. This included weaker enforcement, removal of
priority during off peak and lack of maintenance of bus lanes.
BRIGHTON: PEACEHAVEN TO BRIGHTON STATION
AVERAGE JOURNEY TIME IN MINUTES
32
31
30
29
28
27
26
25
24
23
1976 (SERVICE 12) 2016 (SERVICE 12X)
YEAR
In Brighton, on the Peacehaven to Brighton Station service,
there has been a 16% improvement in journey time since 1976
and a 4% improvement per annum, thanks to highly effective
bus lanes along the A259 coastal corridor. Journey time
between Brighton Station and Peacehaven is actually seven
minutes quicker today than it was in 1966. It shows what can be
done, and that we do not have to accept declining bus speeds as
being inevitable.
Research Findings 2903. RESEARCH FINDINGS
B. IMPACT OF INCREASED JOURNEY TIMES ON BUS USE. priority measures, such as red routes and other initiatives,
and the central congestion charging zone introduced in 2003.
If the average urban bus speed in the UK has historically been
If average bus speeds in the most congested urban areas decreasing by almost 1% p.a., then for one-third of London
decline on average by almost 1% per annum, this means that bus routes the decline been more than five times this average
operating costs due to congestion are increasing by around over the past year. This has become a crisis for the capital and
0.8% 15 . Assuming that costs are passed on to the passenger in something the new mayor must prioritise. London, which for
fares, and we apply an elasticity of 0.7, this results in a 0.56% more than a decade has been the UK’s bus success story,
decline in passengers every year as a result of the operating with passenger numbers doubling since the formation of TfL
cost impact. To do this it is necessary to add the decline in in 2000, is now facing one of the fastest declines in bus use
passenger numbers due to increased in-vehicle waiting time. anywhere in the UK.
With an in-vehicle elasticity of 0.5, this leads to a 0.5% decline
in passengers. If the two are added together there is a 10.6% There is a key lesson to be learned from this. You can get all
decline in passengers every decade from the congestion impact the other ingredients right: modern bus fleet, cashless buses
on buses on the low elasticity scenario. On the high elasticity with the most advanced smartcard ticketing system in the
scenario a 14% decline in bus use every decade as a result of world, a level of integration which is the envy of other UK cities,
congestion can be seen. If bus passengers had been protected state-of-the-art passenger information at the bus stop and on
from rising congestion over the past 50 years, then fare-paying mobile devices. Add to this population and employment growth
patronage in the cities covered in this report would be at least and you should have a recipe for the London bus success story
50% higher than today’s figure. This time period has been continuing. But all these laudable ingredients cannot offset the
chosen as the mid-1960s was when car ownership and rapid deterioration in bus journey times.
traffic began to grow exponentially.
Boris Johnson was right to warn that his successor will have to
LONDON “FALLING” use tougher congestion charging measures to tackle London’s
growth in congestion, but there is insufficient evidence to
suggest he took enough effective action on his watch. He
IN LONDON BUS SPEEDS HAVE BEEN exacerbated the problem by removing the western extension
of the congestion zone and by reducing road capacity in central
DECLINING FASTER THAN ANYWHERE ELSE London on key routes through the introduction of cycle
IN THE UK OVER THE LAST FEW YEARS. superhighways – without taking action to curtail traffic in
central London
This comes after of decades of relative success in protecting
bus passengers from traffic congestion through effective bus
BUS USE IN LONDON
8
Annual Percentage Change in Bus Journeys
6
4
2
0
-2
-4
05/06 06/07 07/08 08/09 09/10 10/11 11/12 12/13 13/14 14/15 15/16
15
Year The TAS Partnership, [1] op. cit
30 Research Findings04. CHALLENGES MOVING FOREWARD
04. CHALLENGES MOVING FORWARD

A. CONGESTION IS GETTING WORSE
                                                                               GROWTH OF LGV AND HGV TRAFFIC
                                                                               120    Index 2004=100
The average speed of general traffic on local roads was                        115
23.4mph in year ending December 2015. In November 2015
it was 3% slower than in November the previous year,                           110

and in December 2015 it was 2.9% slower than the
                                                                               105
previous December.
                                                                               100
The average traffic speed in Bristol, Reading, Slough,
Manchester and London is less than 10mph.                                       95
                                                                                                                               All Motor Vehicle Traffic
The DfT’s 2015 forecast was that traffic will grow by                           90

between 19% and 55% between 2010 and 2040
                                                                                85

CONGESTION ON LOCAL AUTHORITY                                                   80

MANAGED A-ROADS, ENGLAND                                                             2004   2005   2006   2007   2008   2009    2010   2011   2012   2013   2014

AVERAGE VEHICLE SPEEDS (MILES PER HOUR)                                        Van traffic has risen faster than that of any other vehicle type,
28                                                                             with van miles increasing by 6.1% between Dec 2014 and Dec
                                                                               2015 to a new peak of 47.7 billion vehicle miles. This represents
27
                                                                               a 24% increase compared with 10 years ago and a 73% increase
                                                                               compared with 20 years ago.
26

                                                                     Month     The biggest four online shopping markets in the world
25
                                                                               are predicted to double in size over the next three years
24                                                                             as consumers buy increasing amounts of goods through
                                                                               the internet.
23
                                                                 Year Ending   British shoppers already spend almost £1 in every £5
22                                                                             of their shopping via the internet and the online shopping
 Jul-07   Sept-08   Oct-09   Nov-10   DEC-11   Jan-13   Feb-14   Mar-15
                                                                               revolution will continue.

There has been a rapid decline in traffic speed over the last                  Online retail expenditure in the UK is forecast to grow by
five years on A-roads, as shown in Fig zz. The key causes in                   44.9% in the coming five years to reach £62.7bn in 2020.
urban areas are: delivery vans, private hire vehicles,
road works and traffic lights.                                                 It is surprising that more household parcels are not delivered
                                                                               in the evening when the roads are quieter and people are more
                                                                               likely to be at home. The proliferation in the number of vans
DELIVERY VANS                                                                  is becoming such a problem that it is worth investigating the
                                                                               impact a charging scheme could have to incentivise deliveries
                                                                               off-peak, especially during the evening.
The rapid growth in delivery vans is a result of the
proliferation of online shopping. This represents a double
blow to the bus sector: first, it increases operating costs
due
to more congested roads, and second, there is less revenue
for buses as fewer shopping trips are made (shoppers
account for one-third of all bus journeys).

32    Challenges Moving Forward
You can also read