CPB - Road Safety in European Cities Performance Indicators and Governance Solutions
←
→
Page content transcription
If your browser does not render page correctly, please read the page content below

CPB
                Corporate Partnership
                Board

Road Safety in
European Cities
Performance Indicators
and Governance Solutions
                                        Case-Specific Policy Analysis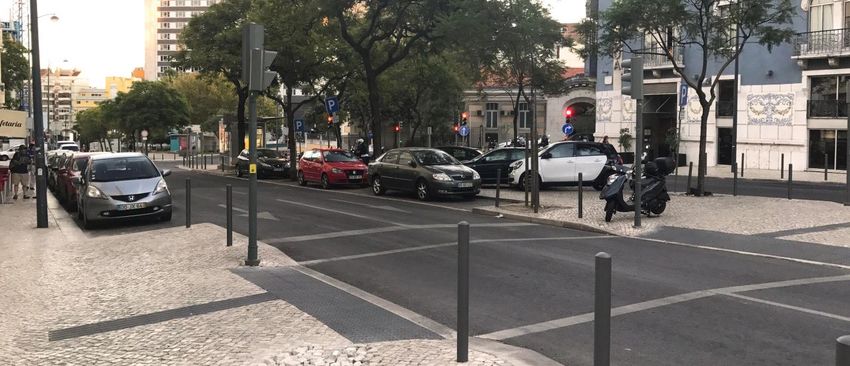
Road Safety in
European Cities
Performance Indicators
and Governance Solutions
                           Case-Specific Policy Analysis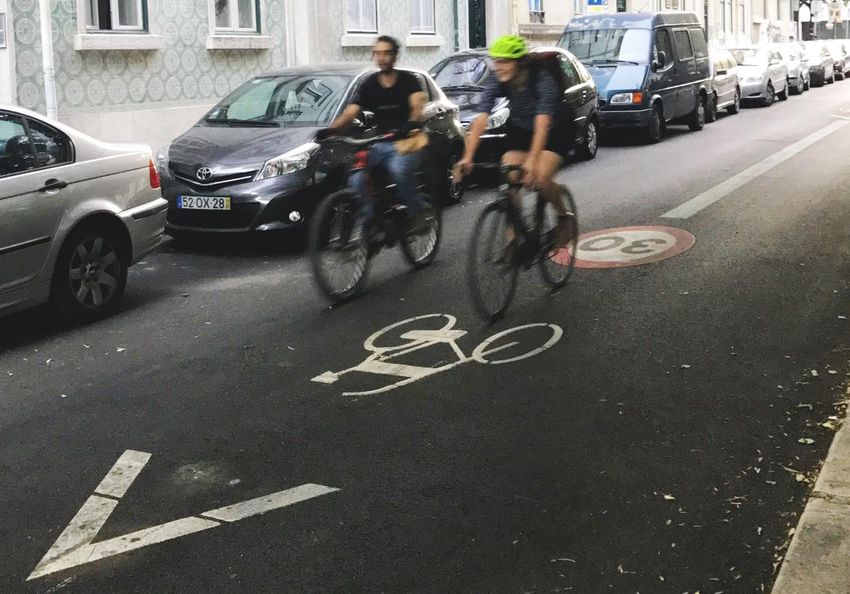
The International Transport Forum

The International Transport Forum is an intergovernmental organisation with 59 member countries. It acts as
a think tank for transport policy and organises the Annual Summit of transport ministers. ITF is the only global
body that covers all transport modes. The ITF is politically autonomous and administratively integrated with
the OECD.
The ITF works for transport policies that improve peoples’ lives. Our mission is to foster a deeper
understanding of the role of transport in economic growth, environmental sustainability and social inclusion
and to raise the public profile of transport policy.
The ITF organises global dialogue for better transport. We act as a platform for discussion and pre-negotiation
of policy issues across all transport modes. We analyse trends, share knowledge and promote exchange
among transport decision-makers and civil society. The ITF’s Annual Summit is the world’s largest gathering of
transport ministers and the leading global platform for dialogue on transport policy.
The Members of the Forum are: Albania, Armenia, Argentina, Australia, Austria, Azerbaijan, Belarus, Belgium,
Bosnia and Herzegovina, Bulgaria, Canada, Chile, China (People’s Republic of), Croatia, Czech Republic,
Denmark, Estonia, Finland, France, Georgia, Germany, Greece, Hungary, Iceland, India, Ireland, Israel, Italy,
Japan, Kazakhstan, Korea, Latvia, Liechtenstein, Lithuania, Luxembourg, Malta, Mexico, Republic of Moldova,
Montenegro, Morocco, the Netherlands, New Zealand, North Macedonia, Norway, Poland, Portugal, Romania,
Russian Federation, Serbia, Slovak Republic, Slovenia, Spain, Sweden, Switzerland, Turkey, Ukraine, the United
Arab Emirates, the United Kingdom and the United States.

                                         International Transport Forum
                                               2 rue André Pascal
                                             F-75775 Paris Cedex 16
                                              contact@itf-oecd.org
                                                www.itf-oecd.org

                     Case-Specific Policy Analysis Reports
The ITF’s Case-Specific Policy Analysis series presents topical studies on specific issues carried out by the ITF in
agreement with local institutions. Any findings, interpretations and conclusions expressed herein are those of
the authors and do not necessarily reflect the views of the International Transport Forum or the OECD.
Neither the OECD, ITF nor the authors guarantee the accuracy of any data or other information contained in
this publication and accept no responsibility whatsoever for any consequence of their use. This work is
published under the responsibility of the Secretary-General of the ITF. This document, as well as any data and
map included herein, are without prejudice to the status of or sovereignty over any territory, to the
delimitation of international frontiers and boundaries and to the name of any territory, city or area.
Cite this work as: ITF (2019), “Road Safety in European Cities: Performance Indicators and Governance
Solutions”, International Transport Forum Policy Papers, No. 67, OECD Publishing, Paris.
Acknowledgements

This report was written by Alexandre Santacreu and Tatiana Samsonova of the International Transport
Forum (ITF).
We thank the European Commission's Directorate-General for Regional and Urban Policy for funding this
research that also facilitated a faster development of the Safer City Streets network in Europe. Funding
from the European Commission also supported the development of further indicators and data
collection techniques.
The Section on road safety performance indicators draws from data collected as part of the Safer City
Streets initiative. This initiative is funded by the International Automobile Federation (FIA) Road Safety
Grant Programme and delivered by the ITF. The Safer City Streets initiative has brought together road
safety experts working in cities since its launch at the UN Habitat III conference in 2016. The scope of the
initiative includes data collection, with the development and maintenance of a city-level database on
mobility and road safety statistics. This work also benefits from the guidance and support of the ITF’s
International Traffic Safety Data and Analysis Group (IRTAD), who organised the pilot stage and
established the methodological framework.
The elaboration of the Section was facilitated by a series of Safer City Streets network meetings, which
were kindly hosted in turn by the Polis network, the Vias Institute and the Italian Automobile Club (ACI).
We are very grateful to Dagmar Koehler at Polis for her support during three joint ITF/Polis road safety
data workshops. The UK Department for Transport provided precious help by offering National Travel
Survey results and traffic volume by functional urban area (FUA).
The European Commission’s Directorate General for Mobility and Transport made one of the most
valuable contributions by allowing access to the Care Database and by providing road casualty data in
urban areas.
We thank the members of the Safer City Streets network, mostly found in local government road safety
teams, who dedicated their time to collect and share their local road safety figures. National level
government officers and experts from research institutes kindly complemented the data collection
where gaps were identified.
This work forms part of the combined project “Access and Safety in European Cities”, of which this report
is one of the main outputs. The project was carried out by the ITF and the Centre for Entrepreneurship,
SMEs, Regions and Cities, both part of the OECD. The development of the action was supported by a
financial contribution awarded by the European Commission.
The Section on governance solutions is based on site visits and draws from stakeholder interviews that
were conducted in September 2017 in Lisbon, Portugal and May 2018 in Riga, Latvia. We are grateful
towards all interviewees for their time and information provided to develop this report. In Lisbon the
interviews were conducted with: João Afonso (Deputy Mayor for Social Rights); Fatima Madureira
(Mobility Director, Municipality of Lisbon); Pedro Gouveia (Coordinator, Pedestrian Accessibility Plan
Team, Municipality of Lisbon); Manuel João Ramos (President of ACA-M, a Portuguese NGO for
pedestrians); Mario Alves (Secretary General of the International Federation of Pedestrians). In Riga the
interviews were conducted with: Annija Novikova (Deputy Director of Road Transport Department,
Ministry of Transport of the Republic of Latvia); Jānis Kalniņš (Senior Officer of the Road Transport
Department, Ministry of Transport of the Republic of Latvia); Ilze Ostaša (Riga City Council Traffic
Department); Kristine Malnaca (Transport and Economics consultant); Irina Yatskiv (Vice-Rector for
Science and Development Affairs at TSI); Alvis Pukîtis (Deputy Head of Road Safety Audit department at
Road Traffic Safety Directorate (CSDD).
The document was reviewed internally by Veronique Feypell and Rachele Poggi at the ITF. External
comments were received from Lewis Dijkstra, Paolo Bolsi, Lucia Pennisi, Davide Shingo Usami, Jennifer
Mindell, Álvaro Gómez Méndez, Ilze Ostaša, Kristine Malnaca, Pedro Gouveia and Dovilė Adminaitė.
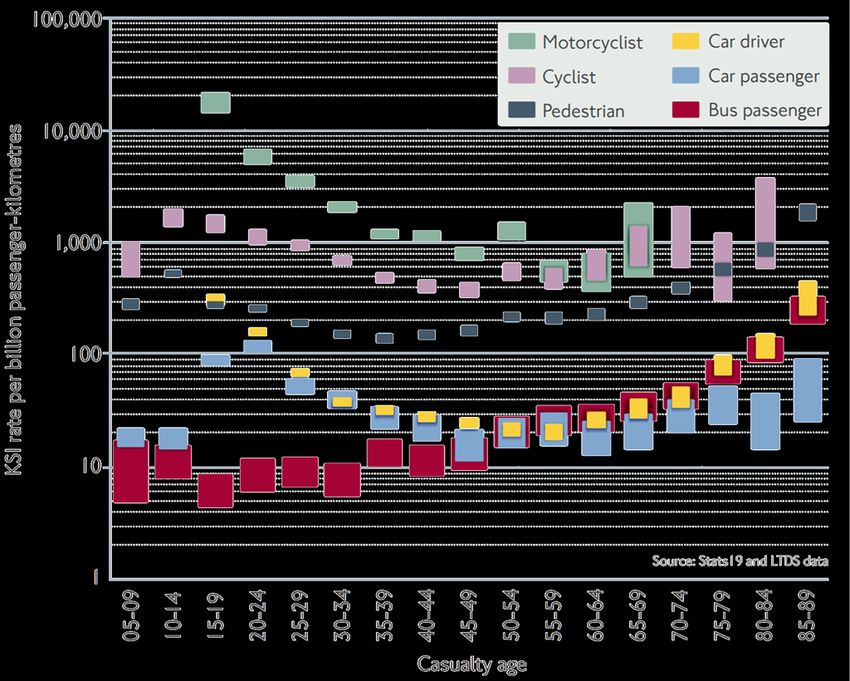
TABLE OF CONTENTS
Table of contents
Executive summary ........................................................................................................................................8
Introduction ................................................................................................................................................. 11
Road safety performance indicators ............................................................................................................. 13
Accounting for various city shapes and definitions ..................................................................................13
Why are some cities safer than others? ...................................................................................................15
Why are some modes safer than others? ................................................................................................18
Casualty risk by age and mode .................................................................................................................27
Links between fatalities and traffic volume ..............................................................................................28
Women are less likely to die in traffic ......................................................................................................30
Serious injury monitoring remains a major challenge ..............................................................................32
Conclusions from the analysis of road safety indicators............................................................................... 35
Road Safety Governance: Case study of Lisbon, Portugal............................................................................. 37
National and sub-national governance ....................................................................................................38
Municipal and sub-municipal governance................................................................................................40
Leveraging public awareness and putting road safety high on the political agenda ................................40
Using participatory budgeting to involve citizens in the decision-making process ..................................41
Linking pedestrian accessibility and safety with the needs of an ageing population ...............................41
Putting a strong focus on capacity building to support citywide accessibility and safety actions ............45
Developing clear technical guidance and standards ................................................................................46
Road Safety Governance: Case study of Riga, Latvia ..................................................................................... 48
National and sub-national governance ....................................................................................................50
Municipal and sub-municipal governance................................................................................................52
Promoting dialogue and co-ordination of actions related to road safety ................................................52
Speed enforcement through introduction of speed cameras ..................................................................52
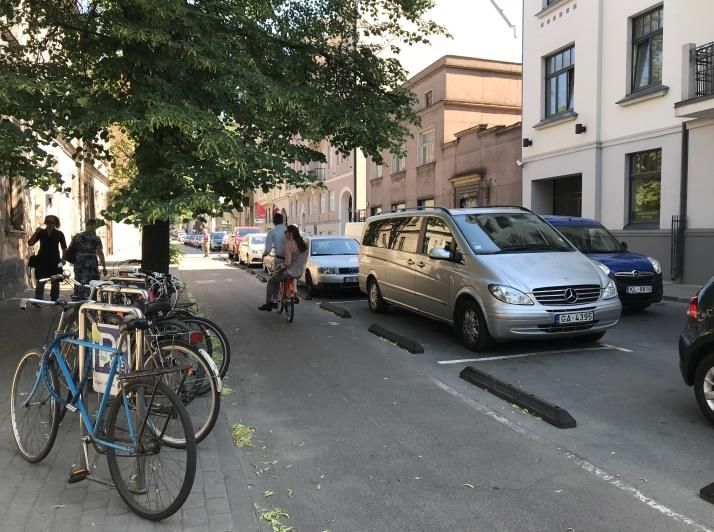
Developing cycling infrastructure.............................................................................................................53
Conclusions from road safety governance case studies ............................................................................... 56
Notes............................................................................................................................................................ 58
Annex A: Estimation of trips and distances travelled in cities ....................................................................... 63
Annex B: Estimation of trips and distances travelled in functional urban areas ............................................ 65
Annex C: List of cities involved in analysis ..................................................................................................... 66
ROAD SAFETY IN EUROPEAN CITIES © OECD/ITF 2019 5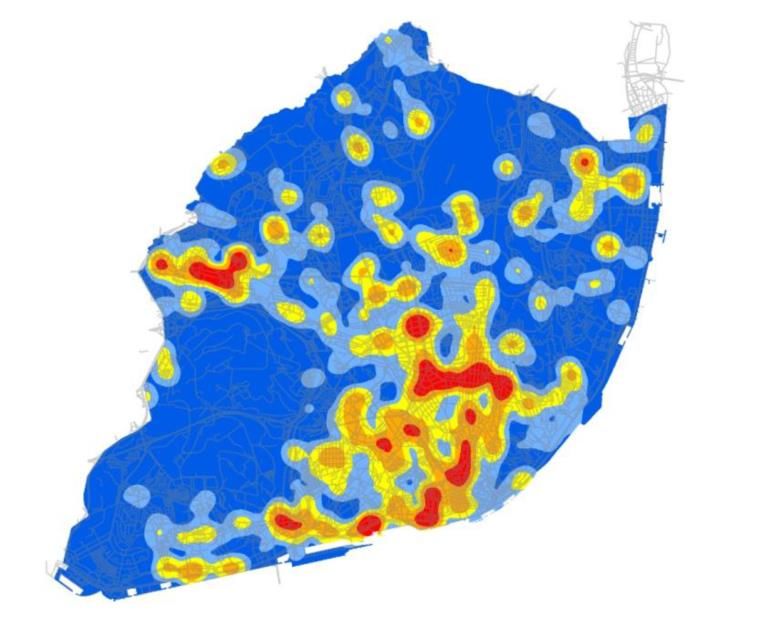
TABLE OF CONTENTS

                                                                Figures

Figure 1. Virtuous circle of road danger reduction ......................................................................................12
Figure 2. Cities contributing to the Safer City Streets database...................................................................14
Figure 3. Concentric urban perimeters in London and Paris (to scale) .......................................................14
Figure 4. Population density and land areas of selected cities ....................................................................15
Figure 5. Road fatalities in selected cities ....................................................................................................17
Figure 6. Elasticity of mortality with regard to population density in European urban areas ......................18
Figure 7. Modal shares of road fatalities in selected cities and functional urban areas ..............................19
Figure 8. Risk of fatality by mode and by city...............................................................................................20
Figure 9. Traffic fatalities in Bogotá per mode and per vehicle involved .....................................................23
Figure 10. Number of fatalities in collisions involving a given user group in selected cities ........................24
Figure 11. Number of pedal cycle fatalities per unit of population .............................................................26
Figure 12. Number of fatalities per unit of population ................................................................................26
Figure 13. Casualty rate per billion kilometres by age and by mode in London...........................................27
Figure 14. Traffic fatalities in selected urban areas compared to country...................................................28
Figure 15. Pedestrian traffic fatalities in selected urban areas compared other road user types ...............29
Figure 16. Ratio between male and female traffic fatalities ........................................................................31
Figure 17. Ratio of serious traffic-related injuries to fatalities in selected cities .........................................32
Figure 18. Ratio of MAIS3+ injuries to fatalities in selected cities................................................................32
Figure 19. Lisbon pedestrian casualty heat map ..........................................................................................37
Figure 20. Lisbon metropolitan area mode shares ......................................................................................38
Figure 21. Pavement extensions in Lisbon ...................................................................................................42
Figure 22. Street markings to signal 30 km/h speed limit, Lisbon ................................................................43
Figure 23. Before pavement extension and raised treatment at a pedestrian crossing ..............................44
Figure 24. After pavement extension and raised treatment at a pedestrian crossing .................................44
Figure 25. Riga and its region .......................................................................................................................48
Figure 26. Road traffic crashes involving cyclists in Riga..............................................................................54
Figure 27. Cycle lane with light protection from motor vehicle traffic, Riga................................................55
Figure B.1. Correlation between cycling trips, distances and mode shares in functional urban areas ........65

6                                                                                            ROAD SAFETY IN EUROPEAN CITIES © OECD/ITF 2019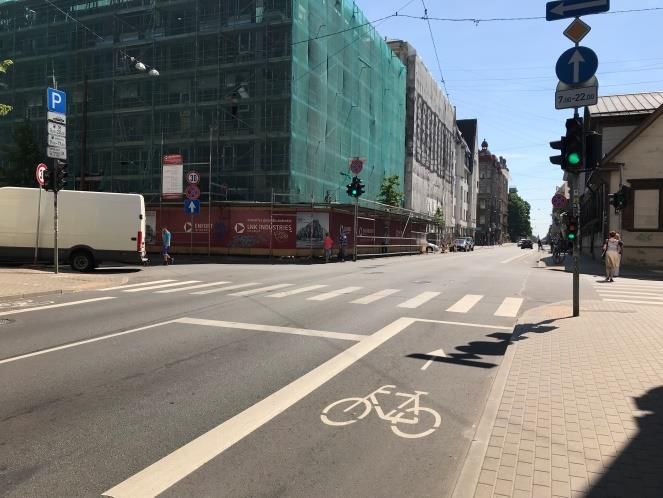
TABLE OF CONTENTS

                                                              Tables

Table 1. Number of fatalities per billion passenger-kilometres ...................................................................21
Table 2. Number of road fatalities by mode in selected cities .....................................................................22
Table 3. Risk of serious injury per unit of distance travelled and per unit of time spent in traffic ...............34
Table 4. Distribution of road traffic crashes by type in Riga ........................................................................50
Table C.1. Population and density statistics .................................................................................................66

                                                               Boxes

Box 1. Estimating motor vehicle traffic in the United Kingdom ...................................................................29
Box 2. The Rhône Road Trauma Registry .....................................................................................................34
Box 3. Application of a pedestrian crossing model and traffic light management .......................................44
Box 4. Geographic Information Systems ......................................................................................................45
Box 5. Capacity building steps to traffic calming..........................................................................................46

ROAD SAFETY IN EUROPEAN CITIES © OECD/ITF 2019                                                                                               7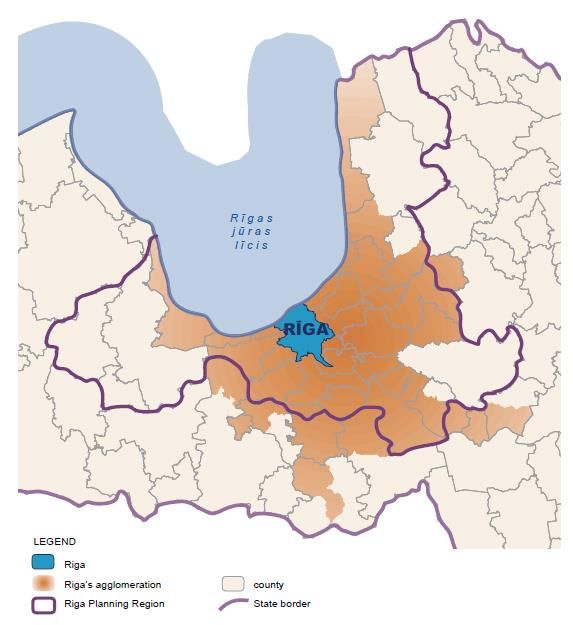
EXECUTIVE SUMMARY

                                 Executive summary

What we did

This reports benchmarks road safety performance in 72 urban areas, mostly in Europe, and illustrates
governance solutions to improve urban road safety with case studies conducted in Lisbon (Portugal) and
Riga (Latvia). The report proposes new road safety indicators to assess the level of risk for each mode of
transport. Data for 31 administrative perimeters collected directly from local governments. Of these, 19
are in Europe, ten in the Americas and two in Oceania. Data for a further 41 functional urban areas (FUA)
in Europe were gathered from national and European sources. A network of road safety experts was
developed to support the data collection and to share experiences with road safety analysis and policy
making. Members of this network met for five rounds of discussions between April 2017 and November
2018 within the framework of ITF’s Safer City Streets initiative. Additional stakeholder interviews and
desk research were conducted to outline the role of specific policies and governance frameworks, to
highlight practical solutions and to make recommendations for improving urban road safety.

What we found

Considerable differences in fatality risk for road users exist between cities, and much can be learned
from cities which have successfully in lowered this risk. Yet counting fatalities may not tell the full story
of a city’s road safety performance. In addition, fatalities are challenging to analyse statistically because
of the relatively small numbers at the municipal level. For these reasons the analysis of traffic injury data
is also important. However, injuries sustained in traffic crashes remain notoriously under-reported, and
different metrics are used to score their severity in different places.
Pedestrians, cyclists and motorcyclists are the most vulnerable road users; they make up about 80% of
road fatalities in dense European urban areas. Non-motorised road users face a fatality risk almost ten
times greater than the risk for car passengers for a given distance travelled in cities. Yet car traffic
creates a far greater risk for third parties involved in crashes. Modal shift away from private motor
vehicles could significantly improve road safety in dense urban areas. It would also bring public health
benefits associated with increased physical activity and improved air quality. Areas where people cycle
the most also have the lowest total road mortality.
Major road safety problems result from policies which have created car-dependent communities. These
are often the effect of urban sprawl, fuelled by lacking integration of land-use and public transport
planning at metropolitan level. Car-dependent communities generate large traffic volumes and therefore
large risks. They also tend to resist policies addressing traffic volume and car speeds, since they have very
little alternative mobility options.
Two examples of cities where road safety has not been a political priority and where there is large room
for improvement are Lisbon and Riga. Both cities are confronted with relatively weak metropolitan
governance frameworks. Nevertheless, local stakeholders found a range of ways to act on road safety. In
Lisbon, linking pedestrian safety and accessibility with the needs of the senior population helped reduce
both vehicle speeds and various barriers to walkability. In Riga, a dedicated Traffic Co-ordination Advisory
Council has integrated road safety actions into core traffic and mobility management functions.

8                                                                  ROAD SAFETY IN EUROPEAN CITIES © OECD/ITF 2019
EXECUTIVE SUMMARY

What we recommend

Develop mobility plans and observatories in cities
More local governments should adopt sustainable urban mobility plans (SUMPs) at the metropolitan
level. Road safety action plans should be integrated or linked to SUMPs, since road safety is critical to
making active travel both popular and inclusive. Governments should establish a framework for the
collection and reporting of relevant urban mobility and casualty figures. Such urban mobility and road
safety observatories should also be integrated into the development and review of SUMPs. This would
make it easier to analyse and interpret road safety trends. Data on user behaviours and attitudes as well
as on enforcement of traffic rules could be included.
Use appropriate indicators to measure the safety of vulnerable road users
The absolute number of road traffic fatalities and injuries are important indicators for monitoring road
safety trends and setting road safety targets. However, to measure, monitor and benchmark the level of
risks experienced by a specific road user group, the volume of travel by that group should be controlled
for. To make this possible, the number and length of trips in each mode should be systematically
collected and monitored. A range of solutions are available for this purpose, including household travel
surveys. To secure funding for data collection, cities should consider working in partnership with
metropolitan authorities, national authorities, and authorities in charge of public health or using
simplified but standardised survey methods.
Collect traffic casualty data from hospitals and from the population, not only from police records
Developing reliable data on injuries is especially important at city-level where low absolute fatality
numbers can hamper statistically significant insights. All stakeholders should seek to establish protocols
for the collection of injury data from the health and emergency services. Their goal should be to
complement police records, which are often the only source of information on casualty numbers in spite
of the notorious underreporting of casualties in police records. The categorisation of injury severity using
an international medical standard called MAIS3+ is recommended to enable the monitoring of progress
over time and to make meaningful comparisons across cities. Population surveys could help estimate and
monitor the self-reported number of people injured in traffic, although they should not be regarded as a
substitute for hospital data.
Improve the comparability of road safety statistics
The comparability and relevance of benchmarking indicators should be consistently questioned. To
improve the comparability and relevance of mortality rates, especially in central urban zones where the
resident population does not always reflect the true daytime activity, all cities should estimate a daytime
population figure.
Adopt ambitious targets for casualty number reduction
Cities should adopt ambitious targets for reducing road fatalities and serious injuries, in line with the Safe
System principles. Large performance gaps with regard to road safety exist between cities, and could
help secure political support for ambitious casualty reductions.
Focus on protecting vulnerable road users
Cities should intensify their efforts in improving the safety of vulnerable road users. These make up the
vast majority of urban traffic fatalities and are exposed to a significantly greater level of risk. Cities should
enhance provisions for people to walk and cycle more safely and more often. A particular focus should

ROAD SAFETY IN EUROPEAN CITIES © OECD/ITF 2019                                                                 9
EXECUTIVE SUMMARY

be placed on street (re-)design and on protected infrastructure, such as segregated cycling paths. Such
measures can also reduce the speed and volume of motor vehicle traffic, thus reducing the risk of road
casualties, and will generally have positive impacts on public health and inclusiveness.
Conduct further research on crash risks
Crash data from a larger set of cities is needed to address open questions through more research. The
relationships between urban shape, density, speeds, modal share and road user risk in particular requires
further investigation. Gender questions and social aspects of road safety should also be examined in
more detail. This will require robust casualty data as well as reliable data on trips. An immediate focus
should be placed on the analysis of casualty matrices to reveal number of people in each user group
which are killed or seriously injured in crashes involving another user group.
Local government should demonstrate leadership
Strong political leadership from local government is needed for successful road safety policies at city-
level. It should both incentivise and co-ordinate the actions of stakeholders, including ministries, local
authorities, road agencies, parliamentarians, politicians and civil society. A coherent narrative which
brings together transport and land-use policies needs to be developed in order to achieve the long-term
goal of delivering a safe and sustainable urban environment.
Gather evidence that can serve as fundament of road safety policy
An evidence-based approach to road safety helps secure broader support for action. It would also help
direct road safety investments to where they are most effective. An evidence-based approach involves
gathering data on crashes and traffic incidents, developing analytical methods to understand road safety
problems, and building channels for stakeholders to be consulted and to contribute.
Create strong Metropolitan Transport Authorities
Metropolitan Transport Authorities (MTAs) are the key to enhancing integration between transport and
land-use planning. An MTA that covers the entire commuting area can co-ordinate among jurisdictions at
all territorial levels and reduce negative consequences of urban sprawl. MTAs can effectively contribute
to national policy goals (e.g. on health, environment, inclusiveness), promote integrated land-use and
transport planning, and thereby improve road safety.

10                                                                  ROAD SAFETY IN EUROPEAN CITIES © OECD/ITF 2019
INTRODUCTION

                                                 Introduction

Over three-quarters of the population in the European Union lives in urban areas (UN, 2018) and over
9 000 people were killed on urban roads in 2017 (European Commission, 2018). Fatal crashes between
road users remain a common occurrence on city streets, whilst they have almost been eliminated in rail
or air transport. A growing number of local governments are embracing Vision Zero: a vision of no one
being killed or seriously injured in urban traffic to rectify this. In support of such ambitious targets, this
report investigates key road safety questions in the context of selected cities in Europe and beyond.
First and foremost, there is a basic need to understand which governance principles have the potential
to facilitate a move towards safer urban environments. A lack of coherent governance frameworks
impedes authorities in their quest to achieve better road safety outcomes. Cities often rely on solutions
from regulators or vehicle manufacturers, neglecting a vast range of policies and actions they could
develop locally. Land-use planning, sustainable mobility planning, traffic calming: these are examples of
the tools available at the local level. Advancing good governance is vital to delivering effective road
safety policies that would also bring wider societal benefits.
Increasing evidence suggests that the true impact of road safety in cities goes well beyond the direct
suffering due to crashes. For instance, road safety determines the success or failure of the sustainable
urban mobility transition, with a range of health benefits at stake, not to mention other social, economic
and environmental benefits. Road safety objectives thus cannot be seen in isolation and should be
embedded in the scope of wider developmental objectives. As this approach requires improving the
functionality and co-ordination of a wide range of actors, the task is of a different order than more
traditional, technical interventions. Addressing the preventable issue of inadequate road safety requires
dedicated action by multiple ministries, most notably those concerned with law, planning, transport,
education, public information and health.
How can cities achieve better road safety outcomes? How can authorities better link road safety to wider
development objectives? What type of governance framework is needed for coherent, co-ordinated
action by the various national and local agencies and organisations that have influence over road safety?
Answering these questions is an important step in addressing a general lack of detailed evidence on the
governance principles that would help promote road safety in cities. While analysis of city case studies
has the potential to provide some useful material and insights, performance is not easily measurable and
detailed examination is still needed to compare cities or assess the quality of governance regimes.
The effectiveness of road safety management needs to be systematically evaluated not only in terms of
results, but also of the intervention package and institutional delivery. Transparent, accurate road traffic
injury data are essential for setting priorities and developing policies that work. For instance,
determining whether the same road safety challenges are found in cities and rural areas will help reveal
which policy recommendations are most relevant. In line with the Safe System approach (ITF, 2016b), a
thorough understanding of specific urban road safety issues is essential for cities to deliver on their
Vision Zero ambitions.
Some would argue that cities face much greater public health problems. Local air pollution is one
example. Chronic diseases, made worse by a lack of physical activity, is another. In response to these
problems, local governments encourage people to walk and cycle more. There is a direct link between
road safety and wider public health objectives: people will not embrace modal shift if they do not feel
safe on the streets. Figure 1 shows how increasing road safety leads to broader public health benefits.

ROAD SAFETY IN EUROPEAN CITIES © OECD/ITF 2019                                                          11
INTRODUCTION
Figure 1. Virtuous circle of road danger reduction
Source: TfL (2018), Vision Zero Action Plan,
http://content.tfl.gov.uk/vision-zero-action-plan.pdf.
Since road safety has an impact on modal choice, it is also useful to ask what the impact of modal choice
on road safety is. Where walking and cycling are more dangerous than travelling by car or taxi, is there
still a case for encouraging people to change mode? Faced with road network congestion, many city
dwellers choose to travel by powered two-wheelers (PTWs). What is the road safety performance of this
vehicle type? More generally, what can be learned about the relative safety of each mode, the impact of
one transport mode on the safety of other road users, and the road safety solutions most relevant to
each mode?
Current data collection methods have enabled the ignition of this research and give visibility to the
following important areas. Which cities have the best road safety performance? What factors explain this
performance, and are there lessons learned that can benefit other cities? Which indicators are most
relevant in assessing safety performance and should therefore be adopted as targets? Are figures
comparable between cities?
Seeking to answer this range of questions, the International Transport Forum (ITF) has analysed road
safety in two dimensions: governance and performance indicators. Using these dimensions as a guide,
this report has two main sections. The first part discusses casualty trends, compares casualty rates
among cities and examines user groups involved in crashes. The second part presents case studies of
road safety governance in two medium-sized European cities – Lisbon in Portugal, and Riga in Latvia.
These identify the role of specific policies and governance arrangements in improving road safety
performance.
The scope of the case study analyses is limited to recent years, since 2010. This part is essentially based
on site visits and stakeholder interviews conducted in September 2017 in Lisbon and May 2018 in Riga.
One objective of the analysis was to illustrate the strengths and weaknesses of the local governance
framework in this policy area. Another was to highlight practical solutions in both cities. Overall, the
second part of the report makes recommendations on governance frameworks and technical solutions.
12 ROAD SAFETY IN EUROPEAN CITIES © OECD/ITF 2019ROAD SAFETY PERFORMANCE INDICATORS
Road safety performance indicators
Road safety performance indicators are designed to help diagnose problems, to identify best practice
and to support policy monitoring and evaluation. The scope of this section is limited to data on
casualties, mainly fatalities. A broader performance analysis could include reviewing cities’ road safety
strategies, action plans, budgets and governance arrangements. The monitoring of behaviour,
perceptions and attitudes among city dwellers could also add value. It seems natural, however, to focus
on casualties as the measurable outcome which matters the most to people.
This section also looks at the relevance of various indicators, available data collection methods and
challenges associated with data comparability across cities. This material should be used to support a
more vigorous approach to road safety management, with a goal of closing the gap and matching the
best-performing cities. It should also be noted that no single indicator could capture all aspects of
performance: a city may perform well on some aspects and poorly on others. The goal of the benchmark
is not to point the finger at some cities; countless others have much worse road safety performance but
no desire to join a benchmarking network such as the ITF Safer City Streets.
Accounting for various city shapes and definitions
To put the performance of 18 European cities in a global context, the ITF collected road safety data from
12 non-European cities: ten in the Americas and two in Oceania (Figure 2), totalling 31 cities involved in
the benchmarking. The term Europe refers to the 28 EU countries plus Norway and Switzerland in this
report.
The ITF did not commission an independent data audit in each participating city and could not fully
assess the level of accuracy of each data contribution. The ITF does, however, use quality control
procedures involving internal consistency checks, comparison with alternative sources, and comparison
with known values in comparable regions. In addition, it collects relevant information on data sources
and survey methods so as to elaborate correction factors where needed.1
In spite of the heterogeneity of the data presented in this document, the publication of road safety and
mobility figures at city level should be seen as a step forward. The circulation of this document is
intended to maximise the level of scrutiny given to the data.
ROAD SAFETY IN EUROPEAN CITIES © OECD/ITF 2019 13ROAD SAFETY PERFORMANCE INDICATORS
Figure 2. Cities contributing to the Safer City Streets database
Stockholm
Copenhagen
Riga
Dublin
Edmonton Berlin
The Hague
Montreal London Brussels Warsaw
Vancouver Calgary
Paris
Zurich
New York City
Milan
Guadalajara Belgrade
Mexico City
Lisbon
Barcelona Rome
Madrid
Bogota
Fortaleza
Auckland
Buenos Aires Melbourne
Note: Bubble size indicates population size.
In the London and Paris metropolitan areas, data were collected at two geographical levels: the inner
and greater urban areas, and were analysed separately (Figure 3). This approach is needed to understand
how performance differs between urban cores and outer fringes.
Figure 3. Concentric urban perimeters in London and Paris
(to scale)
Ile de France
region
Inner London Paris City
Greater London Paris area
Notes: Greater London includes Inner London and Paris area includes Paris City. Numbers are
French administrative division identifiers. London and Paris are drawn to the same scale.
Source: Adapted from Morwen (Creative Commons).
14 ROAD SAFETY IN EUROPEAN CITIES © OECD/ITF 2019ROAD SAFETY PERFORMANCE INDICATORS
In addition to collecting data directly from cities, the ITF collected data from national- and European-
level databases and other sources. These data pertain to 41 functional urban areas (FUAs)2 across
Europe. Thus the ITF consolidated casualty data from various sources on 72 urban areas, 60 of which are
in Europe.
Before examining road safety figures, the differences between the 72 areas examined must be
considered. Figure 4 is a bubble chart representing the population of these areas, some of which being
defined by administrative boundaries, others being defined as FUAs. The latter, of course, tend to occupy
a larger land area (horizontal axis) and have lower population density (vertical axis). The plot reveals the
diversity of situations:
Land area varies from 80 km2 (The Hague) to over 9 000 km2 (Vienna FUA)
Population varies from 400 000 (Zürich) to over 12 million (London FUA)
Population density varies from 130 people per km2 (Graz FUA) to over 21 000 per km2 (Paris
City).
Figure 4. Population density and land areas of selected cities
Paris City
25 600
New York City
12 800
The Hague
Greater London
6 400
Population density per km²
Lisbon
Zürich
3 200
London FUA
Administrative
Portsmouth FUA
Riga
boundaries
1 600
Functional
800
urban areas
Melbourne (FUAs)
400
Vienna FUA
200
Graz FUA
100
50 200 800 3 200 12 800
Land area in km²
Indicators are normalised to facilitate comparison between areas of various sizes in this report. It could
be argued that such comparison is unfair, as denser areas tend to be safer – an issue investigated in the
section below. Preliminary results indicate that where population density doubles, road mortality goes
down by 20%, a fact worth bearing in mind when comparing cities.
Why are some cities safer than others?
The indicator most frequently used to measure road safety is number of road fatalities per unit of
population, also called road mortality. Often computed at national level, road mortality can be
misleading when computed at city level, as activity levels in some cities cannot be measured by resident
population alone. In urban cores, where many jobs and services are concentrated, the daytime
population can be much higher than the resident population.
ROAD SAFETY IN EUROPEAN CITIES © OECD/ITF 2019 15ROAD SAFETY PERFORMANCE INDICATORS Daytime population is defined as resident population plus net flow of commuters towards a given area. This figure is important to better capture the activity level within an area and was provided by 19 cities. In FUAs, the assumption is that resident and daytime population are not significantly different, since the FUA definition is based on commuter flows. For a fair comparison of mortality rates, only daytime population is used in this report. Results in Figure 5 reflect a wide range of situations, with annual fatalities per 100 000 population from 0.8 to 7.4 and a median of 2.3. Given this range, there is certainly room for performance to improve in most cities, at least by catching up with safer cities. The setting of ambitious road safety targets is therefore recommended, as targets have been shown to accelerate reduction in fatality numbers (Allsop et al., 2011). The analysis revealed that mortality rates rise with the size of the urban perimeter. That of Greater London is higher than that of Inner London, for example, and that of the whole London FUA is even higher. A similar pattern was observed in Paris and Stockholm. The influence of city size and population density was investigated3 and is represented in Figure 6. It reveals an elasticity4 of mortality with regards to density. Where density is twice as high, mortality is 20% lower (elasticity of -0.32). The variations observed in mortality could however be explained by other variables than density, such as public transport use which is often associated with population density. This question couldn’t be explored further because data on public transport use was not available in Eurostat. It is also true that population density may give an inaccurate picture of the true urban fabric. Vast tracts of empty land, for instance, could distort population density, even if the entire population lives in a dense urban core. To correct for this and better reflect the perception of an average resident, we rely on the concept of population-weighted density. An area’s population-weighted density is the mean of the densities of smaller areas (such as the cells of a grid system or census wards) weighted by those areas’ populations. It is best to compute the population-weighted density of urban area before undertaking further research on the intricate relationships between population density, mobility patterns and road safety. 16 ROAD SAFETY IN EUROPEAN CITIES © OECD/ITF 2019
ROAD SAFETY PERFORMANCE INDICATORS

                                 Figure 5. Road fatalities in selected cities, 2011-15
                                    (per 100 000 daytime population, average)
           Stockholm      0.8
                 Zürich   1.0
   Portsmouth FUA         1.1
       Inner London       1.2
        Copenhagen        1.3
                 Berlin   1.3
                Lisbon    1.3
             Paris City   1.4
         Malmö FUA        1.4
           The Hague      1.4
     Stockholm FUA        1.5
    Greater London        1.6
             Montreal     1.6
             Oslo FUA     1.7
      Liverpool FUA       1.8
      Göteborg FUA        1.8
            Paris area    1.8
              Brussels    1.8
        Helsinki FUA      1.8
   Manchester FUA         1.9
                 Milan    1.9
          Cardiff FUA     1.9
            Barcelona     1.9
     Edinburgh FUA        2.1                                                            European urban areas
          Dublin FUA      2.1                                                            (administrative boundaries)
       Sheffield FUA      2.2
         London FUA       2.2                                                            European functional urban
       Glasgow FUA        2.2                                                            areas (FUAs)
          Bristol FUA     2.3
   Nottingham FUA         2.3
           Zürich FUA     2.3                                                            Other urban areas
   Birmingham FUA         2.4
     Newcastle FUA        2.5
              Warsaw      2.6                                                            Whole country
          Melbourne       2.7
      New York City       2.9
      Leicester FUA       3.0
             Auckland     3.0
           Leeds FUA      3.1
          Napoli FUA      3.3
          Milano FUA      3.4
            Porto FUA     3.8
          Lisbon FUA      3.8
          Vienna FUA      3.9
              Bari FUA    4.0
        Palermo FUA       4.1
          Torino FUA      4.2
         Genova FUA       4.5
           Praha FUA      4.9
       Ljubljana FUA      4.9
         Catania FUA      5.4
        Ostrava FUA       5.6
         Firenze FUA      5.7
              Linz FUA    5.8
             Brno FUA     5.8
           Roma FUA       6.3
         Bogotá D.C.      6.3
        Venezia FUA       6.5
             Graz FUA     7.2
        Bologna FUA       7.4

Notes: Argentina, Brazil and Colombia: 2013 data from ITF (2017). Latvia and Serbia: fatality data from OECD
online database. Other countries: ITF IRTAD Database (2011-2015).

ROAD SAFETY IN EUROPEAN CITIES © OECD/ITF 2019                                                                   17
ROAD SAFETY PERFORMANCE INDICATORS
Figure 6. Elasticity of mortality with regard to population density in European urban areas
(2011-15 average)
Fatalities per year and 100 000 daytime population
8
Austria
4 Switzerland
Czech Republic
France
2
United Kingdom
Italy
1 Portugal
Where population density is x2, Sweden
mortality is likely 20% lower
Elasticity slopes
0.5
100 400 1 600 6 400 25 600
Population density per km²
Further research could investigate why denser cities tend to have lower mortality rates, and why cities in
general tend to be safer than their country as a whole. Several hypotheses can be made to explain the
phenomenon as denser cities tend to:
have a higher proportion of trips using public transport, a famously safe mode of travel
(Santacreu 2018b)
have a higher proportion of trips by foot or bicycle, modes that, as this report will show, tend to
be safer than other modes
constrain motor vehicle speed
allow access to a vast choice of jobs and services within a relatively short distance, which can
reduce total distance travelled per person per day, and hence risk exposure.
Why are some modes safer than others?
Vulnerable road users (VRUs) typically represent 80% of road fatalities in the 11 urban areas with
population density greater than 5 000 per km². Figure 7 summarises the proportions of various road user
groups in total traffic fatalities, as observed in FUAs and urban administrative areas across Europe.
Interpreting such figures, however, is difficult. The large proportion of VRUs in urban traffic may reflect a
large modal share (a matter of exposure), a high level of risk, or both.
18 ROAD SAFETY IN EUROPEAN CITIES © OECD/ITF 2019ROAD SAFETY PERFORMANCE INDICATORS
Figure 7. Modal shares of road fatalities in selected cities and functional urban areas, 2011-15
(by population density group)
Pedestrian Cyclist Powered 2-wheeler rider Other road users (including unknown)
Medium or high density (n=11) 43% 11% 26%
Low density (n=18) 38% 8% 15%
Very low density (n=30) 26% 7% 13%
0% 10% 20% 30% 40% 50% 60% 70% 80% 90% 100%
Note: Very low density is less than 1 000 people per square kilometre, low is less than 5 000, medium is less than 10 000, high is
10 000 and above. Density bands are consistent with previous ITF work that did not include FUAs (Santacreu, 2018b). Where
cities are grouped, figures represent the unweighted average across cities in the group.
This section examines the safety performance of various modes of transport in cities, leading to a
discussion on the potential benefits of modal shift. The safety performance of each mode is defined as
the probability of being killed in a collision for a given unit of distance travelled or for each trip made.
This is the concept of risk and is computed as the number of fatalities among a given road user group,
divided by the total distance or total number of trips travelled by this group over a given period.
Risk of fatality per unit of distance travelled or trip made
This report proposes to measure risk by controlling for distance travelled or trips made. Some would
argue that time is a more appropriate choice, especially when comparisons are made across modes.
Others, constrained by a lack of data, use trips as the denominator. The ITF primarily uses distance, the
most common metric, and trips when distance is not available. This is in accordance with a
recommendation in the methodological framework of the Safer City Streets initiative (ITF, 2016a).
Large variations in risk can be observed across cities (Figure 8). The risk of being killed on a bicycle varies
more than tenfold. The risk experienced by pedestrians varies sixfold. Again, this could be interpreted as
room for progress, and could help cities to learn from their peers. Differences observed across cities
reflect, to some extent, differences already observed across countries where the ITF reported cycling risk
values that range between eight and 51 fatalities per billion kilometres cycled (Santacreu, 2018a).
ROAD SAFETY IN EUROPEAN CITIES © OECD/ITF 2019 19ROAD SAFETY PERFORMANCE INDICATORS
Figure 8. Risk of fatality by mode and by city, 2011-15
(per billion passenger-kilometres)
1 2 4 8 16 32 64 128 256
European urban areas Copenhagen 4
(administrative limits) Berlin 6
The Hague 8
Montreal 9
Paris City 10
European functional Barcelona 10
urban areas (FUAs) Helsinki FUA 11
Bristol FUA 11
Paris area 11
Greater London 15
Other urban areas Inner London 15
Leeds FUA 16
London FUA 18
Manchester FUA 19
Zürich FUA 22
Cardiff FUA 22
Leicester FUA 24
Liverpool FUA 24
Auckland 24
Glasgow FUA 25
Buenos Aires 26
Edinburgh FUA 29
Bogotá D.C. 30
Birmingham FUA 30
Sheffield FUA 31
Newcastle FUA 31
New York City 32
Milano FUA 35
Nottingham FUA 39
Firenze FUA 41
Napoli FUA 44
Venezia FUA 52
Bari FUA 62
Torino FUA 65
Bologna FUA 77
Porto FUA 107
Roma FUA 178
Lisbon FUA 192
#N/A
Paris City 9
The Hague 10
Portsmouth FUA 10
Paris area 12
Berlin 13
Copenhagen 13
Nottingham FUA 14
Leicester FUA 14
Barcelona 14
Inner London 15
Greater London 17
Liverpool FUA 19
Newcastle FUA 20
Manchester FUA 22
London FUA 22
Sheffield FUA 23
Bristol FUA 25
Leeds FUA 28
Birmingham FUA 33
Auckland 35
Calgary 57
#N/A
Milan 19
Barcelona 22
Berlin 28
Paris City 31
Paris area 45
Melbourne 51
Inner London 67
Copenhagen 71
Brussels 73
Greater London 97
Auckland 161
Notes: Confidence intervals (80% level) are determined by the number of fatalities to reflect natural random
fluctuation of small count data. No risk figure is presented where less than five fatalities are reported. For other
caveats, see Annex A and B.
20 ROAD SAFETY IN EUROPEAN CITIES © OECD/ITF 2019ROAD SAFETY PERFORMANCE INDICATORS
A particularly remarkable finding is that fatality risks for both walking and cycling are typically lower in a
city when compared to the national average. This comment is based on a comprehensive set of national-
level risk figures for walking and cycling compiled for the ITF Roundtable on Cycling Safety (Castro et al.,
2018). The difference is most visible in Paris City, where the walking and cycling fatality risks are less than
half the national averages. Similarly, in New York City, the cycling risk is significantly lower than the
national average, which is estimated at 49 fatalities per billion km cycled (Santacreu 2018a). This may
support the hypothesis in the previous section that dense urban fabrics result in lower motor vehicle
speeds. More research dedicated to refining this analysis and controlling for a number of potentially
confounding factors, such as age, gender and time of day, would be useful. National statistical authorities
are also invited to review their travel surveys and make sure active travel data are at least as robust as
motorised travel data. See Armoogum (2014) and COWI (2017) on travel survey harmonisation and
improvement.
Results also highlight the fact that cycling is not as dangerous as people often suppose. In a majority of
cities, it seems to be safer to travel 1 km on a bicycle than on foot. The main caveat here is the
acknowledgement of confounding factors: in particular, if the two user groups (cyclists and pedestrians)
have different age distributions and fitness levels, physical resilience may contribute to the difference
observed here.
To compare fatality risk across transport modes, a comprehensive data set covering five modes in five
cities: Auckland, Barcelona, Berlin, London and Paris, was assembled. Table 1 shows figures for each city
and each mode, along with the median risk across all five cities. Riding a powered two-wheelers (PTW)
rather than a pedal cycle over a given distance quadruples the risk of fatality. Walking a given distance
carries ten times the risk of fatality as riding the same distance in a passenger car. Travelling by bus is an
order of magnitude safer than all other modes of travel.
Table 1. Number of fatalities per billion passenger-kilometres, average 2011-15
Powered
Passenger Pedal
City Bus Pedestrian two-
car cycle
wheeler
Auckland 0.4 1.9 24 35 161
Barcelona 0.0 0.7 10 14 22
Berlin 0.0 0.5 6 13 28
Greater London 0.2 1.4 15 17 97
Paris area NA 1.4 11 12 45
Median 0.1 1.4 11 14 45
How should policy makers interpret such results? Certainly one conclusion is that developing public
transport is a key to reducing road fatalities. Could there be a case for promoting private car use in cities,
replacing some walkable or cyclable trips by car trips, on road safety grounds? This would overlook the
risk imposed by motorised road users on other user groups, something which is not reflected in Table 1,
but discussed later in this report.
ROAD SAFETY IN EUROPEAN CITIES © OECD/ITF 2019 21ROAD SAFETY PERFORMANCE INDICATORS
Table 2. Number of road fatalities by mode in selected cities
(per unit of distance and trips travelled, 2011-15 average)
Fatalities per billion Fatalities per billion
passenger-kilometres passenger trips
City/FUA
Auckland 1.9 24 35 161 18 120 32 1 100
Barcelona 0.7 10 14 22 6 21 16 132
Bari FUA 62 288
Berlin 0.5 6 13 28 5 21 13 276
Birmingham FUA 1.3 30 33 16 167 44
Bogotá D.C. 30 26 257 118 670
Bologna FUA 77 356
Bristol FUA 0.7 11 25 10 50 36
Brussels 2.2 73 27 64 400
Buenos Aires 26 79
Calgary 57 57 1 164
Cardiff FUA 22 103
Copenhagen 4 13 71
Edinburgh FUA 29 133
Florence FUA 41 191
Glasgow FUA 25 113
Helsinki FUA 11 49
Leeds FUA 1.6 16 28 21 102 40
Leicester FUA 1.7 24 14 25 110 18
Lisbon FUA 192 885
Liverpool FUA 1.1 24 19 13 113 30
London (Inner) 1.0 15 15 67 6 70 24 587
London (Greater) 1.4 15 17 97 7 69 30 434
London FUA 1.3 18 22 17 100 36
Manchester FUA 0.9 19 22 10 91 30
Melbourne 1.3 51
Milan 1.0 19 12 161
Milan FUA 35 160
Montreal 9
Naples FUA 44 202
New York City 32 128
Newcastle FUA 1.3 31 20 19 179 28
Nottingham FUA 1.4 39 14 18 168 20
Paris area 1.4 11 12 45 11 31 14 333
Paris City 10 9 31 30 12 205
Porto FUA 107 492
Portsmouth FUA 0.5 10 7 15
Rome FUA 178 820
Sheffield FUA 1.0 31 23 13 189 32
The Hague 0.5 8 10 5 31 10
Turin FUA 65 299
Vancouver 64
Venice FUA 52 241
Zürich FUA 22 101
Notes: There is considerable uncertainty on some values due to low numbers of reported fatalities. For this
reason, no risk figure is presented where fewer than five fatalities are reported. With heterogeneous methods used
for the estimation of trips and distances travelled (Annex A and B), extra care should be taken regarding
interpretation of differences across cities.
22 ROAD SAFETY IN EUROPEAN CITIES © OECD/ITF 2019ROAD SAFETY PERFORMANCE INDICATORS
Fatality risk imposed upon third-parties
Occupants of private cars are remarkably well protected from the risk of being killed in traffic, especially
in urban areas. On the other hand, they contribute to a significant risk of VRUs, such as pedestrians,
being killed in collisions with cars (Scholes et al., 2018). Table 1 does not account for that phenomenon
and more research in this area is needed.
At the third Safer City Streets meeting, the city of Bogotá reported on its efforts to consolidate
information on road casualties across three different sources: the police, the National Institute for Legal
Medicine and the public health secretary. Consolidated 2017 figures in Bogotá suggest that that while 19
private car occupants were killed in traffic crashes, 133 (seven times more) VRUs were killed in crashes
involving a private car. On the other hand, in a year when 59 cyclists were killed, only three pedestrians
were killed in collisions with pedal cycles. This illustrates the significant impact of one road user group on
others, relatively modest in the case of pedal cycles, yet overwhelming in the case of private cars.
Bogotá pays particular attention to monitoring and improving the safety record of the taxi trade. Taxis
are clearly separated in the collision statistics, which is something other governments could learn from.
The matrix below gives a complete picture of the number of fatalities resulting from each crash
configuration in Bogotá in 2017.
Figure 9. Traffic fatalities in Bogotá per mode and per vehicle involved, 2017
Goods Other No third More than
Pedestrians Pedal cycles Motorcycles Private cars Buses Taxis vehicles vehicles party two parties
TAXI
Bus driver
Taxi driver
Taxi passenger
Note: Each row is a road user casualty group and each column is a third-party vehicle involved in a collision.
Source: Presentation by Juan Pablo Bocarejo and Claudia Diaz at the third meeting of Safer City Streets meeting,
Rome, April, 2018.
ROAD SAFETY IN EUROPEAN CITIES © OECD/ITF 2019 23ROAD SAFETY PERFORMANCE INDICATORS
The goal of such cross comparison is not to attribute responsibility or to blame a particular user group,
but to give an indication of the road safety benefits of modal shift. Calculations of third-party risk
however reveal a high impact of motor vehicles on the overall casualty number, and therefore
strengthen the case for a modal shift towards walking and cycling.
Controlling for distances in this situation, however, is questionable because modal shift often coincides
with a shift in travel distance: people change destination, or even home, due to limited travel time
budgets. Computing fatality rates per unit of travel time or per unit trip would arguably better assess the
impact of modal shift. To illustrate how distance and time lead to different risk estimations, let us
assume that urban trips on PTWs are twice as fast as cycling. The fatality risk of riding a PTW, previously
described as four times as high as cycling for a set distance, would be found to be eight times as high as
cycling for a set duration. When collecting further data from cities, the ITF will propose collecting travel
durations in addition to distances.
Using data from Bogotá (Figure 9), Paris City and Inner London, a first estimate can be made of the
number of third-party fatalities, so that the complete road safety impact of each transport mode is
assessed. For a given user group, it is now possible to compute the total number of fatalities in crashes
involving this given user group. In Bogota, Paris City and Inner London, the total number of vulnerable
road users killed in collisions with cars is four to seven times higher than the number of car occupants
killed in traffic. This indicates that car occupants, in dense urban areas, represent a greater risk to other
road users rather than to themselves as a group.
To compare modes and assess the benefits of modal shift, the total number of fatalities involving each
mode is divided by the number of kilometres or hours travelled with each mode. Figure 10 displays the
total fatality risk as the sum of the risk to oneself and the risk imposed on others. In these two
components of risk, the latter has yet to be investigated in a greater number of cities. For this reason,
results should be seen as indicative, representing only an order of magnitude.
Figure 10. Number of fatalities in collisions involving a given user group in selected cities, 2011-15
(per unit passenger travel in this user group)
Fatalities perbillion
Fatalities per billionpassenger-kilometres
passenger-kilometres (order
(order of magnitude)
of magnitude)
Powered-2-wheeler
Pedestrian
Pedal cycle
Fatalities
Fatalities withinuser
within usergroup
group
Passenger car
Fatalities
Fatalities ininother
otheruser
usergroups
groups
Bus
0 10 20 30 40 50 60
Fatalities
Fatalities perbillion
Fatalitiesper
per billion
billion passenger-trips
passenger-trips
passenger-trips (order
(order
(order of magnitude)
ofofmagnitude)
magnitude)
Powered-2-wheeler
Powered-2-wheeler
Pedestrian
Pedestrian
Pedal cycle
Pedal cycle
Fatalities
Fatalities within
within user
user group
group
Passenger car
Passenger car
Fatalities
Fatalities in in
Fatalities other
other
within user
user
user groups
groups
group
Bus
Bus
150
0 200
50 250
100 300
150 350
200 400
250 450300
24 ROAD SAFETY IN EUROPEAN CITIES © OECD/ITF 2019You can also read