BICYCLE & PEDESTRIAN BEST PRACTICES TOOLKIT 2018 - City of Costa ...
←
→
Page content transcription
If your browser does not render page correctly, please read the page content below
BICYCLE &
PEDESTRIAN
BEST
PRACTICES
TOOLKIT 2018

                                                                 MAY 2018
                        Prepared for: Orange County Transportation Authority
     Prepared by: IBI Group with KTUA, PlaceWorks, and Arellano Associates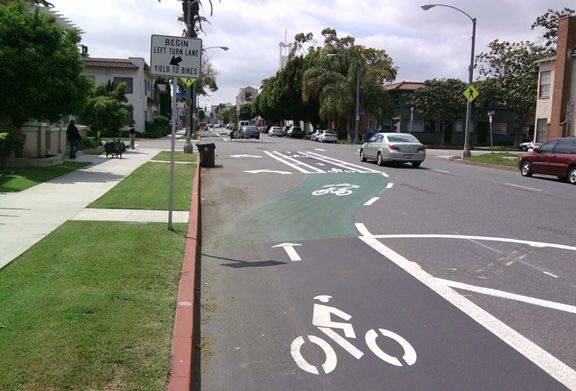
This page intentionally left blank.
CONTENTS
    INTRODUCTION p.01                                1. EDUCATION p.01
    PURPOSE OF THE TOOLKIT p.01                        BENEFITS p.01
    STANDARDS/GUIDELINES p.01                          EXAMPLES p.01
    • NATIONAL STANDARDS AND GUIDELINES                • COMMUNITY OUTREACH
    • STATE STANDARDS AND GUIDELINES                   • DEVELOP LOCAL PUBLIC EDUCATION AND
    • LOCAL STANDARDS AND                                SAFETY CAMPAIGNS
      GUIDELINES                                       • SAFE ROUTES TO SCHOOL EDUCATION
    TOOLKIT ORGANIZATION AND THE                         WORKSHOPS
    FIVE E’S p.01                                      • CITY OF HUNTINGTON BEACH BICYCLE AND
                                                         PEDESTRIAN SAFETY CLASS
                                                       ADDITIONAL INFORMATION p.01

2. ENCOURAGEMENT p.01                                3. ENFORCEMENT p.01
    BENEFITS p.01                                      BENEFITS p.01
    EXAMPLES p.01                                      EXAMPLES p.01
    • PROMOTE NATIONALLY RECOGNIZED                    • ORANGE COUNTY SHERIFF’S DEPARTMENT
      EVENTS                                             BIKE AND PEDESTRIAN SAFETY ENFORCEMENT
    • IMPLEMENT LOCAL TACTICAL URBANISM                  OPERATION PROGRAM
      EVENTS                                           • CITY OF HUNTINGTON BEACH TICKET DIVERSION
    • ADOPTING VISION ZERO                               PROGRAM
    • NATIONAL BIKE MONTH                              • CITY OF SAN FRANCISCO PEDESTRIAN SAFETY
    • BICYCLE FRIENDLY COMMUNITY                         ENFORCEMENT OPERATIONS
      DESIGNATION                                      • ORLANDO BEST FOOT FORWARD FOR
    • BICYCLE AND PEDESTRIAN PLANNING                    PEDESTRIAN SAFETY
      POLICIES AND PROGRAMS                            • ADDITIONAL LAW ENFORCEMENT STRATEGIES
    ADDITIONAL INFORMATION p.01                        ADDITIONAL INFORMATION p.01

4. EVALUATION p.01                                   5. ENGINEERING p.01
    BENEFITS p.01                                      BENEFITS p.01
    EXAMPLES p.01                                      EXAMPLES p.01
    • METRICS TO MEASURE SAFETY                        •   Table 6-1: Design Treatment Table
    • METRICS TO MEASURE INFRASTRUCTURE/               •   TRAFFIC CALMING
      NETWORK QUALITY                                  •   PEDESTRIAN LIGHTING
    • METRICS TO MEASURE ACCESS TO                     •   ACCESS TO TRANSIT
      DESTINATIONS                                     •   DRIVEWAYS
    ADDITIONAL INFORMATION p.01                        •   INTEGRATION WITH AUTOMATED/CONNECTED
                                                           VEHICLES
                                                       •   SIDEWALKS
                                                       •   PEDESTRIAN BUFFERS
                                                       •   INTEGRATION WITH BIKEWAYS
                                                       •   INTERSECTION TREATMENTS
                                                       •   CROSSING TREATMENTS
                                                       •   SIGNAGE
                                                       •   SENIOR MOBILITY
                                                       •   BIKEWAY FACILITY TYPES
                                                       •   PROTECTED INTERSECTIONS
                                                       ADDITIONAL INFORMATION p.01

OC ACTIVE - PEDESTRIAN BEST PRACTICES TOOLKIT 2018
This page intentionally left blank.
INTRODUCTION

INTRODUCTION
PURPOSE OF THE TOOLKIT
Walkability, bikeability, and accessibility are common elements found in healthy and vibrant communities.
Communities that are walkable and accessible provide a range of benefits that improve the quality of life for
residents and visitors. These benefits often include:

•   A reliable bicycle and pedestrian network with access to interesting and diverse destinations
•   Direct and accessible connections to transit
•   Well-maintained infrastructure that is inclusive of varying mobility needs
•   Clear and inviting spaces, such as trails, paseos, or other public open spaces
•   Improved public health and safety

The OC Active Bicycle and Pedestrian Best Practices Toolkit provides local jurisdictions with a diverse
range of tools and strategies for promoting and improving bicycle and pedestrian activity and safety in
Orange County. The toolkit is intended to serve as a one-stop resource to a broad range of bicycle and
pedestrian planning topics, tools, and strategies. The information presented in this toolkit should not be
interpreted as standards, specifications, or regulations, but rather as tools and strategies for promoting more
bicycle and pedestrian activity within Orange County. The strategies in this toolkit should be applied with
sound professional judgement to achieve the design solutions necessary for the specific circumstances
encountered.

OC ACTIVE - BICYCLE & PEDESTRIAN BEST PRACTICES TOOLKIT 2018                                                    1
INTRODUCTION

STANDARDS/GUIDELINES
The OC Active Bicycle and Pedestrian Best Practices Toolkit draws from a variety of national, state, and local
resources and is tailored to meet the unique characteristics of Orange County. Although the information
presented in this toolkit provides local jurisdictions with tools and strategies for promoting more bicycle and
pedestrian activity, bicycle and pedestrian infrastructure should be designed and built according to existing
federal, state, and local standards. This section describes some key national, state, and local standards and
guidelines that are available for the planning and design of bicycle and pedestrian infrastructure.

NATIONAL STANDARDS AND GUIDELINES
The following national resources are available:

•    American Association of State Highway and Transportation Officials (AASHTO), A Policy on Geometric
     Design of Highways and Streets, 2001
•    AASHTO, Guide for the Development of Bicycle Facilities, 2012
•    AASHTO, Guide for the Planning, Design, and Operation of Pedestrian Facilities, 2004
•    Federal Highway Administration (FHWA), Manual on Uniform Traffic Control Devices (MUTCD), 2009
•    National Association of City Transportation Officials (NACTO), Urban Street Design Guide, 2013
•    NACTO, Urban Bikeway Design Guide, 2011
•    U.S. Access Board, American Disabilities Act Accessibility Guidelines (ADAAG), 2002
•    U.S. Department of Justice, American Disabilities Act (ADA) Standards for Accessible Design, 2010

STATE STANDARDS AND GUIDELINES
The following state resources are available:

•    California Department of Transportation (Caltrans) – California Manual on Uniform Traffic Control Devices
     (CA MUTCD), 2014
•    Caltrans – Highway Design Manual, Chapter 1000: Bicycle Transportation Design, 2015
•    Caltrans – Complete Intersections: A Guide to Reconstructing Intersections and Interchanges for
     Bicyclists and Pedestrians, 2010

2                                                                        OCTA - Orange County Transportation Authority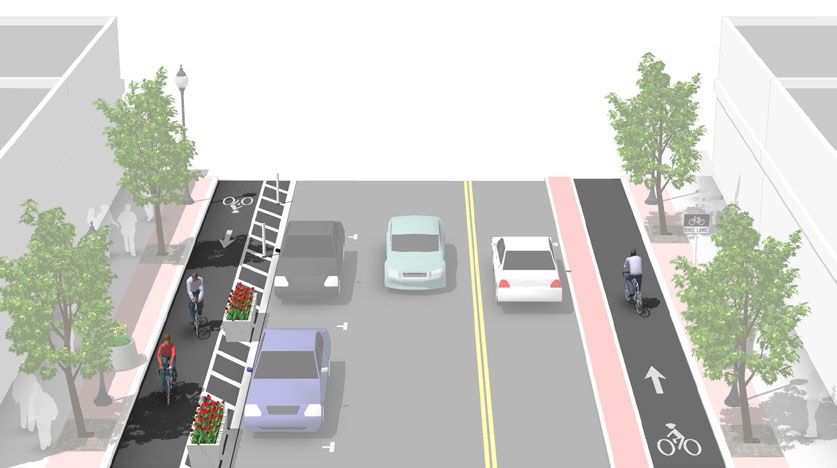
INTRODUCTION
LOCAL STANDARDS AND GUIDELINES
The following local resources are available:
• Orange County Transportation Authority (OCTA) – Master Plan of Arterial Highways Guidelines (MPAH),
2017
• Orange County Council of Governments (OCCOG) – Complete Streets Initiative Design Handbook, 2016
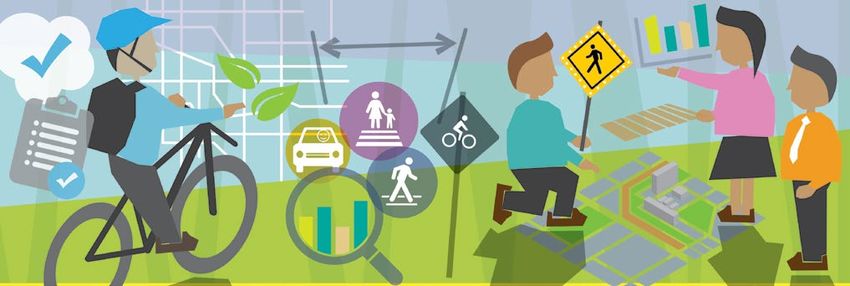
TOOLKIT ORGANIZATION AND THE FIVE E’S
Safer bicycling and walking conditions are best achieved through a combination of strategies targeted to
address both infrastructure and non-infrastructure needs. The tools and strategies discussed in this toolkit
are organized around the Five E’s, a universal framework and approach to improving roadway safety often
used by planning practitioners. The Five E’s framework includes the following categories:
E1 E3
E2 E4 E5
By focusing on the Five E’s, the OC Active Bicycle and Pedestrian Best Practices Toolkit incorporates a compre-
hensive and holistic approach to bicycle and pedestrian planning. The subsequent sections of the toolkit dis-
cusses the benefits of each of the Five E’s and includes sample tools and strategies for each E.
OC ACTIVE - BICYCLE & PEDESTRIAN BEST PRACTICES TOOLKIT 2018 3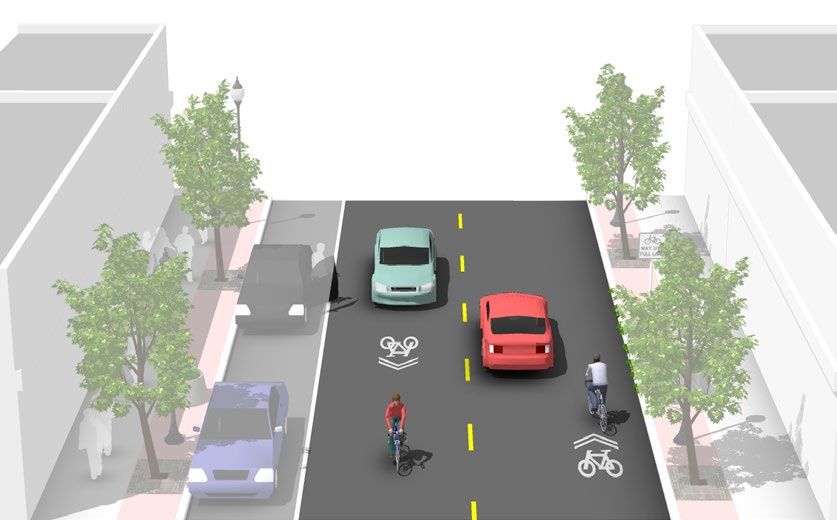
INTRODUCTION

                   This page intentionally left blank.

4                                                        OCTA - Orange County Transportation Authority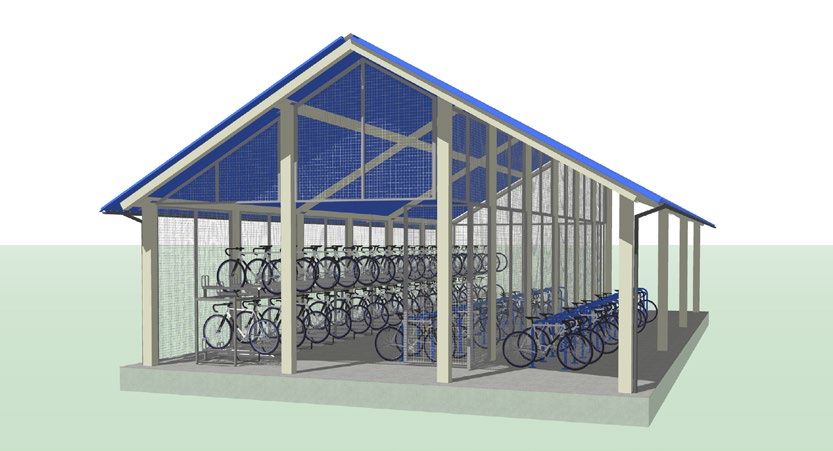
1. EDUCATION

1. EDUCATION
Bicycle and pedestrian education campaigns can help local jurisdictions communicate the skills and
knowledge necessary to be safe bicyclists and pedestrians. They help inform community members of traffic
safety laws, facilitate safe bicycling and walking behavior and practices, and communicate common unsafe
bicycle and pedestrian practices that lead to collisions. Education campaigns can include a variety of tools
such as community outreach, developing local bicycle and pedestrian safety guides, hosting safe routes to
school education workshops, and more.

    BENEFITS
    Some of the benefits of facilitating bicycle and pedestrian education campaigns include:

    •   Informing and reinforcing safe bicycle and pedestrian behavior and practices.
    •   Improving bicyclist and pedestrian safety by teaching safe biking and walking practices.
    •   Providing motivation to change unsafe bicyclist and pedestrian behaviors.
    •   Communicating traffic safety laws.
    •   Demonstrating that vehicles, bicycles, and pedestrians can share the road safely.
    •   Giving community members the skills and confidence to ride and walk.
    •   Providing decision makers with tools and strategies to make improvements
        that are appropriate for their community.

OC ACTIVE - BICYCLE & PEDESTRIAN BEST PRACTICES TOOLKIT 2018                                               5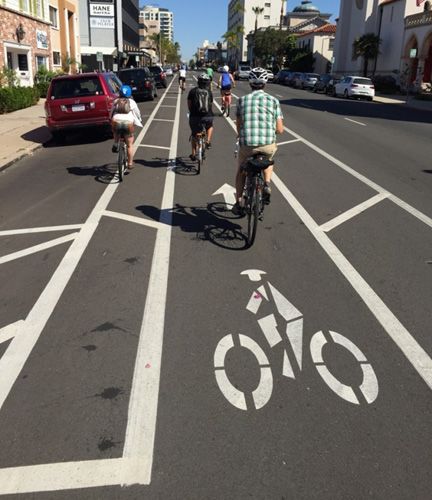
1. EDUCATION

EXAMPLES

                                        COMMUNITY OUTREACH TOOLS
                                        Engaging community members through outreach can help
                                        communicate the importance of safe pedestrian practices and
                                        the benefits of walking. Communicating these key messages to
                                        community members can help garner support for future pedestrian
                                        infrastructure projects and polices, but local jurisdictions often have
                                        trouble with designing an effective outreach strategy that engages,
                                        encourages participation, and solicits feedback. Some successful
                                        community outreach strategies have incorporated the following tools:

•    Interactive Technologies and Tools: Effective outreach strategies go beyond the conventional methods
     to engage, such as town hall meetings or open house workshops, and focus on incorporating interactive
     tools to make it fun. New digital technologies can help facilitate and streamline the outreach process
     and increase participation and interaction. Some of these interactive technologies and tools include:
     -   Poll Everywhere Surveys: Poll Everywhere is an online service for audience polling. In a community
         outreach context, it allows facilitators to create poll questions that audience can answer by using
         their mobile phones to text their responses. Live results of each poll question can be displayed on-
         screen during presentations. It’s a unique way to incorporate interactive and live activities during a
         presentation.
     -   Web-based Mapping: Web-based mapping tools, such as ArcGIS Online, CrowdMap, and
         CommunityRemarks, allow community members to identify key areas on a map and leave
         comments. They can be useful to identifying problematic and unsafe areas, as well as
         communicating desired infrastructure improvements.
•    Visualization Tools: Graphics are important to communicate key information and data to audiences in
     an easy to understand format. Websites, such as Street Mix, allow users to create a visual mockup of
     their ideal street by dragging and dropping various elements such as street trees, sidewalks, bike lanes,
     etc. onto its online and shareable interface.

                                        DEVELOP LOCAL PUBLIC EDUCATION AND SAFETY
                                        CAMPAIGNS
                                        Developing local public education and safety campaigns is a useful
                                        tool to teach safe walking tips to communities. Education and safety
                                        campaigns focus on encouraging community members to think
                                        about their existing travel choices and pedestrian behaviors, as well
                                        as helping community members make safer more informed choices.
                                        Education and safety campaigns should consider the sensitivities and
                                        different needs of different groups of people, such as children, adults,
                                        and seniors. The following are some example public education and
                                        safety tools.

•    Pedestrian Education Guides: The Pedestrian and Bicycle Information Center developed a series
     of pedestrian education guides for different age and community groups. An education guide was
     developed for different age groups because the skills and knowledge needed to walk safely changes
     as people age. Each guide provides strategies and tips for educating pedestrians, highlights which key
     messages to convey, and provides a link for additional resources.
•    Los Angeles County Suggested Pedestrian Route to School Website: The County of Los Angeles
     Department of Public Works developed its Suggested Pedestrian Route to School website, which

6                                                                         OCTA - Orange County Transportation Authority
1. EDUCATION
contains maps of suggested pedestrian walking routes for a majority of elementary schools in Los
Angeles County. Each map includes key information to inform safe suggested routes to school, such as
the locations of crossing guards, stop signs, crosswalks, signal lights, pedestrian bridges, and school
entrances. The maps help inform parents of safe routes for children to take when walking to school.
SAFE ROUTES TO SCHOOL EDUCATION
WORKSHOPS
The Safe Routes to School (SRTS) National Partnership is a nonprofit
organization committed to promoting safe walking and biking to
school and beyond. They often partner with local jurisdictions to
provide workshops and trainings on safe routes to school, active
transportation policy and programming, funding for sustainable
transportation, as well as community engagement and coalition
development. Each workshop and training is customizable to fit the
needs of the community and can be offered in-person or online.
LEAGUE OF AMERICAN BICYCLISTS SMART CYCLING
CLASSES AND LEAGUE CYCLING INSTRUCTOR (LCI)
SEMINARS
The League of American Bicyclists (LAB) provides Smart Cycling
classes across the nation designed to reach people of all ages and
abilities, improving skills, building confidence, and teaching others.
The League’s education program also offers the only nationwide
bicycling instructor certification program, known as League Cycling
Instructors, who are certified to teach the Smart Cycling Classes to
children as well as adults.
CYCLING SAVVY CLASSES
CyclingSavvy is a program of the American Education Association,
Inc. (ABEA). The course teaches the principles of “Mindful Bicycling”
by empowering students to act as confident, equal road users,
teaching strategies for safe integrated cycling, and providing tools
to read and problem-solve a variety of traffic situations. The class
consists of three 3-hour components: a bike-handling session, a
classroom session, and an on-road tour.
OC ACTIVE - BICYCLE & PEDESTRIAN BEST PRACTICES TOOLKIT 2018 71. EDUCATION
ADDITIONAL INFORMATION
• CommunityRemarks
https://communityremarks.com/
• County of Los Angeles Department of Public Works, Suggested Pedestrian Route to School
http://dpw.lacounty.gov/tnl/schoolroute/
• Orange County Bicycle Coalition, CyclingSavvy Program
https://www.bikeleague.org/content/become-instructor
• Pedestrian and Bicycle Information Center, How to Educate Pedestrians and Bicyclists
http://www.pedbikeinfo.org/programs/education.cfm
• Pedestrian and Bicycle Information Center, Safety Tips for Pedestrians
http://www.pedbikeinfo.org/community/tips_pedestrian.cfm
• Poll Everywhere
https://www.polleverywhere.com/
• Safe Routes to School National Partnership
https://www.saferoutespartnership.org/
• League of American Bicyclists, League Cycling Instructor Program
https://www.bikeleague.org/content/become-instructor
• League of American Bicyclists, Smart Cycling Program
https://www.bikeleague.org/ridesmart
• Street Mix
https://streetmix.net
• Vermont Safe Routes to School, Teaching Walking and Biking Safety Mini Guide
http://saferoutes.vermont.gov/sites/saferoutes/files/TeachingWalkingBikingSafety.pdf
8 OCTA - Orange County Transportation Authority2. ENCOURAGEMENT
2. ENCOURAGEMENT
Encouraging bicycle and pedestrian activity helps to generate excitement and brings awareness to
the benefits of active transportation. It can also help foster public support for bikeway and pedestrian
infrastructure projects and policies that are geared towards improving safety on streets. Tools to encourage
bicycle and pedestrian activities include promoting national and local active transportation events,
implementing local tactical urbanism events, and adopting local policies and programs that support safe and
efficient active modes of transportation.
BENEFITS
Some benefits of encouraging bicycle and pedestrian activity in communities include:
• Inspiring adults and children to engage in healthy and sustainable modes of transportation.
• Demonstrating that active modes of transportation are welcome and encouraged.
• Communicating the benefits of active transportation and garnering community support for
bikeway and pedestrian projects.
• Fostering a stronger sense of community.
• Promoting safer and healthier communities.
OC ACTIVE - BICYCLE & PEDESTRIAN BEST PRACTICES TOOLKIT 2018 92. ENCOURAGEMENT
EXAMPLES
PROMOTE NATIONAL AND LOCAL ACTIVE TRANSPORTATION EVENTS
Promoting nationally recognized active transportation events, such as Walk and Bike to School Day,
Pedestrian Safety Month, and Bike Month, or hosting special local events, such as walking and biking
contests, can help generate excitement and encourage more bicycling and walking in communities. These
events communicate and celebrate the benefits of active transportation and often inspire continued bicycle
and pedestrian activity beyond the day or event.
IMPLEMENT LOCAL TACTICAL URBANISM EVENTS
Tactical urbanism is a community approach to improving the built environment and includes implementing low-
cost temporary design solutions to catalyze long-term change. The goal of most tactical urbanism projects is
to improve local streets and neighborhoods by implementing quick, scalable, low-cost design solutions that
are temporary in hopes of garnering support for permanent infrastructure improvements and change.
• Go Human: The Southern California Association of Governments (SCAG) Go
Human campaign is a regional campaign intended to promote and improve
conditions for active modes of transportation funded by a $2.3 million grant
from the 2014 California Active Transportation Program. The campaign
provides funding for local jurisdictions to implement their own local tactical
urbanism events to encourage active transportation. The Go Human campaign
also provides information on potential strategies, case studies, enforcement
strategies, and other resources that local jurisdictions can use to promote and
encourage more walking and biking in their communities.
• Re:Imagine Garden Grove: The Re:Imagine Garden Grove event is a recent
example of a tactical urbanism event funded by the Go Human campaign.
The event encouraged community members to envision a car-free Garden
Grove by closing select streets to vehicular traffic, creating a car-free zone.
The event created a temporary 2.5 mile car-free route, prioritizing travel for
pedestrians, bicyclists, and skateboarders. The Re:Imagine Garden Grove
event successfully demonstrated to community members the possibilities and
various design solutions available for making streets safer for pedestrians and
bicyclists.
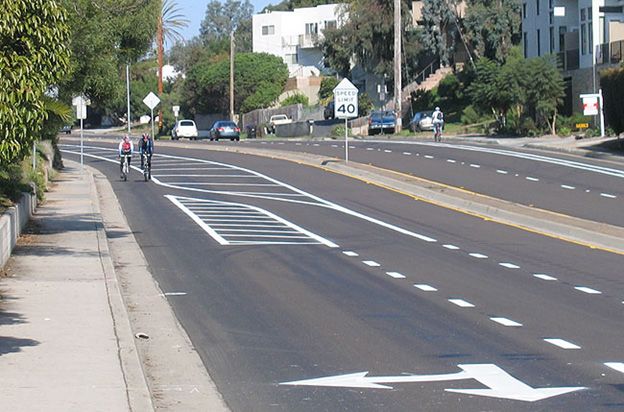
• Go Human Riverside Artswalk Pedestrian Scrambles: The City of Riverside
partnered with SCAG’s Go Human campaign to install two temporary
pedestrian scrambles for a three week pilot project. Pedestrian scrambles
prioritize the safe movement of pedestrians by stopping all vehicular traffic
in all directions and allowing pedestrians an exclusive interval to cross an
intersection in all directions, including diagonally, at the same time. The pilot
project coincided with the monthly Riverside Artswalk in downtown Riverside
and used the opportunity to showcase pop-up scramble crosswalks and
corner sidewalk extensions that were designed and created by local artists.
The temporary installations were incorporated as a part of the Riverside
Artswalk and highlighted in the Riverside Artswalk map, which were distributed
to visitors. Additionally, as a part of the pilot project, data was collected on
how many people used the modified crosswalks, delays to vehicular traffic,
and other impacts. The data collection in conjunction with feedback from
community members will be used by the City in their decision to implement
permanent pedestrian scrambles.
10 OCTA - Orange County Transportation Authority2. ENCOURAGEMENT
• CicLAvia: CicLAvia is an open streets event that occurs in cities across in Los
Angeles County several times a year. Many events have been organized since
2010, providing spaces for families and friends to enjoy spaces that may have
otherwise only been used primarily by automobiles. CicLAvia occurs in several
different areas in order to reach the various populations of Los Angeles County.
• SOMOS: Similar to Los Angeles’ CicLAvia, the City of Santa Ana has
previously hosted the City’s Sunday on Main Open Streets (SOMOS) event,
closing a section of Central Santa Ana off to cars and opening it to bicyclists,
walkers, and runners. The event encourages residents to attend by providing
entertainment and activities along the 3.1 mile route connecting Santa Ana’s
vibrant downtown to its historic South Main Corridor.
ADOPTING VISION ZERO
Vision Zero is a traffic safety strategy that focuses on eliminating traffic fatalities and severe injuries, while
promoting safe, healthy, and equitable mobility. Cities across the U.S. have begun developing and adopting
Vision Zero initiatives in response to traffic deaths and severe injuries experienced in their communities.
Vision Zero incorporates a multi-disciplinary systems approach, bringing together a variety stakeholders
from different city departments, such as traffic planners and engineers, police officers, policymakers, and
public health professionals, to determine appropriate solutions for eliminating traffic deaths and severe
injuries. Successful solutions and strategies have included:
• Reducing speed limits
• Redesigning streetscapes
• Implementing behavior change campaigns for motorists, bicyclists, and pedestrians
• Enhancing data-driven traffic enforcement
Vision Zero initiatives represent a commitment from local jurisdictions and elected officials to prioritizing
safer streets both in policy and practice.
NATIONAL BIKE MONTH
National Bike Month is held in May of each year. Established in 1956 and sponsored by the League of
American Bicyclists (LAB), it encourages local jurisdictions all across the United States to develop programs
and events to promote bicycling to work, school, as well as for recreation. OCTA celebrates National Bike
Month with events such as the OCTA Bike Rally and the OCTA Bike Festival at the Dana Point Grand Prix.
During Bike to Work Week within Bike Month, Metrolink offers free rides to passengers who bring a bike
onboard the train to encourage people to bike to transit connections. In 2017, Metrolink also partnered with
the Los Angeles Metropolitan Transportation Authority (Metro) to offer a free month of bike share rides to
2,000 Metrolink riders.
BICYCLE FRIENDLY COMMUNITY DESIGNATION
Through its Bicycle Friendly America (BFA) program, the League of American Bicyclists (LAB) recognizes
communities that improve bicycling conditions through education, encouragement, enforcement, and
evaluation programs. Communities can achieve platinum, gold, silver, or bronze status, or an honorary
mention. Bicycle friendliness can indicate that a community is healthy and vibrant. Bicycle friendliness can
increase property values, spur business growth, and increase tourism. Details on obtaining bike friendly
community status can be found on LAB’s website.
OC ACTIVE - BICYCLE & PEDESTRIAN BEST PRACTICES TOOLKIT 2018 112. ENCOURAGEMENT
BICYCLE AND PEDESTRIAN PLANNING POLICIES AND PROGRAMS
Pedestrian planning policies can help transform the broad focus of various plan efforts into distinct
actionable priorities. They help provide the direction necessary for cities to prioritize and implement projects
and programs that support plan goals and objectives. Some example planning policies and programs
specific to improving bicycle and pedestrian safety include:
• Implementing a pedestrian signal policy that prioritizes the safe movement of pedestrians
• Adopting a Vision Zero policy and communication strategy
• Developing a complete streets policy (as required by AB1358)
• Developing a SRTS program
• Developing a citywide wayfinding program
Local jurisdictions can also encourage and promote more bicycle and pedestrian activity by ensuring
future neighborhood plans, specific plans, and corridor plans contain design standards and principles that
support bicycle and pedestrian connections and activity throughout the surrounding built environment. Best
practices for encouraging bicycle and pedestrian activity in these local community plans include:
• Emphasizing bicycle- and pedestrian-oriented design features and placemaking.
• Developing streetscape plans that create a comfortable, convenient, safe, bikeable, and walkable
environment with bicycle and pedestrian features and amenities.
• Implementing form-based codes that emphasize bicycle- and pedestrian-scaled building facades, short
block lengths, bike buffers, pedestrian buffers, and other urban design features.
• Incorporating mixed-use zones and moderate to high development densities where feasible.
ADDITIONAL INFORMATION
• CicLAvia
http://www.ciclavia.org/
• City of Santa Ana, Downtown Transit Zone Complete Streets Plan
http://www.ci.santa-ana.ca.us/completestreets/DowntownTransitZoneCompleteStreetPlan.asp
• City of Santa Ana, Harbor Mixed Use Transit Corridor Plan
http://www.santa-ana.org/pba/planning/HarborMixedUseTransitCorridorPlan.asp
• City of Santa Ana, SOMOS
http://www.ci.santa-ana.ca.us/parks/somos/
• FHWA, Noteworthy Local Policies that Support Safe and Complete Pedestrian and Bicycle
Networks, 2016
https://safety.fhwa.dot.gov/ped_bike/tools_solve/docs/fhwasa17006-Final.pdf
• League of American Bicyclists, Bicycle Friendly America Program
http://www.bikeleague.org/bfa
• League of American Bicyclists, National Bike Month
https://bikeleague.org/bikemonth
• Metrolink, National Bike Month 2017
https://www.metrolinktrains.com/news/metrolink-news/metrolink-celebrates-national-bike-month-with-
events-and-contests-to-promote-cycling/
• OCTA, National Bike Month 2017
http://www.octa.net/Bike-Month-2017/
12 OCTA - Orange County Transportation Authority2. ENCOURAGEMENT
• Reimagine Garden Grove
http://ggopenstreets.com/
• SCAG Go Human
http://gohumansocal.org/Pages/Home.aspx
• Street Plans Collaborative, Tactical Urbanist’s Guide to Materials and Design, 2016
http://tacticalurbanismguide.com/guides/tactical-urbanists-guide-to-materials-and-design/
• Street Plans Collaborative, San Francisco Planning Department, and MJM Management, Public
Space Stewardship Guide, 2016
http://sf-planning.org/public-space-stewardship-guide
• Street Plans Collaborative, The Alliance for Biking and Walking, and The Fund for the Environment
and Urban Life, The Open Streets Guide, 2012
http://tacticalurbanismguide.com/guides/the-open-streets-guide/
• Tactical Urbanist’s Guide
http://tacticalurbanismguide.com/
• Vermont Safe Routes to School Walk and Roll to School Days Mini Guide
http://saferoutes.vermont.gov/sites/saferoutes/files/WalkandRoll.pdf
• Vision Zero Network
https://visionzeronetwork.org/
• Walk and Bike to School
http://www.walkbiketoschool.org/
OC ACTIVE - BICYCLE & PEDESTRIAN BEST PRACTICES TOOLKIT 2018 132. ENCOURAGEMENT
This page intentionally left blank.
14 OCTA - Orange County Transportation Authority3. ENFORCEMENT
3. ENFORCEMENT
Consistent enforcement of traffic laws is an important tool local jurisdictions can use to improve bicyclist and
pedestrian safety and reduce the risk of severe and fatal collisions. Enforcement activities target behaviors
that impact bicyclist and pedestrian safety, such as speeding, driver impairment, and distraction. They can
take on a variety of forms, such as enforcement of traffic violations, safety patrols on major arterial streets,
radar speed signs, and more. Implementing enforcement activities helps to increase awareness and reduce
the frequency of traffic safety problems.
Effective bicycle and pedestrian safety enforcement activities often include collaboration and coordination
with multiple departments within local jurisdictions. The U.S. Department of Transportation’s National
Highway Traffic Safety Administration (NHTSA) developed guides on how to enforce both bicycle safety and
pedestrian safety. In the guides, the NHTSA found that effective bicycle and pedestrian safety enforcement
activities tend to include some of the following components:
• Collaboration with partners in local businesses, civic organizations, and government agencies.
• Collaboration and coordination between the judiciary branch and city officials on planned traffic safety
operations.
• Coordination with city engineers to ensure locations selected for traffic safety operations are suitable.
• Police officer trainings on local laws pertaining to crosswalks, pedestrians, and bicyclists, as well as
training on safety program goals, objectives, and procedures.
• Incorporating bicycle and pedestrian safety operations into routine enforcement activities.
This section provides some benefits of pedestrian enforcement activities and some examples implemented
in various cities both locally and nationally.
OC ACTIVE - BICYCLE & PEDESTRIAN BEST PRACTICES TOOLKIT 2018 153. ENFORCEMENT
BENEFITS
Some of the benefits of implementing enforcement activities include:
• Increasing compliance with traffic safety laws.
• Improving driver, bicyclist, and pedestrian behavior.
• Reinforcing the importance of traffic codes to drivers, bicyclists, and pedestrians.
• Reducing collisions, injuries, and fatalities.
• Improving safety.
• Improving the relationship between the pedestrian/bicycling community and
law enforcement.
EXAMPLES
ORANGE COUNTY SHERIFF’S DEPARTMENT BIKE AND PEDESTRIAN SAFETY
ENFORCEMENT OPERATION PROGRAM
The Orange County Sheriff’s Department periodically conducts bike and pedestrian safety enforcement
operations which focus enforcement on collision factors involving motorists, pedestrians, and bicyclists. The
Orange County’s Sheriff’s Department deploys extra officers to patrol locations where frequent pedestrian
and bike collisions have occurred over the last three years. Patrolling officers pay special attention to
drivers who speed, make illegal turns, fail to stop for stop signs and signals, fail to yield to pedestrians in
crosswalks, and any other dangerous violations. Enforcement of traffic laws is not restricted to motorists.
The program also enforces violations committed by pedestrians, such as crossing the street illegally or
failing to yield to drivers who have the right-of-way. Funding for the bike and pedestrian safety enforcement
operation program is provided by a grant from the California Office of Traffic Safety through the NHTSA.
CITY OF HUNTINGTON BEACH TICKET DIVERSION PROGRAM
The City of Huntington Beach re-launched its ticket diversion program in 2016, which provides an option
for bicyclists and pedestrians to take a safety class in-lieu of paying a fine for traffic violations, authorized
under the State of California’s Assembly Bill 902 signed in September 2015. The safety class is a two hour
class offered once a month and covers traffic laws and safety for active modes of transportation, such as
walking, biking, and skateboarding. Traffic law offenders can be penalized with a fine up to $254 in the City
of Huntington Beach. The cost of the class is $50, leading to a potential savings of $200 when traffic law
offenders choose the traffic safety class option.
The ticket diversion program effectively encourages and promotes active transportation and safety within the
city through a number of ways. First, the fines discourage violations of traffic law and second, it increases
the number of people who voluntarily obtain education on traffic and safety laws for active modes of
transportation.
16 OCTA - Orange County Transportation Authority3. ENFORCEMENT
The operation of the safety classes include cooperation from the police department and the City. To save
costs, the safety classes are held at the City Council Chambers and are taught by two officers from the
Huntington Beach Police Department. The classes include a presentation and videos discussing local and
state laws. Additionally, costs are offset by the $50 class fee from adult participation and $15 from youth
participation.
In Torrance, The South Bay Bicycling Coalition piloted a similar program along with the Redondo Beach
Police Department and the traffic division of the Torrance Superior Court. Anyone who is cited in a city that
cites to traffic court at the Torrance Superior Court can take the class and consequently get the citation
erased from their record. The three hour safety class is taught by the South Bay Bicycling Coalition and
covers the causes of bicycle crashes, rules of the road, safe-riding practices.
CITY OF SAN FRANCISCO PEDESTRIAN SAFETY ENFORCEMENT OPERATIONS
The San Francisco Police Department periodically conducts traffic safety enforcement operations that target
bicycle and pedestrian safety. The operations deploy additional officers at locations where high numbers of
pedestrian and bicycle collisions have occurred in the last three years. Under the program, special attention
is directed towards the “Focus on the Five” traffic violations, which include: speeding, making illegal turns,
failing to stop for stop signs and red lights, failing to yield to pedestrians in cross walks, as well as any other
dangerous traffic violations.
The San Francisco Police Department periodically conducts three types of pedestrian safety operations to
enforce traffic laws. These three types include:
• Pedestrian Decoys: Operations that target motorists who fail to yield to pedestrians in crosswalks.
Decoy operations can involve one or more decoy officers and four to six citing officers.
• LIDAR Speed Enforcement: Operations that target motorists who travel at unsafe speeds through
pedestrian zones. LIDAR speed enforcement operations can involve up to six officers.
• Saturation Patrol: Operations that target traffic violations and collision factors related to distracted
driving. Saturation patrol operations can involve up to eight or more officers.
Locations for these operations are based on both complaints and frequency of incident occurrence.
ORLANDO BEST FOOT FORWARD FOR PEDESTRIAN SAFETY
Best Foot Forward is a pedestrian safety initiative launched in 2012 in Central Florida. It was formed to
reduce pedestrian fatalities and injuries in the Orlando-Kissimmee-Sanford metropolitan statistical area
(MSA) by 50% over a span of five years. The best foot forward coalition includes a variety of stakeholders,
such as MetroPlan Orlando, Orange County Government, the City of Orlando, Orange County Public
Schools, Orlando Health, the Florida Department of Transportation, LYNX, Winter Park Health Foundation,
Orange Cycle, University of Miami’s Walk/Safe, Healthy Central Florida, as well as police officers throughout
Orange County.
The initiative began in 2012 targeting the enforcement of traffic violations at non-signalized, marked
crosswalks on streets with posted speed limits of 35 mph or less. The operation included two weeks of
enforcement and six weeks of data collection to measure the results. The initiative also provides training to
law enforcement officers and helps to subsidize overtime costs through a 50/50 funding match.
ADDITIONAL LAW ENFORCEMENT STRATEGIES
General strategies that can help enforce good vehicle, bicycle, and pedestrian behavior as well as bridge the
gap between law enforcement and users of active transportation include officer participation on a Bicycle
OC ACTIVE - BICYCLE & PEDESTRIAN BEST PRACTICES TOOLKIT 2018 173. ENFORCEMENT
Advisory Committee, the implementation of Bicycle Patrol Units, and Speed Radar Trailers.
• Officer Participation on Bicycle Advisory Committee: The League of American Bicyclists suggests
that law enforcement officials take on a role in a Bicycle Advisory Committee. Bicycle Advisory
Committees help address local bicycling needs and decisions regarding bicycling in their specific
communities. This type of participation increases awareness of bicyclist concerns as well as the role that
law enforcement has in creating an environment where bicyclists feel welcome but are also practicing
safe behavior while bicycling.
• Bicycle Patrol Units: The League of American Bicyclists supports the strategy of having more police
officers on bikes to help increase understanding of cyclists’ issues. Bike patrol officers should undergo
specialized training in bicycle-related traffic laws and safety techniques. Additionally, other bicyclists are
typically more accepting of bike patrol officers as they can connect with bicyclists on a different level
than vehicle patrol officers in a non-confrontational manner. Bike patrol officers can also more easily
move about and enforce areas that are not easily vehicle accessible, such as near clusters of buildings
at college campuses, office parks, shopping centers, or at events such as street fairs and other public
gatherings. As a bonus, bicycles cost less to purchase and maintain than traditional patrol cars.
• Speed Radar Trailer: Speed radar trailers are electronic roadside signs mounted on an unmanned trailer
that tell drivers how fast their vehicle is moving and can flash when they are going too fast, along with
a speed limit sign. This is especially helpful near schools, crosswalks, or bicycle/multi-use paths where
there are more likely to be bicyclists and pedestrians, or areas where there are speeding problems.
Although more of a short-term strategy, speed radar trailers can be effective in signaling to vehicles to be
more aware of those who are traveling without a car.
ADDITIONAL INFORMATION
• Best Foot Forward Grassroots Pedestrian Safety Initiative
http://www.iyield4peds.org/
• Huntington Beach Ticket Diversion Program
http://gohumansocal.org/Documents/Tools/CaseStudy_HuntingtonBeach.pdf
• League of American Bicyclists, Bicycle Friendly America Program
http://www.bikeleague.org/bfa
• NHTSA, Pedestrian Safety Enforcement Operations: A How-To Guide, 2014
https://www.nhtsa.gov/staticfiles/nti/pdf/812059-PedestrianSafetyEnforceOperaHowToGuide.pdf
• Pedestrian and Bicycle Information Center, The Role of Law Enforcement in Pedestrian and
Bicycle Safety Programs,
http://www.pedbikeinfo.org/programs/enforcement.cfm
• South Bay Bicycle Coalition, Bicycle Safety Class
http://www.southbaybicyclecoalition.org/bicyclesafetyclass/
18 OCTA - Orange County Transportation Authority4. EVALUATION
4. EVALUATION
Evaluating bicycle and pedestrian planning strategies is an important tool for local jurisdictions to use to
determine whether an approach is successful in improving bicycle and pedestrian conditions and safety. It
involves applying appropriate performance metrics to measure the effectiveness of a strategy in meeting
project and community goals. Applying performance metrics can also help local jurisdictions customize and
adopt appropriate strategies that require complex design solutions specific to a given community.
BENEFITS
Evaluating active transportation planning policies, strategies, and projects with appropriate
performance metrics provides a number of benefits to local jurisdictions. Some of these benefits
include:
• Measuring project success in meeting community goals.
• Helping local jurisdictions prioritize projects.
• Demonstrating value and benefits of projects to community members.
• Inform smarter data-driven infrastructure investments and decisions.
• Tracking project progress over a period of time.
• Capturing datasets for other related projects.
OC ACTIVE - BICYCLE & PEDESTRIAN BEST PRACTICES TOOLKIT 2018 194. EVALUATION
EXAMPLES
The type of performance metrics used will vary based on the nature of the project, goals, and data available.
This toolkit provides some examples of performance metrics that can be used to measure pedestrian safety,
infrastructure/network quality, and access to destinations as summarized in Table 5-1.
Table 5-1: Sample Evaluation Metrics
PERFORMANCE CATEGORY PERFORMANCE METRIC
Bicycle/Pedestrian Counts and Trends
SAFETY Bicycle/Pedestrian Injuries and Fatalities
Traffic Speed (85th Percentile Speeds)
Level of Traffic Stress
Bicycle/Pedestrian Level of Service (PLOS)
INFRASTRUCTURE / NETWORK QUALITY Presence of Bicycle/Pedestrian Facilities
Distance between Marked Crosswalks
Connectivity/Gap Closures
Proximity to Transit (First/Last Mile)
ACCESS TO DESTINATIONS
Trails Connection
METRICS TO MEASURE SAFETY
Performance metrics to measure safety provide information on the well-being of active transportation users
on a given network. They can also provide information on the public health of a community. Some common
performance metrics used to measure bicyclist and pedestrian safety include:
• Bicycle/Pedestrian Counts and Trends: Conducting bicycle and pedestrian counts provides
information on infrastructure usage levels. It provides information on whether bicycle and pedestrian
activity is increasing or decreasing over a period of time. Low levels of bicycle and pedestrian activity
can be an indicator of infrastructure and safety issues. Several resources are available describing best
practices in data collection for bike and pedestrian counts. Some of these resources include guidance
and best practice strategies from FHWA, SCAG, Metro, and the National Bicycle and Pedestrian
Documentation Project.
• Bicyclist/Pedestrian Injuries and Fatalities: Analyzing bicyclist and pedestrian injuries and fatalities
can provide detailed information on how safe a street or intersection is for pedestrians. It can provide
insight to collision patterns in the time of day, type of accident, cause of the accident, and location.
A common resource for collision data is the California Highway Patrol’s (CHP) Statewide Integrated
Traffic Records System (SWITRS), which provides collision data for a variety of modes as well as data
on injury severity. Additionally, another useful resource is UC Berkeley’s Transportation Injury Mapping
System (TIMS), which organizes SWITRS data into an easy to use web-based data query and mapping
application that can be integrated seamlessly with Google Maps and ArcGIS.
• Traffic Speed (85th Percentile Speed): Analyzing traffic speeds can provide information on a roadway’s
propensity for bicycle and pedestrian collisions and level of injury severity. Increases in frequency and
injury severity are often found in collisions with vehicles traveling at higher speeds. The National Center
for SRTS reports that crashes at speeds of 30 mph are approximately eight times more likely to kill a
pedestrian than crashes at speeds of 20 mph. Obtaining data on 85th percentile speeds provides
information on the average speed that 85% of vehicles do not exceed along a given corridor. Analyzing
20 OCTA - Orange County Transportation Authority4. EVALUATION
trends in traffic speeds can also provide information on whether infrastructure design solutions have
improved the safety of a corridor and reduced collision risk and potential levels of injury severity.
METRICS TO MEASURE INFRASTRUCTURE/NETWORK QUALITY
Performance metrics to measure bicycle and pedestrian infrastructure/network quality provide information
on elements that impact the quality and attractiveness of the bicycle and pedestrian environment. Simply
providing active transportation infrastructure does not always increase bicycle and pedestrian activity
within a community. Higher quality pedestrian infrastructure, which enhances the attractiveness of biking
and walking, considers elements such as bike buffers, pedestrian buffers, street trees, sidewalk widths and
accessibility, safety, connectivity, distances to crosswalks, and others. Some common performance metrics
used to measure bicycle and pedestrian infrastructure/network quality include:
• Level of Traffic Stress: The Mineta Transportation Institute developed a methodology for measuring
low-stress connectivity to evaluate and guide bicycle network planning. The methodology utilizes a
classification system of roadways to determine their level of traffic stress. This same methodology
can be applied to the pedestrian network planning. Level of traffic stress can be used to measure the
qualitative aspects of bicycle and pedestrian facilities and sidewalks by considering factors such as
number of travel lanes on the roadway, traffic volumes, posted speed limits, presence/absence of bike
and pedestrian buffers (street trees, on-street parking, street furniture, etc.), and others. This metric
provides information on the anticipated comfort level a bicyclist or pedestrian would have biking or
walking along a given corridor.
• Bicycle/Pedestrian Level of Service (BLOS/PLOS): BLOS/PLOS is another performance metric for
measuring quality of service of a bicycle or pedestrian facility. It incorporates measures for comfort,
safety, and ease of mobility. The 2010 Highway Capacity Manual (HCM 2010) includes methodologies
for calculating BLOS and PLOS and includes a variety of elements in its calculation, such as traffic
volumes, speed, signalized intersections, pavement conditions, and others.
• Presence of Bicycle/Pedestrian Facilities: Presence of bicycle and pedestrian facilities, such as bike
paths of varying class types, sidewalks, crosswalks, curb ramps, and others, provide information on the
presence of the infrastructure needed to facilitate bicycle and pedestrian activity. Walk audits containing
checklists for these types of infrastructure items are a helpful tool to inventory and evaluate the quality of
bicycle and pedestrian facilities. Organizations such as the Pedestrian and Bicycle Information Center
and the American Association of Retired Persons (AARP) provide sample walk audit checklists on their
websites available for use.
• Distance Between Marked Crossings: Marked crosswalks help facilitate safe crossings for pedestrians
by improving visibility and signifying the presence of pedestrians to drivers. Longer distances between
marked crossings tend to deter pedestrian activity since it increases the time it takes for a pedestrian to
get from point A to point B. Distance between marked crossings can provide information on whether the
roadway is providing adequate opportunities for safe pedestrian crossings.
• Connectivity/Gap Closure: Connectivity and gap closure can help provide information on the
accessibility of a bicycle or pedestrian facility. Sidewalks with missing gaps can impede pedestrian
activity for those with disabilities and can also deter those without disabilities from walking along
a corridor. Similarly, bikeways with missing gaps can deter bicyclists from choosing to bike to their
destination if the gap makes them feel unsafe.
METRICS TO MEASURE ACCESS TO DESTINATIONS
Biking and walking often times serves as one component of a larger multi-modal trip, thus connectivity to
other infrastructure, such as transit stops, multi-purpose trails, and bikeways, greatly enhances a person’s
ability to access goods, services, jobs, and recreation. Some common performance metrics used to measure
bicycle and pedestrian access to destinations include:
OC ACTIVE - BICYCLE & PEDESTRIAN BEST PRACTICES TOOLKIT 2018 214. EVALUATION
• Proximity to Transit (First/Last Mile): Proximity to transit provides information on a bicyclist or
pedestrian’s ability to get from point A to point B. Bike and pedestrian facilities that are in close
proximity to transit can help improve a community’s access to goods, services, jobs, and key
destinations.
• Bikeways/Trails Connection: Pedestrian connections to existing bikeways and recreational multi-use
trails can encourage more pedestrian activity and provide access to recreational destinations such as
parks and open spaces.
ADDITIONAL INFORMATION
The following resources provide additional information on the evaluation of pedestrian planning projects and
performance metrics.
• AARP, Walk Audit Tool Kit, 2016
https://www.aarp.org/content/dam/aarp/livable-communities/documents-2016/Walk-Audit-Tool-Kit/
AARP-Walk-Audit-Tool-Kit-100416.pdf
• Caltrans, Toward an Active California State Bicycle + Pedestrian Plan Performance Measures
Technical Report, 2017
http://www.dot.ca.gov/activecalifornia/documents/PlanElements/Final_ActiveCA_PerformanceMeasures.
pdf
• CHP SWITRS
http://iswitrs.chp.ca.gov/Reports/jsp/CollisionReports.jsp
• Fehr and Peers, Active Transportation Performance Measures, 2015
http://www.fehrandpeers.com/active-transportation-performance-measures/
• FHWA, Exploring Pedestrian Counting Procedures: A Review and Compilation of Existing
Procedures, Good Practices, and Recommendations, 2016
https://www.fhwa.dot.gov/policyinformation/travel_monitoring/pubs/hpl16026/hpl16026.pdf
• FHWA, Guidebook for Developing Pedestrian and Bicycle Performance Measures, 2016
https://www.fhwa.dot.gov/environment/bicycle_pedestrian/publications/performance_measures_
guidebook/pm_guidebook.pdf
• Mineta Transportation Institute, Low-Stress Bicycling and Network Connectivity, 2012
http://transweb.sjsu.edu/PDFs/research/1005-low-stress-bicycling-network-connectivity.pdf
• National Bicycle and Pedestrian Documentation Project
www.bikepeddocumentation.org
• Pedestrian and Bicycle Information Center Walkability Checklist
http://www.pedbikeinfo.org/pdf/community_walkability_checklist.pdf
• SCAG, Metro, Conducting Bicycle and Pedestrian Counts: A Manual for Jurisdictions in Los
Angeles County and Beyond, 2013
http://media.metro.net/projects_studies/call_projects/images/metroscag_bikepedcounttrainingmanual.
pdf
• UC Berkeley Transportation Injury Mapping System
https://tims.berkeley.edu
22 OCTA - Orange County Transportation Authority5. ENGINEERING
5. ENGINEERING
Engineering design treatments can greatly impact the environment for active transportation, by creating
safer, inviting, and more accessible conditions for bicyclist and pedestrian activity. A variety of engineering
tools can be applied to transform a streetscape so it can better accommodate bicyclist pedestrian safety
needs. Some of these tools focus on roadway design, while others focus on bicycle and pedestrian facilities
and infrastructure. This section provides brief descriptions of the benefits of implementing engineering
design treatments and the tools that are available.
BENEFITS
A variety of engineering design treatments can help promote active transportation and improve
safety conditions. By improving conditions for bicyclists and pedestrians, streets become safer
for all users including transit riders and motorists. Some of the benefits of implementing carefully
designed engineering treatments include:
• Reducing vehicular travel speeds and volumes down to a safe level.
• Improving visibility of bicyclists and pedestrians.
• Improving comfort level for bicyclists and pedestrians.
• Providing safe opportunities for crossings.
• Improving access to destinations.
OC ACTIVE - BICYCLE & PEDESTRIAN BEST PRACTICES TOOLKIT 2018 235. ENGINEERING
EXAMPLES
This toolkit provides some examples of engineering design treatments that can be used to improve the
bicycle and pedestrian environment. Although this section provides guidance on bicycle/pedestrian and
roadway facility design, it is important to remember that urban streets are extremely complex and any
roadway treatment must be carefully evaluated and tailored to each specific situation. Sound engineering
judgment should always be applied to any roadway modification project.
The engineering design treatments discussed in this section apply to both pedestrian and bicycle
environments. Table 5-1 outlines a list of the potential treatments, beginning with treatments that apply to
both pedestrian and bicycle strategies, treatments that only apply to pedestrian strategies, and treatments
that only apply to bicycle strategies. The table also indicates the page number where the specific treatment
is explained in more detail.
It should be noted that some of the engineering design treatments specific to bicycles on this list (beginning
with Shared-Use Paths) are taken from the Bicycle Facility Toolkit in OCTA’s 2016 OC Foothills Bikeways
Strategy. The document details a comprehensive outline of engineering design treatments that are suitable
for Orange County and are incorporated directly into this toolkit.
Table 5-1: Design Treatment Table
APPLICABILITY
ENGINEERING DESIGN TREATMENT PAGE
PEDESTRIAN BICYCLE
Traffic Calming • • 25
Pedestrian Lighting • • 26
Access to Transit • • 27
Driveways • • 28
Integration of Automated/Connected Vehicles • • 29
Sidewalks • 30
Pedestrian Buffers • 31
Integration with Bikeways • 32
Pedestrian Intersection Treatments • 32
Crossing Treatments • 33
Pedestrian Signage • 35
Senior Mobility • 35
Bikeway Facility Types • 36
Protected Intersections • 37
Shared-Use Paths • 41
Path Roadway Crossings • 47
Separated Bikeways Design • 51
Separated Bikeways at Intersections • 62
Signalization • 72
Shared Roadways • 76
Bikeway Signing • 79
Retrofitting Existing Streets to Accommodate Bikeways • 82
Bicycle Support Facilities • 85
Bikeways Maintenance • 91
24 OCTA - Orange County Transportation Authority5. ENGINEERING
TRAFFIC CALMING
DESCRIPTION
Traffic calming measures help reduce vehicular volumes and speed
down to a safe level for pedestrians and bicyclists. They include
a variety of physical roadway measures that are designed to help
improve safety and reduce conflicts between motorists, bicyclists,
and pedestrians. It should be noted that the OCTA MPAH strictly
prohibits the usage of volume control measures on MPAH streets.
Local jurisdictions can, however, implement volume control measures
on non-MPAH streets.
GUIDANCE/TOOLS
• Speed Control – Horizontal Measures
- Traffic Circles: Traffic circles are raised circular islands constructed in the center of residential or
local street intersections. They force a motorists to slow down in order to maneuver around them
and may vary in design and materials used. The primary benefit of traffic circles is that they reduce
the number of angle and turning collisions.
- Chicanes: Chicanes are a series of curb extensions or road narrowings that are placed to form
S-shaped curves along a segment of a roadway. Chicanes require motorists to slow down to a
speed that allows them to maneuver around them. They should be placed at mid-block locations
only and are the most effective on roadways where traffic volumes are equivalent on both
approaches.
- Lateral Shifts: Lateral shifts are a variation of a chicane, however only involves a single shift in
the roadways rather than multiple shifts. Typical lateral shifts include a median island to prevent
motorists from crossing the centerline and driving a straight path. Lateral shifts are applicable only
at mid-block locations.
- Realigned Intersections: Realigned intersections involve the reconfiguration of a T-intersection.
They skew the approaches or travel paths through the intersection into curving streets and reduce
vehicular speeds by limiting the ability for a motorist to drive through the intersection in a straight
path.
• Speed Control – Vertical Measures
- Speed Humps: Speed humps are rounded, raised areas placed across the roadway. They are
generally 10 to 14 feet long (in the direction of travel) and are 3 to 4 inches high. The profile of a
speed hump can be circular, parabolic, or sinusoidal. They are often tapered as they reach the curb
on each end to allow unimpeded drainage.
- Speed Cushions: A speed cushion is type of speed hump that allows larger vehicles, especially fire
trucks, to straddle them without slowing down. Several small speed cushions are installed in a series
across a roadway with spaces in between them.
- Speed Tables: These are flat-topped speed humps often constructed with brick or other textured
materials on the flat section. Speed tables are typically long enough for the entire wheelbase of a
passenger car to rest on the flat section. Good for locations where low speeds are desired but a
somewhat smooth ride is needed for larger vehicles. Their long flat fields give speed tables higher
design speeds than speed humps.
- Raised Intersections: A raised intersection is essentially a speed table for an entire intersection.
Construction involves providing ramps on each intersection approach and elevating the entire
intersection to the level of the sidewalk. They can be built with a variety of materials, including
asphalt, concrete, or pavers. The crosswalks on each approach are also elevated as a part of the
OC ACTIVE - BICYCLE & PEDESTRIAN BEST PRACTICES TOOLKIT 2018 25You can also read