Age Friendly Seattle Action Plan 2018-2021 - Seattle.gov
←
→
Page content transcription
If your browser does not render page correctly, please read the page content below
Age Friendly Seattle
  Action Plan 2018–2021
Office of the Mayor
                                    Jenny A. Durkan, Mayor of Seattle

                                               Seattle City Council
             District 1 – Lisa Herbold                                 District 5 – Debora Juarez
             District 2 – Bruce Harrell                                District 6 – Mike O’Brien
            District 3 – Kshama Sawant                                 District 7 – Sally Bagshaw
             District 4 – Rob Johnson                                Position 8 – Teresa Mosqueda
                                          Position 9 – Lorena González

                                           Departments & Agencies
      Animal Shelter, Seattle             Finance & Administrative Services,        Parks and Recreation,
     Arts & Culture, Office of                     Department of                       Department of
        Budget Office, City                   Fire Department, Seattle             Planning & Community
                                             Hearing Examiner, Office of           Development, Office of
    City Attorney, Office of the
                                                  Housing, Office of              Police Department, Seattle
    City Auditor, Office of the
                                          Human Resources, Department of       Police Accountability, Office of
     City Clerk, Office of the
                                            Human Services Department               Public Library, Seattle
        City Light, Seattle
                                            Immigrant & Refugee Affairs,            Public Utilities, Seattle
      Civil Rights, Office for
                                                     Office of                        Retirement Office
   Construction & Inspections,
         Department of                     Information Technology, Seattle              Seattle Center
 Economic Development, Office of            Intergovernmental Relations,               Seattle Channel
                                                      Office of                     Special Events Office
   Education & Early Learning,
        Department of                         Labor Standards, Office of        Sustainability & Environment,
Emergency Management, Office of                Municipal Court, Seattle                   Office of
      Film & Music, Office of              Neighborhoods, Department of        Transportation, Department of
                                                                                  Waterfront, Office of the

                                   Accessibility & Contact Information
The City of Seattle encourages everyone to participate in its programs and activities, regardless of
ability. To receive this document in an alternate format, call Age Friendly Seattle at 206-386-1521 or e-
mail agefriendly@seattle.gov.
To request an accommodation at an event or meeting, call 206-684-2489 (voice) or TTY 711, or e-mail
adacoordinator@seattle.gov at your earliest opportunity.

For more information about Age Friendly Seattle, visit seattle.gov/agefriendly.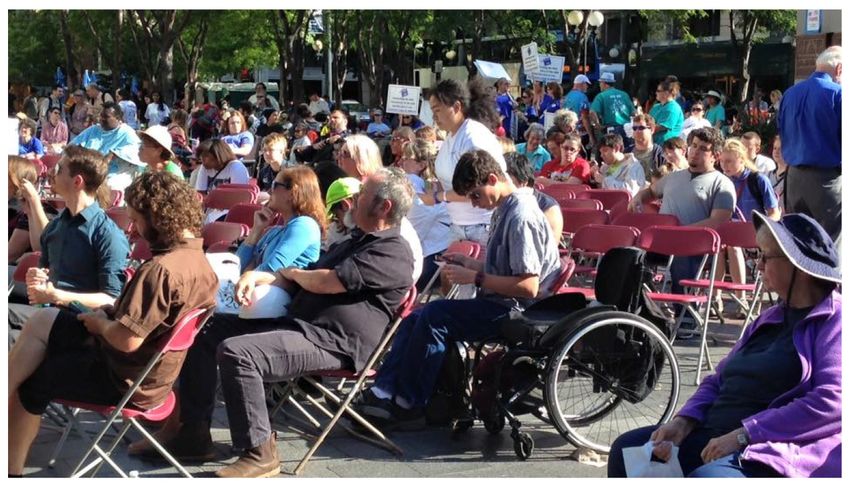
Table of Contents
TABLE OF CONTENTS ....................................................................................................................... 3

Letter from Mayor Jenny Durkan ........................................................................................................................... 5

Executive Summary ............................................................................................................................................... 7

Chapter 1: Introduction to Age Friendly Seattle .................................................................................................. 11
  Building on Previous Work ......................................................................................................................................11
  Age Friendly Coalition for Seattle and King County ................................................................................................12
  Seattle joins AARP Network of Age-Friendly Communities.....................................................................................12
  Age Friendly Seattle Initiative & Early Actions ........................................................................................................13

Chapter 2: Why This Work is Important .............................................................................................................. 15
  The Age Wave .........................................................................................................................................................15
  Race and Social Justice ............................................................................................................................................15

Chapter 3: Assessment & Planning...................................................................................................................... 16
  Demographics .........................................................................................................................................................16
  AARP Age-Friendly Community Survey ...................................................................................................................20
  AARP Livability Index ...............................................................................................................................................26
  Elder Index...............................................................................................................................................................26
  Consumers...............................................................................................................................................................27
  Volunteerism ...........................................................................................................................................................27
  Existing reports........................................................................................................................................................28
  Outreach events ......................................................................................................................................................30
  Key findings .............................................................................................................................................................33

Chapter 4: The Eight Domains of Livability .......................................................................................................... 35
  1. Transportation ................................................................................................................................................36
  2. Housing ...........................................................................................................................................................39
  3. Outdoor Spaces & Buildings ...........................................................................................................................42
  4. Social Participation .........................................................................................................................................44
  5. Respect & Social Inclusion ..............................................................................................................................46
  6. Civic Participation & Employment ..................................................................................................................47
  7. Community & Health Services ........................................................................................................................49
  8. Communication & Information ......................................................................................................................51

Chapter 5: Goals & Actions .................................................................................................................................. 53
  1. Transportation ................................................................................................................................................53
  2. Housing ...........................................................................................................................................................54
  3. Outdoor Spaces & Buildings ...........................................................................................................................55
  4. Social Participation .........................................................................................................................................55
  5. Respect & Social Inclusion ..............................................................................................................................56
  6. Civic Participation & Employment ..................................................................................................................56
  7. Community & Health Services ........................................................................................................................57
  8. Communication & Information ......................................................................................................................59

Chapter 6: Implementation & Evaluation ............................................................................................................ 61
  Implementation.......................................................................................................................................................61
  Funding....................................................................................................................................................................61
  Equity and Results ...................................................................................................................................................61
Evaluation................................................................................................................................................................62

Acknowledgements ............................................................................................................................................. 63

End Notes ............................................................................................................................................................ 65
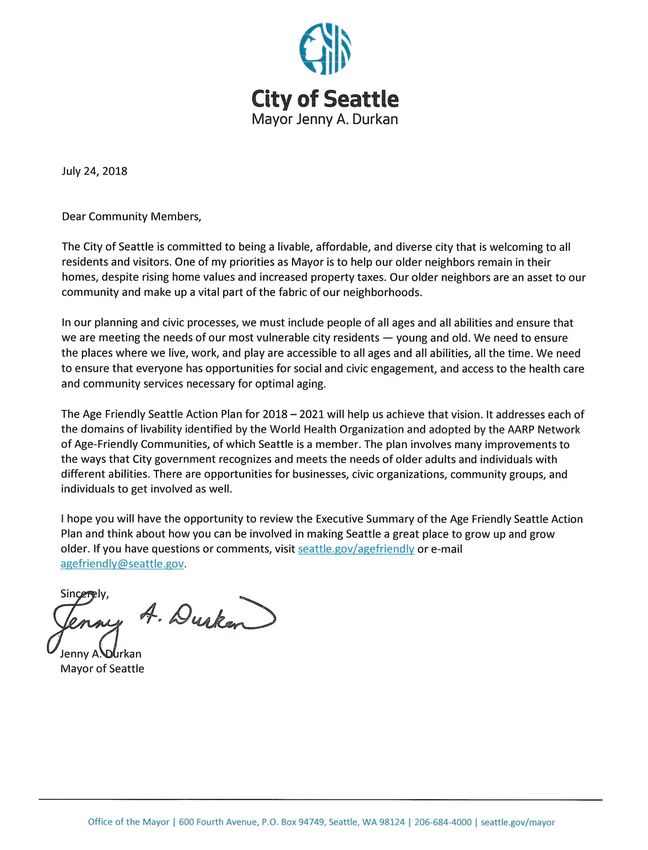
Letter from Mayor Jenny Durkan
This page intentionally left blank.
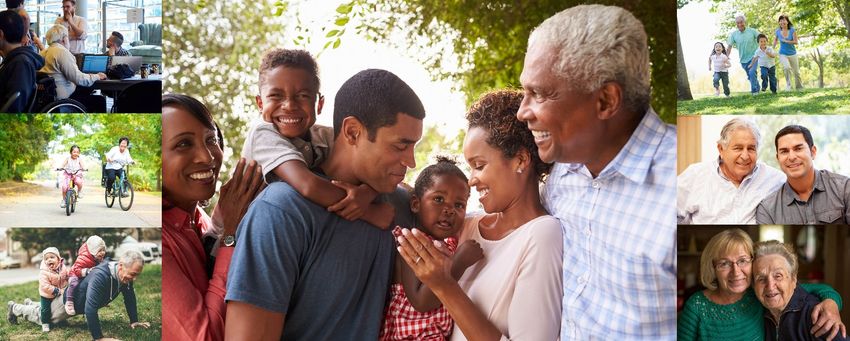
Executive Summary

             AGE FRIENDLY SEATTLE
                Making Seattle a great place to grow up AND grow old

On March 31, 2017, the City of Seattle adopted     In recognition of these trends, the City
Resolution 31739 to become a more age-             committed to becoming more age-friendly
friendly city under criteria established by the    using the WHO’s 8 Domains of Livability to
World Health Organization (WHO) and the            make Seattle a great place for people to grow
AARP Network of Age-Friendly Communities.          up and grow old.
Compelling data in “An Aging World: 2015” by
                                                   This commitment was strengthened in Mayor
the U.S. Census documented that the global
                                                   Jenny Durkan’s vision for Seattle, as outlined in
population age 60 and older is expected to rise
                                                   her 2018 State of the City Speech, which called
dramatically. In fact, the U.S. population aged
                                                   for a more affordable, effective, safe, and
65 and over doubled from seven percent to 14
                                                   vibrant city for the future. Under her
percent in the 69 years from 1944 to 2013 and
                                                   leadership, and with support from our City
will increase an additional seven percent to
                                                   Council and community partners, the City has
total 21 percent of the overall U.S. population
                                                   taken the preliminary steps outlined in the
by 2033.
                                                   resolution to build an accessible and affordable
This age wave will also impact Seattle and the     city for Seattleites of all ages, resulting in the
region. A recent report commissioned by the        Age Friendly Seattle Action Plan for 2018–2021.
City of Seattle, Moving Toward Age-Friendly
                                                   More than 2,000 people, including older
Housing in King County, indicates that the
                                                   immigrants, representatives from community-
percentage of King County adults aged 55 years
                                                   based organizations and City departments, and
and older will rise from 30 percent currently to
                                                   community leaders participated in creation of
47 percent of households in 2030. This trend
                                                   the plan. This extensive engagement
will outpace the supply of accessible and
                                                   accelerated the delivery of age-friendly services,
affordable housing in King County.
                                                   programs, and capital projects outlined in the
                                                   Age Friendly Seattle Action Plan.

                                 www.seattle.gov/agefriendly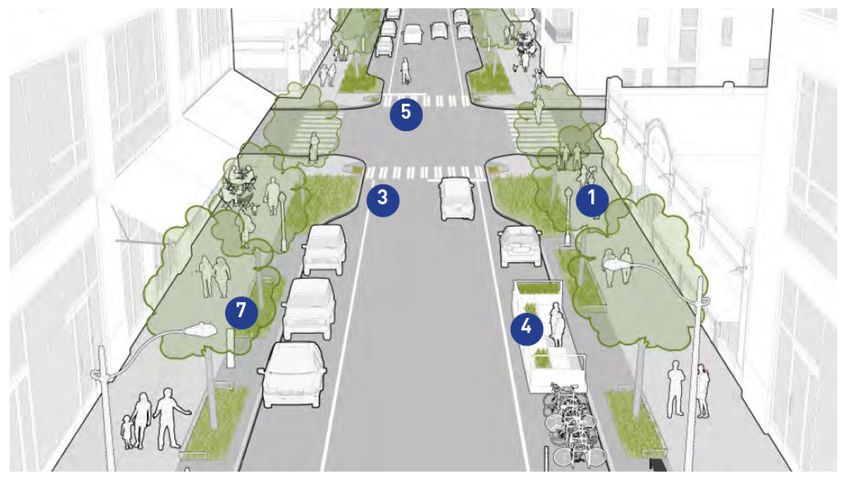
Action Plan
Mayor Jenny Durkan’s and the City Council’s shared focus on progressive values are reflected in the Age
Friendly Seattle Action Plan, specifically through actions to reduce race and social inequality, address the
needs of refugees and immigrants, and more broadly accommodate the needs of the City’s LGBTQ
population—the second-largest in the U.S. with 12.9 percent of the community identifying as LGBTQ+.
Early 2017 actions included community equity forums to explore the unique vulnerabilities of LGBTQ
elders and those unique to women.
The Age Friendly Seattle Action Plan was developed with and will be reviewed annually through the
racial equity lens provided by Seattle’s Race and Social Justice Initiative.
The Age Friendly Seattle Action Plan identifies strategies for improvement in each of “the eight domains
of livability,” a framework developed by the World Health Organization to address the environmental,
economic, and social factors influencing the health and well-being of older adults.

Housing                                                   Transportation
Age Friendly Seattle is collaborating with the            Working with the Seattle Department of
Office of Housing (OH), Office of Planning and            Transportation (SDOT) and DON, Age Friendly
Community Development (OPCD), and                         Seattle will help people of all ages and abilities
Department of Neighborhoods (DON) to                      connect in their neighborhoods and get where
implement affordable and accessible housing               they need to go by promoting best practices
strategies for older adults through improved              listed in SDOT’s Street Design Toolkit for Age-
access to programs; new and expanded                      Friendly Neighborhoods, implementing a city
initiatives based on the recommendations in               bench program, and promoting age-friendly and
Moving Toward Age-Friendly Housing in King                affordable transportation options.
County; increased public awareness and
utilization of County and City affordability
programs in partnership with the King County’s
Assessor’s Office; and promotion of state
legislation to increase resources for housing
preservation and production and expand access
to property tax savings.

                                  www.seattle.gov/agefriendly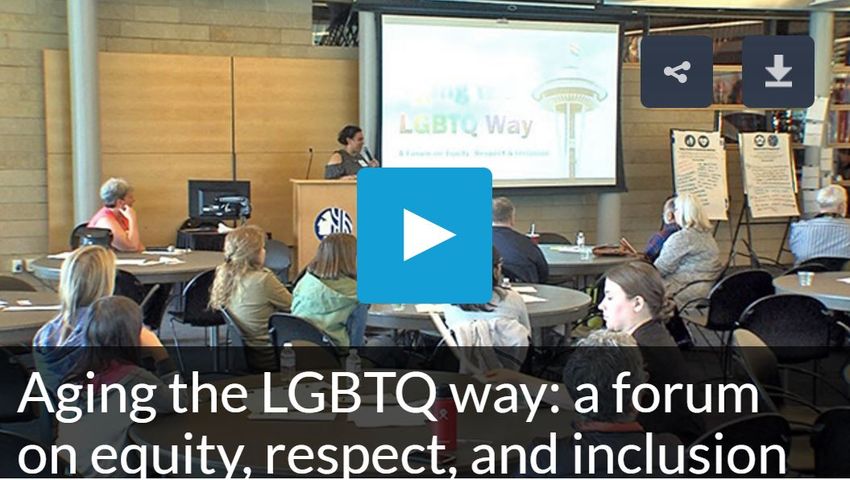
Outdoor Spaces & Buildings                        Respect & Social Inclusion
The City will advance Universal Design of the     Age Friendly Seattle will develop trainings for
physical environment so that buildings and        City staff, including emergency responders, to
outdoor spaces are usable by all people, to the   ensure competency when communicating with
greatest extent possible, without the need for    and serving older adults, individuals with
adaptation or specialized design.                 disabilities, and people with memory loss; and
                                                  work with departments and the community to
                                                  strengthen understanding of the unique needs
                                                  of LGBTQ elders, ensuring cultural and
                                                  contextual sensitivity and compassionate
                                                  caregiving.

Social Participation                              Civic Participation & Employment
Age Friendly Seattle will explore creation and    The Office of Economic Development (OED) will
expansion of programs that reduce social          develop and disseminate business tools that
isolation and provide more opportunities for      help assess age-friendliness and encourage
older adults and adults with disabilities to      improvements that benefit older customers,
engage in the life of their neighborhoods and     mature workers, and individuals with
communities, including programming for            disabilities; partner with employment resource
immigrant and refugee elders. A new               programs to better serve the needs of older
interactive discount directory for older adults   jobseekers; work with Seattle Department of
and adults with disabilities will promote         Human Resources and the business community
affordable community activities.                  to encourage hiring of mature workers; and
                                                  ensure that every City board and commission
                                                  includes at least one older adult, individual with
                                                  a disability and/or individual with memory loss
                                                  in its membership.

                                  www.seattle.gov/agefriendly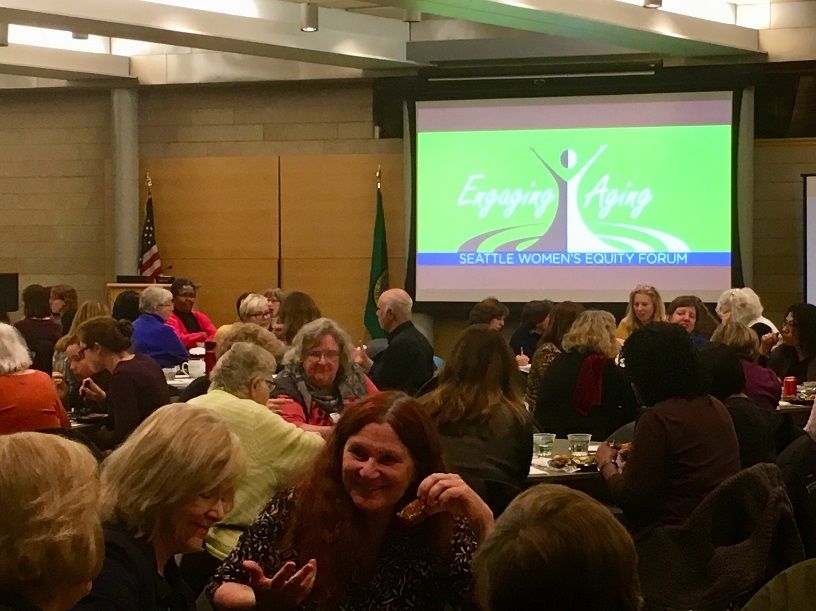
Community & Health Services                         Communication & Information
Age Friendly Seattle will collaborate with          To support access to City programs and services
housing providers, senior centers, and The          for all, Age Friendly Seattle will work with the
Seattle Channel to develop or expand                ADA Title II compliance program to ensure that
programming that makes it easier to access          City employees receive the training they need
services. Age Friendly Seattle will also engage     to create accessible documents and other
with health care systems to increase                materials and respond to requests for
identification of social needs and utilization of   accommodations—especially critical for disaster
community resources to support older patients       preparedness, response, and recovery—
in managing their health and health care;           building both communication competency and
disseminate information about elder abuse,          resiliency.
fraud, neglect, and exploitation; and support
access to caregiver support services.

                                                           The City of Seattle encourages
                                                            everyone to participate in its
                                                             programs and activities. For
                                                             disability accommodations,
                                                         materials in alternate formats, or
                                                               accessibility information,
                                                               call Age Friendly Seattle
                                                            at 206-684-0660 (Relay 711),
                                                          e-mail agefriendly@seattle.gov,
                                                        or visit www.seattle.gov/agefriendly
                                                            at your earliest opportunity.

                                  www.seattle.gov/agefriendly
Chapter 1: Introduction to Age Friendly Seattle
Age Friendly Seattle is built upon a solid foundation of work laid by Aging and Disability Services—the
Area Agency on Aging for Seattle-King County—and community partners.
Building on Previous Work
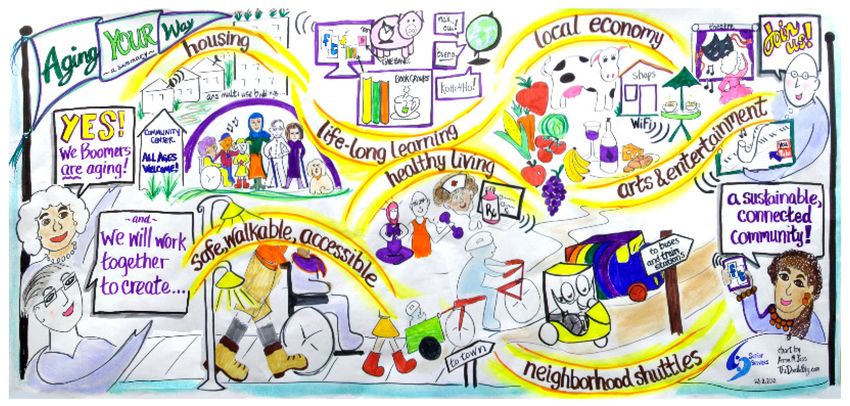
Aging Your Way
In 2009, Sound Generations—a nonprofit community partner, then known as Senior Services—launched
Aging Your Way to help plan for the aging Baby Boom generation. Twelve gatherings were attended by
700 older adults. Five overarching principles emerged—each of them valid today:
• Intergenerational
• Multicultural
• Sustainable
• Supported by technology
• Focused on local economies
Aging Your Way found seven common
themes:
1. Housing
2. Healthcare and fitness
3. Transportation
4. Lifelong learning
5. Local economies Image courtesy of Aging Your Way, Sound Generations
6. Built environment
7. Arts and entertainment
Aging Your Way ignited interest in several ongoing age-friendly projects that are implemented in a
variety of sites, including timebanking (e.g., West Seattle Timebank and SWEL TimeBank), virtual villages
(e.g., NEST, PNA Village, Wider Horizons, and Westside Neighbors Network), and World Dance Parties.
Aging Network Advocacy
For several years, the Seattle-King County
Advisory Council on Aging & Disability
Services (ADS) has raised awareness that,
due to anticipated increase in Seattle’s
aging baby boomer population, the
percentage of older adults in fair to poor
health, federal funding that has not kept
pace with inflation, and the increasing
costs of providing long-term services and
supports, local governments should:
• Create age-friendly communities
that support the needs of older
adults.
• Collaborate to leverage existing
resources effectively. Seattle-King County Advisory Council on
• Develop partnerships to bring new Aging & Disability Services, 2017
resources and creative approaches
that support successful aging. 1
Age Friendly Seattle Action Plan for 2018–2021 | 11The ADS Advisory Council continues to be an important partner in this work.
Age Friendly Coalition for Seattle and King County
Although the City of Seattle’s Human Services Department (HSD) Aging and Disability Services (ADS)
division was aware of the World Health Organization’s identification of the domains of livability and
AARP’s efforts to formalize agreements with communities wishing to become more livable,
administrations did not show significant interest in aging issues prior to 2016. A groundswell of support
arose in 2015 and research into age-friendly communities began in earnest in Seattle. ADS convened an
Age Friendly Communities Task Force (later renamed Age Friendly Coalition for Seattle and King County)
in May 2016 to discuss needs of older adults in the greater Seattle area and learn about best practices
from around the country.
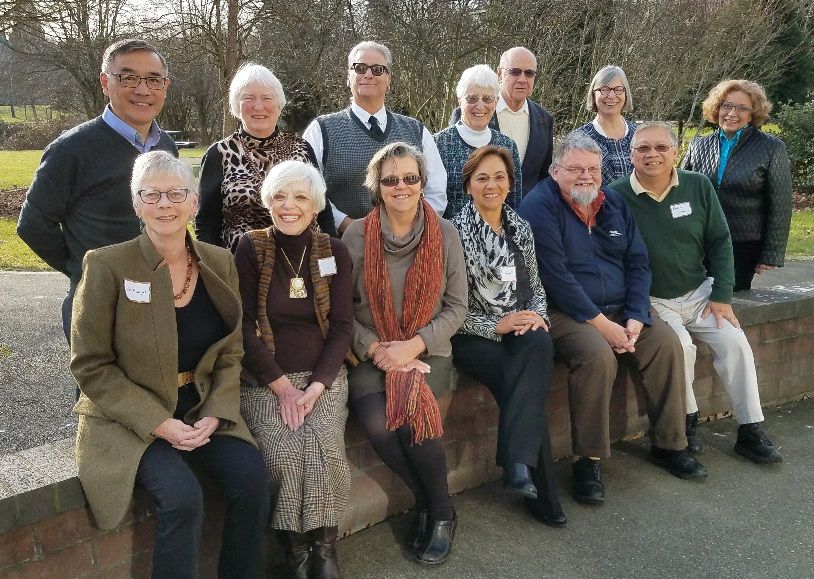
The Coalition is open to all and has both countywide representation and experts in each of the 8
Domains of Livability. Coalition members, whose ages range from their 20s to their 90s, offer a wide
range of intergenerational perspectives. Age Friendly Seattle will develop and implement strategies to
increase racial diversity so that the Coalition reflects the City’s racial demographics.
The Coalition developed the following:
• Vision: Our region thrives when people of all ages actively participate in community, have
equitable access to opportunities and everyone is treated with respect, regardless of their age
or ability.
• Mission/Purpose: Our mission is to provide leadership to advance the “age-friendly”
framework, created by the World Health Organization and supported by AARP, to further the
goal of ensuring that our region is a great place in which to grow up and grow old.
• Values: Our coalition is committed to fostering the following values:
o Respect
o Inclusion
o Enablement
o Equity
o Diversity
o Generational interdependence
• Committees: As of early 2018, the coalition has five committees:
o Steering
o Active Transportation
and Outdoor Spaces
o Housing
o Outreach, Advocacy
and Communications
o Social and Civic
Participation
Seattle joins AARP Network of
Age-Friendly Communities
In July 2016, the City of Seattle became
the 104th community in the U.S. to sign
on to the AARP Network of Age-
Friendly Communities, reflecting the The AARP Network of Age-Friendly Communities certificate
city’s shifting demographics and is valid until July 27, 2018.
renewed commitment to the needs of
Age Friendly Seattle Action Plan for 2018–2021 | 12all Seattleites. The network provides access to resources and information on age-friendly best practices,
assessment and implementation models, and experiences of towns and cities around the world. AARP
Washington has provided significant support in planning and development of livable communities in
Seattle.
Age Friendly Seattle Initiative & Early Actions
On March 22, 2017, then-Seattle Mayor Ed Murray and City
Councilmember Sally Bagshaw introduced a resolution expressing
the City of Seattle's commitment to become a more age-friendly
city under the criteria established by the WHO and the AARP
Network of Age-Friendly Communities. Age Friendly Seattle
Resolution 31739 received a unanimous vote by the Council. It
went into effect on March 31, 2017.
The resolution committed the City of Seattle to engage in a
continuous improvement process to become a more age-friendly
city by generating age-friendly goals through 2021, developing success measures, and integrating an
age-friendly lens into the City’s equity and inclusion initiatives. The resolution outlined early actions to
show success in 2017 and early 2018.
Age Friendly Seattle oversight was assigned to the Seattle Human Services Department (HSD), which
established four overarching goals aligned with its mission (see Implementation & Evaluation, below):
1. Increase racial equity
2. Increase public awareness about the challenges and opportunities that accompany Seattle’s
aging population
3. Increase social participation
4. Reduce displacement
Age Friendly Seattle accomplishments in 2017 include:
• Housing: Seattle Human Services Department/Aging and Disability Services collaborated with
Seattle Office of Housing and King County Department of Community and Humans Services to
commission a senior housing study and action plan. This interdepartmental and
intergovernmental effort included extensive community engagement and is focused on
affordability and housing stability for older adults aging in community. Office of Housing
programs assisted low-income older adults, both renters and homeowners, through affordable
rental housing, home repair loans and grants, and weatherization services. A two-year
foreclosure prevention pilot program was launched in 2017, and two senior housing projects are
under development, scheduled to open in 2019 and 2020. For more information, see the Seattle
Office of Housing 2017 Annual Investments Report.
• Innovation Fund: The Seattle Human Services Department (HSD) developed an Innovation Fund,
modeled after the successful Neighborhood Matching Fund and Technology Matching Fund, and
intended to test new ideas with a focus on results and racial equity. HSD designated $125,000 of
the total Innovation Fund to support seven projects that advance healthy aging (one of six
departmental impact areas) and align with Age Friendly Seattle goals. Recipients included API
Chaya, Eritrean Association of Greater Seattle, Latino Community Fund of Washington State,
National Asian Pacific Center on Aging (NAPCA), Tilth Alliance, UW Health Promotion Research
Center, and Women United. For more information, visit the Age Friendly Seattle 2017 Highlights.
A celebration featuring the grantees’ projects was held on April 13, 2018.
• No Wrong Door: Seattle Human Services Department/Aging and Disability Services promoted a
“no wrong door” among City employees, who can refer older adults, adults with disabilities,
Age Friendly Seattle Action Plan for 2018–2021 | 13caregivers, family members, and professionals to Community Living Connections for objective,
confidential information about local aging resources and service options.
• Pedestrian safety: Safety is a primary concern for
all Seattle residents. Pedestrian safety for older
adults is now a focus for both Vision Zero and
Pedestrian Master Plan implementation. In April
2017, Pedestrian Master Plan age-friendly scoring
criteria was developed and adopted by the
Pedestrian Advisory Board. Both first and last
mile connections for older adults are considered
when determining priorities for pedestrian
improvements. In 2017, SDOT’s ADA manager Age-friendly Pedestrian Master Plan criteria
established a new Pedestrian Access Advisory
Committee to help address accessibility issues.
• Self-sufficiency: A variety of options to expedite enrollment in the state property tax savings
programs and the City of Seattle’s Utility Discount Program are being explored, including auto-
enrollment. The utility discount is available to income-qualified Seattle City Light and Seattle
Public Utilities customers. Property tax relief is available to income-qualified homeowners via
the Office of the King County Assessor. The Property Tax Reduction Program can save low-
income homeowners age 61+ and homeowners with qualifying disabilities hundreds and even
thousands of dollars each year, depending on their home’s assessed value and their income
level.
• Sidewalk assessment: Seattle Department of Transportation hired 14 college interns to walk
2,300 miles of sidewalks and map conditions—cracks, gaps, obstructions, and features such as
benches and rear bus pads. They observed conditions where people walk that might be
challenging for individuals with vision-impairment or for those navigating in wheelchairs. The
information provides data that can support
prioritization of future sidewalk
improvements. For more information, visit
the SDOT Sidewalk Condition Assessment
Project webpage.
• Equity forums: Age Friendly Seattle
Resolution 31739 called for two equity
forums—one focused on the unique needs
of LGBTQ community members and one
focused on women and optimal aging. These
forums were held on June 3 and November
6, 2017, respectively.
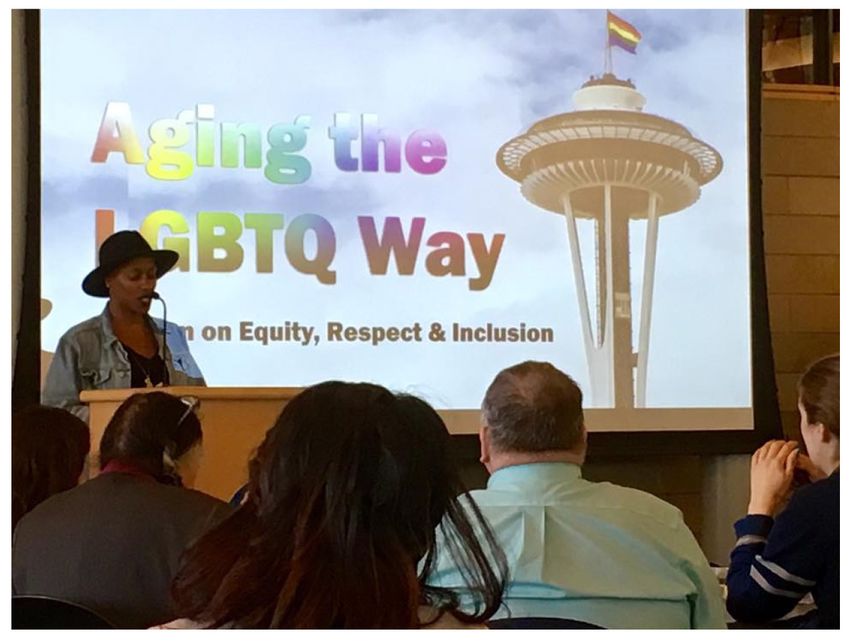
• Hackathon: Seattle IT coordinated A City For
Aging the LGBTQ Way: A Forum on Equity,
All civic technology hackathon on September Respect & Inclusion, an all-day event on
22–23, 2017. Seattle IT received a $10K Saturday, June 3, 2017, drew 130 guests.
AARP Community Challenge Award that
supported the hackathon.
Age Friendly Seattle Action Plan for 2018–2021 | 14Chapter 2: Why This Work is Important
The Age Wave
By mid-century, one in five U.S. residents is
expected to be aged 65 years or over, and the
percentage of older residents will surpass the
percentage of residents under age 15. 2 In King
County, nearly 18% of all residents are age 60 or
older. By 2040, the percent of King County
residents age 60 and older is projected to grow
to nearly 25%.
In King County, the largest increase in 2016
population, compared to 2010, was seen for age
groups: 65–69 years (40%) followed by 70–74
years (37%). In comparison, there was a 9%
increase in overall county population for this
period. 3
The peak cohort of American baby-boomers
turned 60 4 in 2017.
Race and Social Justice
Racial equity is at the forefront of the Human Services Department (HSD) results framework and aligns
with Area Agency on Aging priorities to serve people with the greatest health disparities. An equity focus
is particularly important for work with older adults because the impacts of racism are compounded with
age; older adults of color are disproportionally represented in population indicators such as rates of
chronic disease, homelessness, and reduced longevity. Basic needs are not being met for all older adults:
• Poverty rates are significantly higher for older adults of color than for White older adults (60+).
23% American Indian, Alaska Native; 19% Black; 18% Native Hawaiian, Pacific Islander; 17%
Asian; 17% Hispanic, Latino; 7% White. 5
• Communities of color, ages 60+, are more likely to report being in poorer health than Whites. 6
• While life expectancy has increased for most older adults, not all populations have benefited. 7
• Older adults of color experience a greater housing burden than White older adults. 60% of Black
and 56% of Hispanic elders (ages 65+) spend more than 30% of their income on housing,
compared to 47% of White older adults. 8
• Older adults of color are overrepresented in data on sheltered and unsheltered adults. Although
7% of Seattle seniors are African American, they represent 32% of Seattle’s homeless age 50+. 9
• Older people of color are more likely to lack the social and emotional support they need than
Whites.10
Other concerns include ageism, including age discrimination in the workplace 11; issues of respect and
equity facing members of LGBTQ communities 12; and economic insecurity for older women 13.
Age Friendly Seattle will develop and implement strategies to ensure that the Age Friendly Coalition is
reflective of Seattle’s racial demographics. We will work with partners of power to prioritize action items
that support optimal aging for people of color, immigrants/refugees, English language learners, LGBTQ
community members, and women.
Age Friendly Seattle Action Plan for 2018–2021 | 15Chapter 3: Assessment & Planning
To create this long-range plan, Age Friendly Seattle analyzed demographic data; an AARP age-friendly
communities survey of Seattle residents age 45+; review of the AARP Livability Index, Elder Economic
Security Standard Index for Washington, consumer and volunteerism information, and other City
reports, plus outreach to community stakeholders at forums and events and to City department
stakeholders.
The Age Friendly Coalition described in the Introduction discussed and prioritized many of the
recommendations throughout the past year.
Demographics
Seattle is the largest city in Washington state, the 23rd most populous
29%
city in the United States, and one of the fastest-growing.
Seattle’s population in 2017 is estimated at 713,700. 14 An estimated
12% are age 50–59, 10% are age 60–69, 4% are age 70–79, and 3% are
age 80+, for a total of 29% age 50+ (just over 11%, or 78,500, are age of Seattle’s
65+). 15 population is
age 50+
Countywide, 12.9% of the population is age 65 or older. 16 Seattle’s older
population is growing at a slower rate than that of other parts of King
County, although Seattle and King County have similar percentages of
residents who are age 80+. 17 The City of Seattle anticipates that there
will be more older adults living in the city than there are today, as the
baby boom generation ages. 18
The Public Health—Seattle & King County community health indicators present considerable countywide
age-related data for residents age 65 and older:
• Place of birth: 20.7% foreign-born
• Educational attainment: No high school Seattle Racial Composition
diploma 11.3%; no bachelor’s degree 62%
• Employment status: 5.1% unemployment 2010 Census Estimates
• Median household income: $48,145
• Poverty: 9.3% live with income less than
the Federal Poverty Threshold; 23.9% live
White
with income less than twice the Federal 5%
Poverty Threshold. Poverty differs by 2% Black
gender. 0%
1% Asian
14%
• Housing cost burden: Among Seattle
Native American
residents age 65+, the percentage that
8%
spends greater than 30% of income on Hawaiian/PI
70%
housing costs is high, especially among Other
renters (62.5%) but also homeowners with
a mortgage (32.7%). 2+ Races
Total = 99% due to rounding
According to the American Community Survey,
2011–2013 3 Year Estimate, about 23% of King
County’s age 60+ population are people of color
(four percent higher than in 2011).
Age Friendly Seattle Action Plan for 2018–2021 | 16Life Expectancy
Average life expectancy at birth is 81.7 years in King County (79.4 years
Top 5
for males and 83.7 years for females). The average years of healthy life is
72.4 years (70.1 years for men and 74.8 years for women). 19
The top 10 causes of death in King County are cancer, heart disease,
Alzheimer’s disease, unintentional injury, stroke, chronic lower
respiratory disease, diabetes, suicide, chronic liver disease/cirrhosis, and
causes of death
influenza/pneumonia (in that order). 20 among King County
The top 10 causes of hospitalization for King County residents age 65+ residents age 65+:
are heart disease, unintentional injuries, infectious and parasitic 1. Cancer
diseases, osteoarthritis, cancer and benign tumors, stroke, respiratory
infections, lower GI disorders, endocrine and metabolic diseases, and 2. Heart disease
mental illness (in that order). 21 3. Alzheimer’s
4. Injury
Health Concerns
5. Stroke
Among King County residents age 60 and older, 18.7% report being in
fair or poor health. Seattle neighborhoods that have a lower percentage
of residents in fair or poor health include North Seattle/Shoreline (10.2%), Queen Anne/Magnolia, and
Capitol Hill/Eastlake. Seattle neighborhoods with a higher percentage of residents in fair or poor health
include West Seattle, NE Seattle, Ballard/Green Lake, Downtown/Central Seattle, and Beacon/SE Seattle
(34%).
Specific health concerns among King County residents age 65+ include:
• Weight: 22% are obese and 39% are overweight but not
obese—a total of 61% in this age group.
• Physical activity: 77% do not meet the recommended
amount of physical activity and 21% are sedentary.
61%
• Nutrition: On average, residents age 65+ eat fruit 1.3 times of King County’s
per day and eat vegetables two times each day. Sugar- age 65+
sweetened beverages are typically consumed by 35% in one population is
month’s time. Five percent (5%) report that they sometimes or
often did not have enough food during the past year. Reliance overweight
on the Supplemental Food Nutrition Assistance Program
(SNAP—called Basic Food in Washington state) varies by
geographic area, with more SNAP clients per store in parts of downtown, central, southwest and
southeast Seattle than in the north part of the city.
• Tobacco use: The percentage of all adult cigarette smokers in Seattle ranges from 8 percent
to 24 percent geographically. Among King County residents age 65 or older, six percent (6%) are
smokers, with equal percentages of men and women. One percent of all residents age 65+ are
smokeless tobacco users (e.g., chewing tobacco).
Unintentional Injury & Death
Among King County residents age 65 and older, deaths due to drowning, falls, fire, firearms, motor
vehicle collision, poisoning, and suffocation average 105.8 per 100,000. Among the same population,
hospitalizations due to unintentional injuries average 2165.7 per 100,000.
• Falls: Seven percent (7%) of King County residents age 65–74 and 8% of those age 75+ report
having been injured by a fall in the past three months.
Age Friendly Seattle Action Plan for 2018–2021 | 17• Motor vehicle injury and death: King County residents age 65 and older average 55.6
motor vehicle injury hospitalizations and 10.7 motor vehicle deaths per 100,000.
• Other causes: King County residents age 65 and older average 18.7 suicide deaths, 11.8
firearms-related deaths, and 4.1 poisoning deaths per 100,000.
Alzheimer’s and Related Dementias
Alzheimer’s disease is a critical public health issue. It is the third leading cause of death in King County
(see above) and also the third leading age-adjusted cause of death in Washington state. 22 One in three
older adults dies with Alzheimer’s or another dementia. 23 Deaths from Alzheimer’s disease have
increased significantly (89% between 2000 and 2014), impacting public health through disability and loss
of independence. 24 In Washington state, there are more than 107,000 people living with Alzheimer’s or
other dementias and an estimated 324,000 unpaid family caregivers of persons living with dementia 25.
Nationally, Alzheimer’s and related dementias among African Americans is of concern. Studies show that
African Americans are more likely than the overall population to be diagnosed with Alzheimer’s in the
disease’s later stages or are misdiagnosed due to other illnesses, a lack of awareness, and a lack of
access to appropriate medical care. 26
Caregiver Status
Washington state is home to more than 800,000 27 unpaid (or “informal”) caregivers—family members,
friends, and neighbors who assist with activities of daily living—as well as formal caregivers who are paid
to care for adults.
The economic value of unpaid caregivers exceeds total Medicaid spending. 28 The majority of caregivers
are women. 29 Nationally, the average number of caregiving hours per week is 24.4; however, one in four
caregivers spends 41+ hours/week providing care, and the average duration of a caregiver’s role is four
years (longer for Alzheimer’s care, on average, than for adults with other illnesses), which takes a social,
emotional, and financial toll on families. 30
Nationwide, 78% of family caregivers incurred out-of-pocket costs associated with caregiving in 2016,
spending an average of $6,954 on out-of-pocket costs related to caregiving—nearly 20% of their
income. 31 Those most financially-strained tend to be lower income and non-White/non-Asian. More
than half experience work-related strain (e.g., change of hours and time off). For many, family caregiving
results in lower leisure spending as well as lower retirement savings.
Note: The State of Washington pays for a broad range of day-to-day services and supports needed by
people with long-term conditions, disabilities, and frailty so they can remain in their own homes.
Washington is hailed as the nation’s leader in providing long-term services and supports in AARP’s latest
AARP Long-Term Services & Supports State Scorecard (#1 overall and #5 in family caregiver support,
among the states). Plus, statewide, Washington does it for less—the state ranks 35th in Medicaid per-
capita costs.
Disability
Seattle’s age 65+ population who live with a disability range from 34.7% (ACS) to 41% (BRFSS). The most
common disabilities are ambulatory difficulty, defined as serious difficulty walking or climbing stairs;
independent living difficulty (self-care); hearing difficulty; and cognitive difficulty. Disability is linked to
age, race/ethnicity, gender (women are more likely to report), income, and education. 32
Per the same report, neighborhoods with disproportionately high numbers of residents with disabilities
include:
• Central Seattle: Downtown Commercial Core, Belltown, South Lake Union, First Hill, Pioneer
Square/International District, and Judkins Park
Age Friendly Seattle Action Plan for 2018–2021 | 18• North Seattle: Greenwood/Phinney Ridge, Broadview/Bitterlake, Northgate/Maple Leaf, Cedar
Park/Meadowbrook
• South Seattle: Duwamish/SODO, Georgetown, parts of South Beacon Hill and Columbia City,
High Point, and Roxhill/Westwood
Gender, Age, Race & Poverty Male Female Total
One of the most telling facts about• Older adult Asian and Black/African-American males report lower levels of social/emotional
support than white older adult males.
• Asian older adult females report always/usually getting the social/emotional support they
needed at lower levels than white older adult females. 35
As noted in Life Expectancy, above, women live longer than men on average. As noted in Disability,
above, women are more likely than men to report disability status. As noted in Housing Status & Living
Arrangements, older women are more likely than men to live alone.
Language
Among the residents who are foreign-born, 84% speak a language other than English and 43% speak
English less than “very well.” 36 King County used five different sources to identify the 20 most common
language needs of county residents (all adults). These are organized into three tiers, as follows:
• Tier 1: Spanish
• Tier 2: Vietnamese, Russian, Somali, Chinese, Korean, Ukrainian, Amharic, Punjabi
• Tier 3: Tagalog, Cambodian, Laotian, Japanese, Hindi, Arabic, Farsi, Tigrinya, Oromo, French,
Samoan
King County produced maps for several languages that indicate higher percentages of Spanish, Chinese,
Vietnamese, and African languages within Seattle. 37
LGBTQ
According to a Gallup poll released in March 2015, 4.8% of the Seattle-Tacoma-Bellevue area population
identifies personally as lesbian, gay, bisexual, or transgender (9,450) 38 compared to 4.1% nationwide. 39
In 2013, Seattle overtook San Francisco as the United States city with the most households composed of
gay or lesbian couples (2.6%) and was the only U.S. city with more than 1% of the households being
lesbian couples. 40
Legislation that established full marriage rights for same-sex couples was signed into law on February
13, 2012. Following an unsuccessful legal challenge, same-sex marriage was legally recognized in
Washington state on December 6, 2012. By 2015, there were 4,078 same-sex marriages in the 981xx zip
code area (roughly 2.71% of all married couples). Among major cities, Seattle has the second highest
rate of same-sex female marriages (1.3%) and the fifth highest rate of same-sex male marriages (1.4%). 41
Housing Status & Living Arrangements
Seattle has 296,633 occupied housing units. 42 Seventeen percent (17%) of Seattle’s households include
an individual 65+ years of age. Among Seattle’s nonfamily households (55.1% of all households), 9.3%
are held by an individual age 65+ living alone 43 (31.4% men and 68.6% women 44).
Nationwide, older women are more likely than men to live alone (27% ages 65 to 74, 42% ages 75 to 84,
and 56% ages 85+). Even at age 85+, less than one-third of men live alone. 45
Thirty-eight percent (38%) of Seattle’s “senior households” make less than half the median income.
About 9,000 “senior households” in Seattle pay more than half their income on housing. For the lowest-
income seniors, Social Security makes up over 80% of their income. 46
AARP Age-Friendly Community Survey
In 2017, AARP selected Seattle among 13 communities to receive a comprehensive “livable
communities” phone survey. The Seattle survey of 506 residents was conducted in spring and early
summer 2017. Results were presented to the Age Friendly Task Force (now Coalition) on August 18,
2017 and are available online, including a report, annotation, methodology, and infographic.
Age Friendly Seattle Action Plan for 2018–2021 | 20Demographics of the AARP survey included gender, age, race/ethnicity, and marital, caregiver, and
disability status:
• 48% Male | 52% Female
• 18% age 45–49; 17% age 50–54; 32% age
55–64; 19% age 65–74; 9% age 75–84;
AARP Survey Respondent
and 5% age 85+. Racial Composition
• 76% white/Caucasian; 9% Black; 8%
Asian; 2% Native American/Alaskan
Native; and• 22% said they need to make major repairs,
home modifications, or changes; however,
only 22.5% said their community had very
good/excellent home repair services for low-
income and older adults for projects like roof
or window repairs; and only 31.6% said their
community offered very good/excellent
seasonal services such as lawn work for low-
income and older adults.
• Only one-third of respondents feel that
homes in their communities are built with
things like a no-step entrance, wider
doorways, grab bars in bathrooms, and first
floor bedrooms and bathrooms (21.6% good,
plus 12.7% very good/excellent).
Sidewalks & Streets
Pedestrian safety is a concern for many older adults.
• Only 26.9% of respondents rated their
community’s sidewalks as very
good/excellent for safety, accessibility, and
condition, while 28.4% said very Click on the image above to open a PDF.
good/excellent on a question about street
maintenance.
• 35.6% rated streets and intersections excellent or very good for lighting, accessibility, and
safety. A significant percentage of respondents (34.6%) answered “good,” bringing the total
positive response on this question to 70.2%.
• 29.8% rated audio and visual pedestrian crossings as very good/excellent.
• While 41.6% rated easy-to-read traffic signs as very good/excellent, another 38.6% answered
“good,” bringing the total positive response on this question to 80.2%.
• 30.9% said their community was very good/excellent on providing separate pathways for
bicyclists and pedestrians.
• 28.6% said their community was very good/excellent about enforcing speed limits.
Parks & Outdoor Spaces
Responses to questions about parks, public buildings, and outdoor spaces were generally favorable.
• A large percentage of respondents indicated that parks are well-maintained (83.7% good, very
good, and excellent combined) and safe (37.8% good, plus 36.1% very good/excellent).
• Over half of the respondents indicated that public buildings and spaces, including restrooms, are
accessible to people of different physical abilities (27.7% good, plus 30.6% very good/excellent).
• Over half of the respondents indicated that there were enough benches for resting in parks,
along sidewalks, and around public buildings (25.8% good, plus 30.8% very good/excellent).
Community Mobility
Seattleites are multi-modal—they walk, drive, take the bus, and let others do the driving as well.
Knowledge of special transportation services and of driver education and refresher courses can be
strengthened.
Age Friendly Seattle Action Plan for 2018–2021 | 22• 73.4% of respondents walk in their
community and 81.4% drive. About one-third
(32.4%) have others drive. 29% take taxis.
10.2% use special transportation services for
older adults or persons with disabilities.
62.3% take the bus. Almost one-quarter of
the respondents say they ride a bike (24.2%).
• Responses were overwhelmingly favorable
for accessible and convenient public
transportation (44.6% very good/excellent,
plus 32% good, for a total favorable rating of
76.6%) with similar responses to affordability
(41.1% very good/excellent, plus 35.5% good,
for a total favorable rating of 76.6%). Transit
vehicle maintenance also received favorable
ratings (48% very good/excellent, plus 34.7%
good). Timeliness was also favorable (42%
very good/excellent, plus 30.2% good, for a
total favorable rating of 72.2%). Safety public
transit stops and accessibility for people of
varying physical abilities was favorable
(39.5% very good/excellent, plus 31.5% good,
Click on the image above to open a PDF.
for a total favorable rating of 71%).
• Although 15.8% were not sure, among those
who were aware of special transportation services for people with disabilities and older adults,
38% said very good/excellent and another 30.2% said good, for a total favorable rating of 68.2%.
• Public parking lots and areas, including accessible parking, are thought to be convenient by
about half of the respondents (29.4% very good/excellent, plus 27% good, for a total favorable
rating of 56.4%. Parking rated lower for affordability, with 20.6% saying very good/excellent and
20.7% good (total favorable rating 41.3%).
• Among those who were aware of driver education or refresher courses in Seattle, 15.3% said
they were very good/excellent. Another 25.7% said good, for an overall favorable rating of 41%.
Of concern, 32.1% were unsure courses existed.
Health Care
For the most part, survey respondents like their health care facilities and providers.
• 55.8% of respondents said very good/excellent when asked about maintenance of hospitals and
health care facilities. Another 29.1% said good, for a total favorable rating of 84.9%.
• Generally, emergency care centers are conveniently located—39.9% said very good/excellent,
and 32.3% said good, for a total favorable rating of 72.2%.
• Seattle’s health care professionals are well respected, rated very good/excellent by 58.8% of
respondents. 23.8% said good, bringing the total favorable rating to 82.6%.
• Although 29% of respondents were unsure how to rate Seattle for health care professionals’
ability to speak different languages, 33.5% rated them very good/excellent and another 22.6%
said good, bringing the total favorable rating to 56.1%.
• Hospital and clinic staffs in Seattle receive favorable ratings—57.8% respondents said very
good/excellent, and 25.9% said good, for a total favorable rating of 83.7%.
• Hospital and clinic answering services are thought to be very good/excellent by 38.7% of
respondents. Another 28% said good, for a total favorable rating of 66.7%.
Age Friendly Seattle Action Plan for 2018–2021 | 23Home Care & Community Services
Knowledge of home care services is limited among Seattle residents:
• Nearly one-third of respondents (32.1%) were unsure whether Seattle had well-trained certified
home health care providers. 30.4% rated home health care providers as very good/excellent,
and 22% rated them good, for a total favorable rating of 52.4%. On affordability, 19.9% said very
good/excellent and 21% said good, for a total favorable rating of 40.9%.
• Over one-third of respondents (33.8%) were unsure whether Seattle has affordable home care
services, including personal care and housekeeping. 16% gave a very good/excellent rating to
home care services, while 21.6% said good, for a total favorable rating of 37.6%.
• On conveniently located health and social services, 28.8% said very good/excellent, and 28.3%
said good (total 57.1%).
• Knowledge of a service that helps people easily access aging, health, and supportive services
was limited (29.7% were unsure); however, 49.9% gave favorable ratings (good/very
good/excellent).
Social Participation
Social contact is vital to longevity and quality of life. While social
16.5%
participation in Seattle is strong for some, there are many at risk of
social isolation, some having little contact with others and some having
no knowledge of activities for older adults.
• 70.4% of respondents have contact with family, friends, or of survey
neighbors every day or several times a week. Another 12.9% respondents have
engage with family, friends, or neighbors once a week. Of
concern, 16.5% of respondents have social contact every two to contact with others
< once
three weeks or less often.
• More than one-quarter of respondents (25.3%) said activities
geared specifically towards older adults are very good/excellent.
a week
Another 28% said good, for an overall favorable rating of 53.3%.
Of concern, 20.7% were unsure if Seattle had activities geared
specifically towards older adults. Just over half (53.6%) felt
activities were affordable.
• 27.6% of respondents said Seattle had very good/excellent
affordable health and wellness programs and classes. Another 28.1% said good, for a total
favorable rating of 55.7%. Notably, 21.4% said they were unsure. Similar ratings were given for
affordable fitness activities specifically geared for older adults—27.6% very good/excellent, plus
24% good, for a total favorable rating of 51.6%; however, 21.1% were unsure.
• 28.6% of respondents felt that Seattle had very good/excellent activities that involve both
younger and older people. Another 26.7% said they were good, for an overall favorable rating of
55.3%. Of concern, 18% were unsure if there were activities that involve younger and older
people. Results of a related question about school events and activities that involve older adults
were 17.6% very good/excellent, plus 20% good, for an overall favorable rating of 37.6%. Of
concern, 30% of respondents were unsure such activities existed and 6.2% said these activities
do not exist.
• Seattle rates well on cultural activities for diverse populations, with 68.8% favorable rating
(good, very good, or excellent).
• Seattle rates well for lifelong learning opportunities, with 40.3% saying that education classes or
social clubs to pursue new interests, hobbies, or passions are very good/excellent. Another
27.4% said good, for an overall favorable rating of 67.7%.
Age Friendly Seattle Action Plan for 2018–2021 | 24• A large percentage of respondents (72.2%) said that conveniently-located entertainment venues
in Seattle are good, very good, or excellent.
Volunteering & Civic Participation
Although Seattle rated favorably among survey respondents on questions about volunteerism, there
appears to be a gap in knowledge—significant percentages of people are unaware of opportunities or
how to find them.
• A majority (64.3%) rated the range of volunteer activities available in Seattle as good, very good,
or excellent. Of concern, 14.1% were unsure if Seattle had a range of volunteer activities to
choose from. A related question about volunteer training opportunities indicated that nearly
one-third of respondents (30.5%) were unsure that training opportunities exist.
• A majority (56.2%) gave favorable responses to a question about opportunities for older adults
to participate in decision-making bodies (e.g., community councils or committees). Of concern,
18.2% of respondents were unsure.
• 55.5% of respondents said that information about local volunteer opportunities is easy to find
(good, very good, or excellent). Of concern, 17.6% were unsure.
• 17.9% of respondents said very good/excellent when asked about transportation to and from
volunteer activities for those who need it. Another 21.1% said good, for a total favorable rating
of 39%. Of concern, another third (32.7%) were unsure if transportation was available.
• 27% of respondents rated Seattle’s neighborhood watch programs as very good/excellent. An
additional 26.9% rated them as good, bringing the favorable rating to a total of 53.9%.
Job Opportunities
Opportunities for mature jobseekers to find work that meets their needs and get training appear to be
limited.
• 11.5% of respondents said Seattle has a very good/excellent range of flexible job opportunities
for older adults. Another 22.2% said good, for a total favorable rating of 33.7%. Of concern,
36.2% of respondents said poor or fair, and 26.4% were unsure. A related question about job
training opportunities received similar scores—13.9% said very good/excellent, while 19.7% said
good, for a total favorable rating of 33.6%. 31.1% said fair or poor, and 30.3% were unsure.
• 15.2% of respondents said very good/excellent on a question about jobs that are adapted to
meet the needs of people with disabilities. Another 23% said good, for a total favorable rating of
38.2%. Another 33.3% said fair or poor, and 25.2% were unsure.
• 15.9% of respondents said that policies that ensure older adults can continue to have equal
opportunity to work for as long as they want or need to, regardless of age, were excellent or
very good. Another 23.7% said good, for a total favorable rating of 39.6%. Poor and fair ratings
received 31.5% and 25.1% were unsure.
Community Information
Survey respondents gave high marks to the availability of computers and Internet in public places.
Although Seattle rated favorably among survey respondents on questions about access to information,
there is some uncertainty, particularly regarding information for people who are homebound.
• 24.9% rated their access to community information in one central source as very
good/excellent. Another 28.6% said good, for a total favorable rating of 53.5%. Of concern,
17.7% were unsure.
• A question about clearly displayed printed community information with large lettering received
17.5% very good/excellent ratings, plus 25.9% good ratings. Of concern, 17.4% were unsure.
Age Friendly Seattle Action Plan for 2018–2021 | 25You can also read