Exploring nature-based solutions - The role of green infrastructure in mitigating the impacts of weather- and climate change-related natural ...
←
→
Page content transcription
If your browser does not render page correctly, please read the page content below
EEA Technical report    No 12/2015

              Exploring nature-based solutions
The role of green infrastructure in mitigating the impacts of
      weather- and climate change-related natural hazards

                                                           ISSN 1725-2237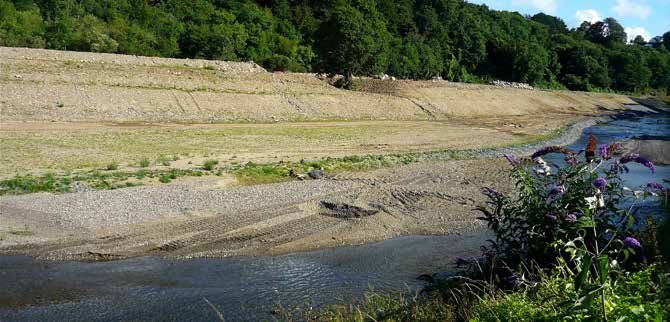
EEA Technical report   No 12/2015

              Exploring nature-based solutions
The role of green infrastructure in mitigating the impacts of
      weather- and climate change-related natural hazards
Cover design: EEA
Cover photo: © Elzélina Van Melle and EVM Landskab
Layout: EEA/Pia Schmidt

Legal notice
The contents of this publication do not necessarily reflect the official opinions of the European Commission or other
institutions of the European Union. Neither the European Environment Agency nor any person or company acting on
behalf of the Agency is responsible for the use that may be made of the information contained in this report.

Copyright notice
© European Environment Agency, 2015
Reproduction is authorised provided the source is acknowledged.

More information on the European Union is available on the Internet (http://europa.eu).

Luxembourg: Publications Office of the European Union, 2015

ISBN 978-92-9213-693-2
ISSN 1725-2237
doi:10.2800/946387

European Environment Agency
Kongens Nytorv 6
1050 Copenhagen K
Denmark

Tel.: +45 33 36 71 00
Web: eea.europa.eu
Enquiries: eea.europa.eu/enquiries

Contents

Contents

Acknowledgements..................................................................................................................... 4

Glossary......................................................................................................................................... 5

Definition of terms...................................................................................................................... 6

Executive summary..................................................................................................................... 8

1 Introduction and objectives................................................................................................ 12

2 How to read this report....................................................................................................... 14

3 Methodology......................................................................................................................... 15
     3.1 The underlying logic...............................................................................................................15
     3.2 Selection of ecosystem services...........................................................................................15
     3.3 Methodological approach.....................................................................................................16

4 Results................................................................................................................................... 20
     4.1 Mass stabilisation — landslides............................................................................................20
     4.2 Mass stabilisation — avalanches..........................................................................................27
     4.3 Flood protection..................................................................................................................... 33
     4.4 Storm surge protection.........................................................................................................42
     4.5 Carbon stabilisation by ecosystems.....................................................................................48

References.................................................................................................................................. 55

                                                                                                Exploring nature-based solutions                      3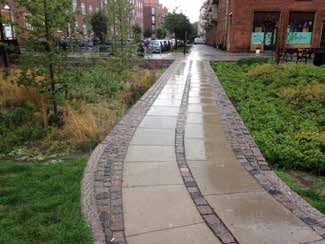
Acknowledgements

    Acknowledgements

    This report has been managed and prepared by the         •   Jelena Milos (DG Climate Action)
    European Environment Agency (EEA) (Gorm Dige) and
    the European Topic Centre on Urban, Land and Soil        •   Joachim Maes (Joint Research Centre (JRC))
    systems (ETC/ULS) (Stefan Kleeschulte, Christopher
    Philipsen, Stefan Schindler and Gabriele Sonderegger).   •   Camino Liquete (JRC)
    Comments and input were also provided by
    the European Topic Centre on Climate Change              •   Marie Cugny-Seguin (EEA)
    Impacts, Vulnerability and Adaptation (ETC/CCA)
    (Jaroslav Mysiak).                                       •   Blaz Kurnik (EEA)

    The EEA would like to acknowledge and thank the          •   Hans-Martin Füssel (EEA)
    following persons for having reviewed and provided
    input on the draft report:                               •   Andre Jol (EEA)

    •   Marco Fritz (Directorate-General for                 •   Markus Erhard (EEA)
        the Environment (DG Environment))
                                                             •   Andrus Meiner (EEA)
    •   Alfonso Gutierrez-Teira (DG Climate Action)
                                                             •   Ronan Uhel (EEA).
    •   Juan Perez-Lorenzo (DG Climate Action)

    •   Sandro Nieto-Silleras (DG Climate Action)

4   Exploring nature-based solutions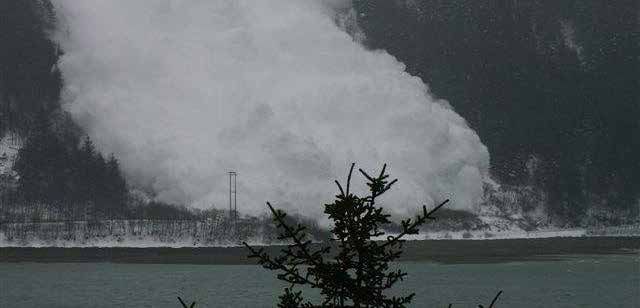
Glossary

Glossary

BGR	Federal Institute for Geosciences and         GI          Green infrastructure
     Natural Resources
                                                   GIO         GMES/Copernicus initial operations
CHF        Swiss franc
                                                   GIS         Geographic Information System
CICES	Common International Classification
       of Ecosystem Services                       GISCO	Geographical Information System at the
                                                          Commission
CIF        Common Implementation Framework
                                                   GLS         Global Land Survey
CLC        Corine Land Cover
                                                   GTOPO30     Global 30 Arc-Second Elevation
DEM        digital elevation model
                                                   HIRHAM	Regional atmospheric climate model
DG         Directorate-General                             based on a subset of the HIRLAM (High
                                                           Resolution Limited Area Model) and
DLR        German Aerospace Center                         ECHAM models (acronym combined from
                                                           European Centre for Medium-Range
DRR        Disaster risk reduction                         Weather Forecasts & Hamburg)

EAD        Expected annual damage                  IPCC	Intergovernmental Panel on Climate
                                                         Change
EAP        Environment Action Programme
                                                   JRC         Joint Research Centre
ECU        European currency unit
                                                   LUCAS       Land use/cover area frame survey
EEA        European Environment Agency
                                                   MAES	Mapping and assessment of ecosystems
ELSUS      European landslide susceptibility map         and their services

EM-DAT     The International Disaster Database     NGO         Non-governmental organisation

EPA        Environmental Protection Agency         NUTS	Nomenclature of Territorial Units for
                                                         Statistics
ERDF       European Regional Development Fund
                                                   SPA         Special Protected Area
ES         Ecosystem service(s)
                                                   UNISDR	United Nations Office for Disaster Risk
ESPON	European Spatial Planning Observation               Reduction
       Network
                                                   USD         US dollar
EU         European Union
                                                   USGS        US Geological Survey
EUR        euro

                                                                 Exploring nature-based solutions          5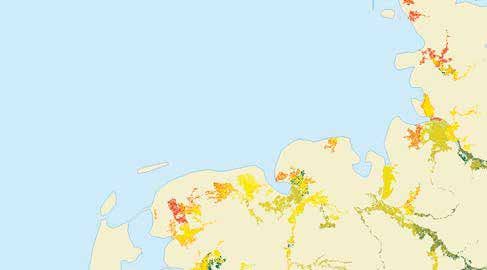
Definition of terms

    Definition of terms

    Green infrastructure (GI)                                      Hazard, vulnerability and risk

    The 2013 European Commission Communication                     In this report, the terms vulnerability and risk are
    Green Infrastructure (GI) — Enhancing Europe's Natural         used in the same way as in the IPCC's Managing the
    Capital (EC, 2013a) defines GI as a 'strategically planned     Risks of Extreme Events and Disasters to Advance Climate
    network of natural and semi-natural areas with other           Change Adaptation (IPCC, 2012) and the EEA's Climate
    environmental features designed and managed to                 change, impacts and vulnerability in Europe (EEA, 2012a).
    deliver a wide range of ecosystem services'. Emphasis
    is placed on the ecosystem services provided and on            The disaster risk community distinguishes between the
    purposeful land designation and management, with the           following two factors that determine risk.
    scope of delivering a range of environmental benefits,
    including maintaining and improving ecological                 1. Hazard, meaning 'potential occurrence of a natural
    functions. 'Smart' conservation addresses impacts of           or human-induced physical event that may cause loss
    urban sprawl and fragmentation, builds connectivity in         of life, injury or other health impacts, as well as damage
    ecological networks and promotes green spaces in the           and loss to property, infrastructure, livelihoods, service
    urban environment (including through adaptation and            provision, and environmental resources' (IPCC, 2012).
    retrofitting).                                                 Hazard is characterised by location, intensity, frequency
                                                                   and probability.

    Mitigation and adaptation                                      2. Vulnerability refers to the 'characteristics and
                                                                   circumstances of a community, system or asset that
    The term 'mitigation' (of disaster risk and disasters)         make it susceptible to the damaging effects of a hazard'
    means 'lessening of the potential adverse impacts              (UNISDR, 2009), or 'the propensity or predisposition
    of physical hazards (including those that are human            to be adversely affected' (IPCC, 2012). In this report,
    induced) through actions that reduce hazard, exposure,         vulnerability encompasses the capacity to anticipate,
    and vulnerability' (IPCC, 2012). Risk mitigation in this       cope with, resist and recover from the adverse effects
    context equates to disaster risk reduction (DRR), and          of physical events (see Figure 0.1).
    the terms are used interchangeably. In the climate
    change context, risk mitigation is one of the 'adaptation      In the current study, 'hazard' is estimated by the
    measures'.                                                     likelihood or propensity of occurrence of a natural

    Figure 0.1       Concepts of hazard, ecosystem capacity and risk in developing a GI network

            Hazard potential

                                                           GI elements                              Risk
              Vulnerability

             Susceptibility

               Ecosystem                                    Demand
            (coping) capacity                          (exposed elements)

6   Exploring nature-based solutions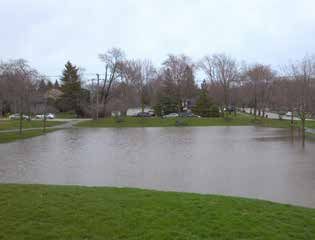
Definition of terms

hazard, while 'vulnerability' of a region is determined    into 'GI elements'), and the demand for such a
by the level of susceptibility (level of exposure to one   service caused by the presence of exposed elements
or more stressors) and the capacity of the ecosystem       (e.g. population and infrastructure). In other words,
to deliver services that can mitigate (cope with) the      the same hazard and ecosystem service capacity will
hazard. Potential GI elements are identified by the        be judged differently, depending on whether they are
combination of an existing hazard in a given region        located in a densely populated or a remote area. Risk is
and the presence of ecosystems supplying ecosystem         a dangerous phenomenon, substance, human activity
services that mitigate the impact of the hazard. Risk      or condition that may cause loss of life, injury or other
is then defined as the presence of a specific natural      health impacts, property damage, loss of livelihoods
hazard, exacerbated by the lack of ecosystem services      and services, social and economic disruption or
to mitigate the hazard (these two aspects are combined     environmental damage.

                                                                            Exploring nature-based solutions           7
Executive summary
Executive summary
Natural resource scarcity, climate change impacts, measures can act as natural water filtration plants, as
continued employment crises, public budget debts and an alternative to more conventional water treatment
economic recovery plans are some of the challenges technologies. As such, they are a form of GI that can
that governments in Europe currently face. Moreover, serve similar functions to grey infrastructure.
Member States in the European Union (EU) need to
continue building or rebuilding roads, sewage systems, For example, pre-existing development of concrete
levees, etc. (also known as grey infrastructure). pipes, sewers and particularly of paved surfaces
Despite being essential for economic growth, these in cities is making it difficult for storm water to be
infrastructure investments are significant and put absorbed where it falls. It is becoming increasingly
heavy burdens on governments. But as governments evident that our concrete systems are not always able
debate the future of economic growth and sustainable to accommodate all the storm water that comes their
development, there is one infrastructure solution that way. This can result in flooding, with tremendous
can provide a good return on investment: nature. economic and social consequences. Recent work on
GI has highlighted the important role ecosystems play
In the past, governments and other investors in providing benefits to conventional infrastructure
automatically looked to expensive traditional grey solutions. Green areas in cities, for instance, can
infrastructure solutions in order to solve problems. function as storm-water retention areas and mitigate
Now, new and in many cases cheaper approaches are the load on conventional sewage systems (see
emerging that use natural processes or GI rather than Photo ES.1 and ES.2).
concrete and steel. Forests, wetlands and other natural
ecosystems are not commonly considered forms of Research also shows that in many cases, GI solutions
infrastructure. But they are. Forests, for example, can are less expensive than grey infrastructure, and provide
prevent pollutants from entering streams that supply a wide array of co-benefits for local economies, the
fresh water to cities and businesses downstream. social fabric and the broader environment. This should
Upstream landscape conservation and restoration be of particular interest to decision-makers, as GI
Box ES.1 What is green infrastructure?
The 2013 European Commission Communication
Green Infrastructure (EC, 2013a) defines GI as
a strategically planned network of natural and
semi‑natural areas with other environmental features
designed and managed so as to deliver a wide range
of ecosystem services. It incorporates green spaces
(or blue if aquatic ecosystems are involved) and other
physical features in terrestrial (including coastal)
and marine areas. On land, GI is present in rural and
urban settings.
Photo ES.1 Water catchment
© Jenny Levine
8 Exploring nature-based solutionsExecutive summary
documents and/or strategies to actively encourage
investments in GI as an essential part of sustainable
spatial planning. GI is increasingly considered a 'life
support system' able to deliver multiple environmental
functions, with a key role in adapting to and mitigating
climate change.
The importance of GI is also recognised in the EU policy
domain, as the examples below show.
• The Seventh Environment Action Programme
(7EAP) (Decision No 1386/2013/EU) measures to
enhance ecological and climate resilience, such as
ecosystem restoration and GI, can have important
socioeconomic benefits, including for public health.
Photo ES.2 xample of urban green space functioning as water
E
retention areas • The EU Biodiversity Strategy (COM(2011) 244 final)
© Elzélina Van Melle and EVM Landskab calls for a restoration of at least 15% of degraded
ecosystems in the EU and aims to expand the use
of GI. In addition, the European Commission will
can achieve significant cost savings. If GI can provide continue mapping and assessment work of GI in the
comparable benefits to grey infrastructure at reduced context of the Biodiversity Strategy.
costs in the long term, then it makes financial sense to
invest in the conservation, sustainable management, • The 2013 European Commission Strategy
and/or restoration of natural ecosystems in order to on Green Infrastructure (COM/2013/0249
meet development goals. final) (EC, 2013a) underlines that GI can make
a significant contribution to the effective
However, making the financial case for GI is implementation of all policies where some or all of
complicated: it can be difficult to make a valid the desired objectives can be achieved in whole or in
comparison between GI and grey infrastructure with part through nature-based solutions.
a focus on incurred expenses and benefits. We know
that GI solutions often provide multiple benefits (noise • The Regional Policy 2014–2020 continues to
reduction, increased carbon sequestration, recreation support nature and GI through financial instruments
opportunities, clean water, etc.) that are often cheaper such as the European Regional Development Fund
and more robust, not to mention more sustainable, and the Cohesion Fund, which contribute to several
both economically and socially (EEA, 2014). These policy objectives and deliver multiple benefits, in
multiple benefits should be captured in the equation as particular socio-economic development (IEEP and
having positive spin-off effects, while grey infrastructure Milieu, 2013).
solutions typically only fulfil single functions such as
drainage or transport. • The Water Framework Directive (2000/60/EC),
Nitrates Directive (91/676/EEC) and the Floods
For instance, instead of automatically defaulting to Directive (COM(2006)15) offer GI-related
grey solutions like dikes and pipes for flooding, we opportunities (for instance, by supporting actions
first should look at restoring floodplains or wetlands. to put in place GI to improve soil retention, act as
Rather than building sea walls, we need to think about buffer strips between agricultural production and
conserving sand banks. And before building more water water sources, and provide water storage during
filtration systems, we might first consider rehabilitating flood events) (EEA, 2015).
upstream watersheds. Planners should compare green
to grey and identify new opportunities for investing • The EU Strategy on Adaptation to Climate
in nature, including a combination of green and grey Change (EC, 2013b) aims to make Europe more
approaches when nature-based solutions alone are climate resilient by ensuring the full mobilisation of
insufficient. As planners explore how to accommodate GI- or ecosystem-based approaches to adaptation.
infrastructure demands in the future, the lesson is clear:
think about green before investing in grey. GI solutions that boost disaster resilience are also an
integral part of EU policy on disaster risk management.
Many countries in the EU have already taken this Climate change and infrastructure development make
on board and have prepared national guidance disaster-prone areas more vulnerable to extreme
Exploring nature-based solutions 9Executive summary
weather events and natural disasters such as floods, The study identifies two different levels of lack of GI:
landslides, avalanches, forest fires, storms and wave
surges that cause loss of life and result in billions of • areas with no or a very low capacity of relevant
euros of damage and insurance costs each year in ecosystem services for the mitigation of a given
the EU. natural hazard (mapped in red);
The impacts of such events on human society and the • areas with existing ecosystem services that are not
environment can often be reduced using GI solutions, able to function at full capacity (mapped in orange).
as mentioned above. Functional flood plains, riparian
woodland and protection forests in mountainous areas, For each of the natural hazards assessed in this study,
barrier beaches and coastal wetlands can be set up an individual European-scale map of potential GI
in combination with disaster reduction infrastructure elements and restoration areas has been produced.
such as river protection works. Investment in For potential restoration areas, stakeholders are
ecosystem‑based DRR and GI can thus provide many requested to take a decision on which areas are to
benefits for innovative risk management approaches, take priority, i.e. whether to restore the partially
adapting to climate change-related risks, maintaining functioning ones or the non-functioning ones. For
sustainable livelihoods and fostering green growth. example, restoring areas with no relevant ecosystem
Cities and local authorities are the first to deal with services for the mitigation of a given natural hazard
the immediate consequences of such disasters. They (mapped in red) might reduce hazard considerably
therefore play a critical role in implementing prevention if they are located in an area where the hazard is
measures like GI. present.
To address some of these challenges and information These decisions might be further supported
gaps, the current report tries to demonstrate the by considering the demands of population and
role of GI for mitigating vulnerability to weather and infrastructure for protection by GI, and an additional
climate variability-related natural hazards at European series of maps has been produced for that purpose
level. It proposes a simple, practical methodology for at the Nomenclature of Territorial Units for Statistics
screening (rather than assessing) ecosystem services in (NUTS) 2 level. These maps define 'high-risk areas'
areas where GI may contribute to reducing current (or at locations where high demand matches with low/
future) weather- and climate-related natural hazards. medium-quality GI networks, and where medium
The report addresses landslides, avalanches, floods, demand matches with low-quality GI networks. Such
soil erosion, storm surges and carbon stabilisation by areas are potential priority areas for GI restoration.
ecosystems. The resulting 'medium risk area', however, might imply
three possible situations: (i) high demand matching
As mentioned in Box ES.1, GI is a strategically planned high-quality GI implies priority areas for conservation
network of high-quality green spaces, which can be of ecosystems; (ii) medium demand matching
approached and defined from different perspectives. medium‑quality GI implies conserving existing GI and
In this study, GI is defined by its capacity to provide at the same time restoring missing GI, and (iii) low
a relevant number of ecosystem services. The maps demand matching low-quality GI implies that in specific
presented in this study provide an overview of where areas, hazard is relevant and GI protection is low, but
specific weather- and climate-related natural hazards the overall risk is only medium, due to the current
are likely to occur, where well-functioning ecosystem comparably low level of demand.
services exist which can support DRR and climate
adaptation so as to lessen the impacts of natural If risk and demand are high, and ecosystem
hazards (e.g. floods and landslides), and where the service capacity for risk mitigation is low, then
provision of ecosystem services may be improved. ecosystem restoration clearly presents a significant
and cost-efficient improvement for disaster risk
Regions with well-functioning ecosystem services mitigation. However, it should be noted that besides
(depicted in green in the maps) are considered to be anthropogenic reasons, there are often also natural
part of a GI network that has the main role of mitigating reasons explaining why a specific area cannot supply
the impacts of climate change natural hazards and/or relevant ecosystem services.
supporting adaptation to climate change impacts. Those
regions exhibiting a lack of mitigating ecosystem services The ecosystem services (according to the Common
should be considered priority areas for investment International Classification of Ecosystem Services,
in or restoration of the required services, as there is (CICES, 2015)) classification) were selected based
a demand for them expressed by the presence of a on their potential ability to offer protection against
natural hazard and assets at risk. extreme climate-related events:
10 Exploring nature-based solutionsExecutive summary
• mass stabilisation — landslides data. The results of the different networks (with
different purposes) could be combined into a real
• mass stabilisation — avalanches multifunctional GI network, i.e. a combination
of different GI networks can serve a variety of
• flood protection environmental functions.
• storm surge protection There are both general and specific limitations inherent
in the current work, as described below.
• global climate regulation.
(1) General limitations
The results of the assessment show that it is possible:
(a) The quality of the input data, although generally
• to use ecosystem services to assess GI; sufficient, might be regionally different for some of
the presented assessments. This can cause biases in
• to identify potential areas for conservation and the pattern of the result maps.
restoration;
(b) The selection of climate change-related impacts
• to identify GI elements as an output of the modelling. (natural hazards) that can be moderated by the
presence of specific ecosystems and their services.
As is to be expected, multifunctional forest ecosystems The analysis worked with selected natural hazards
provide several services addressing the mitigation of which themselves can be moderated by ecosystem
most natural hazards. Restoration areas, on the other services, i.e. if there were no ecosystem services
hand, are often more hazard specific. A central aspect to moderate the hazard, then it was not selected
of the study is the coupling of ecosystem services with (e.g. forest fire).
their demand side in order to identify areas where these
services are needed most. (c) The capacity of ecosystems to deliver (good-quality)
services is estimated by the condition of the
The emerging pattern shows that high-risk areas for ecosystems.
landslides mainly occur in hilly to mountainous areas
of the Mediterranean and the British Islands. For (d) Some climate change-related impacts are local
avalanches, fine-scale high-risk areas could be defined phenomena which are addressed at European/
for the Alpine region. Flood risk at NUTS 2 level was landscape scale.
greatest in a central European region between western
Germany and the Danube Delta, in eastern England, (e) The coarse resolution of three categories for the
and in parts of central Spain, while storm surge risk was levels of hazard, vulnerability, GI elements and
highest at the Northern Sea coasts. The potential GI demand might cause rather different areas to
network for contributions to global climate regulation fall under the same category, while close to the
is mainly defined by a belt of forest spanning northern categories threshold, small differences might cause a
Iberia to southern France, the southern Alps and parts jump to the next category.
of the forests on the Carpathians and the Rhodope
Mountains. (f) Sometimes, the mitigating effect of ecosystem
services might be a local phenomenon for which
For future research, it is proposed that the outlook no data are available, e.g. the presence of hedges
of GI be expanded: from being based on ecosystem and tree rows in agricultural areas to combat (wind)
services alone, to include other topics such as erosion.
protected lands, sensitive areas or natural assets as
a cornerstone of GI networks to be developed. This (2) Specific limitations
obviously depends on the underlying data that have
been used to define the GI network. While this study (a) Avalanches are particularly local phenomena, and are
uses ecosystem services, others have used Natura 2000 scarcely assessable at European scale (not in terms
areas and their connectivity, for instance. Moreover, of their risk nor their impact). Due to the coarse
the selection of ecosystem services influences the resolution of the underlying digital terrain model, the
outcome of the GI network. Individual GI networks threshold for avalanche-endangered slopes needed
may be developed to support flood protection, water to be changed with respect to standard literature
and air quality, biodiversity and migration of species, values (15° instead of 30°), in order to generate
climate adaptation, etc. All of these GI networks could relevant risk zones (otherwise, only a few, scattered
be 'calculated individually' with the best available pixels are defined as endangered).
Exploring nature-based solutions 11Introduction and objectives
1 Introduction and objectives
As a follow-up to earlier European Environment explicit data centred on the physical capacity of
Agency (EEA) research into the role of GI networks ecosystems to deliver services that can mitigate natural
and the multiple ecosystem services provided hazard risks. Places prone to selected natural hazards
(EEA, 2011a and 2014), the objective of this study is have been identified and prioritised according to the
to explore and demonstrate how GI contributes to 'demand' for risk mitigation services.
mitigating adverse effects of extreme weather- and
climate‑related events. Weather- and climate-related The report only considers aspects of GI relevant
hazards including extreme precipitation, floods, wet for protection against extreme climate- and
mass movement and storm surges are among the weather‑related events; individual GI elements provide
costliest and deadliest natural hazards in Europe and other services to society (recreation, timber production
globally (EEA, 2011b; UNISDR, 2015). Human‑induced or filtration of pollutants, etc.), which are not considered
climate change, in combination with other in this study.
anthropogenic pressures such as land use conversion,
has altered the functions of ecological systems, and has The report concentrates on present-day exposure to
consequently modified the flow of ecosystem services natural hazards, and does not assess impacts of future
in terms of their scale, timing and location (Nelson climate change on the frequency and intensity of such
et al., 2013). Future climate change will very likely hazards. The role of GI in mitigating climate change
further exacerbate these effects (IPCC, 2014). impacts is further illustrated by literature reviews of
local case studies which describe examples of using
This report focuses on certain types of extreme GI to mitigate climate change-related natural hazards.
events and natural hazards at European scale that will The ecosystem services reviewed in the study are those
be very likely amplified by ongoing climate change, that reduce the impact of climate variability (now and
i.e. landslides, avalanches, floods and storm surges. in future). As a result of climate change, the variability
In addition, the report also touches upon the GI and may become more pronounced and the likelihood of
ecosystem services contributing to global climate extremes may increase. This can be partially offset by
regulation. The analysis is carried out using spatially ecosystem services.
Box 1.1 The multifunctionality of GI
One of the key attractions of GI is its multifunctionality, i.e. the fact it can perform a number of functions and provide several
benefits for the same spatial area. These functions could be environmental (such as conserving biodiversity or adapting
to climate change), social (e.g. providing water drainage or green space) or economic (supplying jobs and raising property
prices, for instance). A good example of this multifunctionality is provided by the urban GI of a green roof, which reduces
storm water run-off and the pollutant load of the water, while also decreasing the urban heat effect, improving the insulation
of the building and providing a habitat for a variety of species.
It is the multifunctionality of GI that sets it apart from the majority of its grey counterparts, which tend to be designed to
perform one function alone (such as transport or drainage) without contributing to the broader environmental, social and
economic context (Naumann et al., 2010). As such, GI has the potential to offer win-win, or 'no regrets' solutions by tackling
several problems and unlocking the greatest number of benefits, within a financially viable framework. GI can therefore
serve as a highly valuable policy tool for promoting sustainable development and smart growth, by meeting multiple
objectives and addressing various demands and pressures (EEA, 2011a).
Source: EC, 2012, 'The Multifunctionality of Green Infrastructure', Science for Environment Policy, Indepth Reports, March 2012,
DG Environment (http://ec.europa.eu/environment/nature/ecosystems/docs/Green_Infrastructure.pdf) accessed 13 July 2015.
12 Exploring nature-based solutionsIntroduction and objectives
The present report forms part of the efforts exploring have been taken from published sources and reclassified
how to develop a GI network at European level, using for the purpose of the analysis. The choices made
existing European-level data. Most of the input data for throughout the data processing and analysis are based
the Geographic Information System (GIS) processing on expert opinions and are open to public scrutiny.
Exploring nature-based solutions 13How to read this report
2 How to read this report
A methodological section describes the specific Each topic section is divided into three subsections, as
structure of the study and provides a descriptive follows.
summary of the procedures used. It is broken down
into three subsections: one explaining the underlying • Background — literature review. This subsection
logic of the analysis, including the background presents a brief yet informative state-of-the-art
assumptions; a second part focusing on the selection literature review. It highlights past studies related to
of ecosystem services and the related data sets; and the issue and provides additional information on the
a final subsection discussing the methodological topic.
approach used for this study (based on a previous
assessment carried out by the EEA (EEA, 2014)). • Assessment and results. This subsection presents
the assessment of the topic and the results; much
The core part of the report (Chapter 3) has been of the information is in the form of maps for each
organised so as to allow miscellaneous readers to topic or ecosystem service. The points illustrated
pick and choose their reading material. A guiding throughout the sections are based on the processing
principle in arranging the material has been to of different input data sets, to allow readers to obtain
focus on the need of the main target audience, information on the topic in a spatially explicit manner.
i.e. policymakers, non-governmental organisations
(NGOs) and the research community. It covers • Input data sets. This subsection outlines and
five similarly structured topic sections designed to describes the data sets used, including their
communicate the findings uniformly. This format specifications. As mentioned in the Executive
allows the report to be read at different levels; each summary, the quality of the input data is adequate
section may also be read independently of the other overall but might differ across Member States for
topic sections. some of the presented assessments. This can cause
biases in the pattern of the result maps.
14 Exploring nature-based solutionsMethodology
3 Methodology
3.1 The underlying logic time; any improvements on the input data side
will doubtless contribute to a refinement of the
The 2014 EEA Technical Report Spatial analysis of resulting network of GI elements;
green infrastructure in Europe (EEA, 2014) proposed
a simple, replicable methodology for GI elements at • topics such as sustainable flow of ecosystem
pan-European level. It illustrated a spatially explicit services (e.g. the maximum level of delivery at which
methodology for defining priority GI areas and for ecosystems are not degraded), trends or future
distinguishing potential conservation and restoration scenarios, and human-made structures (protection
areas. GI is evaluated as an ecological and spatial works) are not taken into account in this study.
concept that aims to promote ecosystem health and
resilience, contribute to biodiversity conservation, 3.2 Selection of ecosystem services
and at the same time, provide benefits to humans,
promoting the multiple delivery of ecosystem The identification and mapping of relevant GI
services (EC, 2013a). The multifunctionality of GI is elements is based on an integrated analysis of
addressed by considering multiple ecosystem services. multiple ecosystem services. From this perspective,
and following the conceptual framework of the
The underlying logic of the present study is based MAES (EC, 2014) Working Group, three aspects were
on several assumptions and findings from the considered: the natural capacity to deliver services, the
above‑mentioned report, as follows: flow of services and the demand for these services.
• the analysis of GI promotes integrated spatial The adaptation of this scheme for the task implies the
planning by identifying multifunctional zones; following.
• GI analyses are closely related to the (1) Capacity: mapping ecosystem potential to
implementation of the European Biodiversity provide services that protect against climate change
Strategy 2020 (and its Target 2) and the EAP; impacts. The most protective habitats in most cases
are those:
• the identification of GI elements is pursued
at landscape scale with a focus on rural (a) containing fixed biotic structures that interfere
environments; in the mass/liquid/air flow (usually dense and tall
vegetation cover);
• the assessment considers ecosystem services (in
particular regulation and maintenance services (1)) (b) functioning as retention areas by providing space
as starting points for GI mapping —the condition of for the natural processes of the hydrological
the ecosystems is usually used as a surrogate for cycle;
their capacity to deliver ecosystem services;
(c) containing zones with large or growing biomass
• the ecosystem services have been selected from acting as important carbon pools or carbon sinks.
the CICES classification for their relationship with
climate and climate change impacts, and their (2) Ecosystem services flow: mapping the physical
potential mitigation; exposure to extreme events, by assessing the
probability or frequency of such events (that
• the resulting GI network is based on the best subsequently are mitigated by the relevant
available information at European scale at the ecosystem services), based on the results of the
(1) Provisioning or cultural services have minimal or no link to mitigation of the impact of natural hazards.
Exploring nature-based solutions 15Methodology
European Spatial Planning Observation Network In order to use existing information as far as possible,
(ESPON, 2012) or similar projects on natural the data sets for estimation of the ecosystem capacity
hazards. were taken from existing sources where possible
(e.g. Joint Research Centre (JRC) Forest website) or
(3) Demand: mapping the potential beneficiaries literature, e.g. Maes et al., 2011.
of the selected ecosystem services, for example,
integrating:
3.3 Methodological approach
(a) population
The general approach for assessing the capacity of GI
(b) infrastructures (e.g. roads, power plants and to mitigate the impact of climate change-related natural
railways) hazards follows the assessment described in Chapter 2
of the 2014 EEA Technical report Spatial analysis of
(c) visitors/tourists green infrastructure in Europe (EEA, 2014).
(d) points of special sociocultural interest • The assessment takes ecosystem services as
starting point for identifying potential GI elements,
(e) vulnerable economic sectors/areas i.e. GI is a result of the analysis.
(e.g. agriculture).
• The condition of the ecosystems is used as a
(4) Risk: mapping the areas at risk of a specific surrogate for their capacity to deliver ecosystem
natural hazard, given the presence of assets (i.e. services.
demand) and lack of mitigating ecosystem services
(i.e. protective GI). • For analysis and interpretation of the capacity
of the ecosystem services, the original (often)
Table 3.1 matches each ecosystem service (selected continuous value data were classified. Three classes
from the CICES classification for their relationship with (high, medium and low) are used for better visual
climate and climate change impacts and their potential differentiation of the results.
mitigation) with potential data sets which describe:
• The hazard potential is also classified in three
(a) which ecosystem provides the service and its classes (high, medium and low).
capacity/condition;
• Combining the three classes of the ecosystem
(b) where the service is needed (which areas are capacity map and the hazard potential maps results
vulnerable due to being exposed to the natural in a 3 × 3 matrix.
hazard);
• The matrix can be used to identify areas with
(c) who or what would benefit from the presence of a any combination of high/medium/low ecosystem
functional ecosystem service. capacity with high/medium/low hazard potential,
Table 3.1 List of selected ecosystem services and related data sets
ES service class Ecosystem capacity Areas exposed to potential Demand
hazard
Mass stabilisation JRC forest cover map JRC landslide susceptibility map Settlements and transport
(JRC, 2015) (ELSUS1000 v1) infrastructure
JRC forest cover map ESPON avalanche Settlements and transport
infrastructure
Flood protection MAES — annually summed JRC Flood return rate projections: Population
soil infiltration 2-year/100-year return rates
for 2000/2025/2035/2085
(EDENext, 2015b)
Storm surge protection Coastal protection ESPON storm surge Population
(Liquete et al., 2013a)
Global climate regulation MAES Storage and Biomass changes in forests
sequestration of CO2 (harvest vs growth)
16 Exploring nature-based solutionsMethodology
i.e. the elements of the GI network. The (3) the input data used for each assessment;
advantage of the 3 x 3 matrix is the rationed
amount of possible combinations which is still quite (4) the related references.
straightforward to interpret.
These results are presented in the form of maps for
• The GI network is proposed as the intersection each ecosystem service (and related natural hazard).
of high and medium capacity with high and The first set of maps shows the reclassified base
medium hazard potential (i.e. areas with protective data, i.e. the ecosystem capacity map and the natural
ecosystems that play the role of protection against hazard potential map. The second map identifies the
climate effects). network of potential GI elements based on the areas
affected by a climate change-related natural hazard,
The initial classification of hazard potential and and the capacity of an ecosystem service to mitigate
ecosystem capacity includes three categories, this hazard/exposure. Here, the areas in green show
and hazard maps are presented with these well‑functioning ecosystem services with a high adaptive
three categories. For the further analysis, only capacity to relevant levels of natural hazards. Areas in
two categories were used: 'medium‑high', orange indicate regions with a medium capacity to cope
i.e. appropriate for further analyses and with the natural hazard, i.e. areas where the relevant
consideration due to relevant hazard, and 'low' level of the hazard is present, but the ecosystem does
for areas not relevant for further analyses and not deliver optimum services. Finally, the red areas are
consideration because of a too low or non-existent those where a natural hazard is present, but where no
hazard. mitigating ecosystem services are provided.
Map 3.1 illustrates the general concept of the approach The third map describes the risk level of the respective
used in the current study. natural hazard and the related ecosystem services.
This is approximated by comparing the quality of the
The environmental risk is finally determined by potential GI network (based on hazard potential and
combining the demand (based on the exposed capacity) to a demand for such a service. The demand
elements) for a service, with the presence/lack and is defined in the context of the hazard, i.e. presence of
quality of the GI network, i.e. the level of the hazard technical assets or population at risk.
potential AND the ecosystem services capacity to
moderate it. To address the level of risk, the GI network The 'risk' maps follow the same logic as described
above (i.e. capacity AND hazard potential) has been above.
crossed with a demand/beneficiaries layer.
• Class 1 (green): at low risk to the natural hazard
The following chapters of the report summarise the under review. Natural hazard is present (at medium
results of: or high level) and there is well-functioning GI for
mitigating the risk.
(1) the literature review and background for each
topic; • Class 2 (orange): low, medium and high levels of GI
quality match the low-medium and high levels of
(2) the assessment of each topic: demand.
(a) processing the different input data sets to obtain • Class 3 (red): at high risk to the natural hazard
information on ecosystem capacity and the under review. Presence of relevant hazard levels
potential of different climate change-related (high or medium) and low mitigation function of GI,
hazards in a spatially explicit manner; combined with high or medium demand.
(b) identification of potential GI elements (based on • Class 4 (grey): no risk, because no hazard is present,
the combination of capacity AND hazard potential regardless of the level of demand. No need for
maps) for mitigating the impact of climate ecosystem services addressing weather and climate-
change-related natural hazards; related hazards.
(c) comparing the GI network with the actual Despite the classification into only three risk levels,
demand for ecosystem services to identify the each of the combinations of the matrix entries has a
associated level of risk; specific background and calls for specific interpretation.
Exploring nature-based solutions 17Methodology
Map 3.1 Approach for deriving a potential GI network
-30° -20° -10° 0° 10° 20° 30° 40° 50° 60° 70° -30° -20° -10° 0° 10° 20° 30° 40° 50° 60° 70°
Ecosystem capacity Hazard potential
60° 60°
50° 50°
50° 50°
40° 40°
40° 40°
0 500 0° 1000 10°
1500 km 20° 30° 40° 0 500 0° 1000 10°
1500 km 20° 30° 40°
1–High capacity Outside coverage 1–High hazard potential Outside coverage
2–Medium capacity No data 2–Medium hazard potential No data
3–Low capacity 3–Low hazard potential
-30° -20° -10° 0° 10° 20° 30° 40° 50° 60° 70° -30° -20° -10° 0° 10° 20° 30° 40° 50° 60° 70°
Capacity and hazard GI and demand=risk
potential=GI
60° 60°
50° 50°
50° 50°
40° 40°
40° 40°
0 500 0° 1000 10°
1500 km 20° 30° 40° 0 500 0° 1000 10°
1500 km 20° 30° 40°
1–Best acting GI network Outside
coverage 1–Low risk Outside coverage
2–Restorable GI network
No data 2–Medium risk No data
3–Inexistent but need natural
3–protections 3–High risk
4–No risk zone under normal 4–No risk
3–conditions
18 Exploring nature-based solutionsMethodology
Table 3.2 Matrix for identifying elements of the GI network
Capacity
High Medium Low
Hazard potential
High 1 2 3
Medium 1 2 3
Low 4 4 4
Notes: 1 = best acting GI network for risk mitigation.
2 = restorable GI network for risk mitigation.
3 = no or very low natural protection despite relevant hazard.
4 = no hazard zone under normal conditions (despite increasing extreme events under climate change).
Table 3.3 Matrix for identifying risk level
Demand High Medium Low
GI network
(quality of GI services)
High Medium Low Low
Medium High Medium Low
Low High High Medium
No hazard zone No risk No risk No risk
For the example of the three 'medium' categories • Low/low: specific areas where hazard is relevant
of the risk level table (Table 3.3), the following and GI protection is low, but due to the comparably
combinations exist: low level of demand, the overall risk is medium
rather than high.
• High/high: high priority for conservation of
ecosystems, to avoid reduction of quality of GI
networks and increase of risk;
• Medium/medium: it is strongly recommended
to conserve existing GI and to restore missing GI
— these are priority areas for conservation AND
restoration;
Exploring nature-based solutions 19Results
4 Results
4.1 Mass stabilisation — landslides
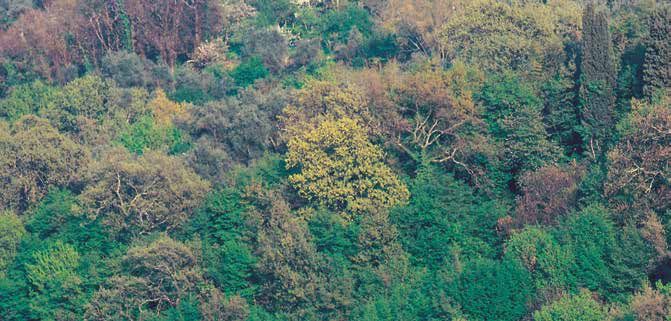
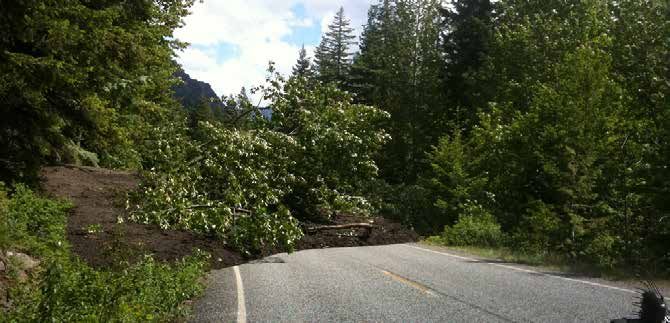
Photo 4.1 Landslide
© https://www.flickr.com/photos/jessicadally
4.1.1 Background — literature review More specifically, destruction of forest cover for
clear‑cut areas and logging roads are seen as
There is a strong evidence basis for increased particularly important driving factors (Abramowitz,
landslide activity as a result of expected climate 2001). Global landslide hotspots are located in tropical
change, despite high levels of uncertainty resulting mountainous regions with high precipitation and
from the margins of error inherent in global climate frequent earthquakes; in mainland Europe, only Italy
predictions and the lack of sufficient spatial resolution was recognised as landslide hotspot (EC, 2006; Stolton
of downscaled projections (Crozier, 2010; Huggel et al., 2008; Smith, 2013). For the 12 EU-25 cases of
et al., 2011). GI, particularly forests but also other major landslides in the International Disaster Database
vegetation, can sizeably reduce occurrence of (EM‑DAT) (2) of the Université Catholique de Louvain
shallow landslides (Stolton et al., 2008; Crozier, 2010; alone, the toll was 1 387 casualties in Italy (plus 196 in
Stokes et al., 2014). Their global increase is caused the Austria, Sweden and United Kingdom together) and
mainly by overexploitation of natural resources and the cost was EUR 1.2 billion (EC, 2006).
deforestation, as well as by growing urbanisation and
uncontrolled land use (Stolton et al., 2008; Stokes et al., In a recent review, Stokes et al. (2014) acknowledge the
2014). importance of vegetation for mitigating landslides; they
(2) It should be noted that EM-DAT does not capture all hazards, and that the data have proved to be flawed in some cases. The low coverage of
landslides may be partly explained by the application of thresholds for events to be included. However, EM-DAT is one of the most frequently
used sources for disasters, as at least it provides some spatial context.
20 Exploring nature-based solutionsResults
provide examples of different tree species and stand (Cruz et al., 2011). This example is also the only one
ages. They also compare inert engineering structures reported by Gantioler et al. (2010) in their assessment
(i.e. grey infrastructure) and live plant material (i.e. GI) of the socio‑economic benefits of investment in the
in terms of efficacy and longevity. Unfortunately, this Natura 2000 network.
comparison does not consider existing vegetation
cover, but is limited to new constructions such as brush
layers or fascines with wood or live plant cuttings. 4.1.2 Assessment
These soft structures have the disadvantage of taking
longer to fully stabilise soils, and hence are only Landslides represent a major threat to human
suitable where slope instability is anticipated. Their life, property, buildings, infrastructure and natural
longevity varies greatly, depending on species used and environments in most mountainous and hilly regions of
local conditions; less than 10% decay over 10 years was the world (ESPON, 2012). The distribution of landslide
reported for external structural elements in crib-walls hazards over Europe is strongly linked to the geological
in Tuscany, Italy (Stokes et al., 2014). and relief conditions of the continent. Therefore,
mountainous areas such as the Scandinavian Peninsula,
Although a great deal of European literature covers the Alps and also the southern part of Europe are most
the relation between vegetation cover and slope prone to landslides.
stability (Stokes et al., 2013), the capacity of GI for
landslide mitigation is scarcely assessed at local Human-induced climate change is expected to increase
scale. Potential methods to be applied include the mean temperature and to alter precipitation
assessments of replacement costs or avoided costs patterns in Europe in future (EEA, 2010a), leading to
(Gómez‑Baggethun and Barton, 2013). The latter were an increase of landslides, i.e. debris flows triggered
used in one local example from the Special Protected by heavy rainfalls or rockfalls due to the retreat of
Area (SPA) Pico da Vara/Ribeira do Guilherme (Azores permafrost areas. Still, it is difficult to make a clear
Islands, Portugal) (de la Cruz, A. and Benedicto, J., long-term forecast of the development of landslide
2009), where the benefits of preserving the SPA's hazards under a changing climate (EEA, 2010).
ecosystems (i.e. GI) include prevention of disasters
like the one in a neighbouring location in 1997, which Map 4.1 and Map 4.2 show the classified base data for
resulted in 29 deaths and EUR 20 million in damages ecosystem capacity to mitigate landslide risk based
Map 4.1 Capacity to mitigate landslide risk — Map 4.2 Hazard potential for landslides
forest density
-30° -20° -10° 0° 10° 20° 30° 40° 50° 60° 70° -30° -20° -10° 0° 10° 20° 30° 40° 50° 60° 70°
60° 60°
50° 50°
50° 50°
40° 40°
40° 40°
0° 10° 20° 30° 40° 0° 10° 20° 30° 40°
0 500 1000 1500 km 0 500 1000 1500 km
Capacity to mitigate landslide risk Forest density - Hazard potential for landslides
1–High capacity Areas above treeline 1–High hazard potential Areas above treeline
2–Medium capacity No data 2–Medium hazard potential No data
3–Low capacity Outside coverage 3–Low hazard potential Outside coverage
Exploring nature-based solutions 21Results
on the presence of protective forest and the hazard restorable; 3: inexistent, but needed), their weighted
potential for landslides. The integration of both data average score and standard deviation. Regions around
sets (in Map 4.3) results in the delineation of a potential the European average (average score +/− 1 standard
GI network for mitigating landslide vulnerability. As is deviations) are classified in orange (2: restorable), while
to be expected, the hazard potential for landslides is regions beyond this class are classified either as red
higher in mountainous regions. On the other hand, (3: inexistent, but needed) or green (1: best acting).
existing forests are able to provide a protection function Regions with a very good coverage of potential GI
(green areas in Map 4.3). Class 3 identifies areas where elements are shown in green (i.e. dense forest areas).
landslide vulnerability is moderate to high, but where Due to the aggregation from 1 km grid cells to NUTS
little or no protection forest (with a minimum density level 2 regions, the fine-grained detail of Map 4.3 is lost.
of 20%) is present, providing few or no mitigating
ecosystem services. These areas are found mainly on By overlaying the GI network of Map 4.3 with settlements
the Apennine peninsula, the Central Alps, Scotland, and road infrastructure, one can recognise the demand
Sicily, Wales and further mountainous areas in southern for the protective function of GI. The result (Map 4.5)
Europe. The western areas of the United Kingdom are shows that most high mountain settlements and roads
particularly prominent: they are high-risk areas and have effective protection from landslides, while the risk
lack any functional GI. This is due to a moderate-to‑high increases in moderately hilly areas having a significantly
landslide hazard potential in combination with an lower percentage of protective forests.
absence of dense forest cover to mitigate the hazard.
An aggregation of the European risk map to
Aggregating (3) Map 4.3 to NUTS level 2 administrative administrative regions (Map 4.7) highlights regions with
regions (Map 4.4) highlights the regions most vulnerable a higher risk due to a high demand (also seen in regions
to landslides in large parts of Italy and the British with a moderate GI network), and conversely, regions
Isles. The aggregation is based on the sum of pixels in with a well-functioning GI network, identified by regions
the different classes of GI elements (1: best acting; 2: changing from red to orange or from orange to green.
Map 4.3 Potential GI network based on ecosystem capacity to mitigate exposure to landslides
-30° -20° -10° 0° 10° 20° 30° 40° 50° 60° 70° Ecosystem service flow —
Landslide vs. forest
capacity
1–Best acting GI
1–network
2–Restorable GI
60° 2–network
3–Inexistent but needed
3–natural protection
50° 4–No risk zone under
4–normal conditions
No data
Outside coverage
50°
40°
40°
0 500 1000 1500 km
0° 10° 20° 30° 40°
(3) The use of three categories and the aggregation to NUTS level 2 regions presents a rather broad spectrum of specific local characteristics; the
category name might not always fully reflect these local characteristics.
22 Exploring nature-based solutionsYou can also read