FUTURE OF WIND Deployment, investment, technology, grid integration and socio-economic aspects - IRENA
←
→
Page content transcription
If your browser does not render page correctly, please read the page content below
FUTURE OF WIND
Deployment, investment,
technology, grid integration and
socio-economic aspects

A Global Energy Transformation paper
© IRENA 2019
    Unless otherwise stated, material in this publication may be freely used, shared, copied, reproduced, printed and/or stored,
    provided that appropriate acknowledgement is given of IRENA as the source and copyright holder. Material in this publication
    that is attributed to third parties may be subject to separate terms of use and restrictions, and appropriate permissions from
    these third parties may need to be secured before any use of such material.

    ISBN 978-92-9260-155-3

    Citation
    IRENA (2019), Future of wind: Deployment, investment, technology, grid integration and socio-economic aspects
    (A Global Energy Transformation paper), International Renewable Energy Agency, Abu Dhabi.

    This document presents additional findings from Global Energy Transformation: A roadmap to 2050 (2019 edition)
    available for download from www.irena.org/publications. For further information or to provide feedback, please contact
    IRENA at info@irena.org.

    About IRENA
    The International Renewable Energy Agency (IRENA) is an intergovernmental organisation that serves as the principal
    platform for co-operation, a centre of excellence, a repository of policy, technology, resource and financial knowledge,
    and a driver of action on the ground to advance the transformation of the global energy system. IRENA promotes the
    widespread adoption and sustainable use of all forms of renewable energy, including bioenergy, geothermal, hydropower,
    ocean, solar and wind energy, in the pursuit of sustainable development, energy access, energy security and low-carbon
    economic growth and prosperity.

    Acknowledgements
    This report benefited from input and review of the following experts: Elbia Gannoum and Selma Bellini (ABEEólica –
    Brazil Wind Energy Association), Kaare Sandholt (China National Renewable Energy Centre), Qin Haiyan and Yu
    Guiyong (Chinese Wind Energy Association), Lucy Craig, Jeremy Parkes and Vineet Parkhe (DNV GL – Energy), Xue Han
    (Energy Research Institute of China), Karin Ohlenforst and Feng Zhao (Global Wind Energy Council), Laura Cozzi and
    Alberto Toril (International Energy Agency), Karsten Capion (Klimaraadet – The Danish Council on Climate Change),
    Kihwan Kim (Korea Energy Economics Institute), K. Balaraman (National Institute of Wind Energy – India), Jeffrey Logan
    and Mai Trieu (National Renewable Energy Laboratory), Yuan Jiahai (North China Electric Power University), Aled Moses,
    Øyvind Vessia and Sune Strøm (Ørsted), Ntombifuthi Ntuli (South African Wind Energy Association), Yasushi Ninomiya
    (The Institute of Energy Economics, Japan), Rina Bohle Zeller (Vestas Wind Systems A/S), Ivan Komusanac (WindEurope)
    and Stefan Gsänger (World Wind Energy Association). Valuable review and feedback were provided by IRENA
    colleagues: Francisco Boshell, Yong Chen, Rafael De Sá Ferreira, Celia García-Baños, Rabia Ferroukhi, Gurbuz Gonul,
    Carlos Guadarrama, Diala Hawila, Seungwoo Kang, Rodrigo Leme, Paul Komor, Neil MacDonald, Julien Marquant,
    Thomas Nikolakakis, Bishal Parajuli and Michael Taylor. The editor of this report was Lisa Mastny.

    Contributing authors: This report was developed under the guidance of Dolf Gielen and Ricardo Gorini
    and authored by Gayathri Prakash and Harold Anuta, with additional contributions and support from
    Nicholas Wagner and Giacomo Gallina.

    IRENA is grateful for the generous support of the Federal Ministry for Economic Affairs and Energy of Germany,
    which made the publication of this report a reality.

    Disclaimer
    This publication and the material herein are provided “as is”. All reasonable precautions have been taken by IRENA to verify
    the reliability of the material in this publication. However, neither IRENA nor any of its officials, agents, data or other third-
    party content providers provides a warranty of any kind, either expressed or implied, and they accept no responsibility or
    liability for any consequence of use of the publication or material herein.
    The information contained herein does not necessarily represent the views of the Members of IRENA. The mention of
    specific companies or certain projects or products does not imply that they are endorsed or recommended by IRENA in
    preference to others of a similar nature that are not mentioned. The designations employed, and the presentation of material
    herein, do not imply the expression of any opinion on the part of IRENA concerning the legal status of any region, country,
    territory, city or area or of its authorities, or concerning the delimitation of frontiers or boundaries.

2
CONTENTS
FIGURES 4
TABLES 7
ABBREVIATIONS 8
EXECUTIVE SUMMARY 9
1 ENERGY TRANSFORMATION PATHWAYS AND WIND ENERGY 14
1.1 Pathways for the Global Energy Transformation 14
1.2 The Energy Transformation: Rationale 15
1.3 Global Energy Transformation: The role of wind energy 17
2 THE EVOLUTION AND FUTURE OF WIND MARKETS 22
2.1 Evolution of the wind industry 22
2.2 Onshore wind outlook to 2050 24
2.3 Offshore wind outlook to 2050 42
3 TECHNOLOGICAL SOLUTIONS AND INNOVATIONS TO INTEGRATE
RISING SHARES OF WIND POWER GENERATION 62
4 SUPPLY SIDE AND MARKET EXPANSION 67
4.1 Current status of wind supply industry 67
5 SOCIO-ECONOMIC AND OTHER BENEFITS OF WIND ENERGY
IN THE CONTEXT OF ENERGY TRANSFORMATION 70
5.1 Wind sector employment and local value chain 70
5.2 Clustering with other low-carbon technologies: Hybrid systems 74
6 ACCELERATING WIND POWER DEPLOYMENT: EXISTING BARRIERS AND SOLUTIONS 75
REFERENCES 83
3FIGURES
Figure ES 1. Wind roadmap to 2050: tracking progress of key wind energy indicators
to achieve the global energy transformation. 12
Figure 1: Pressing needs and attractive opportunities are driving the transformation of
the world's energy system 16
Figure 2. Renewables and efficiency measures, boosted by substantial electrification,
can provide over 90% of necessary CO₂ emission reductions by 2050. 17
Figure 3. Wind would be the largest generating source, supplying more than one-third of total
electricity generation needs by 2050 19
Figure 4. Comparison of scenarios for the global energy transition, with a focus on wind power
generation. 20
Figure 5. Wind power would contribute to 6.3 Gt of CO₂ emissions reductions in 2050, representing
27% of the overall emissions reductions needed to meet Paris climate goals. 21
Figure 6: Overview of key milestones achieved by the wind industry so far since 1982. 23
Figure 7: Onshore wind cumulative installed capacity would grow more than three-fold
by 2030 and nearly ten-fold by 2050 relative to 2018 levels. 25
Figure 8: Asia would continue to dominate global onshore wind power installations by 2050,
followed by North America and Europe. 27
Figure 9: Global onshore wind power additions would need to grow more than three-fold
by 2030 and more than five-fold by 2050 relative to 2018 levels. 28
Figure 10: Total installed cost of onshore wind projects have fallen rapidly and is expected
to decline further by 2050. 33
Figure 11: Total Installed cost ranges and weighted averages for onshore wind projects
dropped in many country/region since 2010. 34
Figure 12: The global weighted average capacity factor for new turbines has increased from 27%
in 2010 to 34% in 2018 and would increase substantially in next three decades. 35
Figure 13: Regional weighted average LCOE and ranges for onshore wind in 2010 and 2018. 35
Figure 14: The Levelised cost of Electricity for onshore wind is already competitive now compared
to all fossil fuel generation sources and would be fully competitive in a few years. 36
4Figure 15: LCOE and global weighted average values for onshore wind projects, 2010–2020. 37
Figure 16: Scaling up onshore wind energy investment is key to accelerate the pace of global
onshore wind installations over the coming decades. 38
Figure 17: total investments in global onshore annual wind power deployment, including
new capacity installations and replacement of end-of-lifetime capacities. 39
Figure 18: Ongoing innovations and technology enhancements towards larger-capacity
turbines, increased hub heights and rotor diameters would improve energy yields
and reduce capital and operation costs per unit installed capacity. 40
Figure 19: Offshore wind power deployment to grow gradually to nearly 1 000 GW of
total installed capacity by 2050. 43
Figure 20: Asia would dominate global offshore wind power installations by 2050,
followed by Europe and North America. 44
Figure 21: Annual offshore wind capacity additions would need to scale up more than
six-fold to 28 GW in 2030 and almost ten-fold to 45 GW in 2050 from 4.5 GW
added in 2018. 45
Figure 22: The global weighted average installed costs for offshore wind have declined by a
modest 5% since 2010 and would decline greatly in the next three decades. 47
Figure 23: The global weighted average capacity factor for offshore wind has
increased 8 percentage points since 2010, to 43%, and upcoming projects
would have capacity factors up to higher range of 58% in 2030 and 60%
in 2050. 49
Figure 24: By 2050, the LCOE of offshore wind would be competitive, reaching lower
fossil fuel ranges. 50
Figure 25: LCOE and global weighted average values for offshore wind projects, 2010–2025. 51
Figure 26: Global offshore annual wind power deployment total investments including
new capacity installations and replacements of end-of-lifetime capacities. 52
Figure 27: Investments would need to be shifted to emerging offshore wind markets such as
Asia and North America followed by stable investments needed in Europe. 53
Figure 28: Anticipated timing and importance of innovations in offshore wind technology. 55
5Figure 29: The average size of offshore wind turbines grew by a factor of
3.4 in less than two decades and is expected to grow to output capacity of
15–20 MW by 2030. 56
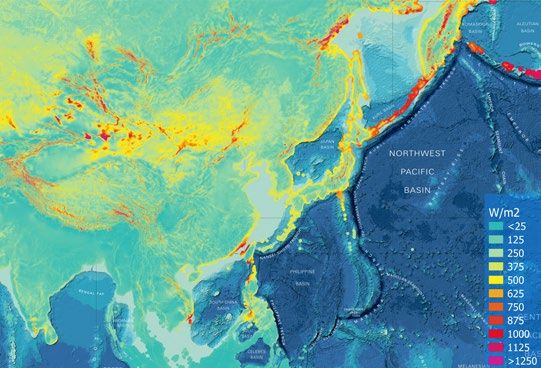
Figure 30: Offshore Coastal wind power: potential of floating offshore wind power –
zoom in China 57
Figure 31: Offshore wind turbine foundation technologies. 58
Figure 32: Higher shares of wind power would be integrated in various G20 countries by 2050 63
Figure 33: Additional investments are required in grids, generation adequacy and some
flexibility measures (such as storage) across the entire electricity system to
integrate raising shares of variable renewable sources. 64
Figure 34: Power system flexibility enablers in the energy sector. 65
Figure 35: The Four dimensions of innovation. 66
Figure 36: In 2018, Vestas remained as the world’s largest wind turbine supplier
followed by Goldwind and Siemens-gamesa. 67
Figure 37: Geared wind turbine systems continue to be the preferred turbine technology
based on market size in 2018. 68
Figure 38: The onshore and offshore wind industries would employ more than
3.7 million people by 2030 and more than 6 million people by 2050. 70
Figure 39: Women in STEM, NON-STEM technical and administrative jobs in
the energy sector 71
Figure 40: Materials required for a 50 MW onshore wind plant and a 500 MW
offshore wind plant. 73
Figure 41: Distribution of human resources and occupational requirements along the value chain
(50 MW onshore wind, 500 MW offshore wind). 73
Figure 42: Existing barriers in the wind energy sector. 75
Figure 43: The policy framework for a just transition. 76
6TABLES
Table 1: Offshore wind deployments and targets in countries. 46
Table 2: High-potential-impact technologies in approximate order of priority. 54
Table 3: Estimated floating wind potential in China for different depths and
average wind power densities. 57
Table 4: Technical potential for floating wind in major economies. 58
Table 5: Country status and forecasts on floating offshore wind power deployment. 59
Table 6: Domestic wind markets as of 2018. 69
Table 7: Hybrid renewable developments in countries. 74
Annual global temperatures from 1850–2017 Warming Stripes, by Ed Hawkins, climate scientist in the
National Centre for Atmospheric Science (NCAS) at the University of Reading.
The visualisation illustrates the changes witnessed in temperatures across the globe over the past century and
more. The colour of each stripe represents the temperature of a single year, ordered from the earliest available
data at each location to now. The colour scale represents the change in global temperatures covering 1.35 °C.
7FUTURE OF WIND
ABBREVIATIONS
°C degree Celsius LCOE levelised cost of electricity
AC alternating current m² square metre
CAGR compound annual growth rate MW megawatt
CAPEX capital expenditure MWh megawatt-hour
CMS condition monitoring systems NDC Nationally Determined Contributions
CO₂ carbon dioxide NREL US National Renewable Energy Laboratory
CSP concentrating solar power O&M operations and maintenance
DC direct current OPEX operating expenditure
DOE US Department of Energy PPA power purchase agreement
EU European Union PTC US Production Tax Credit
EV electric vehicle PV photovoltaic
G20 Group of Twenty R&D research and development
GBP British pound RD rotor diameter
Gt gigatonne REmap IRENA’s renewable energy roadmap
GW gigawatt TW terawatt
GWEC Global Wind Energy Council TWh terawatt-hour
HVAC high-voltage alternating current UK United Kingdom
HVDC high-voltage direct current US United States
IRENA International Renewable Energy Agency USD US dollar
IPCC Intergovernmental Panel on Climate Change V2G vehicle-to-grid
km² square kilometre VRE variable renewable energy
kW kilowatt W watt
kWh kilowatt-hour yr year
8EXECUTIVE SUMMARY
EXECUTIVE
SUMMARY
DECARBONISATION OF THE ENERGY SECTOR AND THE REDUCTION OF CARBON
EMISSIONS TO LIMIT CLIMATE CHANGE IS AT THE HEART OF THE INTERNATIONAL
RENEWABLE ENERGY AGENCY (IRENA)’S ENERGY TRANSFORMATION ROADMAPS.
These roadmaps examine and provide an assertive yet technically and economically
feasible pathway for the deployment of low-carbon technology towards a sustainable and
clean energy future.
IRENA HAS EXPLORED TWO ENERGY DEVELOPMENT PATHWAYS TO THE YEAR 2050 AS
PART OF THE 2019 EDITION OF ITS GLOBAL ENERGY TRANSFORMATION REPORT. The
first is an energy pathway set by current and planned policies (Reference Case). The second is
a cleaner climate-resilient pathway based largely on more ambitious, yet achievable, uptake
of renewable energy and energy efficiency measures (REmap Case), which limits the rise in
global temperature to well below 2 degrees and closer to 1.5 degrees above pre-industrial
levels and is aligned within the envelope of scenarios presented in the Intergovernmental
Panel on Climate Change (IPCC) Special Report on Global Warming of 1.5 °C.
THIS REPORT OUTLINES THE ROLE OF WIND POWER IN THE TRANSFORMATION OF
THE GLOBAL ENERGY SYSTEM BASED ON IRENA’S CLIMATE-RESILIENT PATHWAY
(REMAP CASE), specifically the growth in wind power deployments that would be needed
in the next three decades to achieve the Paris climate goals.
KEY FINDINGS:
n ACCELERATED DEPLOYMENT OF RENEWABLES, COMBINED WITH DEEP
ELECTRIFICATION AND INCREASED ENERGY EFFICIENCY, CAN ACHIEVE OVER
90% OF THE ENERGY-RELATED CARBON DIOXIDE (CO₂) EMISSIONS REDUCTIONS
NEEDED BY 2050 TO SET THE WORLD ON AN ENERGY PATHWAY TOWARDS MEETING
THE PARIS CLIMATE TARGETS. Among all low-carbon technology options, accelerated
deployment of wind power when coupled with deep electrification would contribute to
more than one-quarter of the total emissions reductions needed (nearly 6.3 gigatonnes
of carbon dioxide (Gt CO₂) annually) in 2050.
ACHIEVING THE PARIS CLIMATE GOALS WOULD REQUIRE SIGNIFICANT
n
ACCELERATION ACROSS A RANGE OF SECTORS AND TECHNOLOGIES. Wind power,
along with solar energy, would lead the way for the transformation of the global
electricity sector. Onshore and offshore wind would generate more than one-third
(35%) of total electricity needs, becoming the prominent generation source by 2050.
9FUTURE OF WIND
SUCH A TRANSFORMATION IS ONLY POSSIBLE BY GREATLY SCALING UP WIND
n
CAPACITY INSTALLATIONS IN THE NEXT THREE DECADES. This entails increasing
the global cumulative installed capacity of onshore wind power more than three-
fold by 2030 (to 1 787 gigawatts (GW)) and nine-fold by 2050 (to 5 044 GW)
compared to installed capacity in 2018 (542 GW). For offshore wind power, the
global cumulative installed capacity would increase almost ten-fold by 2030
(to 228 GW) and substantially towards 2050, with total offshore installation nearing
1 000 GW by 2050.
THE WIND INDUSTRY WOULD NEED TO BE PREPARED FOR SUCH A SIGNIFICANT
n
GROWTH IN THE WIND MARKET OVER THE NEXT THREE DECADES. Annual capacity
additions for onshore wind would increase more than four-fold, to more than 200 GW
per year in the next 20 years, compared to 45 GW added in 2018. Even higher growth
would be required in annual offshore wind capacity additions – around a ten-fold
increase, to 45 GW per year by 2050 from 4.5 GW added in 2018.
AT A REGIONAL LEVEL, ASIA WOULD LARGELY DRIVE THE PACE OF WIND CAPACITY
n
INSTALLATIONS, BECOMING THE WORLD LEADER IN WIND ENERGY. Asia (mostly
China) would continue to dominate the onshore wind power industry, with more than
50% of global installations by 2050, followed by North America (23%) and Europe (10%).
For offshore wind, Asia would take the lead in the coming decades with more than 60%
of global installations by 2050, followed by Europe (22%) and North America (16%).
SCALING UP WIND ENERGY INVESTMENTS IS KEY TO ACCELERATING THE GROWTH
n
OF GLOBAL WIND POWER INSTALLATIONS OVER THE COMING DECADES. This would
imply increasing global average annual onshore wind power investments by more than
two-fold from now until 2030 (USD 146 billion/year) and more than three-fold over
the remaining period to 2050 (USD 211 billion/year) compared to 2018 investments
(USD 67 billion/year). For offshore wind, global average annual investments would
need to increase three-fold from now until 2030 (USD 61 billion/year) and more than
five-fold over the remaining period to 2050 (USD 100 billion/year) compared to 2018
investments (USD 19 billion/year).
n INCREASING ECONOMIES OF SCALE, MORE COMPETITIVE SUPPLY CHAINS AND
FURTHER TECHNOLOGICAL IMPROVEMENTS WILL CONTINUE TO REDUCE THE
COSTS OF WIND POWER. Globally, the total installation cost of onshore wind projects
would continue to decline in the next three decades with the average cost falling in
the range of USD 800 to 1 350 per kilowatt (kW) by 2030 and USD 650 to 1 000/ kW
by 2050, compared to the global-weighted average of USD 1 497/kW in 2018. For
offshore wind projects, the average total installation cost would further drop in coming
decades to between USD 1 700 and 3 200/kW by 2030 and between USD 1 400 and
2 800/kW by 2050.
The levelised cost of electricity (LCOE) for onshore wind is already competitive compared
to all fossil fuel generation sources and is set to decline further as installed costs and
performance continue to improve. Globally, the LCOE for onshore wind will continue to
fall from an average of USD 0.06 per kilowatt-hour (kWh) in 2018 to between USD 0.03
to 0.05/kWh by 2030 and between USD 0.02 to 0.03/kWh by 2050. The LCOE of offshore
wind is already competitive in certain European markets (for example, Germany, the
Netherlands with zero-subsidy projects, and lower auction prices). Offshore wind would
be competitive in other markets across the world by 2030, falling in the low range of
costs for fossil fuels (coal and gas). The LCOE of offshore wind would drop from an
average of USD 0.13/kWh in 2018 to an average between USD 0.05 to 0.09/kWh by 2030
and USD 0.03 to 0.07/kWh by 2050.
n O
NGOING INNOVATIONS AND TECHNOLOGY ENHANCEMENTS TOWARDS LARGER-
CAPACITY TURBINES AS WELL AS INCREASED HUB HEIGHTS AND ROTOR DIAMETERS
HELP IMPROVE YIELDS FOR THE SAME LOCATION. The ongoing increase in wind turbine
size for onshore applications is set to continue, from an average of 2.6 megawatts (MW)
in 2018 to 4 to 5 MW for turbines commissioned by 2025. For offshore applications, the
10EXECUTIVE SUMMARY
largest turbine size of around 9.5 MW today will soon be surpassed, with expectations that
projects to be commissioned in 2025 would comprise of turbines with ratings of 12 MW
and above (although some legacy projects with long lead times may have lower ratings).
Research and development will likely lead to a potential to increase this to 15 to 20 MW in a
decade or two.
The combination of improved wind turbine technologies, deployment of higher hub
heights and longer blades with larger swept areas leads to increased capacity factors
for a given wind resource. For onshore wind plants, global weighted average capacity
factors would increase from 34% in 2018 to a range of 30% to 55% in 2030 and 32% to
58% in 2050. For offshore wind farms, even higher progress would be achieved, with
capacity factors in the range of 36% to 58% in 2030 and 43% to 60% in 2050, compared
to an average of 43% in 2018.
TECHNOLOGICAL DEVELOPMENTS IN WIND TURBINE FOUNDATIONS ARE A KEY
n
FACTOR ENABLING THE ACCELERATED DEPLOYMENT OF OFFSHORE WIND,
PERMITTING ACCESS TO BETTER WIND RESOURCES. Floating foundations are
potentially a “game-changing” technology to effectively exploit abundant wind potential
in deeper waters and thus could lead the way for rapid future growth in the offshore
wind power market. By 2030, industry experts estimate that around 5 GW to 30 GW of
floating offshore capacity could be installed worldwide and that, based on the pace of
developments across various regions, floating wind farms could cover around 5% to 15%
of the global offshore wind installed capacity (almost 1 000 GW) by 2050.
TECHNOLOGICAL SOLUTIONS ACCOMPANIED BY ENABLING MARKET CONDITIONS
n
AND INNOVATIVE BUSINESS MODELS, ARE ESSENTIAL TO PREPARE FUTURE
POWER GRIDS TO INTEGRATE RISING SHARES OF WIND POWER. To effectively
manage large-scale variable renewable energy sources, flexibility must be harnessed
in all sectors of the energy system, from power generation to transmission and
distribution systems, storage (both electrical and thermal) and increasingly flexible
demand (demand side management and sector coupling). Globally, to integrate
60% variable renewable generation (35% from wind) by 2050 as is envisioned in the
REmap Case, average annual investments in grids, generation adequacy and some
flexibility measures (e.g. storage) would need to rise by more than one-quarter to
USD 374 billion/year, compared to investments made in electricity networks and
battery storage in 2018 of USD 297 billion/year.
IF ACCOMPANIED BY SOUND POLICIES, THE TRANSFORMATION CAN BRING SOCIO-
n
ECONOMIC BENEFITS. The wind industry can employ 3.74 million people by 2030 and
more than 6 million people by 2050, a figure nearly three times higher and five times
higher respectively than the 1.16 million jobs in 2018. To maximise outcomes of the
energy transition, however, a holistic policy framework is needed. Deployment policies
will need to co-ordinate and harmonise with integration and enabling policies. Under
the enabling policy umbrella, particular focus is needed on industrial, labour, financial,
education and skills policies to maximise the transition benefits. Education and skills
policies can allow for the retention and reallocation of existing expertise in the oil and
gas sector to support the installation of offshore wind foundation structures. Similarly,
sound industrial and labour policies that build upon domestic supply chains can enable
income and employment growth by leveraging existing economic activities in support of
wind industry development.
UNLEASHING THE MASSIVE POTENTIAL OF WIND IS CRUCIAL TO ACHIEVE THE PARIS
n
CLIMATE TARGETS. This is only possible by mitigating the existing barriers at different
scales (technology, economic, socio-political and environmental) that could hinder the
deployment of wind capacities in the next three decades. Grid access, public acceptance,
planning procedures and planning uncertainties, economies of scale, access to finance,
subsidies for traditional energy are among the key barriers. Mitigating the existing barriers
immediately, through a range of supportive policies and implementation measures including
innovative business models, financial instruments is vital to boost future deployment of
wind capacities to enable the transition to a low-carbon, sustainable energy future.
11FUTURE OF WIND
Figure ES 1. Wind roadmap to 2050: tracking progress of key wind energy indicators
to achieve the global energy transformation.
ON/OFF
2010 2018 2030 2050
TRACK
CO2 EMISSIONS (ENERGY-RELATED) AND REDUCTION POTENTIAL BY WIND POWER
Energy-related CO2 emissions under
current plans and planned policies
(Reference Case) (Gt CO2 /yr)
29.7 34.5 35 33.1
Energy-related CO2 emissions under
IRENA‘s climate resilient pathway
(REmap Case) (Gt CO2 /yr)
29.7 34.5 24.9 9.8 Off track
Avoided emissions due to
accelerated deployment of
wind power coupled with deep
electrification (Gt CO2/yr)
6.3
REMAP CASE ON/OFF
2010 2018
2030 2050 TRACK
WIND POWER IN TOTAL GENERATION MIX
Onshore and offshore
wind generation share (%) 1.7% 6% 21% 35%
Progress
TOTAL INSTALLED CAPACITY
Onshore wind (GW)
Off track
178 542 1 787 5 044
Offshore wind (GW)
3 23 228 1 000 Progress
ANNUAL DEPLOYMENT*
Onshore wind (GW/yr) 147 202
30 45 Off track
Offshore wind (GW/yr)
28 45
0.9 4.5 Progress
TOTAL INSTALLATION COST
Onshore wind (USD/kW)
12 1 913 1 497 800 – 1350 650 – 1000 On track
(average) (average) (average range)(average range)Offshore wind (GW)
Energy-related CO2 emissions under
IRENA‘s climate resilient pathway
3 23 228 1 000 Progress
EXECUTIV
KEY
E S FINDINGS
UMMARY
(REmap Case) (Gt CO2 /yr)
ANNUAL DEPLOYMENT*
29.7 34.5 24.9 9.8 Off track
Avoided emissions due to
accelerated deployment of
wind power coupled with deep
Onshore wind
electrification (Gt (GW/yr)
CO2/yr) 147 6.3
202
30 45 Off track
REMAP CASE ON/OFF
2010 2018
Offshore wind (GW/yr)
28
2030 45
2050 TRACK
0.9 4.5 Progress
TOTAL INSTALLATION COST
WIND POWER IN TOTAL GENERATION MIX
Onshore
Onshore and
wind offshore
(USD/kW)
wind generation share (%) 1.7
1 913% 6%
1 497 21 %
800 – 1350 35 %
650 – 1000 On track
(average) (average) (average range)(average range) Progress
TOTAL INSTALLED CAPACITY
Offshore wind (USD/kW)
4 572 4 353 1 700 – 3 200 1 400 – 2 800 Progress
(average) (average) (average range)(average range)
LEVELISED COST OF ELECTRICITY
Onshore wind (GW) (LCOE)
Off track
178 542 1 787 5 044
Onshore wind (USD/kWh)
Offshore wind (GW) 0.08 0.06 0.03 – 0.05 0.02 – 0.03 On track
3
(average) 23
(average) 228 1 000
(average range)(average range) Progress
ANNUAL DEPLOYMENT*
Offshore wind (USD/kWh)
0.16 0.13 0.05 – 0.09 0.03 – 0.07 Progress
(average) (average) (average range)(average range)
Onshore wind (GW/yr) 147 202
AVERAGE ANNUAL INVESTMENT 30 45 Off track
211
146
Onshore wind (USD billion/yr) 57 67
Offshore wind (GW/yr)
28 45
0.9 4.5 Off track
Progress
TOTAL INSTALLATION COST 61 100
Offshore wind (USD billion/yr)
4.2 19.4 Progress
Onshore wind (USD/kW)
CAPACITY FACTORS 1 913 1 497 800 – 1350 650 – 1000 On track
(average) (average) (average range)(average range)
30 – 55 32 – 58
OffshoreOnshore wind (%)
wind (USD/kW)
27 34
4 572
(average)
4 353 1 700 – 3 200 1 400 – 2 800
(average) (average range)(average range)
Progress
Progress
(average) (average) (average range)(average range)
LEVELISED COST OF ELECTRICITY (LCOE) 38 43 36 – 58 43 – 60
Offshore wind (%)
(average) (average) (average range)(average range)
On track
EMPLOYMENTOnshore wind (USD/kWh) 0.08 0.06 0.03 – 0.05 0.02 – 0.03 On track
(average) (average) (average range)(average range)
Onshore and offshore
Offshore wind
wind (million)
(USD/kWh)
0.16 0.13 0.05 – 0.09 0.03 – 0.07 Off track
Progress
0.75** 1.12 (average
(average) (average) 3.74 6.06
range)(average range)
AVERAGE ANNUAL INVESTMENT
* The data includes new capacity additions and replacement of end-of-lifetime capacity
**The data denotes wind sector jobs by 2012
211
146
Onshore wind (USD billion/yr) 57 67
Off trackFUTURE OF WIND
1 ENERGY TRANSFORMATION PATHWAYS
AND WIND ENERGY
1.1 PATHWAYS FOR THE GLOBAL ENERGY TRANSFORMATION
The International Renewable Energy Agency (IRENA) current and planned policies (the Reference Case),
has explored global energy development options from and the second is a cleaner, climate-resilient pathway
two main perspectives to the year 2050 as part of the based largely on more ambitious, yet achievable,
2019 edition of its Global Energy Transformation report uptake of renewable energy and energy efficiency
(IRENA, 2019a). The first is an energy pathway set by measures (the REmap Case).
Box 1. PRACTICAL OPTIONS FOR GLOBAL ENERGY DECARBONISATION.
IRENA’s renewable energy roadmap, or REmap approach2 and analysis, includes several key steps
(IRENA, 2019b) :
• Identifying the current plans for global energy development as a baseline scenario (or Reference Case) as
far as 2050. This presents a scenario based on governments’ current energy plans and other planned targets
and policies, including climate commitments made since 2015 in Nationally Determined Contributions under
the Paris Agreement.
• Assessing the additional potential for scaling up or optimising low-carbon technologies and approaches,
including renewable energy, energy efficiency and electrification, while also considering the role of other
technologies.
• Developing a realistic, practical Energy Transformation scenario, referred to as the REmap Case. This calls
for considerably faster deployment of low-carbon technologies, based largely on renewable energy and
energy efficiency, resulting in a transformation in energy use to keep the rise in global temperatures this
century well below 2 degrees Celsius (°C) and closer to 1.5 °C compared to pre-industrial levels. The scenario
focuses primarily on cutting energy-related carbon-dioxide (CO₂) emissions, which make up around two-
thirds of global greenhouse gas emissions.
• Analysis of the costs, benefits and investment needs for low-carbon technologies worldwide to achieve the
envisaged energy transformation.
Note: The findings in this report consider policy targets and developments until April 2019. Any new policy
changes and targets announced since then are not considered in the analysis and therefore could
influence the findings presented in this report.
The findings in this report are based on IRENA’s climate-resilient
pathway (REmap Case), which is well below 2 °C and closer to the 1.5 °C
carbon budget levels provided in the IPCC Special Report on Global
Warming of 1.5 °C (SR1.5).
2 For more on the global roadmap and its underlying analysis, see www.irena.org/remap.
14ENERGY TRANSFORMATION PATHWAYS AND WIND ENERGY
1.2 THE ENERGY TRANSFORMATION: RATIONALE
Reducing energy-related CO₂ emissions is at the heart Secondly, air quality improvements. Air pollution
of the energy transformation. Rapidly shifting the is a major public health crisis, caused mainly by
world away from the consumption of fossil fuels that unregulated, inefficient and polluting energy sources
cause climate change and towards cleaner, renewable (fossil fuels, chemicals, etc.). The switch to clean,
forms of energy is key if the world is to reach the renewable energy sources would bring greater
agreed-upon climate goals. There are many drivers prosperity, improving the air quality in cities and
behind this transformation (Figure 1). preserving and protecting the environment. With the
rise in the use of renewables, a drop in net energy
Firstly, the rapid decline in renewable energy costs. subsidies would potentially lead to decline in health
The global weighted average cost of electricity from costs from air pollution and climate effects. The
all commercially available renewable power generation savings from reduced externalities with respect to
technologies continued to fall in 2018. For onshore wind air pollution and climate change along with avoided
projects commissioned in 2018, the global weighted subsidies outweigh the additional cost of energy in
average cost of electricity reached a low of USD 0.056 the system. For every dollar invested in transforming
per kilowatt-hour (kWh), which was 13% lower than the global energy system over the period to 2050,
in 2017 and 35% lower than in 2010 (USD 0.085/kWh) there is a payoff of at least USD 3 and potentially
(IRENA, 2019c). The costs of electricity from onshore more than USD 7, depending on how externalities are
wind are already competitive at the lower end of the valued (IRENA, 2019a).
fossil fuel cost range and are even undercutting new
fossil fuel-fired power generation costs in many cases. Thirdly, reduction of carbon emissions. The gap
With rapid cost declines in solar PV in recent years between observed emissions and the reductions that
(the levelised cost of electricity declined by 77% in are needed to meet internationally agreed climate
2018 compared to 2010 (IRENA, 2019c), albeit from a objectives is widening. The transformation of the
much higher starting point), the complementary nature global energy system needs to accelerate substantially
of these two technologies and resource availability to meet the objectives of the Paris Agreement, which
over different seasons of a year can yield a very low- aim to keep the rise in average global temperatures
cost system. In Europe, offshore wind projects are to closer to 1.5 °C in the present century, compared
increasingly competing at wholesale electricity prices to pre-industrial levels. A 70% reduction in energy-
(for example, subsidy-free bids in the Netherlands related emissions would be needed by 2050 compared
and Germany), while in the United States (US), non- to current levels (IRENA, 2019a).
hydropower renewable energy resources such as solar
PV and wind are expected to be the fastest growing
source of electricity generation in the next two years.
15FUTURE OF WIND
Transforming the global energy system would improve Finally, transforming the global energy system
energy security and enhance affordable and universal would bring significant socio-economic benefits,
energy access. For countries that depend heavily on which are key to influence any political decision. The
imported fossil fuels, energy security is a significant development of a local renewable energy industry has
issue, and renewables can provide an alternative by the potential to create jobs that can accommodate
increasing the diversity of energy sources through men and women from all disciplines and backgrounds.
local generation and thus contribute to the flexibility of If no local industries are developed, countries with
the system and resistance to shocks. Similarly, energy energy security problems would just move from
access is an area of great inequality, and renewable importing fossil fuels to renewable energy renewable
energy technologies can be adopted and applied in rural equipment (IRENA, 2019a, 2019b).
areas where the national grid has not yet been extended,
through rural electrification, community energy projects
and distributed renewable energy resources.
Figure 1: Pressing needs and attractive opportunities are driving the transformation of
the world's energy system.
REDUCED FALLING
CARBON EMISSIONS ENERGY COSTS
70% lower Renewables
fully competitive
REDUCED
IMPACT, GREATER
ECONOMIC GAIN ENERGY JOB CREATION
USD 3-7 payoff TRANSFORMATION 7 million
for each by 2050 more jobs
USD 1 spent economy-wide
IMPROVED FULL ENERGY
ENERGY SECURITY ACCESS
-64% demand 100% energy
of fossil fuels access
Note: The key drivers for energy transformation presented in this figure is based on IRENA’s REmap Case by 2050 compared to current levels.
Source: IRENA, 2019b.
CO₂ EMISSIONS REDUCTIONS AS A MAJOR GOAL
Decarbonisation of the energy sector and the reduction of carbon
emissions to limit climate change is at the heart of IRENA’s energy
transformation roadmaps, which examine and provide an ambitious yet
technically and economically feasible low-carbon technology deployment
pathway towards a sustainable and clean energy future.ENERGY TRANSFORMATION PATHWAYS AND WIND ENERGY
1.3 GLOBAL ENERGY TRANSFORMATION: THE ROLE OF WIND ENERGY
Climate change has become a major concern of this of the energy-related CO₂ emissions reductions needed
century. The Paris Agreement sets forth efforts to limit by 2050. If additional reductions from direct use of
the global temperature rise to “well below” 2 °C and renewables are considered, the share increases to 75%.
ideally to limit warming to 1.5 °C in the present century, When adding energy efficiency, the share increases to
compared to pre-industrial levels (IRENA, 2019a). To over 90% of energy-related CO₂ emissions reductions
realise the climate targets of the Paris Agreement, a needed to set the world on a pathway to meeting the
profound transformation in the global energy landscape Paris Agreement (Figure 2) (IRENA, 2019a).
is essential. Such a transformation is possible with the
rapid deployment of low-carbon technologies replacing The energy transformation would also boost
conventional fossil fuel generation and uses. gross domestic product (GDP) by 2.5% and total
employment by 0.2% globally in 2050. In addition, it
To set the world on a pathway towards meeting the would bring broader social and environmental benefits.
aims of the Paris Agreement, energy-related CO₂ Health, subsidy and climate-related savings would be
emissions would need to be reduced by around 3.5% worth as much as USD 160 trillion cumulatively over a
per year from now until 2050, with continued reduction 30-year period. Thus, every dollar spent in transforming
afterwards. The transition to increasingly electrified forms the global energy system provides a payoff of at least
of transport and heat, when combined with increases in USD 3 and potentially more than USD 7, depending on
renewable power generation, would deliver around 60% how externalities are valued (IRENA, 2019a).
Figure 2: R
enewables and efficiency measures, boosted by substantial electrification, can provide over 90% of
necessary CO₂ emission reductions by 2050.
Energy related CO2 emissions (Gt/yr)
35
CURRENT PLANS 33 Gt in 2050
Buildings Electrification
30 of heat and
Buildings transport w/RE: Renewable
Transport 36% energy and
25 electrification
District heat deliver 75%
Transport 70% emission
reductions
Renewable of emission
energy:
20 resulting reductions
Power 39%
District heat from the
Energy
15 Transformation Energy
Industry efficiency
and others:
Power
25%
10
ENERGY TRANSFORMATION
9.8 Gt in 2050
5
Industry
0
2010 2015 2020 2025 2030 2035 2040 2045 2050
Note: Renewables” implies deployment of renewable technologies in the power sector (wind, solar PV, etc.) and end-use direct applications (solar
thermal, geothermal, biomass). “Energy efficiency” contains efficiency measures deployed in end-use applications in the industry, buildings
and transport sectors (e.g., improving insulation of buildings or installing more-efficient appliances and equipment). “Electrification” denotes
electrification of heat and transport applications, such as deploying heat pumps and electric vehicles.
Source: IRENA, 2019a.
17FUTURE OF WIND
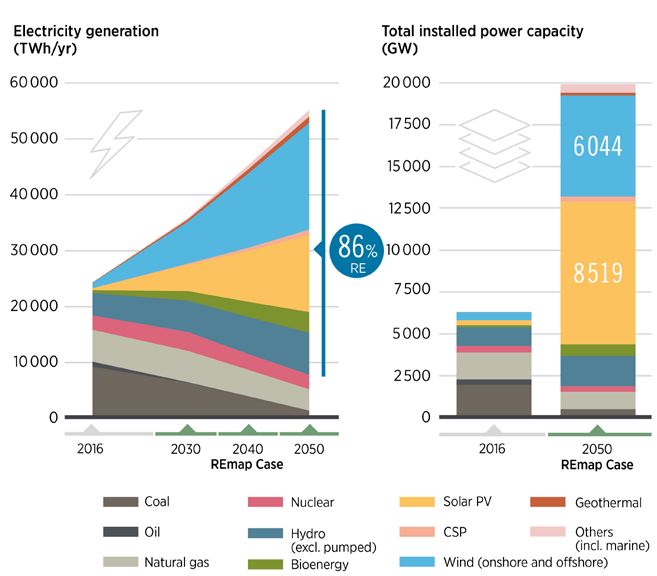
Scaling up electricity from renewables would be Wind and solar energy will lead the way in the
crucial for the decarbonisation of the world’s energy transformation of the global electricity sector.
system. The most important synergy of the global Wind power would supply more than one-third of
energy transformation comes from the combination of total electricity demand by 2050 and is well aligned
increasing low-cost renewable power technologies and with energy transformation scenarios of various
the wider adoption of electric technologies for end-use institutions, clearly highlighting the importance of
applications in transport and heat. To deliver the energy scaling up the wind power generation share in order
transition at the pace and scale needed would require to decarbonise the energy system in the next three
almost complete decarbonisation of the electricity sector decades (Box 2). This represents a nearly nine-fold
by 2050. The REmap Case sets a pathway to achieve a rise in the wind power share in the total generation
renewables share of 86% in the power generation mix mix by 2050 compared to 2016 levels. However, in
by 2050 (Figure 3). On the end-use side, the share of the context of total installed capacity by 2050, much
electricity in final energy consumption would increase larger capacity expansion would be needed for solar
from just 20% today to almost 50% by 2050. The share PV (8 519 GW)3 as compared to wind (6 044 GW)
of electricity consumed in industry and buildings would given the average lower capacity factors achieved by
double. In transport, it would increase from just 1% today solar PV projects.
to over 40% by 2050 (IRENA, 2019a).
WIND POWER – THE PROMINENT GENERATION SOURCE BY 2050
Wind and solar energy will lead the way for the transformation of the global
electricity sector. Onshore and offshore wind together would generate more
than one-third (35%) of total electricity needs, becoming the prominent
generation source by 2050.
3 A similar IRENA working paper exploring the role of solar PV in the context of global energy transformation to 2050 is forthcoming and will be available
for download at https://www.irena.org/publications.ENERGY TRANSFORMATION PATHWAYS AND WIND ENERGY
Figure 3: W
ind would be the largest generating source, supplying more than one-third of total electricity
generation needs by 2050.
Source: IRENA, 2019a.
19FUTURE OF WIND
Box 2. T
HE PREDOMINANCE OF WIND POWER IN
VARIOUS ENERGY TRANSFORMATION SCENARIOS.
An analysis of energy scenarios shows that there is increasing consensus on the important role that wind
power would play in the energy mix in the coming decades. A comparison analysis shows a correlation
between total power generation and the share of wind power generation in the total generation mix, and the
scenarios with high wind power generation shares are also the ones with high total power generation. The highest
wind share can be observed in IRENA’s REmap Case, which positions wind as the major renewable technology
source essential to decarbonise the power sector. However, in the REmap Case, with wind accounting for 86%
of overall renewable power generation by 2050, the total generation needed is less than in some other energy
scenarios with similar wind shares, such as DNV GL, 100% renewables by Teske, Shell Sky and Greenpeace
(Figure 45). The wind generation share of 35% in IRENA’s REmap Case is well in line with the World Wind Energy
Association’s global study published in 2015, which foresees a global wind power share of 40% for the year 2050
(WWEA, 2015a). However, updated assumptions of modelling scenarios to meet net-zero/1.5 °C targets would
almost certainly have higher wind shares.
Figure 4: Comparison of scenarios for the global energy transition, with a focus on wind power generation.
Wind generation projections in energy scenarios
40%
Wind share in generation
IRENA-REMAP (2050)
35% TESKE (2050)
IRENA REMAP (2040) GREENPEACE
30% DNV-GL (2050)
25% EQUINOR SHELL-SKY (2050)
BNEF (2050) IEA- WEO SDS (2040)
20%
15%
10%
5%
0 10 000 20 000 30 000 40 000 50 000 60 000 70 000 80 000
Total electricity generation (TWh)
Source: Shell – Sky Scenario (Shell, 2018); IEA – World Energy Outlook Sustainable Development Scenario (WEO-SDS) (IEA, 2018a);
DNV GL, 2018; Teske, 2019; BNEF, 2018; Greenpeace, 2015 and Equinor, 2018a.
The comparison also suggests that the goal of limiting global temperature increase to well below 2 °C would
be most achievable with lower overall energy demand (total primary energy supply), while achieving the
1.5 °C target would also require significant structural and lifestyle changes.
However, despite the similarities, differences can also be found in the scenarios in aspects such as the
level of electrification in end-use sectors and reductions in CO₂ emissions. The divergence in results can
be explained mainly by the different objectives behind the scenarios. For many, the analysis is defined by the
need to reduce energy-related CO₂ emissions to limit the temperature increase to between 2 °C and 1.5 °C.
Others have modelled the energy system in a more conservative (business-as-usual) way.
With regard to the total installed capacity levels by 2050, IRENA’s REmap Case, with more than 6 000 GW
of wind capacity, is in the median range compared to other energy transition scenarios. IRENA’s wind
capacity projection for 2050 is well below Greenpeace’s wind capacity projection of more than 8 000 GW and
Teske’s 100% renewables scenario with total wind capacity of around 7 700 GW, while higher than the World
Energy Council’s projection of around 3 000 GW.
20ENERGY TRANSFORMATION PATHWAYS AND WIND ENERGY
ENERGY-RELATED CARBON EMISSIONS contributes to major emissions reduction potential by
MITIGATION POTENTIAL OF WIND POWER 2050. This is due mainly to large deployments of wind
power replacing conventional power generation sources
Deploying more than 6 000 GW of wind power by utilising the ample resource availability with the best
capable of generating more than one-third of total technological solutions at better resource locations
electricity needs in 2050 would potentially mitigate a across various regions and benefiting from drastic
massive amount of energy-related carbon emissions cost reductions, significant end-use electrification
(6.3 gigatonnes (Gt) of CO₂), which is more than one- of transport and heat applications, shifting energy
quarter of the total emissions reduction potential from demand to electricity that can then be supplied by
renewables and energy efficiency measures (Figure 5). wind (either directly or in-directly, for example power-
Among all low-carbon technology options, wind power to-hydrogen) and rising socio-economic benefits.
Figure 5: Wind power would contribute to 6.3 Gt of CO₂ emissions reductions in 2050, representing 27%
of the overall emissions reductions needed to meet Paris climate goals.
2050: >90% emissions reductions from
Annual energy-related CO2 emissions (Gt CO2/yr)
renewables, energy efficiency measures
40 with substantial electrification.
34.5 Reduction potentials in 2050
35 33.1
Wind; 27%
30
Energy efficiency; 24%
25
Solar PV; 21%
20
Other RE (power) and
15 electrification of heat
and transport; 16%
10
Renewables
5 9.8 (direct end-use); 12%
0
Current plans and policies Energy Transformation
2018 2050 2050
ACCELERATED WIND POWER DEPLOYMENTS CONTRIBUTES TO CO₂
EMISSIONS REDUCTIONS
Among all low-carbon technology options, accelerated deployment
of wind power when coupled with deep electrification would contribute
more than one-quarter of the total emissions reductions needed
(nearly 6.3 Gt CO₂) in 2050.
21FUTURE OF WIND
2 THE EVOLUTION AND FUTURE
OF WIND MARKETS
2.1 EVOLUTION OF THE WIND INDUSTRY
Rising concerns about climate change, the health technology advancements and cost reductions
effects of air pollution, energy security and energy along with the establishment of key wind energy
access, along with volatile oil prices in recent associations (Figure 6). By 2020, onshore wind is set
decades, have led to the need to produce and use to consistently offer a less expensive source of new
alternative, low-carbon technology options such electricity than the least-cost fossil fuel alternative in
as renewables. Wind power has been a pioneering most regions (IRENA, 2019c).
renewable technology in recent decades. In terms
of total installed capacity, wind power is the leading Wind power will remain a key renewable energy
renewable energy technology after hydropower, with option in the coming decades. This report sheds light
more than half a terawatt installed globally as of the on the prominent role of wind power in transforming
end of 2018. Along with solar, wind also dominated total the global energy landscape by 2050. The following
renewable capacity additions, with around 43 GW of sections cover an accelerated deployment pathway for
wind capacity added globally in 2018 (IRENA, 2019d). wind power (onshore and offshore) until 2050 under the
REmap Case in IRENA’s global energy transformation
The evolution of the wind industry has been roadmap, along with perspectives on cost reductions,
remarkable, and in the last four decades several technology trends and the need to prepare future grids
milestones have been achieved in installations, to integrate rising wind power shares.
22THE EVOLUTION AND FUTURE OF WIND MARKETS
Figure 6: Overview of key milestones achieved by the wind industry since 1982.
1982 2001
• First three-bladed wind turbine (22 kW) model • World Wind Energy Association
• European Wind Energy Association (EWEA) (WWEA) was formed
currently named as WindEurope was formed • >1 MW Average onshore wind turbine ratings
1991
• First offshore wind farm (Vindeby) in Denmark
2008
• Global wind power capacity reached 100 GW
2005
2014 • Global Wind Energy Council
• >1 million jobs in wind energy sector (GWEC) was formed
2016
• Wind power provided 4% KEY MILESTONES
of global electricity
IN WIND INDUSTRY
2017
• First floating offshore wind farm (Hywind)
in Scotland 2019
• First zero-subsidy offshore wind auction • 10 MW commercially available
in Germany offshore wind turbine
2018
• Global installed wind capacity: 564 GW
• Global average onshore wind auction price (projects assigned
in 2018 and to be commissioned by 2020): 46 USD/MWh
• 1.2 million jobs in wind energy sector
Source:
Equinor, 2017; GWEC, 2019a; IRENA, 2019d, 2019e, 2019a, 2019f, 2015; MHI Vestas, 2018; Wind Power Offshore, 2017; WindEurope, 2019a; WWEA, 2015
WIND ENERGY – A FAST GROWING AND MATURE RENEWABLE
ENERGY TECHNOLOGY
Wind power is one of the fastest growing, most mature and
cost-competitive (onshore) renewable energy technologies.
23FUTURE OF WIND
2.2 ONSHORE WIND OUTLOOK TO 2050
ACCELERATED UPTAKE AND EMERGING continuing the historical pace. In addition, a global
MARKETS onshore wind installed capacity of 5 044 GW by 2050
represents only a fraction (5.3%) of the global wind
The deployment of renewables has accelerated since resource potential of at least 95 000 GW, as estimated
2010, reaching record levels and outpacing annual by a technical committee of the World Wind Energy
additions of conventional power capacity in many Association (WWEA) in available wind resource
regions. Among all renewable energy technologies, studies (WWEA, 2014). The total land area required
wind power, after hydropower, has dominated the for global onshore installation of 5 044 GW by 2050 is
renewables industry for many decades. At the end between 1 008 800 square kilometres (km²) (around
of 2018, the global cumulative installed capacity of the size of Ethiopia) and 1 664 520 km² (around the
onshore wind power reached 542 GW (IRENA, 2019d). size of Iran). In terms of total disrupted area, the range
Wind power has increased at an average compound would be between 50 440 km² (around the size of Costa
annual growth rate (CAGR) of more than 21% since Rica) and 83 226 km² (around the size of Azerbaijan) .4
2000 (IRENA, 2019d).
During the initial years of wind power deployment,
Considering the ample resource availability, large Europe was the key enabler for global wind
market potential and cost competitiveness, onshore installations. In 2010, the region accounted for 47%
wind is expected to drive overall renewables of global onshore installations. Since 2010, rapid
growth in several regions over the next decade. wind deployment has been observed in other regions,
For the next three decades, onshore wind power especially China with a CAGR of around 27%. By 2018,
installations would need to have a year-on year CAGR China outpaced Europe to become the largest onshore
of more than 7% (Figure 7). This implies that the total wind market with nearly one-third of the global
installed capacity of onshore wind would grow more installed capacity (IRENA, 2019d). The European
than three-fold by 2030 (to 1 787 GW) and nearly Union (EU) had a record year in 2018 in terms of
ten-fold by 2050, nearing 5 044 GW, compared to financing new wind capacity, with almost 16.7 GW of
542 GW in 2018. An average CAGR of more than 7% future wind power projects attaining Final Investment
for the next three decades is well below what has Decision. Almost USD 29.4 billion was invested in
been achieved since 2000, with the historical average new wind farms in 2018, with onshore wind financed
CAGR between 2000 and 2018 at around 21%. This at an average of USD 1.54 million per megawatt
shows the feasibility and ease of scaling up onshore (MW), and offshore wind at USD 2.57 million per MW
wind installations in the next three decades by simply (WindEurope, 2019b).
4 The land area was estimated using 2.5 MW/km² as the lower end, and 5 MW/km² as the upper end.
24THE EVOLUTION AND FUTURE OF WIND MARKETS
Figure 7: Onshore wind cumulative installed capacity would grow more than three-fold by 2030 and nearly
ten-fold by 2050 relative to 2018 levels.
Onshore wind – Global
6 000
Historical Projections
21.3% 7.2%
CAGR 2000–18 CAGR 2019–50 5 044 (2050)
5 000
Cumulative installed capacity (GW)
4 000
3 000
1 787 (2030)
2 000
1 000 542 (2018)
17 (2000)
0
2000 2005 2010 2015 2020 2025 2030 2035 2040 2045 2050
Source: Historical values based on IRENA’s renewable capacity statistics (IRENA, 2019d) and future projections based on IRENA analysis (IRENA, 2019a).
RAPID GROWTH IN ONSHORE WIND POWER TOTAL INSTALLATIONS TO 2050
The global installed capacity of onshore wind power would increase
three-fold by 2030 (to 1 787 GW) and ten-fold by 2050
(to 5 044 GW) compared to installations in 2018 (542 GW).
Asia – mainly China (at more than 2 000 GW) and the next three decades. Finding a sustainable way to
India (at more than 300 GW) – would continue to meet growing energy needs is a core development
lead global onshore wind power installations, with challenge for the continent. Given the rich resource
the region accounting for more than half (2 656 GW) potential of renewable sources including wind, a major
of the total global capacity by 2050 (Figure 8). After shift from reliance on fossil fuel energy sources and
Asia, significant onshore wind power deployments rapidly increasing renewable shares in the energy mix
would occur in North America (mainly the US, at is crucial for the continent. As such, prioritising the
more than 850 GW), where the installed capacity rapid deployment of onshore wind projects among
would grow more than ten-fold from 2018 levels, other renewables projects from now would result in
reaching around 1 150 GW by 2050. Africa would be a total installed onshore wind capacity of more than
a key market for rapid onshore wind deployment in 500 GW by 2050.
25FUTURE OF WIND
Annual onshore wind capacity additions have Along with the growth in net wind capacity
increased gradually since the beginning of this additions over the next three decades, another key
century, with an initial drop observed in 2010 issue is the replacement of wind turbines that are
followed by fluctuating annual capacity additions approaching the end of their technical lifetimes,
through the end of 2018. So far, 2015 has been and the repowering of existing projects to extend
the record year – adding 65 GW of onshore wind their operating lifetimes. System-level maintenance
capacity to the global power capacity mix – with and upgrades, including replacing older components
smaller amounts in subsequent years due mainly to with advanced technologies, can help enhance the
the expiration of a policy support scheme in China socio-economic benefits attained from the initial
(Figure 9). installations. So far, there are no regulatory or
political drivers for repowering. Some turbines could
With continuous technology advancements and last many more years, and only in some markets is it
cost reductions, along with the right policies and economically attractive to replace them (for example,
supportive measures in place, the onshore wind through the Production Tax Credit in the US (AWEA,
market would grow rapidly over the next three 2019; US DOE, 2019)). Repowering also makes
decades. The total onshore wind capacity additions it possible to use the most advanced turbines at
would need to be scaled up more than three-fold by locations that have the best onshore wind resources
2030 (closer to 150 GW/year) and more than four-fold (for example, Delabole wind farm in the United
by 2050 (more than to 200 GW/year). Considering just Kingdom (UK).
the net capacity additions (without replacements),
a peak would near 180 GW/year in 20 years, which Repowering has started in various countries
is almost four-fold higher than the onshore wind in recent years (Box 3). When supported by
capacity global additions of 45 GW in 2018. A slight adequate supportive measures including financial
decline in new capacity additions could be observed incentives and price signals, and by stable regulatory
from 2040, attributed to many reasons including the frameworks along with prioritised projects planning
availability of land, increasing deployment of offshore and local acceptance measures (WindEurope, 2017a),
wind as well as aiding the growth of other renewables repowering could open more opportunities for newer
technologies (including hybrid projects). installations, especially in the final two decades to
2050, which is not yet considered in the analysis. As
such, the onshore wind annual market by 2050 would
still be two-to three-fold larger than the current
market in terms of new installations, and more
than four-fold larger with replacements of existing
capacities. Accounting for new capacity additions
as well as replacements, the total annual additions
would stabilise at an average of 200 GW/year in the
last decade to 20505.
5 The analysis in this report accounts for “replaced capacity” as just the installed capacity or projects that approaches the end of the technical lifetime.
This does not include any new capacity. Basically, it indicates the difference between the “old” and the “new” capacity additions.
26You can also read