September 2018 | Economic & Revenue Forecast - Colorado Legislative Council Staff - Colorado General ...
←
→
Page content transcription
If your browser does not render page correctly, please read the page content below

Colorado Legislative Council Staff
September 2018 | Economic & Revenue Forecast

                                      September 20, 2018
September 2018 | Economic & Revenue Forecast

Contents
Executive Summary ........................................................................................................................................... 3
General Fund Budget Overview ...................................................................................................................... 5
School Finance Outlook .................................................................................................................................. 13
TABOR Outlook ............................................................................................................................................... 15
General Fund Revenue .................................................................................................................................... 21
Cash Fund Revenue ......................................................................................................................................... 27
Economic Outlook ........................................................................................................................................... 35
Colorado Economic Regions .......................................................................................................................... 69
Appendix: Historical Data .............................................................................................................................. 90

Contributors
Kate Watkins, Chief Economist
Marc Carey
Larson Silbaugh
Louis Pino
Greg Sobetski
Meredith Moon
Debbie Grunlien

Special thanks to Jerry Schierkolk, David Williams, and Suzanne Keim. Cover photos of the Colorado
State Capitol, courtesy of Suzanne Keim.

                         Legislative Council Staff • State Capitol Building • Denver, Colorado 80203
                (303) 866-3521 • LCS.Economist@state.co.us • http://leg.colorado.gov/EconomicForecasts
               Legislative Council Staff is the nonpartisan service agency of the Colorado General Assembly.
Executive Summary

This report presents the budget outlook based on current law and the September 2018 General Fund
revenue, cash fund revenue, and TABOR forecasts. It also includes summaries of expectations for the
U.S. and Colorado economies and an overview of current economic conditions in nine regions of the
state.

General Fund Budget Outlook

FY 2017-18       Based on preliminary data, the General Fund ended FY 2017-18 with a $1.27 billion
                 reserve, equal to 12.3 percent of General Fund operating appropriations. This
                 amount is $599.5 million above the required 6.5 percent reserve. Revenue subject to
                 TABOR exceeded the Referendum C cap by $16.2 million, which will require a
                 TABOR refund in tax year 2018 equal to $37.5 million. This amount includes
                 $21.3 million carried over from the FY 2014-15 TABOR refund obligation and will be
                 refunded via the reimbursements to local governments for the senior homestead and
                 disabled veterans property tax exemptions. The year-end General Fund reserve is
                 $55.1 million higher than expected in June 2018, primarily reflecting higher than
                 expected collections from each of the major revenue streams.

FY 2018-19       In FY 2018-19, the General Fund is expected to end the year with a 9.3 percent reserve,
                 $229.5 million above the 7.25 percent statutory reserve. Revenue subject to TABOR
                 is expected to exceed the Referendum C cap by $209.4 million, resulting in a TABOR
                 refund in tax year 2019. The TABOR refund obligation is expected to be refunded
                 via reimbursements to local governments for the property tax exemptions, with the
                 remaining balance refunded through the six-tier sales tax refund mechanism.

                 The General Assembly is projected to have $1.16 billion, or 9.2 percent, more to spend
FY 2019-20
Unbudgeted       or save in the General Fund than what is budgeted to be spent and saved in
                 FY 2018-19. Any changes to revenue or expenditures in FY 2018-19 will change this
                 amount. Revenue is expected to exceed the Referendum C cap by $174.8 million,
                 resulting in a FY 2020-21 TABOR refund of the same amount.

Higher than usual forecast uncertainty. Forecast estimates are subjected to a higher margin of error
than usual due to recent changes in federal tax law. Unusual shifts in taxpayer behavior occurred as
a result of the passage of the federal Tax Cuts and Jobs Act. Income tax collections were boosted in
FY 2017-18 as taxpayers rushed to claim deductions set to expire and business activity increased on
the fiscal stimulus of federal tax cuts. While risks for the current fiscal year forecast are skewed to the
upside, the longer-term impacts of these federal tax policy changes are yet to be seen with risks
skewed to the downside.

The recent U.S. Supreme Court ruling in South Dakota v. Wayfair, Inc. poses an upside risk to the sales
tax revenue forecast, as the ruling may allow states to require that out-of-state (including online)
retailers collect and remit sales taxes. The ruling and subsequent state administrative or legislative
changes could result in an estimated maximum of $110 million in additional sales tax collections per
year. However, it is likely that collections will come in lower than this amount in the near term.

September 2018                              Executive Summary                                       Page 3
School Finance Outlook
The September forecast includes a brief update on school finance funding for FY 2019-20, based on
updated expectations for inflation, General Fund diversions required to the State Education Fund, and
Federal Mineral Lease payments. Relative to budgeted amounts for FY 2018-19, the state aid
requirement is expected to increase by $186 million in FY 2019-20. While the local share is also
projected to increase by $109 million based on higher property values, the overall total program
requirement is expected to increase by $295 million due to inflation and enrollment growth. In
FY 2019-20, the State Education Fund’s contribution to school funding is expected to fall $62 million
relative to the current budget year. This amount assumes a constant budget stabilization factor and
State Education Fund ending balance of $100 million in FY 2019-20.

Cash Fund Revenue
In FY 2017-18, preliminary collections data suggest that cash fund revenue subject to TABOR fell
17.1 percent to $2.30 billion year-over-year. The drop in revenue is attributable to the elimination of
the Hospital Provider Fee and the 2.9 percent sales tax on retail marijuana pursuant to
Senate Bill 17-267. These reductions more than offset expected increases in transportation-related and
severance tax revenue. Cash fund revenue subject to TABOR will rebound from this lower level,
growing by 7.1 percent to $2.46 billion in FY 2018-19. Cash fund collections will increase an additional
2.2 percent to $2.52 billion in FY 2019-20 as most revenue sources are projected to rise.

Economic Outlook
The U.S. and Colorado economies are firing on all cylinders and near-term growth prospects through
the remainder of the decade remain bright. The nation is on track to post the longest economic
expansion in U.S. history. Healthy levels of job creation, robust consumer spending, rising incomes,
and solid business activity are propelling the U.S. and Colorado economies, even as global trade
uncertainties create headwinds. Favorable tax treatment under the federal Tax Cuts and Jobs Act is
strengthening business activity beyond what would otherwise be expected at this stage of the business
cycle. The tax policy change is accelerating short-term growth, but may be borrowing against future
investment. The expansion of the Colorado economy continues to outpace that of the nation. The
upswing in energy prices is proving a boon to Colorado producers, reigniting the state’s oil and gas
industry.

Driven by a continued increase in consumer spending and robust business investment, the U.S. and
Colorado economies are expected to accelerate in 2018. The economies will continue to expand in
2019 and 2020, although at slower rates as the economic expansion matures.

While risks to the economic outlook in 2018 remain skewed to the upside, downside risks threaten
longer-term economic activity as international trade disputes continue to escalate, risks in global
markets continue to mount, and the U.S. expansion grows old. Discussion of the economic outlook
begins on page 35, and summaries of expectations for the U.S. and Colorado economies are
respectively presented in Tables 19 and 20 on pages 67 and 68.

September 2018                             Executive Summary                                     Page 4
General Fund Budget Overview This section presents the General Fund overview based on current law. A summary of the General Fund overview is shown in Table 1. This section also presents expectations for the following: statutory transfers to transportation and capital construction funds (Table 2); the availability of tax policies dependent on revenue collections (Table 3); General Fund rebates and expenditures (Table 4); and cash fund transfers to and from the General Fund (Table 5). FY 2017-18 Based on preliminary collections data, the General Fund ended the year with a 12.3 percent reserve, $599.5 million above the required 6.5 percent statutory reserve, as shown in Table 1 (line 19). Relative to June forecast expectations, General Fund revenue came in $103.7 million higher on stronger than expected sales, individual income, and corporate income tax collections. Revenue subject to TABOR exceeded the Referendum C cap by $16.2 million, requiring a $37.5 million TABOR refund in FY 2018-19. This amount includes $21.3 million carried over from the FY 2014-15 refund obligation and will be refunded in FY 2018-19 via reimbursements to local governments for the senior homestead and disabled veterans property tax exemptions. FY 2018-19 The General Fund is expected to end the year with a 9.3 percent reserve, $229.5 million higher than the budgeted 7.25 percent reserve. Revenue is expected to exceed the Referendum C cap by $209.4 million, resulting in a TABOR refund for tax year 2019. The TABOR refund obligation will be refunded in FY 2019-20 via local government reimbursements for the senior homestead and disabled veteran property tax exemptions, and the remaining balance above the required reimbursements will be refunded via the six-tier sales tax refund mechanism to taxpayers for the 2019 tax year. Relative to the June 2018 forecast, expectations were increased on higher than expected revenue collections in FY 2017-18 that carry forward into the current year through the beginning balance, as well as a slight increase in forecast expectations for FY 2018-19. FY 2019-20 (Unbudgeted) Because a budget has not yet been enacted for FY 2019-20, Table 1 (lines 21 and 22) shows the amount of revenue available in FY 2019-20 relative to the amount budgeted to be spent or saved in FY 2018-19. Based on this forecast, the General Assembly will have $1.16 billion, or 9.2 percent, more to spend or save in the General Fund than what is budgeted for FY 2018-19. This amount assumes current law, and is largely attributable to the FY 2017-18 and FY 2018-19 excess reserves carrying into subsequent years, and increased General Fund revenue expectations. This amount will change when the General Assembly enacts changes that impact revenue or expenditures in FY 2018-19 and with changes in revenue expectations through FY 2019-20. September 2018 General Fund Budget Overview Page 5
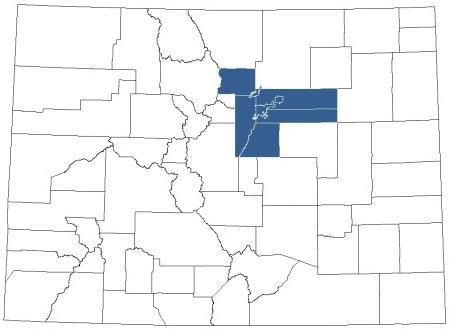
Table 1
                                                  General Fund Overview
                                                        Dollars in Millions

                                                                            FY 2017-18    FY 2018-19     FY 2019-20     FY 2020-21
Funds Available                                                             Preliminary     Estimate       Estimate       Estimate
 1 Beginning Reserve                                                             $614.5     $1,274.4       $1,042.8              *
 2 General Fund Revenue                                                       $11,723.2    $12,296.2      $12,872.0      $13,232.2
 3 Transfers from Other Funds (Table 5)                                           $98.8        $40.2          $19.8          $19.7
 4 Total Funds Available                                                      $12,436.5    $13,610.8      $13,934.6              *
 5    Percent Change                                                             14.8%          9.4%           2.4%              *
Expenditures                                                                Preliminary     Budgeted        Estimate       Estimate
 6 General Fund Appropriations Subject to Limit1                             $10,430.9      $11,217.7              *              *
 7 TABOR Refund Obligation Under Art. X, §20, (7)(d)2                             $37.5        $209.4        $174.8            $0.0
 8 Rebates and Expenditures (Table 4)                                            $290.6        $245.4        $141.3         $138.6
 9 Transfers to Other Funds (Table 5)                                            $207.9        $195.1        $166.0         $177.7
10 Transfers to the State Education Fund Pursuant to SB 13-234                    $25.3         $25.0            NA             NA
11 Transfers to Transportation Fund (Table 2)                                     $79.0        $495.0        $200.0           $50.0
12 Transfers to Capital Construction Funds (Table 2)                             $112.1        $180.5          $60.0           $0.0
13 Total Expenditures                                                        $11,183.4      $12,568.0              *              *
14 Percent Change                                                                 7.3%         12.4%               *              *
15 Accounting Adjustments3                                                         21.3             *              *              *

Reserve                                                                     Preliminary     Budgeted        Estimate       Estimate
16 Year-End General Fund Reserve                                              $1,274.4       $1,042.8              *              *
17    Year-End Reserve as a Percent of Appropriations                            12.3%          9.3%               *              *
18 Statutorily Required Reserve4                                                 $674.9        $813.3              *              *
19 Amount in Excess or (Deficit) of Statutory Reserve                            $599.5        $229.5              *              *
20    Excess Reserve as a Percent of Expenditures                                 5.4%          1.8%               *              *
Perspective on FY 2019-20 (Unbudgeted Year)                                                                                Estimate
                                                                        5
 Amount Available in FY 2019-20 Relative to FY 2018-19 Expenditures
 21 Amount in Excess or (Deficit) of 7.25% Statutory Reserve                                                $1,161.6               *
 22     As a Percent of Prior-Year Expenditures                                                                9.2%                *
Addendum                                                                    Preliminary      Estimate       Estimate      Estimate
23 Percent Change in General Fund Appropriations                                  6.6%           7.5%              *             *
24 5% of Colorado Personal Income Appropriations Limit                       $14,133.3      $14,405.2      $14,983.8     $15,852.9
25 Transfers to State Education Fund Per Amendment 23                           $617.0         $660.2         $689.7         $706.5
Totals may not sum due to rounding. *Not estimated. NA = Not available.
1Includes  the FY 2018-19 budget package adopted during the 2018 legislative session. FY 2018-19 includes $225 million in PERA
disbursements pursuant to SB 18-200.
2Pursuant to Section 24-75-201(2), C.R.S., the TABOR refund obligation is required to be set aside during the year it is collected to

be refunded in the following fiscal year.
3The $21.3 million adjustment in FY 2017-18 represents the FY 2017-18 TABOR refund obligation that is carried forward from the

FY 2014-15 refund obligation; this amount is already restricted in the fund balance.
4
  The required reserve is calculated as a percent of operating appropriations, and is required to equal to 6.5 percent in FY 2017-18
and 7.25 percent in FY 2018-19 and each year thereafter. Pursuant to SB 18-276, certificates of participation are included in the
statutory reserve requirement calculation beginning in FY 2018-19.
5This scenario holds appropriations in FY 2019-20 equal to appropriations in FY 2018-19 (line 6) to determine the total amount of

money available relative to FY 2018-19 expenditures, net of the obligations in lines 7 through 12.

      September 2018                               General Fund Budget Overview                                        Page 6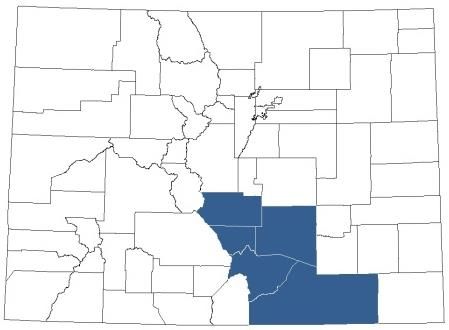
Higher than Usual Forecast Uncertainty
Significant shifts in taxpayer behavior occurred in anticipation of and following the passage of the
Federal Tax Cuts and Jobs Act, resulting in unusual income tax collection patterns at the end of
calendar year 2017 and start of 2018 that cannot easily be isolated from underlying economic
conditions. The federal tax bill enacts changes starting in the 2018 tax year, data for which will not be
available until next year. Even with collections data, the revenue impact of the federal tax changes
cannot be isolated from economic processes or underlying taxpayer behavior. Considering these
factors, revenue estimates in this forecast are subject to a higher than usual margin of error.

The recent U.S. Supreme Court ruling in South Dakota v. Wayfair, Inc. poses a modest upside risk to
the sales tax revenue forecast, as the ruling may allow states to require that out-of-state (including
online) retailers collect and remit state taxes. As many of the largest online retailers already collect
and remit Colorado sales tax, the impact of this ruling and/or subsequent legislative or administrative
requirements for out-of-state retailers are expected to increase state collections by an estimated
maximum of $110 million per year. It is likely that collections will come in lower than this amount in
the near term.

General Fund Transfers to Transportation and Capital Construction
Table 2 shows statutory transfers from the General Fund to transportation and capital
construction funds. Transfers in Table 2 are also shown in lines 11 and 12 of Table 1. Other
non-infrastructure-related transfers to and from the General Fund are summarized in Table 5.

                                             Table 2
                         Infrastructure Transfers from the General Fund
                                             Dollars in Millions

         Capital Construction Funds              2017-18       2018-19       2019-20       2020-21
           SB 17-263                              $109.2
           SB 17-262                                                $60.0       $60.0
           HB 18-1006                                                $0.7
           HB 18-1173                                $2.9
           HB 18-1340                                              $119.8
         Total                                    $112.1           $180.5       $60.0           $0.0

         Transportation Funds                    2017-18       2018-19       2019-20       2020-21
           SB 17-262                               $79.0
           SB 18-001*                                              $495.0      $200.0         $50.0
         Total                                     $79.0           $495.0      $200.0         $50.0
        *Pursuant to SB 18-001, transfers for FY 2019-20 and subsequent years depend on ballot measure
        outcomes during the 2018 and/or 2019 elections. The amounts shown assume current law
        and exclude provisions under the adoption of ballot measures.

Transportation transfers. Senate Bill 17-267, which authorized up to $1.88 billion in certificates of
participation (COPs) for transportation projects, repealed transfers from the General Fund to the
Highway Users Tax Fund previously specified by Senate Bill 17-262 and requires General Fund
appropriations for COP-related lease payments beginning in FY 2018-19. Under current law, these
General Fund appropriations are expected to total $100 million annually by FY 2021-22. These
appropriations are included in line 6 of Table 1, and not included in Table 2.

September 2018                          General Fund Budget Overview                                     Page 7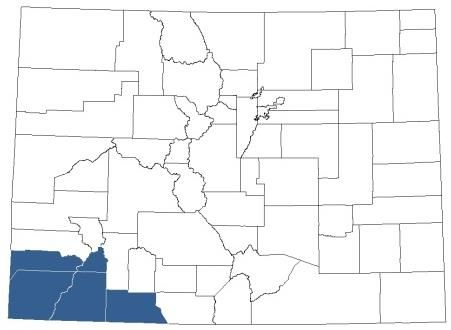
Senate Bill 18-001 created one-time General Fund transfers for transportation of $495 million in
FY 2018-19 and $150 million in FY 2019-20. These amounts are apportioned to the State Highway
Fund, a new Multimodal Transportation Options Fund, and county and municipal governments.
Beginning in FY 2018-19, Senate Bill 18-001 authorizes 20 years of additional transfers to the State
Highway Fund. Unless voters approve one or more transportation funding ballot measures, the
amount of the transfers is set at $50 million per year. Table 2 assumes a transportation transfer amount
of $200 million for FY 2019-20, including the $150 million one-time transfer and a $50 million ongoing
annual transfer. Depending on ballot outcomes, the amounts annually transferred under SB 18-001
could be $122.6 million or be eliminated. In these scenarios, the last three years of lease-purchase
agreements under SB 17-267 would also be repealed and the state would instead issue transportation
revenue bonds.
Tax Policies Dependent on Revenue Conditions
Several tax expenditures are “triggered” by certain state revenue conditions. These include the
historic preservation income tax credit, the low-income child care expenses tax credit, and partial
refundability of the conservation easement income tax credit. Table 3 summarizes the availability of
these tax policies, each of which is described in greater detail below.
Historic preservation income tax credit available in tax year 2018. The historic preservation
income tax credit will be triggered in tax year 2018 based on the December 2017 forecast, which
expected sufficient revenue to grow appropriations by more than 6.0 percent in FY 2017-18. Based
on this September 2018 forecast, the credit is also expected to be available in tax year 2019.
Low-income child care expenses tax credit unavailable in tax year 2017. The low-income child
care expenses income tax credit was extended for three years under House Bill 17-1002. Based on
the June 2017 forecast, this credit was unavailable in 2017, but will be available for tax years 2018
through 2020.
Partial refundability of the conservation easement tax credit will be available in tax year 2018
and is expected to be available in tax years 2019 and 2020. The conservation easement income
tax credit is available as a nonrefundable credit in most years. In tax years when the state refunds
a TABOR surplus, taxpayers may claim an amount up to $50,000, less their income tax liability, as
a refundable credit. Because a TABOR surplus was collected in FY 2017-18, the credit will be
partially refundable in tax year 2018. This forecast expects a TABOR surplus in FY 2018-19 and
FY 2019-20. If a surplus occurs in these fiscal years, partial refundablility of the credit will be
available in tax years 2019 and 2020.
September 2018 General Fund Budget Overview Page 8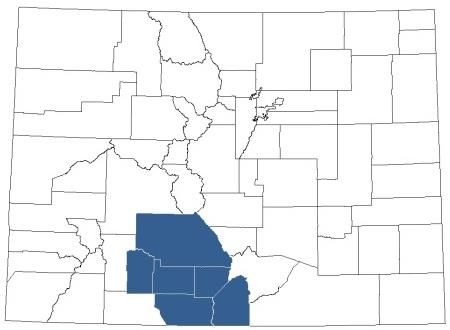
Table 3
                  Availability of Tax Policies Dependent on Revenue Conditions

 Tax Policy                                          Availability Criteria                Availability
 Historic Property Preservation               December forecast immediately      Available in tax years 2013
 Income Tax Credit                            before the tax year when the       through 2015. Not available
 (Section 39-22-514, C.R.S.)                  credit becomes available that      in tax years 2016 and 2017.
                                              predicts sufficient General Fund   Available in tax year 2018
 Revenue reduction of less than
                                              to grow General Fund               and expected to be available
 $1.0 million per tax year*
                                              appropriations by 6 percent.       in tax year 2019. Repealed
                                                                                 tax year 2020.
 Low-Income Child Care Expenses               June 2017 forecast predicting      Available in tax years 2014
 Tax Credit                                   sufficient General Fund surplus    through 2016. Not available
 (Section 39-22-119.5, C.R.S)                 to fund the tax credit.            in tax year 2017. Available
                                                                                 in tax years 2018 to 2020.
 Revenue reduction of at least
                                                                                 Repealed tax year 2021.
 $6.0 million per tax year*
 Conservation Easement Tax Credit             TABOR surplus.                     Available in tax year 2018
 Partial Refundability                                                           due to the FY 2017-18
 (Section 39-22-522 (5)(b)(II), C.R.S.)                                          TABOR surplus. Unavailable
                                                                                 in tax years 2016, 2017.
 Revenue reduction of at least
                                                                                 Expected to be available in
 $5.0 million per tax year*
                                                                                 tax years 2019 and 2020,
                                                                                 and unavailable in 2021.
 *Estimates may differ in future analyses.

September 2018                               General Fund Budget Overview                               Page 9
Table 4
                                                           General Fund Rebates and Expenditures
                                                                           Dollars in Millions

                                                             Preliminary      Percent       Estimate      Percent       Estimate      Percent        Estimate      Percent
Category                                                     FY 2017-18       Change      FY 2018-19      Change      FY 2019-20      Change       FY 2020-21      Change
Senior and Veterans Property Tax Exemptions                       $132.3          -3.0        $139.5          5.5         $147.0          5.3          $154.6          5.2
   TABOR Refund Mechanism 1                                          NA                        -$37.5                    -$147.0                      -$154.6
Cigarette Rebate                                                    $9.7          -5.6           $9.9           1.6         $9.7           -2.4          $9.4           -2.4
Old-Age Pension Fund                                               $91.3          -5.4          $86.1          -5.6        $80.8           -6.2         $75.7           -6.4
Aged Property Tax and Heating Credit                                $4.9         -43.3           $5.6          14.3         $5.5           -1.8          $5.4           -1.2
Older Coloradans Fund2                                             $25.0         150.0          $10.0         -60.0        $10.0            0.0         $10.0            0.0
Interest Payments for School Loans                                  $5.0          47.7           $7.4          48.7         $9.2           24.3         $10.4           12.2
Firefighter Pensions                                                $4.4           3.5           $4.4           0.9         $4.4            1.1          $4.5            0.9
Amendment 35 Distributions                                          $0.8          -3.8           $0.8          -1.0         $0.8           -1.0          $0.8           -0.9
Marijuana Sales Tax Transfer to Local Governments                  $17.3          17.2          $19.1          10.6        $20.8            9.0         $22.4            7.5
Total Rebates and Expenditures                                    $290.6           2.0        $245.4          -15.6       $141.3          -42.4        $138.6           -1.9
Totals may not sum due to rounding. NA = Not applicable.
1Pursuant   to SB 17-267, local government reimbursements for these property tax exemptions are the first TABOR refund mechanism used to meet the prior year's refund
obligation.
2Pursuant to HB 16-1161, 95 percent of excess General Fund allocations for local government reimbursements for property tax exemptions are transferred to the senior services

account in the Older Coloradans Fund. The amount for FY 2017-18 includes $15.0 million pursuant to this requirement.

 September 2018                                                        General Fund Budget Overview                                                         Page 10
Table 5
Cash Fund Transfers
Dollars in Millions
Transfers to the General Fund 2017-18 2018-19 2019-20 2020-21
HB 05-1262 Amendment 35 Tobacco Tax $0.8 $0.8 $0.8 $0.8
SB 13-133 &
Limited Gaming Fund $17.2 $18.6 $19.0 $18.9
SB 18-191
SB 15-249 &
Marijuana Tax Cash Fund $0.04
HB 16-1418
HB 16-1413 Water Quality Improvement Fund
SB 17-260 Severance Tax Funds $34.3
SB 17-265 State Employee Reserve Fund $26.3
HB 18-1338 Reduced Revenue Severance Tax Transfers $20.2 $20.8
Total Transfers to the General Fund $98.8 $40.2 $19.8 $19.7
Transfers from the General Fund 2017-18 2018-19 2019-20 2020-21
SB 11-047 Bioscience Income Tax Transfer to OEDIT $4.4 $4.6 $4.9 $5.0
HB 13-1193 Advanced Industries Export Acceleration Fund $0.3
SB 14-215 Marijuana Tax Cash Fund $108.1 $123.6 $134.7 $144.8
HB 14-10161 Procurement Technical Assistance Cash Fund $0.2 $0.2 $0.2
SB 15-244 &
State Public School Fund $37.8 $21.6 $23.6 $25.4
SB 17-267
SB 15-245 Natural Hazard Mapping Fund $0.7
HB 16-1161 2 Veterans Grant Program Fund (conditional) $0.8
HB 16-1288 Industry Infrastructure Fund $0.3 $0.3
HB 17-1282 Veterinary Loan Education Repayment Fund $0.1
SB 17-255 Technology Advancement and Emergency Fund $2.0 $2.0
SB 17-259 Severance Tax Tier-2 Natural Resource Funds $10.0
SB 17-261 2013 Flood Recovery Account $12.5
HB 18-1171 School Finance Mid-Year Adjustment $30.7
HB 18-1323 Pay For Success Contracts Pilot Program Funding $0.4 $0.5 $0.5
HB 18-1338 Reduced Revenue Severance Tax Transfers $20.0
HB 18-1363 Recommendations Of Child Support Commission $0.04 $0.04 $0.04
Behavioral Health Care Ombudsperson Parity
HB 18-1357
Reports $0.01
HB 18-1423 Rural Fire Protection District Equipment Grants $0.3
SB 18-016 Transitioning from Criminal & Juvenile Justice System $2.0 $2.0 $2.0
SB 18-132 1332 State Waiver Catastrophic Health Plans $0.01
SB 18-280 Tobacco Litigation Settlement Cash Fund $20.0
Total Transfers from the General Fund $207.9 $195.1 $166.0 $177.7
Net General Fund Impact ($109.1) ($154.9) ($146.2) ($158.0)
1The transfer is contingent upon the receipt of at least $200,000 in gifts, grants, and donations by the relevant contractor.
2
HB 16-1161 requires transfers to the Older Coloradans Fund of any excess General Fund moneys set aside for reimbursements to local
governments for the Senior Homestead and Disabled Veteran property tax exemptions.
September 2018 General Fund Budget Overview Page 11This page intentionally left blank.
School Finance Outlook
This section presents information on the outlook for school finance from a state budgetary perspective
for the coming budget year (FY 2019-20) and incorporates new information from the September 2018
forecast for income tax diversions to the State Education Fund, Federal Mineral Lease payments, and
changes in inflation expectations. No new information is available for FY 2018-19 school finance
funding, which was initially determined through passage of the 2018 Long Bill (House Bill 18-1322)
and the 2018 School Finance Act (House Bill 18-1379).
Figure 1 illustrates budgeted and expected state aid and local shares for school funding for FY 2018-19
and FY 2019-20. For FY 2019-20, the state aid requirement is expected to increase by $186 million on
a year-over-year basis due to the factors described below.
Total program requirements will increase by How is state aid determined?
$295 million. The estimated funded pupil count is
expected to increase by about 5,250 pupils on a Subject to available budgetary
year-over-year basis. In addition, inflation expectations resources, the difference between
for 2018 have increased since the March forecast from total program funding requirements
2.9 percent to 3.2 percent. and the local share is the amount the
state must cover through state
Revenue available for the local share will increase by equalization payments, or state aid.
$109 million, as assessed values are projected to grow by
3.9 percent in FY 2019-20 on a year-over-year basis.
FY 2019-20 estimates are based on the December Figure 1
2017 Legislative Council Staff forecasts for K-12 Expectations for School Finance Funding
enrollment and assessed values, which will be Dollars in Millions
updated in December 2018. Enrollment is a major
determinant of required formula funding (total State Aid
program), since funding is allocated on a per State Aid +$186 million
pupil basis. Similarly, assessed values on real $4,546 $4,732
property determine a school district’s property Local Share
Local Share +$109 million
tax base, which, along with a school district’s total
program mill levy, is the major determinant of the $2,543 $2,652
local share of school district funding.
Appropriations are subject to change. The final
Budgeted Projected
appropriation for state aid in FY 2018-19 will be FY 2018-19 FY 2019-20
made through passage of the mid-year
supplemental bill for the Colorado Department of Education. The initial appropriation for state aid in
FY 2019-20 will be made through passage of the 2019 Long Bill and the 2019 School Finance Act.
State Education Fund. For FY 2019-20, the available contribution for school finance from the State
Education Fund is expected to fall by $62 million, meaning that the General Fund requirement will
increase by $124 million on a year-over-year basis. These estimates assume a $100 million ending
September 2018 School Finance Outlook Page 13balance for the State Education Fund in FY 2019-20, and the budget stabilization factor is maintained
at its current level of $672.4 million.
The Colorado Constitution requires the State Education Fund to receive one-third of one percent of
taxable income (see Table 1, line 25). In addition, the General Assembly has at different times
authorized the transfer of additional moneys from the General Fund to the State Education Fund.
Money in the State Education Fund is required to be used to fund kindergarten through twelfth grade
public education. Figure 2 shows a history and forecast for revenue sources to the State Education
Fund through the end of the forecast period.
General Fund transfers to the State Education Fund pursuant to Senate Bill 13-234, which have
occurred annually since FY 2013-14, are scheduled to end after FY 2018-19. In FY 2018-19, the State
Education Fund is expected to receive $685.2 million, with higher amounts in the following year
resulting from growth in taxable income among Colorado taxpayers.
Figure 2
Revenue to the State Education Fund
Dollars in Millions
$1,800
Transfer totals in bold $1,598
$1,600
Other Transfers*
$1,400 Senate Bill 13-234
$1,200 Constitutionally Required**
$1,073
$1,000
$718
$800
$638 $584 $642 $685 $690
$545 $548 $565
$600 $461 $38.7
$371 $231 $59
$400 $121 $329
$660 $690 $706
$486 $479 $520 $523 $540 $617
$200 $340 $329 $371 $408
$0
Source: Colorado State Controller’s Office and Legislative Council Staff forecast (f).
* Includes transfers under SB 09-260 for FY 2008-09, SB 11-183 and SB 11-156 for FY 2011-12,
HB 12-1338 for FY 2012-13 and FY 2013-14, and HB 14-1342 for FY 2014-15.
**One-third of one percent of federal taxable income is required be dedicated to the State Education
Fund under Article IX, Section 17 of the Colorado Constitution.
September 2018 School Finance Outlook Page 14TABOR Outlook
This section presents the outlook for the state’s TABOR situation through FY 2020-21. Forecasts for
TABOR revenue are summarized in Table 8 on page 19 and illustrated in Figure 3, which also provides
a 13-year history of the TABOR limit base and the Referendum C cap.
Figure 3
TABOR Revenue, TABOR Limit Base, and the Referendum C Cap
Dollars in Billions
Amounts Above (Below) the Referendum C Cap: TABOR Surplus
$16
FY 2017-18: $16.2 million*
$15 FY 2018-19: $209.4 million
FY 2019-20: $174.8 million
$14
FY 2020-21: ($163.3 million)
$13
Referendum C Cap
$12 Bars Represent Revenue
$11 Subject to TABOR
$10 TABOR Limit Base
$9
$8 Referendum C
Five-Year Timeout Period
$7
Source: Office of the State Controller and Legislative Council Staff.
*The refund amount for FY 2017-18 differs from the surplus amount because it includes under-refunds
and other adjustments to previous TABOR surpluses.
FY 2017-18. Preliminary, unaudited figures indicate that state revenue subject to TABOR exceeded
the Referendum C cap by $16.2 million in FY 2017-18. The surplus triggers a TABOR refund in the
current FY 2018-19. The state is required to refund a total of $37.5 million, including the $16.2 million
surplus FY 2017-18 and an outstanding $21.3 million from the FY 2014-15 refund obligation. These
amounts have been set aside in the General Fund and do not require the expenditure of new revenue
collected in the current fiscal year. Pursuant to state law enacted in Senate Bill 17-267, the TABOR
obligation will be refunded to taxpayers via reimbursements paid to county governments for property
tax exemptions allowed to seniors and disabled veterans.
State revenue subject to TABOR exceeded June forecast expectations by $122.6 million, as shown in
Table 6. Both General Fund and cash fund revenue subject to TABOR came in higher than anticipated.
The most significant discrepancies were attributable to corporate income tax revenue, which was
$66.9 million higher than anticipated, and individual income tax revenue, which was $53.0 million
higher than anticipated.
FY 2018-19. State revenue subject to TABOR is expected to exceed the Referendum C cap by
$209.4 million, triggering an equivalent TABOR refund obligation in FY 2019-20. Expectations for the
TABOR surplus amount have increased relative to the June forecast because of upward revisions to
the General Fund revenue forecast. Shown in Figure 4, the FY 2018-19 surplus is expected to exceed
September 2018 TABOR Outlook Page 15the amount that can be refunded via FY 2019-20 reimbursements for property tax expenditures,
triggering a six-tier sales tax refund on 2019 tax forms to be filed in early 2020.
FY 2019-20. State revenue subject to TABOR is expected to exceed the Referendum C cap by
$174.8 million, triggering an equivalent TABOR refund obligation in FY 2020-21. The surplus amount
is projected to be smaller than that estimated for FY 2018-19 because state revenue subject to TABOR
is expected to grow less quickly than the Referendum C cap. Like the estimated FY 2018-19 surplus,
this surplus would be refunded via both property tax exemption reimbursements and a sales tax
refund to all full-year resident Colorado taxpayers.
FY 2020-21. State revenue subject to TABOR is expected to fall short of the Referendum C cap by
$163.3 million in FY 2020-21 as the economy slows. If no TABOR surplus is collected, the state will
not be required to issue TABOR refunds in FY 2021-22.
Table 6
Change in TABOR Estimates, June 2018 to September 2018
Dollars in Millions
FY 2017-18 September June Change
TABOR Revenue $13,718.6 $13,596.0 $122.6
General Fund1 $11,416.6 $11,323.3 $93.3
Cash Funds1 $2,302.0 $2,272.6 $29.4
Referendum C Cap $13,702.4 $13,689.0 $13.4
Revenue Above (Below) Ref C Cap $16.2 ($93.0) $109.2
FY 2018-19 September June Change
TABOR Revenue $14,569.5 $14,472.2 $97.3
General Fund1 $12,105.2 $12,010.7 $94.5
Cash Funds1 $2,464.3 $2,461.6 $2.7
Referendum C Cap $14,360.1 $14,346.0 $14.1
Revenue Above (Below) Ref C Cap $209.4 $126.2 $83.2
FY 2019-20 September June Change
TABOR Revenue $15,181.1 $15,081.4 $99.7
General Fund1 $12,663.7 $12,591.2 $72.5
Cash Funds1 $2,517.3 $2,490.2 $27.1
Referendum C Cap $15,006.3 $14,977.3 $29.0
Revenue Above (Below) Ref C Cap $174.8 $104.1 $70.7
1These figures may differ from the revenues reported in the General Fund and cash fund
revenue summary tables because of accounting adjustments across TABOR boundaries.
TABOR surplus. Article X, Section 20 of the Colorado Constitution (TABOR) limits state fiscal year
spending, the amount of revenue the state may retain and either spend or save each year. The limit is
equal to the previous year’s limit or revenue, whichever is lower, adjusted for inflation, population
growth, and any revenue changes approved by voters. Referendum C, approved by voters in 2005, is
September 2018 TABOR Outlook Page 16a permanent voter-approved revenue change that raises the amount of revenue the state may spend
or save.
Referendum C allowed the state to spend all revenue collected
Fiscal Year Spending
above the limit during a five-year timeout period covering
FY 2005-06 through FY 2009-10. Beginning in FY 2010-11, The legal term used by TABOR
Referendum C allows the state to retain revenue collected above to denote the amount of revenue
the TABOR limit base up to a capped amount. The cap is based TABOR allows the state to keep
on the amount of state revenue collected in FY 2007-08, adjusted and either spend or save.
annually for inflation and population growth. It is grown from
the prior year’s cap regardless of the level of revenue collected. Senate Bill 17-267 applied a
$200.0 million one-time downward adjustment to the Referendum C cap in FY 2017-18 and requires
that the cap for FY 2018-19 and subsequent years be grown from this reduced level.
State law requires adjustments to the refund amount based on over-refunds or under-refunds of
previous TABOR surpluses. Most recently, revenue exceeded the Referendum C cap in FY 2014-15,
prompting TABOR refunds on returns for tax year 2015. The amount of the FY 2014-15 refund
obligation is now estimated to have been $159.1 million, adjusting for accounting errors discovered
after refunds were issued. To date, the state has refunded $137.8 million of this obligation. The
remaining $21.3 million is required to be refunded with the FY 2017-18 TABOR surplus.
TABOR refund mechanisms. Figure 4 shows the mechanisms that will be used to issue TABOR
refunds during the forecast period. The FY 2017-18 TABOR refund obligation will be administered
via the property tax reimbursement TABOR refund mechanism. Pursuant to Senate Bill 17-267, state
law requires that any TABOR surplus first be refunded via this mechanism. The exemption disburses
state funds to counties, school districts, and special districts to offset these governments’ property tax
loss associated with the senior homestead and disabled veteran property tax exemptions. Amounts
required to be refunded are encumbered in the General Fund in the year in which a surplus is collected
and paid to local governments in the following fiscal year. Table 1, line 7, shows the General Fund
encumbrance for TABOR refunds in the year when a surplus is collected. Table 4 shows the portion
of the property tax exemption reimbursements to be paid from the prior year TABOR surplus as a
subtraction from the new General Fund obligation that would otherwise exist for these
reimbursements. The reduction in new obligations is also reflected on Table 1, line 8.
Because the FY 2018-19 and FY 2019-20 TABOR surpluses are expected to exceed the respective
amounts of FY 2019-20 and FY 2020-21 property tax reimbursements, the amount by which the surplus
exceeds the reimbursement in each year will be refunded via the sales tax refund mechanism. Table 7
shows the amounts that will be disbursed to taxpayers of different incomes via the sales tax
mechanism. In tax year 2019, the amount refunded via the sales tax refund mechanism is expected to
exceed $15 per full-year resident taxpayer. In this case, statute requires that revenue be distributed in
six tiers according to a taxpayer’s adjusted gross income. In tax year 2020, the amount refunded via
the sales tax refund mechanism is expected to be less than $15 per taxpayer, requiring equal refunds
to all taxpayers. In any case, taxpayers filing jointly receive twice the amount refunded to single tax
filers.
September 2018 TABOR Outlook Page 17Figure 4
TABOR Refund Mechanisms
Dollars in Millions
Sales Tax Refunds
$62.4
$20.1
$147.0 $154.6
Reimbursements for
Property Tax Exemptions
No
$37.5 Surplus
TABOR Refund for: 2017-18 2018-19 2019-20 2020-21
Refunded in Tax Year: 2018 2019 2020
Table 7
Average Taxpayer TABOR Refunds
Via the Six-Tier Sales Tax Refund Mechanism
FY 2018-19 Refund Obligation, Tax Year 2019 Forecast
Adjusted Gross Income Single Filers Joint Filers
Up to $40,600 $12 $24
$40,600 to $86,900 $15 $30
$86,900 to $135,400 $18 $36
$135,400 to $183,900 $20 $40
$183,900 to $230,100 $22 $44
$230,100 and Up $35 $70
FY 2019-20 Refund Obligation, Tax Year 2020 Forecast
Adjusted Gross Income Single Filers Joint Filers
Up to $41,400 $6 $12
$41,400 to $88,500 $6 $12
$88,500 to $137,900 $6 $12
$137,900 to $187,300 $6 $12
$187,300 to $234,400 $6 $12
$234,400 and Up $6 $12
September 2018 TABOR Outlook Page 18Table 8
TABOR Limit and Retained Revenue
Dollars in Millions
Preliminary Estimate Estimate Estimate
FY 2017-18 FY 2018-19 FY 2019-20 FY 2020-21
TABOR Revenue
1 General Fund1 $11,416.6 $12,105.2 $12,663.7 $13,008.3
2 Cash Funds1 $2,302.0 $2,464.3 $2,517.3 $2,465.0
3 Total TABOR Revenue $13,718.6 $14,569.5 $15,181.1 $15,473.3
Revenue Limit
4 Allowable TABOR Growth Rate 4.5% 4.8% 4.5% 4.2%
5 Inflation (from Prior Calendar Year) 2.8% 3.4% 3.2% 2.9%
6 Population Growth (from Prior Calendar Year) 1.7% 1.4% 1.3% 1.3%
7 TABOR Limit Base $11,220.7 $11,759.3 $12,288.5 $12,804.6
8 Voter Approved Revenue Change (Referendum C) $2,481.6 $2,600.7 $2,717.8 $2,668.6
9 Total TABOR Limit / Referendum C Cap $13,702.4 $14,360.1 $15,006.3 $15,636.6
10 TABOR Revenue Above (Below) Referendum C Cap $16.2 $209.4 $174.8 ($163.3)
Retained/Refunded Revenue
11 Revenue Retained under Referendum C2 $2,481.6 $2,600.7 $2,717.8 $2,668.6
12 Fiscal Year Spending (revenue available to be spent or saved) $13,702.4 $14,360.1 $15,006.3 $15,473.3
13 Outstanding Underrefund Amount3 $21.3
14 Revenue Refunded to Taxpayers4 $37.5 $209.4 $174.8 $0.0
15 TABOR Reserve Requirement $411.1 $430.8 $450.2 $464.2
Totals may not sum due to rounding.
1These figures may differ from the revenues reported in General Fund and cash fund revenue summary tables because of accounting adjustments across
TABOR boundaries.
2Revenue retained under Referendum C is referred to as “General Fund Exempt” in the budget.
3This amount is restricted in the General Fund as part of the TABOR refund obligation for FY 2014-15. It will be refunded when the state next refunds a TABOR
surplus. Under this forecast, the next surplus will be collected in FY 2018-19, and the next refund will be paid in FY 2019-20.
4Pursuant to Section 24-75-201 (2), C.R.S., revenue above the Referendum C cap is required to be set aside during the year it is collected to be refunded in
the following fiscal year. For example, excess revenue collected in FY 2014-15 was set aside in the budget for FY 2014-15 and refunded in FY 2015-16 on
income tax returns for tax year 2015.
September 2018 TABOR Outlook Page 19This page intentionally left blank.
General Fund Revenue

This section presents the Legislative Council Staff outlook for General Fund revenue, the state’s main
source of funding for operating appropriations. Table 10 on page 26 summarizes preliminary,
unaudited General Fund revenue collections for FY 2017-18 and projections for FY 2018-19 through
FY 2020-21.

FY 2017-18. Net of the diversion of the State Education Fund required under Amendment 23, General
Fund revenue totaled $11.7 billion according to preliminary figures published for FY 2017-18.
Revenue increased $1.4 billion, or 14.1 percent, relative to FY 2016-17 and came in $130.1 million, or
1.1 percent, higher than projected in the June 2018 Legislative Council Staff forecast.

General Fund revenue grew at its fastest rate since FY 1997-98. In dollar terms, the $1.4 billion increase
was the largest ever. While the extraordinary increase was attributable to a number of factors, the two
most important were a robust late-cycle economy marked by the reacceleration of the energy and
manufacturing industries, and boosted income tax payments as a result of the federal Tax Cuts and
Jobs Act (TCJA). Contributions from households (up 12.1 percent for individual income tax revenue,
and up 7.3 percent for sales tax revenue) and businesses (up 53.5 percent for corporate income tax
revenue, and up 19.4 percent for use tax revenue) indicate very strong economic conditions alongside
federal tax policy shifts favorable to the state. The General Fund also received a one-time bump from
a legal arrangement negotiated in the framework of the Tobacco Master Settlement Agreement (MSA),
which added $113.3 million in TABOR-exempt General Fund revenue.

Forecast for FY 2018-19 through FY 2020-21. Both economic performance and tax policy are expected
to drive above-trend revenue growth in FY 2018-19, with diminishing impacts in FY 2019-20 and
especially FY 2020-21 as the expansion wanes. Revenue is expected to increase 4.9 percent in the
current FY 2018-19, or 5.9 percent netting out the effects of the one-time Tobacco MSA contribution.
The pace of General Fund revenue growth is expected to slow to 4.7 percent in FY 2019-20 and
2.8 percent in FY 2020-21. Relative to the June forecast, expectations were revised upward moderately
for both FY 2018-19 (increased $103.7 million, or 0.9 percent) and FY 2019-20 (increased $82.7 million,
or 0.6 percent). A forecast for FY 2020-21 General Fund revenue was not published in June.

The forecast for General Fund revenue is consistent with the economic outlook presented beginning
on page 35, including expectations for continued employment growth and moderate increases in
consumer spending. Largely as a result of the temporary distortions caused by the TCJA, General
Fund revenue growth is unlikely to outpace its FY 2017-18 rate during the current business cycle.

Risks to the forecast. This forecast contains both upside and downside risk due to the late stage of the
economic expansion and uncertainty surrounding taxpayer behavior in response to the TCJA.
Significant shifts in taxpayer behavior occurred in anticipation of and following the passage of the
TCJA, resulting in unusual income tax collection patterns that cannot easily be isolated from
underlying economic conditions. Considering these factors, revenue estimates in this forecast carry a
higher-than-usual margin of error. Risks are weighted to the upside in the near term and to the
downside toward the end of the forecast period.

September 2018                               General Fund Revenue                                 Page 21
Table 9
                                              2018 Legislation Affecting General Fund Revenue
                                                                     Dollars in Millions

          Major Legislation Passed in 2018                                                  FY 2017-18   FY 2018-19      FY 2019-20
          Income Tax
            HB 18-1004: Continue Child Care Contribution Tax Credit                                                            -$16.2
            HB 18-1060: Income Tax Deduction for Military Retirement Benefits                                    -$1.1          -$2.9
            HB 18-1185: Market Sourcing For Bus Inc. Tax Apportionment                                   -$2.9 to $8.6 -$6.1 to $18.3
            HB 18-1190: Modify Job Creation Main Street Revitalization Act                               Impacts begin in FY 2020-21
            HB 18-1202: Income Tax Credit Leave Of Absence Organ Donation                                                      -$0.06
            HB 18-1208: Expand Child Care Expenses Income Tax Credit                                             -$1.9          -$3.7
            HB 18-1217: Income Tax Credit For Employer 529 Contributions                                        -$0.03         -$0.05
            HB 18-1267: Income Tax Credit For Retrofitting Home For Health                                       -$0.1          -$0.3
            SB 18-007: Affordable Housing Tax Credit                                                     Impacts begin in FY 2020-21
            SB 18-200: Modifications to PERA to Eliminate Unfunded Liability                     -$2.1           -$4.3          -$3.2
          Total Income Tax Impact                                                                -$2.1          -$10.3         -$32.5
          Sales and Use Tax
            HB 18-1218: Definition Of Veterans' Orgs For Sales & Use Tax                                       -$0.06         -$0.06
            HB 18-1315: Manufactured Home Sales Tax Exemption                                                                 -$0.81
            HB 18-1350: Machine Tool Sales Tax Exemption For Scrap Metal                                       -$0.04         -$0.08
          Total Sales and Use Tax Impact                                                          $0.0         -$0.10         -$0.95
          Other Miscellaneous Revenue
            SB 18-056: Civil Jurisdiction Of County Courts And Filing Fees                                     $0.01           $0.03
            SB 18-234: Human Remains Disposition Sale Businesses
Legislative impacts. Table 9 presents the General Fund revenue impacts of laws enacted during the 2018 legislative session. Legislation expected to change General Fund revenue by less than $5,000 is omitted. Certain tax expenditures are made available or unavailable depending on revenue conditions. For information on these expenditures, see Table 3. Expiring tax expenditures. This forecast estimates state revenue under current state and federal law. Under current state law, certain tax expenditures available now are scheduled to expire in future years. The forecast includes upward adjustments to revenue projections to account for the expiration of these tax expenditures. Individual income tax. The individual income tax is assessed at a rate of 4.63 percent and applies to Colorado taxable income earned by households, non-corporate businesses, fiduciaries, estates, and trusts. Most revenue from the tax is credited to the General Fund, though an amount of revenue representing one-third of one percent of taxable income is diverted to the State Education Fund (SEF) and used for school finance purposes. Payers of the tax are the most significant contributors to the General Fund. The tax accounted for just less than 60 percent of FY 2017-18 General Fund revenue, net of the SEF diversion. Individual income tax revenue surged in FY 2017-18, increasing 12.1 percent on an accrual accounting basis relative to FY 2016-17 collections. Preliminary figures for FY 2017-18 indicate that revenue exceeded June forecast expectations by $53.0 million, or 0.7 percent. The state benefitted from a confluence of favorable conditions. The robust economy supported employment growth, wage and salary appreciation, investment income gains, and improved earnings for non-corporate businesses. Additionally, more taxpayers saw their state tax burden increase than decrease as a result of how federal tax cuts were structured in the TCJA, leading to an uptick in both state tax withholding from wages and estimated state tax payments by investors. The policy generally lowered federal tax rates while expanding the amount of income to which they apply, reducing most taxpayers’ federal tax liability on net. A history of seasonally adjusted individual income tax withholding is presented in the left panel of Figure 5. Individual income tax revenue will increase 5.9 percent to just over $8.0 billion in the current FY 2018-19 before decelerating to grow 5.4 percent in FY 2019-20 and 3.1 percent in FY 2020-21. Expectations have improved modestly relative to those published in June. Growth in withholding and estimated payments attributable to the TCJA is expected to fall off after tax year 2018, but the economic expansion will sustain growth in household incomes, and thus state tax revenue, through the forecast period. The forecast anticipates slowing income tax receipts in 2020 and 2021 as the capacity for expansion thins. September 2018 General Fund Revenue Page 23
Figure 5
                          Selected Sources of General Fund Revenue
                                 Millions of Dollars Collected per Month
        Individual Income Tax Withholding                                    Sales Tax
 $550                                                  $260

 $500                                                  $240

 $450                                                  $220

 $400                                                  $200

 $350                                                  $180

 $300                                                  $160

 $250                                                  $140
     2007 2009 2011 2013 2015 2017                         2007 2009 2011 2013 2015 2017
 Source: Colorado Department of Revenue. Data seasonally adjusted by Legislative Council Staff using the
 Census x12 method. Data shown on a cash-accounting basis as three-month moving averages. Data are
 through August 2018. July and August 2018 data are preliminary.

Short-term risks to the forecast are skewed to the upside if the economy continues to excel and tax
reform impacts continue to manifest. The forecast carries more downside risk toward the end of the
forecast period as the economic outlook grows less certain.

Sales taxes. The 2.9 percent states sales tax is assessed on the purchase of goods, except those
specifically exempted, and a relatively small collection of services. Sales tax receipts are expected to
increase 6.4 percent to total $3.1 billion during the current FY 2018-19 before slowing to grow
4.9 percent in FY 2019-20 and 3.6 percent in FY 2020-21. Sales tax collections have grown quickly thus
far in 2018 (Figure 5, right), reflecting higher household incomes and strong consumer confidence.
The TCJA, the tight labor market, and rising wages have boosted consumers’ after-tax income and
motivated consumption thus far this year. Growth in sales collections is expected to moderate slightly
but continue to outpace changes in prices and population, in part because prices for retail goods will
inflate less quickly than those for other consumer goods and services.

Taxing out-of-state (online) sales. In June after the forecast was published, the U.S. Supreme Court
issued a decision in the South Dakota v. Wayfair case that changes how out of-state (including online)
retail sales are taxed. In light of this ruling, the Department of Revenue announced in September that
it will require out-of-state retailers to collect and remit sales tax on sales to Colorado consumers
beginning December 1, 2018. Retailers that have less than $100,000 in sales to Colorado consumers,
or fewer than 200 transactions with Colorado consumers, are exempt from the remittance requirement.

Many of the largest companies that sell online already collect Colorado sales tax. Sales tax remitted
by retailers that had not previously collected tax are expected to contribute between $70 million and
$110 million for a full fiscal year during the current forecast period. However, data deficiencies add
uncertainty to these estimates, as do questions of administration and compliance. As more companies
comply with the new requirement and as online sales continue to grow as a share of total retail sales,
this amount will increase.

September 2018                            General Fund Revenue                                      Page 24
Use taxes. The 2.9 percent state use tax is due when sales tax is owed but is not collected at the point of sale. Use tax revenue is largely driven by capital investment among manufacturing, energy, and mining firms. Use tax collections surged during FY 2017-18, rising 19.4 percent over the year prior, on the strength of a recovering energy industry. Revenue is expected to continue to grow during the next two fiscal years, increasing about 9.8 percent in the current FY 2018-19 before adding 4.2 percent in FY 2019-20. In FY 2020-21, use tax revenue is expected to decline slightly on expectations that oil and gas prices do not increase sufficiently to spur additional investment in the state. The forecast represents slight downward revisions to June expectations due in part to downside risks to the economy and capital expenditures. Corporate income taxes. Corporate income tax collections accelerated at the end of the year and totaled $781.9 million in FY 2017-18, a year-over-year increase of 53.5 percent. Corporate profits will remain strong through FY 2018-19 and are expected to increase 2.8 percent over year-ago levels to reach $803.5 million. As the stimulus from the federal tax law recedes, corporate income tax revenue will decline 3.1 percent in FY 2019-20 to $778.7 million and decline a further 3.4 percent in FY 2020-21 to $752.3 million. Corporate income tax revenue in FY 2017-18 exceeded the June forecast by $66.9 million. The economy and corporate profits were stronger than anticipated in the spring of 2018; however, expectations for future corporate income tax revenue are similar to those that underlie the June forecast. Compared with the June forecast, expectations for corporate income tax revenue have been increased by $0.1 million in FY 2018-19 and $7.3 million in FY 2019-20. Tobacco Master Settlement Agreement. For FY 2017-18 only, Table 10 includes $113.3 million in General Fund revenue attributable to the Tobacco Master Settlement Agreement (Tobacco MSA). Colorado receives annual TABOR-exempt Tobacco MSA payments that are generally credited to the Tobacco Litigation Settlement Cash Fund. This spring after publication of the March forecast, the Attorney General signed a supplementary agreement under the Tobacco MSA to resolve a backlog of disputes between tobacco manufacturers and the state. The supplementary agreement resulted in a one-time release of previously disputed payments from a privately managed escrow account. Under a preexisting state law, the released payments were credited to the General Fund and not to the Tobacco Litigation Settlement Cash Fund. These funds are exempt from TABOR as a damage award. No such payments are anticipated to contribute to General Fund revenue in the future. September 2018 General Fund Revenue Page 25
Table 10
                                                             General Fund Revenue Estimates
                                                                          Dollars in Millions

                                                      Preliminary      Percent        Estimate      Percent        Estimate      Percent        Estimate      Percent
     Category                                         FY 2017-18       Change       FY 2018-19      Change       FY 2019-20      Change       FY 2020-21      Change
     Excise Taxes
 1    Sales                                             $2,926.0           7.3        $3,113.3          6.4        $3,264.9          4.9        $3,382.2          3.6
 2    Use                                                $309.9           19.4         $340.4           9.8         $354.7           4.2         $352.2          -0.7
 3    Retail Marijuana Sales                             $167.6           70.5         $191.1          14.0         $208.3           9.0         $223.9           7.5
 4    Cigarette                                            $34.6          -5.5           $33.8         -2.3           $33.0         -2.4           $32.2         -2.4
 5    Tobacco Products                                     $16.4         -22.7           $23.5         43.3           $24.8          5.6           $26.3          6.1
 6    Liquor                                               $46.5           3.3           $48.2          3.6           $50.2          4.3           $52.0          3.5
 7   Total Excise                                       $3,501.0           9.8        $3,750.2          7.1        $3,936.0          5.0        $4,068.8          3.4
     Income Taxes
 8     Net Individual Income                            $7,577.2          12.1        $8,021.8          5.9        $8,451.0          5.4        $8,710.1          3.1
 9     Net Corporate Income                               $781.9          53.5          $803.5          2.8          $778.7         -3.1          $752.3         -3.4
10   Total Income Taxes                                 $8,359.1          15.0        $8,825.2          5.6        $9,229.7          4.6        $9,462.4          2.5
11     Less: Portion Diverted to the SEF                 -$617.0          14.3         -$660.2          7.0         -$689.7          4.5         -$706.5          2.4
12   Income Taxes to the General Fund                   $7,742.1          15.0        $8,165.0          5.5        $8,539.9          4.6        $8,755.9          2.5
     Other Sources
13    Estate                                                $0.0           NA            $0.0           NA            $0.0           NA            $0.0           NA
14    Insurance                                           $303.6           4.5         $315.0           3.8         $324.8           3.1         $334.0           2.8
15    Pari-Mutuel                                           $0.5         -10.7           $0.5          -8.2           $0.4          -6.4           $0.4          -5.1
16    Investment Income                                    $19.5          32.4          $25.1          28.5          $30.0          19.7          $30.8           2.5
17    Court Receipts                                        $4.4           7.6           $4.7           6.8           $4.9           5.2           $5.1           4.1
18    Tobacco Master Settlement Agreement1                $113.3           NA            $0.0           NA            $0.0           NA            $0.0           NA
19    Other Income                                         $38.9         -17.9          $35.8          -7.9          $35.9           0.3          $37.1           3.4
20   Total Other                                          $480.2          34.4         $381.1         -20.6         $396.1           4.0         $407.5           2.9
21   Gross General Fund Revenue                        $11,723.2          14.1      $12,296.2           4.9      $12,872.0           4.7      $13,232.2           2.8
     Totals may not sum due to rounding. NA = Not applicable. SEF = State Education Fund.
     1The state received $113.3 million in April 2018 as part of a supplementary legal agreement signed within the framework of the Tobacco Master Settlement Agreement.
     This amount represents a release of previously disputed payments and, per statute, is credited to the General Fund. No such revenue is expected in the future. This
     money is exempt from TABOR as a damage award.

 September 2018                                                          General Fund Revenue                                                                Page 26
You can also read