Collaborative Research: PACMAN - Cyberinfrastructure for Discovering Climate Change Impacts on Water Resources across Alaska and the Hawaiian Islands
←
→
Page content transcription
If your browser does not render page correctly, please read the page content below
Collaborative Research: PACMAN – Cyberinfrastructure for
    Discovering Climate Change Impacts on Water Resources across
                    Alaska and the Hawaiian Islands

2. Project Summary
The proposed 3-year project seeks to develop and demonstrate the capability of a Pacific Area
Climate Monitoring and Analysis Network (PACMAN). PACMAN will yield a more reliable
understanding of the impacts of climate warming on fresh water resources and communities in
Alaska and Hawaii. PACMAN’s capabilities will include: (1) real-time access to synoptic satellite
data and in-situ sensor systems, deployed throughout Alaska and the Hawaiian Islands; (2)
integration of these datasets with archival data from existing research databases and drawn from
sophisticated web-harvesting capabilities; (3) redundant archival of all data and information
products, as well as; (4) real-time distributed simulation from supercomputing centers in Alaska and
Hawaii, together with; (5) a collaborative framework for visualization and multi-dimensional mapping;
(6) development of and reliance upon open-source web tools, and finally; (7) development of an
agent-based framework for assessing societal impacts, and; (8) open distribution to researchers and
policy makers in Alaska, Hawaii, and around the world through the Internet.

Intellectual Merit
This core cyberinfrastructure to be developed under this proposal will enable research focused on
measuring and understanding the macro- and micro-scale processes that influence fresh water and
its ties to the social, cultural, and environmental wellbeing of communities in Alaska and Hawaii.
The grand challenge is to be able to understand the dynamics of the integrated climate-water-social
system from the local to global scales, as a basis for evaluating the effects of climate change on
water resources. The research builds on, supports, and integrates many disciplines including
ecology, conservation biology, chemistry, ocean and earth sciences, soil sciences, hydrology,
environmental engineering, GIS, mathematics, resilience and social-ecological modeling. The
integration framework proposed here goes beyond discipline-based inquiry and is fundamental to the
understanding of the impact of climate variability and change on ecosystems function and
biodiversity – the core objective of Alaska EPSCoR’s current RII award. It is further proposed that
the powerful, state-of-the art environmental monitoring and information management system initiated
in the previous RII Hawaii EPSCoR grants will serve as the core platform and will be further
developed to handle the complex data processing, simulation, sharing, and integration needs of
diverse teams of researchers in various targeted thematic areas.

Broader Impacts
The PACMAN consortium will not only be an effective research tool but will enhance the abilities of
Alaskan and Hawaiian communities to understand, plan for, and respond to changing climate
conditions. It will inform effective policies that build resilience in fresh water resource management at
multiple scales of control. The current proposal will build upon the successes of previous Alaska
and Hawaii EPSCoR RII educational and public outreach plans, as well as the Pacific and Alaska
Regional Integrated Science and Assessment (RISA) programs funded through NOAA.

PACMAN will incorporate capabilities that are relevant to addressing other ‘real-world’ issues that
most directly affect the coupled human-environment systems of the North Pacific, and will provide

                                                                                                        i

                                                                                                       0919608
data and information products that are appropriate for, and capable of advancing a broad suite of
cultural, economic, educational, and environmental missions across Alaska and Hawaii. It will
accomplish this in two ways: 1) through the development of a highly accessible agent-based model
capable of assessing the consequences of different hydrological scenarios and 2) through the
establishment of an External Advisory Group, consisting of members drawn from potential end-user
groups such as land holders, native Alaskan and Hawaiian groups, NGOs, K-12 schools, and
government agencies. The PACMAN consortium will look to the EAG for guidance on such issues as
research prioritization, relevant information products, appropriate data format designs, delivery
characteristics, and other matters that will optimize the societal benefits of PACMAN. The
development of PACMAN vis-à-vis partnering with the EAC will enable this consortium to better
model social-ecological system dynamics in a manner that is highly transferable to other locales.
ii
0919608TABLE OF CONTENTS
For font size and page formatting specifications, see GPG section II.C.
Total No. of Page No.*
Pages (Optional)*
Cover Sheet for Proposal to the National Science Foundation
Project Summary (not to exceed 1 page) 2
Table of Contents 1
Project Description (Including Results from Prior 25
NSF Support) (not to exceed 15 pages) (Exceed only if allowed by a
specific program announcement/solicitation or if approved in
advance by the appropriate NSF Assistant Director or designee)
References Cited 4
Biographical Sketches (Not to exceed 2 pages each) 25
Budget 9
(Plus up to 3 pages of budget justification)
Current and Pending Support 19
Facilities, Equipment and Other Resources 3
Special Information/Supplementary Documentation 0
Appendix (List below. )
(Include only if allowed by a specific program announcement/
solicitation or if approved in advance by the appropriate NSF
Assistant Director or designee)
Appendix Items:
*Proposers may select any numbering mechanism for the proposal. The entire proposal however, must be paginated.
Complete both columns only if the proposal is numbered consecutively.
0919608TABLE OF CONTENTS
For font size and page formatting specifications, see GPG section II.C.
Total No. of Page No.*
Pages (Optional)*
Cover Sheet for Proposal to the National Science Foundation
Project Summary (not to exceed 1 page)
Table of Contents 1
Project Description (Including Results from Prior 0
NSF Support) (not to exceed 15 pages) (Exceed only if allowed by a
specific program announcement/solicitation or if approved in
advance by the appropriate NSF Assistant Director or designee)
References Cited
Biographical Sketches (Not to exceed 2 pages each) 12
Budget 9
(Plus up to 3 pages of budget justification)
Current and Pending Support 6
Facilities, Equipment and Other Resources 3
Special Information/Supplementary Documentation 0
Appendix (List below. )
(Include only if allowed by a specific program announcement/
solicitation or if approved in advance by the appropriate NSF
Assistant Director or designee)
Appendix Items:
*Proposers may select any numbering mechanism for the proposal. The entire proposal however, must be paginated.
Complete both columns only if the proposal is numbered consecutively.
09196074. Project Description
4.1 Current status of consortium’s cyberinfrastructure
Building upon a long-standing tradition of collaboration and leveraging substantial university
capabilities, the Alaska and Hawaii EPSCoR jurisdictions have established a consortium which is
now poised to initiate a 3-year project to develop the Pacific Area Climate Modeling and Analysis
Network (PACMAN). PACMAN is envisioned as a distributed research environment able to support
climate monitoring, modeling and planning activities which advance understanding immediate and
long-term precipitation patterns across the North Pacific. Expanding on existing capabilities and
partnerships in remote sensing, informatics, climate and weather research, and supercomputing,
PACMAN provides new and important capabilities for real-time data acquisition, data storage, mining
and integration of heterogeneous data, advanced modeling and visualization capabilities, and
appropriate open-source distribution and sharing over the Internet.
PACMAN integrates and expands on a variety of cyber-capabilities of the consortium, including: two
Department of Defense (DoD) supported, university affiliated supercomputing facilities: the Arctic
Region Supercomputing Center (ARSC) and the Maui High Performance Computing Center
(MHPCC); the International Arctic Research Center’s IARC-JASDA Information System (IJIS), the
Geographic Information Network of Alaska (GINA) , UA’s Scenarios Network for Alaska Planning
(SNAP); UA’s Forecasting Environmental Resilience of Arctic Landscapes (FERAL), InteleSense
Technologies, Inc.,the Office of Advanced Cyberinfrastructure (OACI), the Institute for Integrated
Earth Observing Systems (IIEOS) and the Hawaii Biodiversity Mapping Program (HBMP) at UH.
Underlying all cyberinfrastructure is an advanced data network that ties together data, computing
resources, visualization capabilities and most importantly, people. Hawaii and Alaska are faced with
unique geographical challenges once one goes beyond the campus networks; they are the only two
states that rely on access to submarine fiber for intra- and interstate connectivity. A further
challenge is that Hawaii and Alaska are the only two states in the country without dark fiber
connectivity to the national research networks (Internet2 and National LambdaRail). Rather, both
states must rely on single waves (lambdas) made available through non-durable temporary
arrangements. To connect Hawaii, PACMAN will utilize the 10Gbps Australian-provided link between
UH-Manoa and the Pacific Northwest Gigapop in Seattle that has been supported by the NSF IRNC
and NIH/ NCRR “Lariat” programs. Similarly, Alaska participants will be connected via the recent
donation from GCI Alaska for use of a 10Gbps circuit between Fairbanks and the Pacific Northwest
Gigapop in Seattle. The focus of PACMAN networking work will be to ensure adequate network
performance between Alaska and Hawaii and full connectivity among all labs engaged in the
research activities proposed as exemplar uses of the PACMAN cyberinfrastructure.
4.2 Results from Relevant Prior Support
Alaska: Alaska has been an EPSCoR state since 2001 and is now on its third research
infrastructure improvement (RII) award. Previous RII awards have served to increase research
capacity in key scientific areas for Alaska, including cold regions infrastructure, high latitude
contaminants, environmental physiology and population genetics. The current (Phase III) grant is
funding a groundbreaking program applying an integrative approach to biology, physical science and
social science to reach a deeper understanding of resilience and vulnerability in the North.
Alaska EPSCoR has made a significant impact on the research and development enterprise in
Alaska. It has raised the profile of research at the University of Alaska (UA) by helping to build
research development offices at each main campus, as well as creating new, effective cross-campus
1
0919608communication and coordination of research among both UA faculty and administrators. It has built
connections to Alaska’s rural campuses by funding research and outreach activities there. It has
raised the profile of research statewide by triggering creation of the State Committee on Research
(SCoR), comprising leaders in academia, state government and the private sector.
Alaska EPSCoR has been an effective advocate for state funding for new research buildings, such
as the Integrated Sciences Building at the University of Alaska Anchorage (UAA) and the proposed
Bioscience building at the University of Alaska Fairbanks (UAF). Alaska EPSCoR also has used
NSF funding directly to improve physical research infrastructure such as major equipment.
The bulk of Alaska’s NSF EPSCoR funding, however, has gone toward building research capacity
among faculty and students. Since 2001, a total of 36 faculty members, working throughout the state
of Alaska, have been hired or supported partially through Alaska EPSCoR funds. Faculty research
also has been facilitated through numerous internal awards and other funding mechanisms,
including 38 postdoctoral positions; 33 research seed grants; 28 grants for early-career researchers;
11 equipment grants; 11 faculty course buyouts; and four outreach grants.
This funding has been leveraged into millions more in research funds. Since 2001, Alaska EPSCoR-
affiliated researchers have obtained more than $64 million in external funding and have published
more than 400 refereed articles. As shown in Table 4.2.1, the first ten months of Phase III is keeping
pace or improving in all of these key areas:
Table 4.2.1. Extramural Grant Funding to EPSCoR-Affiliated UA Faculty
PHASE FACULTY # OF AWARDS FUNDING TOTAL JOURNAL ARTICLES
1(01-04) 69 86 $26 million 116
2(04-07) 56 110 $29 million 175
3(07-5/08) 127 28 $9 million 42
Alaska EPSCoR has sponsored research by a significant number of graduate and undergraduate
students, 191 graduate and 97 undergraduate fellowships in all. Numerous travel grants also have
allowed students and faculty to disseminate their research and to network with peers.
In addition, Alaska EPSCoR maintains an active community outreach program. Its K-12 programs
have involved 119 directly-funded K-12 students. Hundreds more have taken part in one or more of
Alaska EPSCoR’s innovative outreach programs, which focus mostly on rural Alaska Natives.
Furthermore, business outreach through the Alaska Small Business Innovation Research (SBIR)
Bridge Grant program has resulted in millions of dollars in contracts to national agencies.
Alaska EPSCOR has maintained a commitment to diversity. Of its 288 undergraduate and graduate
fellowships, for example, 139 have gone to women, 35 to Asians, 11 to Native Alaskans and 2 to
African-Americans. And EPSCoR’s diversity has increased markedly over time: for example, of 27
2007-08 graduate fellows, 15 are women, 2 are Native Alaskans, 5 are Asian-Americans, 3 are
disabled, 3 are first-generation students, and 6 are non-traditional students. Six of nine 2008 Early-
Career Fellows are women or minorities. Eight of the 11 2007-08 faculty buyout recipients are
women.
Hawaii: Hawaii has successfully used its first two EPSCoR awards to develop nationally competitive
programs in the three interrelated disciplines of Evolutionary Genetics, Ecosystems Research and
Information Technology for Environmental Research. This has been accomplished in part because
HI EPSCoR has engaged and gained support from top-level University of Hawaii (UH) System
administrators, State officials, and key business leaders through the development of the EPSCoR
2
0919608Statewide Committee. Strategic discussions focus on the statewide relevance and impact of ongoing
research, especially in relation to economic development. An early step towards success was the
EPSCoR-enabled hiring of 13 new faculty in these interdisciplinary areas that added to the state's
intellectual infrastructure. Substantial investments were also made in the state’s institutional
infrastructure (buildings, equipment, and administrative capacity). The dividends paid by these
investments have been substantial. As illustrated in Table 4.2.1, EPSCoR-affiliated UH faculty have
obtained more than $69M in extramural funding from 2003-2007. Substantial and consistent
increases in the number of proposals submitted and the values of the awards during this period
indicate a continuing trend toward the improving competitiveness of our program.
Table 4.2.2. Extramural Grant Funding to EPSCoR-Affiliated Faculty
YEAR PROPOSALS PROPOSALS SUCCESS AGGREGATE
SUBMITTED AWARDED RATE VALUE
2003 39 29 74% $7,841,019
2004 65 48 74% $10,517,737
2005 57 32 56% $12,334,894
2006 91 71 78% $25,245,500
2007 85 40 47% (31 pending) $13,367,898
Researchers involved in the EPSCoR program have also established a solid base of scientific
excellence and intellectual merit as documented by the publications that have been generated by the
faculty, students and staff. Over 200 articles written by EPSCoR-affiliated faculty and their students
were published in peer reviewed journals between 2003 and 2007; a similar number of technical
reports and presentations were delivered to various government departments, non-government
agencies, and professional societies. An equally important contribution resulting from past support is
the students who have been trained by the EPSCoR scientists and educators who have contributed
to the training of 363 students, 240 of whom were female. This cohort of students includes
substantial numbers of individuals under-represented in S&T fields: 87 Native Hawaiian/Pacific
Islander, 36 Filipino, 26 Hispanic, 10 Native American, and 2 African-American students.
This large and diverse body of knowledge now serves the general scientific community but also lays
the foundation for Track 2. The EPSCoR programs in both Hawaii and Alaska have contributed to
advancing our states’ goal of providing a well-trained, home-grown workforce. In order to build
sustainability of Alaska’s and Hawaii's increasing research competitiveness we must continue to
improve the state’s intellectual resources (in the form of advanced capabilities of faculty, and of
Science, Technology, Engineering and Mathematics (STEM)-trained students injected into the
state's workforce), infrastructural resources (e.g., environmental monitoring equipment and
substantially enhanced and interconnected cybertechnology capabilities), and institutional
cooperation (e.g., enhanced collaboration between campuses, and state agencies associated with
STEM-based economic development) will contribute to the sustainability of Alaska’s and Hawaii's
trajectory of increasing research competitiveness.
4.3 Cyberinfrastructure-enabled Science and Engineering Projects
4.3.1 Introduction
The cyberinfrastructure we seek to build is composed of four elements: computing and storage
hardware, networked sensors and remote sensing data, integrative software, and human expertise.
The proposed cyberinfrastructure adds new capabilities building on existing UAF and UH expertise
3
0919608in supercomputing, sensor deployment in remote environments, satellite remote sensing, web
services software development, and environmental and human systems modeling. The new
hardware and improved sensor connectivity will be the foundation for cyberinfrastructure-enabled
science and engineering in the extreme north and south environments of the westernmost United
States.
Alaska and Hawaii are situated at the Northern and Southern margins of the North Pacific Ocean,
respectively. They both, however, face particularly immense challenges with fresh water availability
as climate variability continues to increase. Temperature over Alaska has risen by about 2-3oC since
the mid-20th century [e.g. Whitfield 2003], along with which atmosphere circulation and weather
patterns and associated amount and distribution of precipitation have changed [e.g. Zhang et al.
2004; 2008]. Life in the extreme, dry conditions of Interior and Northern Alaska seasonally depends
upon near-surface waters perched on a rapidly thawing (Romanovsky et al., 1999; Osterkamp et al.,
1999; Serreze et al., 2000) underlayment of permafrost. Many of Alaska’s rivers and streams are
sourced in alpine and tidewater glaciers most of which are undergoing unprecedented retreat
associated with increasing air temperatures (Hinzman et al, 2005; Molina, 2007). The Hawaiian
Islands have also felt the effects of a changing climate. In Honolulu, Hawaii, the average
temperature has increased 4.4°F over the last century, and precipitation has decreased
approximately 20% over the last 90 years (Karl et al., 1996).
In both Alaska and Hawaii, social, economic, and environmental wellbeing depend critically on
understanding future precipitation trends to guide effective water-use policies and collective social
response. However, accurately projecting rainfall trends in a warming climate requires a fuller
understanding and synthesis of several key factors:
1. Variability of and global-warming-forced changes in PDO, ENSO, and storm tracks. Situated at
the north and south ends of the North Pacific Ocean, the interannual and decadal climate
variability of Alaska and Hawaii are predominantly and interactively governed by two of the three
most prominent global-scale leading modes: the Pacific Decadal Oscillation (PDO) and the El
Nino-Southern Oscillation (ENSO) (e.g., Mantua and Hare 2002; Newman et al. 2003; L'Heureux
et al. 2004). The tropical anomalous heating excited Pacific/North American teleconnection
pattern (PNA) builds an atmospheric bridge linking tropical and mid- and high-latitude climate
over the Pacific Ocean section (e.g., Alexander et al., 2002). The North Pacific Ocean is also a
famous area where extra-tropical cyclonic storm energetically develops, and its northern portion
lies in the dominant pathway of storm tracks (e.g., Zhang et al. 2004). The PDO and ENSO
represent large scale climate and atmospheric circulation patterns, playing a modulating role in
temporal and spatial structure of storm tracks, while cyclonic storms are major elements to
redistribute water budget and bring rainfall. Therefore, complex interactions across different time
scales of atmospheric circulations, atmosphere-ocean interface, and between low- and high-
latitudes occur in this area. Meanwhile, along with the global warming forced by greenhouse gas
emissions, substantial climate changes have been observed across the North Pacific Ocean and
the adjacent Arctic Ocean, including an increase of frequency of ENSO, a decrease of amplitude
of PDO, and a poleward shift in storm tracks (e.g., Timmermann et al., 1999; Meehl et al. 2000;
Zhang et al., 2004; Zhang et al. 2008), which further complicate the above-mentioned
interactions.
2. The roles of aerosols on cloud condensation. Hygroscopic aerosols injected into the
troposphere increase the number and spectra of cloud condensation nuclei (CCN) and/or ice
nuclei (IN). Under saturated conditions more CCN and IN compete for the excess water vapor
leading to smaller, but more numerous cloud droplets and cloud-ice crystals (e.g. Rogers and
4
0919608Yau 1989; Ruddiman 2001) and resulting in enhanced cloud albedo (Twomey effect). Cloud life
time increases because the smaller sizes diminish coalescence and riming, and decrease
precipitation formation efficiency. Reduced droplet sizes also delay freezing which again minders
the efficiency of precipitation formation. The role of IN, however, can also be towards an
increase of precipitation formation efficiency. Due to the lower saturation vapor pressure over
ice than water, ice crystals grow at the expense of cloud droplets in mixed phase clouds
(Findeisen-Bergeron process).
3. The global GCM simulations and regional meso-scale model downscaling. The fully coupled
global atmosphere-ocean general circulations model (GCM) is a fertile tool for simulating
present-day and projecting future climate variability and change. Simulations by GCMs also
provide a unique approach to get insight into particular physical processes for investigating and
understanding mechanisms of climate variability and change, because many aspects and
parameters cannot be directly observed in the real world. Tens of GCMs developed by major
modeling centers over the world have been used for climate change assessment by IPCC (e.g.,
IPCC 2007). The global GCMs are important in this proposed project to detect and understand
large scale climate variability and changes across the North Pacific Ocean and linking Alaska
and Hawaii. However, their coarse resolution limits their capability to well capture synoptic and
meso-scale weather systems and associated heterogeneous distributions of precipitations. For
instance, the resolution of T85 was used in the CCSM for the IPCC simulations, which has 256
and 128 grid points in latitude and longitude, respectively. The grid spacing is about 1.41 degree.
So, for better simulating and understanding local weather systems and associated rainfall over
Alaska and Hawaii, regional meso-scale model will be employed, which can have a resolution
as high as less than 10 km. Finer scale projections of future conditions are generally not directly
available. However, local topography can have profound effects on climate at much finer scales,
and almost all land management decisions are made at much finer scales. As policymakers
continue to grapple with climate change issues there is a growing need for the development of
model assessment methodologies (e.g., comparison between observations and simulations) as
well as downscaling methodologies (e.g., empirical or dynamic) in order to make GCMs useful
tools for regional climate change planning. The North American Regional Climate Change
Assessment Program (http://www.narccap.ucar.edu) is doing such an effort for North America
but only part of Alaska is included and Hawaii is completely out of the study domain. Thus this
proposed activity will serve the high-resolution climate scenario needs for Alaska and Hawaii.
4. The current status of freshwater resources in Alaska and Hawaii. Alaska and Hawaii have very
different environments but many of the same fresh water issues. Alaska has a very wide range
of environments from coastal rain forest to Arctic desert. Hawaii’s environment ranges from dry
and wet coastal lowlands to snow-covered volcanic peaks. One area that both Alaska and
Hawaii have in common is our lack of data that would allow us to understand our freshwater
resources, their sustainability, and their vulnerability to climate change. Although Alaska has
more land area, more coastline, and more river miles than any other state, Alaska has only 26
active river gages, one quarter of the second largest state, Texas. Hawaii has 32 stations.
Alaska has only 21 first order weather stations. First order stations are those maintained
professionally by the NWS or the Federal Aviation Administration. There are also stations
associated with the U.S. Cooperative Observing Network. Coop stations in Alaska number in the
hundreds and have varying record lengths, varying degrees of instrumentation and reporting
frequency. The coop network includes the U.S. Historical Climatology Network (USHCN). These
are high-quality observations of monthly temperature and precipitation that have the least
5
0919608amount of non-climate biases, such as station moves and changes in instrumentation with good
data homogeneity. There are 47 USHCN sites in Alaska. Weather and gaging stations are used
to report precipitation, relative humidity, temperature, and other parameters critical to the
understanding of water resources. These stations are also needed for forecasting, modeling, and
groundtruthing remotely sensed data. The total number of professionally maintained river gages
and precipitation gages are inadequate to understand the water resources in Alaska and Hawaii.
An important opportunity to add to our capacity are stations maintained by scientists, state
agencies, or non-governmental organization that do not currently report real time or are not
connected to any sensor network. With a modest amount of funding, these additional stations
will be upgraded to real-time reporting. These enhancements of the cyber-infrastructure that
connects stations will increase our capacity to understand water resources at a fraction of the
cost of installing new station infrastructure.
While our ability to monitor freshwater resources in Alaska and Hawaii is limited, the available
evidence suggests that freshwater is being severely impacted by a warming climate. The
freshwater that occurs in areas of thawing permafrost in Alaska, for example, is changing and in
some cases resulting in a massive-scale drying of the environment (White et al, 2007). It is
critical that we understand this transformation.
5. The role of social responses in feedbacks affecting the hydrological system. It is widely
recognized that behaviors of individuals can grossly change the dynamics of ecosystems.
Recently, the development of cybertools referred to as agent based models has allowed data to
be incorporated into modeling architectures which reflect the emergent properties of coupled
social ecological systems. Components can form a complex system in which any given state of
the system is the result of the interactions and feedbacks between the smaller systems and
system components (Waldrop 1992). Assessing social-hydrological systems is inherently
difficult, as interactions between systems and components lead to non-linear results that are
difficult to predict based solely on knowing the inputs involved (Holling 2001). In addition,
behaviors in complex systems can operate at varied time and spatial scales. Social decisions
and actions can occur relatively quickly and often occur at a community or local level, while
environmental changes are often, though not always, slower and can affect much larger areas
(Geist 2005; Forbes 1999; Alessa et al. 2008a).
4.3.2 Intellectual Merit
The proposed 3-year project seeks to develop and demonstrate the capability of a Pacific Area
Climate Monitoring and Analysis Network (PACMAN) is designed to yield a more reliable
understanding of the impacts of climate warming on fresh water resources and communities in
Alaska and Hawaii. PACMAN’s capabilities include: (1) real-time access to synoptic satellite data
and in-situ sensor systems, deployed throughout Alaska and the Hawaiian Islands; (2) integration of
these datasets with archival data from existing research databases and drawn from sophisticated
web-harvesting capabilities; (3) redundant archival of all data and information products, as well as;
(4) real-time distributed simulation through a modeling and integration core involving
supercomputing centers in Alaska and Hawaii, together with; (5) a collaborative framework for
visualization and multi-dimensional mapping; (6) development of and reliance upon open-source
web tools; (7) development of an agent-based framework for assessing societal impacts, and; (8)
open distribution to researchers and policy makers in Alaska, Hawaii, and around the world through
the Internet.
6
0919608The proposed core cyberinfrastructure will enable research focused on measuring and
understanding the processes and dynamics that influence immediate and long-term rainfall
characteristics that sustain the social, cultural, and environmental wellbeing of Alaska and Hawaii.
This project does not propose new research per se but rather develops an integrated cyber-
capability which will enable diverse groups of practitioners to utilize information in ways that are not
currently possible. This will allow the research community to better understand those systems which
influence precipitation from the molecular to global scale, and to understand how they are linked and
interact as a basis for evaluating the effects of climate change on water resources.
The integration of innovative sensor networks and remotely sensed data is essential to the
understanding and interpretation of the North-South Pacific corridor from Alaska to Hawaii. This
corridor is the United States’ avant garde for weather and climate and affects millions of residents and
users alike. The corridor from Alaska to Hawaii captures the intersection of three of the four major
climate modes: the Arctic Oscillation (AO), PDO, and ENSO. Each climate phenomenon impacts the
precipitation patterns, frequency, intensity, and form on the west coast of the contiguous United
States.
Sensor networks that include
measurements of precipitation, temperature,
atmospheric radiation, river stage, or CCN
are maintained in Alaska and Hawaii. Many
report results in real time but few are
integrated thus greatly reducing their
capacity to inform research and
management activities. The stations are
monitored and maintained by many different
groups of scientists or agencies and
possess different levels of sophistication.
While the stations are useful to the
scientists who run them, they are of limited
Figure 4.3.1. Nested scales of observation in
value to the scientific community in general
PACMAN from remote satellite observing at global
without integration and connections that
scales, airborne observing at regional scales and
transcend projects and project specific
buoy/instrument-based marine terrestrial networks.
needs. A cyber-network of all these stations
The implementation of a human sensor array layer
would ensure that the stations are abiding
(bottom wedge) adds a scale of resolution that
by authorized protocols for data validation
works synergistically with other sensor data to
and formatting and are integrated and
better resolve the heterogeneity of change.
useable for deriving regional scale
information. These data then become
useful for validating and heightening the value of synoptic data from polar orbiting satellites which
can, in turn, spatially extend important climate information across the North Pacific. A novel addition
to these networks will be the development of a human sensor array (discussed below) built upon the
highly successful NSF-funded Bering Sea Subnetwork (http://bssn.net) which establishes a
distributed network of human observers capable of systematically collecting observations of
environmental change. By integrating these sensor networks and combining them with satellite
derived information, PACMAN will be much greater than the sum of its parts (Figure 4.3.1).
4.3.2a Leveraging Existing Capabilities
This effort expands upon a long-standing strategic partnership linking Alaska and Hawaii
strengthened recently through the creation of a Center of Excellence in Maritime, Island, and
7
0919608Extreme Environment Security (CIMES; http://cimes.hawaii.edu/partners.htm) funded through the
Department of Homeland Security (DHS). CIMES assembles expertise and infrastructure for
monitoring and heterogeneous sensor integration that will provide momentum and sustainability to
the current proposal. PACMAN will also heavily leverage previous investments by various state and
federal sources including NSF EPSCoR in both Alaska and Hawaii. In Alaska, NSF has supported
an EPSCOR program since 2001 and is currently funding the program at $3 million a year. Alaska
EPSCoR’s current configuration dovetails well with the proposed PACMAN project: Like PACMAN,
EPSCoR is focused on using integrative frameworks, techniques and technology to examine climate
variability and change. Alaska EPSCoR also is focused specifically on ecological data collection and
modeling.
Alaska EPSCoR’s current research focus is on integrative science. Biology, physical science and
social science components are all linked together in an integration core, in which research results
are synthesized into real-world models. EPSCoR’s integration efforts are currently concentrated on
two platforms: Social-Ecological Hotspots (SES) Mapping, and Forecasting Environmental
Resilience for Arctic Landscapes (FERAL; http://ram.uaa.alaska.edu/Feral.html). Both platforms
entail the use of complex datasets to create focused integrative geographic models in a manner
similar to that which would be employed by PACMAN.
In addition to these thematic and structural similarities, in some instances water systems fall directly
under Alaska EPSCoR’s purview: co-PI Lil Alessa developed the Arctic Water Sources Vulnerability
Index, a composite index used to evaluate Alaska communities’ access to fresh water. Integrating
this platform into PACMAN’s cyberinfrastructure will provide a valuable link between the climatic
trends observed in PACMAN and the people which they will affect.
Alaska EPSCoR also supports a number of education and outreach programs which can partner
with PACMAN to increase the involvement of Alaska and Hawaii residents in the research and its
results. Leveraging EPSCoR’s existing infrastructure in this area will enable PACMAN to create a
more effective outreach program and make a direct connection to Alaskans, especially the rural
residents most likely to be affected by changes in water availability.
In Hawaii, this effort will leverage previous investment by NSF EPSCoR at the University of Hawaii
and its industry Partner, InteleSense Technologies, which resulted in the creation of an advanced
platform integrating the use of wireless sensor technologies for regional scale environmental
monitoring, Grid computing with 3D geospatial data visualization / exploration, and a secured
internet-based portal user interface (Kido et al. 2008). This cyberinfrastructure has significant power
to cross-connect among technologies / scientific disciplines and thus has the core capability
necessary to address the challenges presented by climate change on water resources in coupled
human-environment systems.
In addition, satellite remote sensing data is captured and distributed in near-real-time at both UAF
and UH, and through partnerships with NASA, NOAA and the DoD. Satellite remote sensing data is
the most effective means to extend site-specific data into a broader, synoptic context. Both the
Alaska landmass and the Pacific Ocean transect between Alaska and Hawaii is very sparsely
monitored with in-situ instruments. In order to draw broad spatial inferences over these regions, in-
situ sensor data will be integrated with data from satellites, including imagery, wind, cloud,
atmospheric moisture, and radiation products, and atmospheric soundings through the Intelesense
integrated platform to provide this data, as well as distributed simulation, visualization, and
collaboration capabilities to researchers in Alaska, Hawaii, and collaborators around the globe.
The UAF Geographic Information Network of Alaska (GINA: http://gina.alaska.edu) has longstanding
collaborations in place with NOAA. In addition to operating two satellite ground receiving station on
8
0919608campus, GINA also maintains a dedicated OC-3 data line to the NOAA-NESDIS Fairbanks
Command and Data Acquisition Station (FCDAS; http://www.fcdas.noaa.gov/)—NOAA’s main
reception facility for its constellation of polar orbiting satellite. Data from hundreds of satellite passes
per day received by NOAA in both Fairbanks and Barrow is exchanged in near-real time between
the two facilities. These satellite data are processed to images and other information products in
near real time and provided to a broad spectrum of operational and emergency response entities. Of
particular note are the specialized products produced for the NOAA National Weather Service’s
Alaska Region Office. The mid and low latitudes are well covered by geostationary satellites orbiting
over the equator. In partnership, GINA, FCDAS, and NOAA scientists produce analogous image,
cloud, water vapor, and radiance temperature products for the high latitudes using polar orbiting
satellites operated by NOAA, NASA, and the DoD enhancing forecasts, emergency response, and
science for the North Pacific and Arctic Oceans. GINA also assembles mosaics and animations of
the broad region visible from polar orbiting satellite data captured in Fairbanks giving scientists and
forecasters a dynamic, synoptic view over the Pole.
The primary satellites used for production of environmental information products are the NOAA
POES, NASA Terra and Aqua, and Air Force DMSP satellites. Hundreds of products are generated
each day in near real time. A few that are relevant to this proposal’s ocean and atmospheric
emphasis include: natural color imagery, ocean color, sea surface temperature, cloud mask, cloud
phase, aerosol optical depth, land surface temperature, cloud top pressure, and total precipitable
water vapor.
The UAF IARC JAXA Information System (IJIS) is a core element contributing to PACMAN’s climate
data and information needs over high latitudes. In turn, PACMAN will enable IARC to better meet its
goal of fostering arctic research in an international setting to advance understanding, preparation for,
and adaption to the pan-arctic impacts of climate change by extending capability and complementing
the other computing services that exist through the consortium. Furthermore, as IARC’s mission
expands to include climate impacts, planning, and adaptation, computational enhancements to IJIS
that enable model development, testing and validation will be essential. The datasets and analysis
tools required for model validation and for synthesis of Arctic data add to the need for a
comprehensive Arctic data and information activity. The upgrades proposed herein would permit
analyses of massive data sets such as the Arctic reanalysis and observing system experiments; and
other data synthesis activities. Both basic process studies and complex synthesis of the Arctic
system require appropriate computational facilities that permit integration of disparate datasets and
rigorous numerical analyses. High-volume remote sensing datasets are essential for such activities.
These advances will also support development, hosting and distribution of the Arctic System Model
(ASM)and model components that strengthen our understanding of the interconnected components
of the regional system. The initial core model will include atmosphere, ocean, sea ice, and selected
land components and will be constructed in a manner that allows investigators to add or exchange
components.
While IARC can contribute to the development and testing of some ASM components, the expertise
required to develop a fully coupled system model clearly extends beyond a single institution and into
the broader community. Collaborations with researchers in Hawaii will enable better simulations of
the North Pacific circulation and the Aleutian Low Pressure System, both of which are critically
important in affecting weather in Alaska, Hawaii and the western U.S.
The Scenarios Network for Alaska Planning (SNAP; http://www.snap.uaf.edu/ ) is a collaborative
organization linking the University of Alaska, state, federal, and local agencies, and NGOs whose
mission is to provide timely access to management-relevant scenarios of future conditions in Alaska.
The primary products of the network are (1) datasets and maps projecting future conditions for
9
0919608selected variables, and (2) rules and models that develop these projections, based on historical
conditions and trends. These scenarios are developed by using high resolution climate data such as
Prism (e.g., http://www.wcc.nrcs.usda.gov/climate/prism.html) to downscale information from various
relevant GCMs and are always accompanied by metadata that clearly describe the methods and
assumptions underlying the projections. Network participants have the responsibility of interpreting
these scenarios objectively to potential users. These products also serve to communicate
information and assumptions among researchers and to identify knowledge and data gaps requiring
further research.
4.3.2b Cyberinfrastructure as the “Integrator of Data and Disciplines”
Adequately addressing the complex effects of climate change on water resources will require the
development of a new generation of cyber-tools and services for data discovery and management,
fusion and integration, analyses and visualization. Rapid advances in technology such as smart
sensor networks used in combination with high-resolution imagery will contribute to improving
environmental data quantity and quality; however, the new cybertechnology must accommodate
massive amounts of raw data that are produced daily by scientists and engineers. This need is
expected to grow as further advances in sensors and sensor networks, computational modeling and
simulation and automated data acquisition systems continue to improve and are directed at studying
climate change effects. This will necessitate collaboration across disciplinary boundaries with the
potential of developing entirely new methodologies, experiential design, and even new fields of
knowledge. The establishment of a cyberenvironment that fosters this type of transdisciplinary
research is mandatory in order to understand complex climate change effects on human-
environment systems and their global interactions. In addition, these new cyber-enabling
technologies must be readily available, open-sourced, user-friendly, and internet-based in order
cross “boundaries” to connect science with decision making so that regulatory adjustments can be
implemented quickly and effectively with input from local stakeholders.
The InteleSense-based environmental monitoring component of PACMAN consists of dedicated
data acquisition devices which are able to interface generically with individual or groups of sensors
which could be deployed to form a “smart” distributed mesh sensor network. Such a mesh network
is able to relay data packets across long distances to a remote base station with units functioning as
repeaters and/or gateways depending on location in the network. At the base station, sensor data
can be uplinked over the internet to a server where other data sources were integrated and clients
given access to sensor data processed for viewing in charts or tables using a secure web–based
open-source geospatial visualizer. The current system utilizes a number of software-based “agents
and crawlers” which obtain information from Internet-based sources, parses this information, and
adds it to the database. Currently, Inteleview integrates over 315,000 layers of data and will have
access to close to a million layers by the middle of the 2009 calendar year including geospatial
imagery (e.g. Ikonos, Quickbird, Landsat, LIDAR, USGS maps, etc.) and information on weather
(e.g. real-time cloud cover, NWS warnings, etc.), oceans (e.g. NOAA buoy data, shipping routes,
reefs, etc.), and the atmosphere (e.g. worldwide CO2, heat flux, atmospheric carbon, etc.). All of this
information is integrated, organized and viewable by end-users geospatially for exploration in 3D on
a global scale. The goal is to provide an easily accessible global integrated georepository of all
information relevant to anyplace on the planet.
In order to handle large amounts of climatic and environmental data and to provide a mechanism to
integrate data from distant sources, the Intelesense Grid was developed- an ultra-reliable grid-based
extendable computing cluster whose parent nodes are housed in an award-winning server facility in
Silicon Valley with redundant power and high-bandwidth network connections. This state-of-the-art
system integrates grid computing capability into the cyberinfrastructure platform so that data from
10
0919608many sources can be seamlessly linked into a federated set of information resources and
middleware. This facilitates resources sharing, coordination, management and processing using the
latest in emerging grid-based technologies. The grid infrastructure handles the metadata, system
catalogs, and data store, providing authenticated user access to information and tools. As part of
this proposal, this grid-based distributed computing cluster will be extended to integrate compute
and storage servers at Alaska and Hawaii to form a seamless, interoperating, cohesive system for
data sharing, analysis, and visualization.
Portals may be readily customized to satisfy specific user requirements and interface with a “data
sharing engine” that outputs directly to a 3D visualizer via a set of linked computer servers. The 3D
data visualization and exploration engine builds upon InteleView (http://www.intelesense.net/) and
GINA’s Swathviewer (http://sv.gina.alaska.edu/) open-source, thin-client applications that may be
downloaded for free from the respective websites. PACMAN portals will be designed with a variety of
collaborative features to support a distributed community of interest, allowing researchers from any
location to work together in a shared online space. PACMAN portals also provide for data and
imagery storage, upload/download tools, and directly interface with Google Earth and ESRI
ARCGIS-based GIS files to directly accept KML/KMZ files, ESRI shape files, Geotiffs, and other data
for viewing and exploring over 3D terrain. This feature thus makes possible the integration of Google
Earth and ESRI GIS maps seamlessly with the thousands of geospatial information layers currently
available on InteleView. In addition, Portals provide a “next generation” Internet-based environment
for serving all kinds of data to the research community and public and thus empower people to
collaborate and share data from anywhere.
An important element of PACMAN’s integration and modeling core is UA’s Forecasting
Environmental Resilience in Arctic Landscapes (FERAL) developed during Alaska EPSCoR’s Phase
III. This agent-based approach allows individuals or other social units (i.e., agents) to make
decisions based on evolving social and environmental components that together makeup the
environmental setting addressed. FERAL captures human-water dynamics at multiple scales,
applying the Repast Simphony (Repast S) architecture as its underlying software (North et al.,
2005). FERAL is able to address interacting systems and components over varied spatial and
behavioral scales. In a social-ecological modeling approach, different and appropriate models are
selected for use based on their utility to address specific behavioral phenomena (e.g., water use,
hydrological evolution, etc.). In other words, an approach that couples multiple types of models (i.e.,
1-4 in Section 4.3 above) is employed in order to capture the best available behavioral dynamics
relevant for the scales addressed. This can allow feedbacks between the systems to be examined
with the emergent actions of these feedbacks evolving the overall system.
4.3.2c Goals and Objectives of this Proposal:
This proposal seeks to develop and demonstrate the utility of a PACMAN, an infrastructure for
integrating in-situ sensor systems deployed across large areas of rugged terrain across Arctic and
tropical climates, together with existing satellite and aerial imagery and archival data from existing
research databases, to enable real-time distributed simulation from supercomputing capabilities in
Alaska and Hawaii, and provided in a collaborative visualization framework to researchers in Alaska,
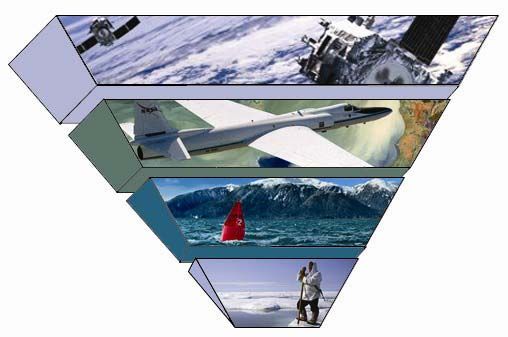
Hawaii, and around the world. Generalized data flow through PACMAN is shown in Figure 4.3.2.
11
0919608Figure 4.3.2: PACMAN Data Flow:
Deployed
Deployed Sensor
Sensor Real-Time
Real-Time Satellite
Satellite Other
OtherData
Data
Networks
Networks Parameters
Parameters Archive/Web
Archive/WebHarvested
Harvested
Alaska/Hawaii
Alaska/Hawaii Alaska/Hawaii
Alaska/Hawaii Alaska/Hawaii
Alaska/Hawaii
Task 1
Modeling Core
Integration &
Data
Data Integration
Integration
InteleSense
InteleSense Grid
Grid
Task 2
Distributed
Distributed Simulation/Modeling
Simulation/Modeling
Computation/
Computation/ Storage
Storage
ARSC,
ARSC, MHPCC,
MHPCC, etc.
etc.
Task 3
Internet
Collaborative
Collaborativevisualization/portals
visualization/portals
Alaska/Hawaii
Alaska/Hawaii
Task 1: Data Acquisition and Integration:
a. Integrate existing sensor networks in Alaska and Hawaii using telemetry and on-line reporting.
The cyberinfrastructure described above will receive data from existing, deployed sensor
networks from universities, state, and federal agencies, and private industry. From our previous
work, sensor networks comprising weather, water quality and flow, imagery, and other sensors
have been previously deployed across the Hawaiian Islands and similar sensor networks exist
across Alaska. Many of these stations transmit their data, but some currently perform internal
logging. These stations would be augmented to provide real-time data and be integrated with the
system above.
Table 4.3.1 Example Integrated Data Sources
Category Data Integrated
InteleNet web harvested Real-time weather, water, air, imagery/video, biotelemetry, tracking
Surface Imagery Landsat visible & vegetation, USGS maps and urban area Ikonos,
Quickbird, daily whole-Earth MODIS data, real-time NOAA, MODIS
through direct broadcast.
Atmospheric NOAA CO2 sensor network; volcanic aerosols; arctic haze; dust, PM10,
PM2.5
Weather Real-time cloud cover (NOAA GOES, POES; MODIS)
Ocean NOAA Ocean Depth data OGS WMS, MODIS, AVHRR, SeaWIFS SST
Geographic Placenames, political boundaries, military bases, population density,
languages, etc.
Aerial Quickbird imagery, ResourceMapping LIDAR/imagery, NOAA hurricane
imagery
12
0919608b. Integrate in situ data and remotely sensed data. The proposed cyberinfrastructure will be
designed to integrate localized, in-situ data into broader context through the use of synoptic
satellite observations. This task requires assembling source data sets of disparate types and
normalizing them into shared, widely adopted open standards for use in applications such as
models and visualization. The Open Geospatial Consortium (OGC) SensorML open standard,
coupled to other OGC mapping, feature, and coverage standards will be the basis of this effort.
Relevant datasets currently available to this project include (but are not limited to) those shown
below in Table 4.3.1.
The in situ data emerging from this infrastructure will be sufficient for the validation of parameters
derived from satellite sources, such as surface temperature, column water abundance, etc. Satellite
remote sensing measurements of these parameters will provide important, spatially and temporally
resolved, quantified and validated, data for use in atmospheric and hydrological models.
Thus, the integrated suite of ground-based measurements and satellite remote sensing data
collected, unified and dispersed in this effort provide vital data for assimilation into atmospheric and
hydrologic models, such as the Weather Research & Forecasting (WRF) model, which will allow the
prediction of changes in the hydrological cycles over Hawaii, Alaska and the North Pacific.
Therefore, modeling experts are needed to provide guidance on the locations and types of
measurements needed to conduct the atmospheric and hydrological modeling efforts this project
would support. These experts would identify the needed form of the data emerging from this
infrastructure to ensure its use by a maximum number of users.
In Year 1 additional stations will be upgraded to send real-time information by telemetry or cellular
capability. Year 2 will continue telemetry upgrades and address data integration to produce a single
network of stations with appropriate metadata protocols, validation approaches, etc. Year 3 will
complete these activities.
Task 2: Simulation and Distributed Computation:
Subtask 2.a: Create an enhanced, open, supercomputing-quality storage and analysis facility for UA
and UH researchers. PACMAN’s modeling and integration core will benefit from affiliation with ARSC
and MHPCC and is built around the expertise and capability of existing information systems and
related expertise described in Section 4.3.2a.
A high-capacity disk storage system consisting of 1 PB of spinning disk and 1 PB of tape will be
deployed sequentially using the following multi-year strategy:
x 0.5 petabyte (PB) disk storage during year 1;
x 1PB Sun StorageTek STK3500 tape silo during year 2, and;
x An additional 1PB disk storage in year 3.
These capabilities will be augmented by three new clusters located at UAF:
x A 640 processor node cluster (quad core) yielding 6.8 TFLOPs will be purchased during year 1.
x An additional 960 node (six core) cluster will yield 10 TFLOPs assembled in year 2, and,
x An additional 1280 node (twelve core; 13TFLOPs) cluster will be brought online in the third year,
13
0919608This strategy yields a total of 29.8 TFLOPs of new computing power by end of project. System
administrators at UAF will be funded through this project to support these systems. They will be
backstopped by ARSC’s existing help desk and technical support staff.
Subtask 2.b: Create the software and personnel expertise to better exploit existing in-situ sensor
data, remotely sensed data, and model output. This effort will build on existing open standards work
with SensorML and the Semantic Web and existing expertise at UA and UH regarding data handling
and processing and implementation of open standards data formats.
Subtask 2.c: Integrate with data acquisition infrastructure. Under this subtask we would provide all
data sources (sensors, imagery, database information, etc) from the integrated data acquisition
system directly to the supercomputing centers to enable real-time simulation to be performed. In
addition, the output from these simulations would be available in real-time through the visualization
portal created for this project.
Subtask 2.d: Use Cases and Applications:
x Model validation: Data consolidated and normalized through open standards protocols will be
used to initialize and validate models developed through other projects.
x User support: The Sensor Web data will be exploitable by users through toolkits fielded by this
project that simplify common needs such as database deployment, grid computing, visualization,
file sharing, and data backup and security.
x Application workflows: Building on the Sensor Web data and other open standards data sets,
researchers will be given access to workflow toolkits that allow them to connect data objects and
processing toolsets together in an object-oriented graphical environment. Output from these
workflows will be easily importable into visualization and analysis tools.
x Cloud dynamics: In-situ sensor data coupled to satellite data and model output will enable new
and innovative cloud dynamics modeling to be performed under separately funded projects. The
unique capabilities of the Sensor Web available to the researchers will provide new opportunities
and capabilities for research that impacts Alaska, Hawaii, and the Pacific.
Task 3: Worldwide collaborative visualization – portal development
Grid-based infrastructures such as the GEOscience Network (GEON) (e.g. Nambiar et al. 2006) are
necessary to integrate the diverse datasets required to understand, integrate, and interpret the
complex processes of earth systems. Portals establish a dynamic framework for interoperability
within Grid infrastructures providing “…secure, customizable, personalizable, integrated access to
dynamic content from a variety of sources, in a variety of source formats, wherever needed” (Smith
2004). Operationally, portals acts as “gateways” between users and various high-level services with
“portlets”, usually built in Java, functioning as self-contained pluggable user interface links to those
services (Chohan 2005). Portals and portlets constructed in this project will connect users through
authentication engines to data resources managed and processed by the InteleSense Grid to allow
researchers to visualize all integrated data from this project (including sensor data, satellite and
aerial imagery, archival database information, etc.). Real-time simulation of results will be viewable
through Java InteleView applets embedded within portals which will allow for interactive exploration
of these data that may be integrated with distributed datasets from around the globe.
Task 4: Demonstration/Application
In order to demonstrate the entire cyberinfrastructure in a specific use case, a demonstration
objective will be to detect variability of and changes in atmospheric circulation and weather patterns
14
0919608You can also read