(SOCRATES) THE SOUTHERN OCEAN CLOUDS, RADIATION, AEROSOL TRANSPORT EXPERIMENTAL STUDY - University of Washington
←
→
Page content transcription
If your browser does not render page correctly, please read the page content below
THE SOUTHERN OCEAN CLOUDS, RADIATION,
AEROSOL TRANSPORT EXPERIMENTAL STUDY
            (SOCRATES)

 Experimental Design Overview (EDO)

                   Principal Investigators
                   Greg McFarquhar, U. Illinois
                  Chris Bretherton, U. Washington

       SOCRATES Scientific Steering Committee
             Roj Marchand, Rob Wood, U. Washington
                  Patricia Quinn, NOAA PMEL
                     Rob Weller, Woods Hole
          Alain Protat, Bureau of Meteorology, Australia
            Steven Siems, Monash University, Australia
      Simon Alexander, Australian Antarctic Division, Australia

                                 1
SOCRATES EDO
                                                                      Table of contents

1.       Executive summary ....................................................................................................................................... 3
2.       Program Rationale ......................................................................................................................................... 4
3.       Scientific Objectives and hypotheses ..................................................................................................... 7
4.       Experimental Design and Observational Requirements ............................................................... 8
     4.1         Identification of Optimal Location for Field Campaign ....................................................... 10
         A.          Climatology of Southern Ocean Cyclones ............................................................................. 10
         B.          Climatology of Aerosols and Cloud Droplet Number Concentrations...................... 11
         C.          Climatology of Supercooled Water and Mixed‐Phase Clouds ...................................... 11
         D.          SOCRATES IOPs and field phase duration ............................................................................ 12
     4.2   Instruments and instrument platforms…………………………………………………................12
        A.   Aircraft ................................................................................................................................................. 13
         B.          Other Aircraft Proposed for SOCRATES Related Projects…………………………………..15
         C.          Shipborne Platforms…………………………………………………………………………………….15
         D.          Ground‐based Observations....................................................................................................... 17
     4.3 Field deployment strategy………………………………………………………………………………..19
       A.  Aircraft Sampling Strategy .......................................................................................................... 19
         B.          Ship Sampling Strategy ................................................................................................................. 21
     4.4    Contribution of G‐V Instruments to Hypotheses Testing………………………………….. 22
5.      Project and Field Management .............................................................................................................. 24
  5.1 Project Planning and Coordination ………………………………………………………………………24
  5.2 Field Coordination and Support …………………………………………………………………………..24
  5.3 General Project Management Issues …………………………………………………………………….26
6. Data Management Plan ……………………………………………………………………………..…………..26
7. Educational Outreach ……………………………………………………………………………………………28
References ................................................................................................................................................................ 29
Section I: Facilities, Equipment and Other Resources ………………………………………………...…..33
Section J: Special Information and Supplementary Documentation ……………………..………….35

                                                                                     2
1.      Executive summary
Overview: The Southern Ocean (SO) is the stormiest place on Earth, buffeted by winds and waves that
circle the ice of Antarctica, sheathed in clouds that mantle a dynamic ocean with rich ecosystems. The
remote and usually pristine environment, typically removed from anthropogenic and natural continental
aerosol sources makes the SO unique for examining cloud‐aerosol interactions for liquid and ice clouds,
and the role of primary and secondary marine biogenic aerosols and sea‐salt. Weather and climate
models are challenged by uncertainties and biases in the simulation of SO clouds, aerosols, precipitation,
and radiation which trace to poor physical understanding of these processes, and by cloud feedbacks
(e.g., phase changes) in response to warming. Models almost universally underestimate sunlight
reflected by near surface cloud in the Austral summer, particularly in the cold sector of cyclonic storm
systems, possibly due to difficulties in representing pervasive supercooled and mixed‐phase boundary
layer (BL) clouds.
Motivated by these issues, a large international multi‐agency effort called the Southern Ocean Clouds
Radiation Transport Aerosol Transport Experimental Study (SOCRATES) has been proposed to improve
our understanding of clouds, aerosols, air‐sea exchanges and their interactions over the SO. As a
component of SOCRATES, we are requesting the use of the NSF/NCAR G‐V aircraft for 1‐month
between Jan. and March 2018 to sample a North‐South curtain from Tasmania/New Zealand to ~62˚S.
The SPO and EDO are framed in terms of hypotheses that can be addressed purely with the G‐V data
and related modeling and satellite analyses. SOCRATES also includes plans for multi‐year precipitation,
cloud, aerosol, and radiation measurements from Macquarie Island and proposals for cruises along the
same curtain. These additional observations would benefit our objectives and allow hypotheses relating
ocean biology to atmospheric aerosols to be tested. Nonetheless G‐V data will be critical in advancing
understanding of science issues relating ocean biology and surface properties to atmospheric aerosols.
Intellectual Merit: To expand upon the sparse observations of clouds and aerosols over the SO, the G‐V
will obtain comprehensive observations of BL structure and vertical distributions of liquid and mixed‐
phase clouds and aerosols, including cloud condensation nuclei (CCN) and ice nucleating particles (INPs),
across the oceanic polar front including over cold waters poleward of 55o S, where supercooled and
mixed‐phase BL clouds are most frequent. By sampling across a range of synoptic settings, primary
sources and sinks of CCN and INPs can be estimated, proposed mechanisms to counter excessive
absorbed shortwave radiation in models can be tested, and conditions conducive to extensive
supercooled water can be analyzed. Specific hypotheses are proposed which will examine variability in
SO BL cloud droplet concentration, and the occurrence of supercooled liquid clouds with INPs and BL
dynamics, as well as the relationships between cloud microphysics, BL accumulation‐mode aerosols,
wind speeds, precipitation occurrence and overlying free tropospheric aerosols. Parameterization
development and testing needs are integrated into SOCRATES’ design to facilitate systematic
confrontation and improvement of leading climate models with data, reducing the bias of SO absorbed
shortwave radiation in models.
Broader Impacts: Biases in simulations of SO clouds, aerosols, precipitation and radiation impact the SO
surface energy balance and winds, and hence the atmospheric and oceanic circulation of the entire
Southern Hemisphere and beyond (e.g., location of tropical rainfall belts, global cloud feedbacks and
carbon‐cycle feedbacks). As uncertainty in natural aerosol processes and their coupling with clouds are
major uncertainties in estimating anthropogenic aerosol radiative forcing, observations over the SO are
needed to improve such estimates. The G‐V data will lead to improved simulation of cloud response to
climate change, a foundation for improving projections of Antarctic ocean conditions, sea ice and ice
shelves. An educational component involves undergraduate/graduate students in research activities and
forecast operations. We will also produce newsletters for non‐specialists, blogs and an Ask Socrates
webpage where the public can ask scientists about global change issues and perform outreach activities.

                                                    3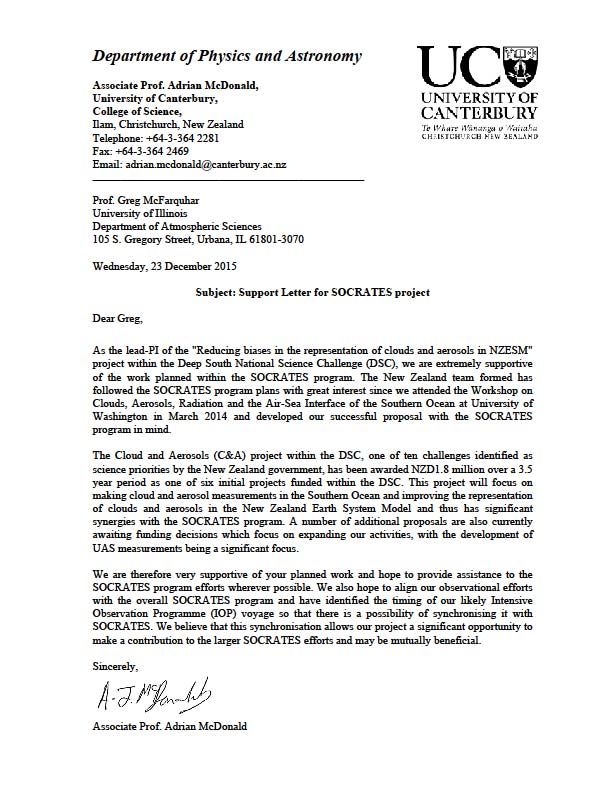
2.      Program Rationale
 Emerging from the 2014 workshop on Southern Ocean Clouds, Aerosols, Radiation and the Air‐Sea
 Interface, the SOCRATES white paper (Marchand et al. 2014)1 describes the motivation, scientific themes
 and testable hypotheses that culminate in the need for a new multi‐agency and international
 measurement campaign to study clouds, aerosols, precipitation, radiation and the air‐sea interface over
 the Southern Ocean (SO). In our Scientific Programmatic Overview (SPO), themes and testable
 hypotheses that are relevant to our proposed observations with the NSF/NCAR G‐V and related
 modeling studies and satellite analysis are reviewed in the context of prior modeling and observational
 studies that have been conducted over the SO. As explained in the SPO, the G‐V will play a critical and
 irreplaceable role in addressing SOCRATES scientific objectives because it will be the only major
 airborne platform surveying lower‐tropospheric clouds, aerosols and boundary layer (BL) dynamics
 across the latitudes of the SO between 45˚S and the cold waters off the Antarctic coast (~62oS), where
 supercooled liquid water (SLW) and mixed‐phase BL clouds in the cold sector of cyclones are most
 frequent. SOCRATES also involves funded and proposed contributions from Australia, New Zealand and
 the U.K., surface‐based instrumentation from the U. S. Department of Energy, and possible NOAA
 shipboard measurements. The way in which the G‐V data complement other SOCRATES activities is
 outlined in the SPO, emphasizing that significant synergy can be obtained from all components
                                                          combined, but that the G‐V measurements represent
                                                          a stand‐alone project independent of the other
                                                          components of SOCRATES and allow for testing of the
                                                          hypotheses summarized in Section 3. In this
                                                          Experimental Design Overview (EDO), a strategy for
                                                          acquiring the G‐V observations is outlined.
                                                                   The SO influences the atmospheric and
                                                          oceanic circulation of the entire southern hemisphere
                                                          (SH) and beyond. Its unique importance as an object of
                                                          scientific study derives from the remarkable
                                                          differences between the Northern Hemisphere (NH)
                                                          and SH in geography and human settlement patterns.
                                                          The ice continent of Antarctica and the unbroken
                                                          circumpolar expanse of the SO promote strong
Figure 1: CMIP5 model clouds do not reflect enough latitudinal gradients in atmospheric and ocean
sunlight. Ensemble mean error [W m‐2] for CMIP5 models properties, affect ocean heat and carbon uptake, and
in shortwave radiation absorbed by the Earth System. Red
values indicate too much shortwave radiation absorbed. generate extra‐tropical cyclones that spawn extensive
There is also a larger intermodal spread over the SO than and diverse clouds, which affect both the local and
over other latitudes (not shown).
                                                          global energy balance and climate.
           Clouds over the SO differ from those over the NH because of their remoteness from
 anthropogenic and natural continental aerosol sources. This makes the SO a unique venue to improve
 our understanding of cloud‐precipitation‐aerosol interactions, and the role of marine biogenic aerosols
 of primary and secondary origin and sea‐salt. Almost all model cloud parameterizations have been
 developed using NH data. It has been shown that clouds over the SO are poorly represented in general
 circulation model (GCM) simulations (Trenberth and Fasullo 2010) and even present‐day reanalysis
 products (Naud et al. 2014). The CMIP5 ensemble has a large positive error in annual mean absorbed
 shortwave radiation (Figure 1) between 55oS and the Antarctic coast, especially during Austral summer,

1
 The SOCRATES whitepaper is available at
http://www.atmos.washington.edu/socrates/SOCRATES_white_paper_Final_Sep29_2014.pdf

                                                       4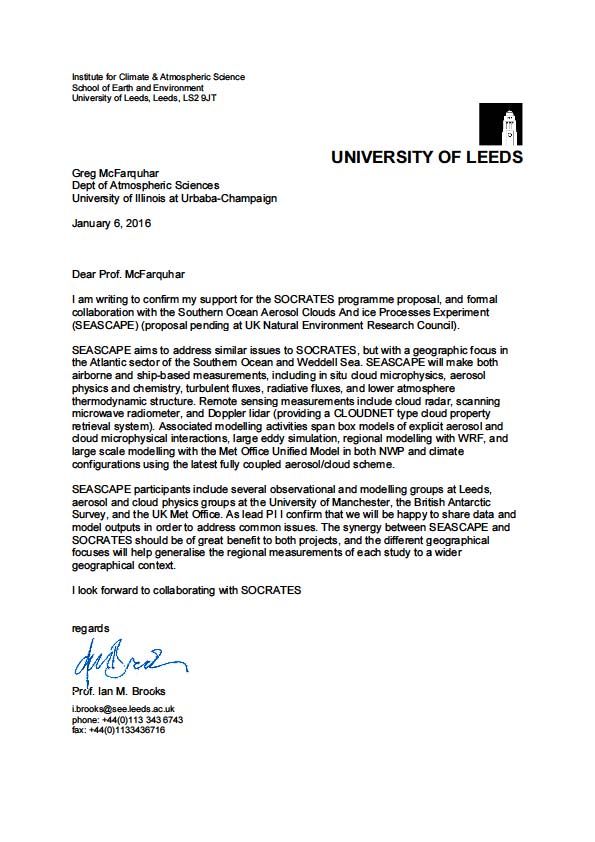
inducing year‐round warm SST biases. This bias is mainly due to too little cloud, though sea‐ice may also
                                                                         contribute (Ceppi et al. 2012, 2014),
 Table 1: Past intensive observational studies focused on the study of influence the tropical circulation (Hwang and
            clouds and aerosols over the Southern Ocean
                                                                         Frierson 2013) and may correlate with
    Field
                      Time         Range         Primary Science         climate sensitivity (Trenberth and Fasullo
 Experiment
                                              Cloud microphysics         2010). Biases may also impact Antarctic sea
                    Jul 1993;       40o-                                 ice, and sea ice trends, which are opposite in
SOCEX I & II                                  characterization &
                    Jan 1995        43oS
                                              seasonal bounds            models from observations (Flato et al. 2013).
                                              Atmospheric   Chemistry    Thus, high latitude ocean‐atmosphere‐ice‐
ACE 1               Nov/Dec         40o-
                                              Limited cloud              ecosystem   interactions and processes have
                       1995         55 S
                                       o
                                              microphysics obs.
                                                                         been identified as a key research frontier by
                                              Global Atmospheric
HIPPO                5 flights      43o-                                 the    NSF      Advisory    Committee      for
                                              Chemistry; secondary
                     2009-11        67oS
                                              cloud microphysics obs.    Geosciences   (2014)  with improving  process
                                                                         models at multiple scales for aerosols,
                                                          clouds, radiation and precipitation specifically highlighted.
                                                                   Current understanding of SO cloud and aerosol
                                                          processes is largely based upon data gathered from
                                                          satellites, a limited number of in situ datasets (Table 1)
                                                          and model studies. A long record of surface aerosol
                                                          measurements from Cape Grim (41o S, 145o E) led to an
                                                          understanding of the strong seasonality in CCN
                                                          concentrations (Figure 2) with greater ocean
                                                          biogeochemical activity during summer (Ayers and Gras
                                                          1991) being the likely cause. Seasonal cycles in aerosol
                                                          optical depth and aerosol composition (Sciare et al. 2009)
                                                          have also been observed, and the Southern Ocean Cloud
                                                          Experiment (SOCEX) aircraft campaigns, with two phases,
                                                          summer (July 1993, Boers et al. 1998) and winter (Jan‐Feb
                                                          1995, Boers et al. 1996), measured droplet number
                                                          concentrations (Nd) a factor of 2‐3 higher in summer than
         Figure 2: Seasonal cycles of Nd and CCN          winter. SOCEX was conducted at latitudes 40‐43oS. While
         concentration over SO. Nd data derived
         from passive visible/near-IR data from           natural aerosols play a key role (McCoy et al. 2015a) and
         MODIS (red) and limited aircraft flights         it has been hypothesized that the summertime peak is
         during winter and summer (black squares).        due to marine biogenic sources, the pathway remains
         The seasonal cycle of CCN at 0.3%
         supersaturation from measurements at             uncertain (Quinn and Bates 2011). In addition,
         Cape Grim (Ayers and Gras 1991) is also          concentrations of efficient ice nucleating particles2 (INPs)
         shown as are Nd measurements from                have been observed to be very low in this pristine region
         SOCEX campaigns (Table 1).
                                                          (Bigg 1973) remote from dust sources (DeMott et al.
2015). This may explain the prevalence of SLW clouds over the SO (Kanitz et al. 2011) and it enhances
the potential importance of marine aerosol as INPs (Burrows et al. 2013) and the role of secondary ice
production processes. McCoy et al. (2015b) noted that GCMs simulate a distressingly broad range of
sensitivities of liquid versus ice partitioning to temperature in SO clouds, and that this affects their SO
cloud albedo response to a warmer climate. This underlines the need for in‐situ observational

2
  The term ice nucleating particles is used here rather than the previously commonly used term ice nuclei because
the use of INPs is less specific about a requirement that the particle itself (or the entire category of particles) be
the ice nucleators (Vali et al. 2015)

                                                          5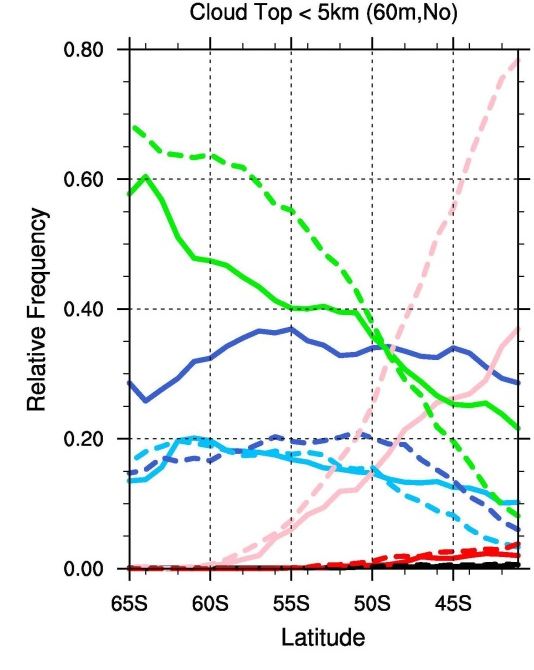
constraints of this partitioning, which is challenging to infer from satellite and surface‐based
measurements alone.
            The first Aerosol Characterization Experiment (ACE‐1, Bates et al. 1998a) in 1995 involved two
ground sites (Macquarie Island and Cape Grim), two research vessels, and the NSF/NCAR C‐130 aircraft.
It measured chemical and physical processes controlling atmospheric aerosol relevant to radiative
forcing and climate. ACE‐1 documented the role of dimethylsulfide (DMS)‐derived sulfate aerosols over
the SO including the potential for new particle formation and growth (Bates et al. 1998b), vertical
aerosol structure including subsidence of near‐cloud‐nucleated aerosols from the free troposphere (FT)
(Clarke et al. 1998, Weber et al. 1998), and the importance of sea‐spray aerosol (Bates et al. 1998a).
ACE‐1 sampled north of 54oS and largely away from clouds. More recently, the HIAPER Pole to Pole
Observations (HIPPO) using the NSF/NCAR G‐V aircraft (Wofsy et al. 2011; Chubb et al. 2015), provided
the only in‐situ dataset on clouds and aerosols south of Macquarie Island (54oS), with 4 transects down
to 67oS encountering some SLW and BL clouds (Chubb et al. 2013). HIPPO sampled the full tropospheric
depth and concentrated on atmospheric chemistry, but did not include airborne remote sensing and
provided only limited profiles. Ground based atmospheric chemistry observations are ongoing at Lauder
and Baring Head (New Zealand) and Cape Grim (Australia). Although clouds are not the focus of the
upcoming2016 O2/N2 Ratio and CO2 Airborne Southern Ocean (ORCAS) study, some cloud data will be
collected with the facility instruments on the NSF/NCAR G‐V as it flies through BL clouds while sampling
the air‐sea exchange of O2 and CO2 over the SO from Punta Arenas, Chile.
           Recent analyses of model simulations suggest several possible reasons for GCM top‐of‐
atmosphere radiative biases over the SO. A major contributor is a lack of clouds in the cold sectors of
                                                                        cyclones (Figure 3). Errors in the
                                                                        representation of mid‐topped clouds in the
                                                                        warm conveyor belt of shallow cyclones near
                                                                        the Antarctic continent have also been
                                                                        documented (Mason et al., 2014). The
                                                                        minority of climate models with enough SO
                                                                        zonal‐mean reflected shortwave radiation do
                                                                        so by compensating this error with overly
                                                                        bright high clouds in the warm sector of
                                                                        cyclones (Williams et al. 2013). Similar cold‐
                                                                        sector cloud errors are found in climate
                                                                        model simulations of the NH oceanic storm
                                                                        tracks, but there they do not contribute to a
                                                                        substantial time‐mean radiation bias,
                                                                        perhaps because the NH storm tracks are less
                                                                        active in the summer or because additional
 Figure 3: Cyclone compositing indicates consistent patterns of
 insufficient reflected shortwave (red) in the cold, dry regions of the processes such as the reduced availability of
 cyclones. The figure demonstrates a bias in absorbed shortwave CCN and IN exacerbate the biases in the SO.
 radiation for AMIP models from Bodas‐Salcedo et al. (2013).                    Likely contributors to these errors
                                                                        include (1) model deficiencies in vertical
turbulent transport due to both cumulus and BL parameterization, (2) interaction between
parameterized cumulus convection and stratiform cloud processes, (e.g., through condensate
detrainment), (3) microphysical deficiencies, e.g., overly rapid glaciation of SLW or excessive
precipitation from cumulus, (4) errors in representing sub‐grid condensate variability, (5) inadequate
resolution of the circulation systems in which clouds evolve (Govekar et al. 2011, 2014), and (6)
inaccurate representation of aerosols and their relationship to cloud properties.

                                                          6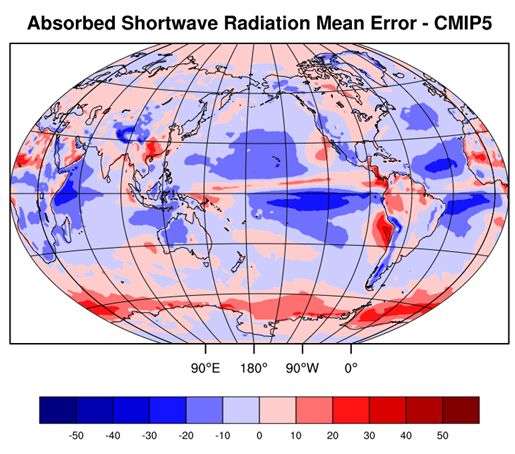
Natural aerosols are a major source of uncertainty in the effective radiative forcing by aerosols
(Ghan et al. 2013, Carslaw et al. 2013), complicating use of prior data to constrain estimates of Earth’s
climate sensitivity (Kiehl 2007) or to test GCM simulations of anthropogenic aerosol impacts on climate
change. The SO is an important testbed for GCM simulations of aerosols and aerosol‐cloud interaction.
Model studies indicate that a significant fraction of global anthropogenic forcing is associated with
aerosol‐cloud interactions over the northern extratropical oceans (e.g., Kooperman et al. 2012; Zelinka
et al. 2014), while the SO contributes negligibly (Korhonen et al. 2008) meaning present‐day SO aerosol
conditions may still be similar to those over oceans in the preindustrial era. CMIP5 climate models
struggle to represent aerosol processes and to achieve accurate simulations of the annual mean and
seasonal cycle of CCN and Nd over the SO. This could contribute to the SO shortwave biases in some
GCMs. For instance, it is not clear if the time variability (and especially the seasonal cycle) of the albedo
of liquid clouds over the SO is strongly controlled by the corresponding time variability of CCN/INPs, or
whether other physical controls on cloud cover dominate.
3.      Scientific Objectives and hypotheses
Despite the importance and the challenge of simulating cloud and aerosol effects over the SO, there
have been only sparse and infrequent observations in this region. Observations are sorely needed to
improve process‐level understanding of atmospheric and oceanic processes, their linkage, and
representations in models. Strong synoptic variability in aerosol sources and sinks, and latitudinal
differences in BL and air‐sea properties especially across the oceanic polar front create diverse cloud
regimes. The Scientific Program Overview (SPO) provides a more detailed motivation for the large
international SOCRATES program, listing specific hypotheses proposed for the multi‐agency program in
four themes to understand (1) the synoptically‐varying vertical structure of SO BL clouds and aerosols,
(2) sources and sinks of SO CCN and INPs, including the role of local biogenic sources over spring,
summer and fall, (3) mechanisms controlling SLW and mixed‐phase clouds, and (4) advances in retrievals
of clouds, precipitation and aerosols over the SO. The SPO also discusses the unique scientific
contribution of the NSF/NCAR G‐V observations, which will enhance our understanding of the
synoptically‐varying vertical structure of SO BL clouds and aerosols, the dependence of cloud properties
on these aerosol profiles, and the mechanisms controlling SLW and mixed‐phase clouds, especially in the
cold sectors of cyclones.
         Specific hypotheses to be tested with the G‐V observations are proposed in the SPO to
determine if (G1) the space/time variability of cloud droplet concentrations within SO liquid BL clouds is
strongly correlated with near‐surface accumulation‐mode aerosol concentrations, (G2) space/time
variability in droplet concentrations within SO liquid BL clouds is strongly correlated with one or both of
the overlying free tropospheric aerosol concentrations, and/or local surface and BL controls (i.e.,
precipitation, wind speed and satellite‐derived chlorophyll concentration), and (G3) the tendency of
SLW clouds prevalent over colder parts of the SO to glaciate at a given temperature is more strongly
modulated by updraft velocity than by variability in INP concentration. Parameterization development
and testing needs are integrated into SOCRATES’ design so that systematic confrontation and
improvement of leading climate models with data will be possible; the synergistic use of G‐V data in
modeling studies is described in the SPO.
         The G‐V will make a set of focused observations of clouds, aerosols, precipitation, radiation and
BL properties over the SO that will span a variety of temporal and spatial scales, and will be coordinated
with process and large‐scale modeling. Table 2 presents general observational and modeling
requirements for the G‐V. In addition to the limited duration field observations with the G‐V, our
proposed research will make extensive use of existing and future planned satellite datasets including
retrievals of cloud and aerosol properties, surface ocean state and meteorological variables, as well as
the synoptic context provided by gridded meteorological analyses from operational weather forecast
models. The collection of the G‐V data during SOCRATES thus has the following overarching objectives:

                                                     7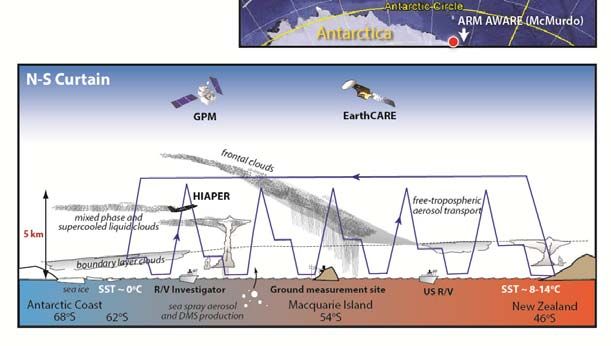
(i) To characterize the physical properties of lower tropospheric cloud systems around mid‐latitude
          cyclones over the SO;
    (ii) To characterize the microphysical and chemical properties of aerosols that may play a role in
          regulating CCN and INPs over the SO and to investigate their significance for cloud and
          precipitation formation, and radiative properties;
    (iii) To use satellite cloud, aerosol, precipitation, and upper ocean products to extend the temporal
          and spatial scale of the G‐V observations to generalize the scientific findings; and
    (iv) As part of a SOCRATES‐wide modeling strategy, the G‐V data will be used to evaluate and
          improve the skill of models at different scales to reproduce the observed properties of SO cloud
          systems, aerosol physicochemical properties, and aerosol‐cloud‐precipitation interactions, and
          to use such models to develop a process‐oriented understanding of mechanisms controlling the
          properties of cloud systems.
Although our proposal is designed to primarily address these hypotheses with the G‐V data, it is natural
that observations from other platforms as part of the large interagency multi‐national SOCRATES
program will be used to test these hypotheses if available, and that the G‐V data will be used to test
other hypotheses from the broader SOCRATES program because of the synergy of data from all
platforms. In particular, observations from the Australian ship R/V Investigator are highly likely. If those
data are available, they can be combined with the aircraft data to meet this other overarching objective:
    (v) To characterize surface seawater composition, including organic matter and biological activity
          that may impact the composition and cloud‐nucleating ability of ocean‐derived CCN and INPs.
                           Table 2: Observational and modeling requirements for SOCRATES
                To enhance our knowledge of SO aerosols, clouds and their interactions in a variety of synoptic settings
 SOCRATES
                and to narrow the uncertainties in representing key processes in climate models, a comprehensive dataset
observational
                is needed that documents PBL structure, and associated vertical distributions of liquid and mixed-phase
 requirement    cloud and aerosol (including CCN and IN) properties over the SO under a range of synoptic settings.
 SOCRATES       For such a dataset to have broad impact on climate modelling, the modelling community must be an integral
  modeling      part of the SOCRATES design and be involved in a systematic confrontation of leading climate models with
 requirement    SOCRATES data, e. g. using short-term hindcasts as in VOCALS model assessment (Wyant et al. 2014).

4.      Experimental Design and Observational Requirements
To address the scientific hypotheses raised in the SPO, a focused set of observations over the SO
coordinated with process and large scale modelling is required. In this Section, the climatology of SO
cyclones, clouds and aerosols is presented to identify locations amenable for testing of our hypotheses.
In addition, the G‐V instruments needed to address our science goals are presented, along with a field
deployment strategy. Proposals are being made for deployment of other instruments and platforms at
the same time in the same region. We will also explain how these resources would be used and how
they would contribute to our effort. We emphasize that although the hypotheses developed in the SPO
can be tested with the G‐V data and existing satellite instruments and already funded cruises by
Australia and the Department of Energy, the other planned data sets would add significant synergy
and allow us to address a broader set of objectives and science questions.
        The resource we are requesting from NSF for our component of SOCRATES is the Gulfstream‐V
(G‐V) for one‐month of summer observations across the latitudes of the SO between 45˚S and
approximately 62oS. Additional activities that will provide measurements further south, include longer
time periods or provide data on the linkage between the ocean surface and the atmosphere that are
already funded or that will be proposed to NOAA, DOE, Australian and United Kingdom agencies include:
    • The DOE‐funded Macquarie Island Cloud and Radiation Experiment (MICRE) will deploy a ground‐
      based remote sensor suite to Macquarie Island from March 2016 through March 2018. Together
      with a cloud radar and other instrumentation supported by the Australian Cloud and Radiation
      Experiment (ACRE) this will continuously observe the seasonal cycle of clouds, radiation,
      precipitation and meteorology in the center of the SO storm track;

                                                             8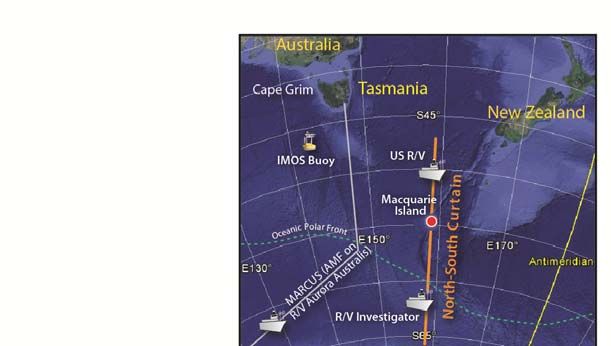
• The DOE‐funded Measurements of Aerosols Radiation and CloUds over the Southern Oceans
       (MARCUS) experiment, whereby the Atmospheric Radiation Measurement (ARM) Program Mobile
       Facility‐2 (AMF2) will be installed on the Australian Antarctic supply vessel Aurora Australis (AA)
       as it makes routine transits between Hobart, Australia and Antarctic research stations.
  • The DOE‐funded ARM Western Antarctic Radiation Experiment (AWARE) will deploy the AMF2 to
       McMurdo Station from January 2016 to January 2017 to make radar, lidar and aerosol
       measurements in this remote region
  • As funded by the Bureau of Meteorology (BoM), the Australian R/V Investigator will provide
       shipborne observations along a north‐south leg, including ocean eddy and biological sampling,
       surface meteorology, BL aerosol, CCN, INP properties, and cloud and aerosol profiles through
       remote sensing for one‐month in March 2016. Another cruise has also been proposed for one‐
       month between January and March 2018 to be coincident with the G‐V observations;
  • As proposed to NOAA, a U.S. global class vessel will provide a characterization of summertime
       microlayer, surface, and sub‐surface seawater properties controlling the emission of biogenic
       species to the atmosphere, BL aerosol, CCN, and INP properties, and vertical aerosol and cloud
       properties through remote sensing at the same time as the summer G‐V observations;
  • As proposed to the British Antarctic Survey (BAS), observations from remote sensing and aerosol
       instruments on a ship, and from cloud, aerosol and radiation instruments on the BAS Twin Otter
       of supercooled stratus and small cumulus in and north of the Weddell Sea during Austral summer
       2017/18 in the Southern Ocean Aerosol Clouds and Ice Processes Experiment (SEASCAPE);
  • As funded by the New Zealand government, cloud and aerosol measurements and possibly the
       deployment of uninhabited aerospace systems (UAS) from the R/V Tangaro in the sea ice edge
       region in the Ross Sea as well as surface autonomous observations near Scott base, and remote
                                                                   sensing observations at Arrival Heights
                                                                   near Scott Base requested from New
                                                                   Zealand.
Figure 4 Schematic                                                 Section I provides a table that lists all
showing SOCRATES                                                   facilities to be deployed during
surface-based sampling
locations and platforms                                            SOCRATES, the funding source for
(top), and a detailed                                              each asset, and in the case of NSF
sampling schematic for the                                         facilities, the estimated cost of
north-south SOCRATES
Curtain of sampling from                                           deploying the facility.
45oS to the vicinity of the                                                  Our proposed sampling for the
Antarctic circle (bottom).
                                                                   G‐V focuses on mapping cloud and
                                                                   aerosol properties along a north‐south
                                                                   meridian termed the SOCRATES
                                                                   Curtain, which is outlined in Figure 4.
                                                                   The curtain encapsulates our need for
                                                                   sampling at a range of latitudes across
                                                                   the SO as differences in surface
                                                                   conditions,       temperatures,     and
                                                                   ultimately fluxes may well play an
                                                                   important       role    in   generating
                                                                   latitudinal differences, especially
                                                                   those north and south of the oceanic
                                                                   polar front. The mean location of the

                                                    9
front varies from ~55˚S south of Tasmania to ~60˚S south of New Zealand (Dong et al. 2006),
which establishes Hobart as our preferred operations base. Regardless of its location,
summertime mean liquid cloud top temperatures are below freezing, ranging from ‐6˚C if the
front is at 54˚S to ‐3˚C if it is at 62˚S (Y. Huang and S. Siems, 2015, personal communication). In
addition to aircraft observations characterizing the horizontal and vertical variability of cloud and
aerosol properties in the BL and FT, the confirmed island‐based and probable ship‐based
observations from the R/V Investigator, together with satellite data, will provide context for
interpreting the aircraft data and addressing our hypotheses.
4.1 Identification of Optimal Location/Time for Field Campaign
There are a number of requirements for selecting the optimum location for SOCRATES:
1) Sample the entire gradient in aerosol and cloud properties that exists across the SO, including
observations both north and south of the oceanic polar gradient;
2) Sample the region where CMIP model ensembles illustrate shortwave radiation biases are most
acute, especially south of 55oS, to determine the physical causes of these biases;
3) Sample the region over the SO where remote sensing data suggest a large occurrence of multi‐
layer and mixed‐phase clouds;
4) Target regions and times with frequent occurrence of SO cyclones since a major contributor of
radiation biases in models may be a lack of clouds in the cold sector of cyclones; and
5) Make cloud and aerosol observations in as wide a variety of synoptic settings as possible in
order to sample a variety of wind speeds and varying lower tropospheric stability.
The Australasian sector of the SO is ideally suited for SOCRATES as it is representative of the SO as a
whole, and because Macquarie Island is an active scientific station without major orography. Further,
there are a number of logistical advantages:
Facilities are available to support the operation of the NCAR/NSF G‐V that permit access to the
high latitudes of the SO. The G‐V reached the latitude of 67°S during the HIPPO field campaign
when flying out of Christchurch (43.53°S). The preferred site is Hobart (42.88°S) because the
oceanic polar front is 500 km closer to Hobart than Christchurch. Preliminary analysis shows that
even with the installation of the HCR, the G‐V will be able to reach at least 62˚S.
Ground‐based observations from Macquarie Island (54.62°S) will be directly integrated into
SOCRATES. Macquarie Island is an attractive site for such observations given its minimal
orographic profile. The site also offers meteorological records dating back to 1949.
Supporting observations exist in this domain. The IMOS buoy (47°S) will be in operation during
the SOCRATES field campaign. Extensive atmospheric chemistry observations are available from
the Cape Grim Baseline Air Pollution Station (Tasmania) and Lauder and Baring Head (New
Zealand.) Records from previous field campaigns (e.g. ACE‐1, SOCEX I & II) are available.
There are plans for oceanographic, aerosol and cloud remote sensing observations from the R/V
Investigator and Aurora Australis for the planned time period of the G‐V observations.
Numerous alternate sites were considered. The South America region offers closer access to the
high latitudes of the SO but suffers from an orographic impact from the Andes Mountains and the
Antarctic Peninsula. Remote sites in the Atlantic and Indian Oceans either do not provide adequate
facilities or will not produce representative surface observations due to significant orography.
A. Climatology of Southern Ocean cyclones
The storm track is the dominant meteorological feature over the SO, commonly defined between 50 and
65°S by reanalysis products (e.g. Hoskins and Hodges, 2005; Simmonds and Keay, 2000; Berry et al.,
2011) and satellite observations. Hoskins and Hodges (2005) produced a climatology of the SO storm
track based on 45 years of ERA‐I reanalysis (Figure 5).
10The storm track is most intense over the Atlantic and Indian Ocean sectors of the SO. The storm
track shifts poleward during the summer, becoming more axisymmetric and intense. During the winter
the storm track broadens towards the
tropics and even splits the Pacific sector.
Greater differences become evident
between the Atlantic, Indian and Pacific
sectors. The orographic influence of the
Andes Mountains in South America
becomes particularly visible. Further
analysis suggests a strong region of
cyclogenesis in the less of the Andes.
B. Climatology of Aerosols and
Cloud Droplet Concentrations
Section 2 and Figure 2 showed the
large seasonal cycle in cloud and aerosol
properties that exists over the SO. The
reader is referred to these figures for the
relevant climatology of the aerosols and
cloud properties. It is also worth noting
that there is a strong gradient in cloud and
aerosol properties between 40˚S and 65˚S
that should be sampled (e.g., Huang et al.
2012a).
Figure 5: Lower-tropospheric seasonal cycle of SH storm track based on C. Climatology of SLW and Mixed‐
ξ850: track density (color) and mean intensity (line contour) for (a) DJF Phase Clouds
(summer), (b) MAM (autumn), (c) JJA (winter) and (d) SON (spring). Track
density is number density per month per a unit area equivalent to 5˚ radius Focusing on a sector of the SO
spherical cap, and mean intensity is absolute relative to removed background predominantly to the south of Australia
with contour interval 0.5x10⁻⁵. The 50% sea ice boundary (white line) is (40‐65°S, 100‐160°E), Huang et al. (2012b)
delineated for each season (From Hoskins and Hodges 2005) produced a climatology (2006‐2009) of the
thermodynamic phase of the cloud‐top
employing the merged A‐Train data product DARDAR‐MASK
(Delanoe and Hogan, 2010) as shown in Fig. 6. Poleward of
50°S, cloud‐tops consisting of SLW are dominant during both
SO winter and summer, but with more SLW‐topped clouds
during the SO summer. The opposite occurs equatorward of
50°S, with more SLW‐topped cloud during the SO winter. The
SLW behavior also contrasts with ice‐phase cloud‐tops, which
show a nearly uniform reduction between SO winter and
summer at all latitudes. There is more warm liquid cloud‐top
in summer but little of such cloud exists to the south of 55°S
in either season.
Figure 6 (on left): Relative Frequencies (RFs) of the cloud top thermodynamic
phase classes of ice (ICE), mixed- phase (MIXED), liquid warm (LW),
supercooled liquid water (SLW), rain (RAIN) and uncertainty (UN) categorized
by the DARDAR-MASK during Austral winter (solid lines) and summer (dashed
lines). Relative frequencies of the cloud top phase classes for the single layer of
the highest cloud tops (60 m) below 5 km. (From Huang et al. 2012b)
11D. SOCRATES IOPs and field phase duration
To accomplish SOCRATES objectives and to obtain data for evaluating the proposed hypotheses,
we are proposing a one‐month field campaign where the G‐V will sample clouds, aerosols, radiation and
precipitation over the SO during the summer (Jan. to Mar. 2018) between 45˚S and about 62˚S, which
will allow us to make observations both in the region where SLW dominates and across the mean
position of the polar oceanic front. Based on the analysis presented above, the sampling region includes
frequent cyclones, strong biases in absorbed shortwave radiation, frequent clouds with SLW, and strong
gradients in aerosol and cloud properties. The large number of cyclones anticipated and their intense
nature will allow us to assess how variations in meteorological forcing and aerosols contribute to the
presence of SLW. Table 3 shows the time period of the G‐V observations, together with other SOCRATES
observations that are either funded or proposed for similar time periods in the operation region.
The NSF G‐V will be used to sample low‐level BL and FT aerosols and clouds remotely and in‐situ.
The G‐V will spend approximately equal times flying at 20 kft and performing lower‐level sampling.
Based on experience from the 2015 Cloud Systems Evolution in the Trades (CSET) experiment, which
also included the HIAPER cloud radar (HCR), the NSF Research Aviation Facility (RAF) pilots have
determined that the G‐V range will be ~2500 nautical miles assuming about 1200 nautical miles of lower
atmosphere profiling. This will allow us to reach ~62˚S latitude on missions. In order to sample near‐
surface accumulation mode aerosols, low‐level flying is also required. We anticipate getting the needed
500 foot legs for Hypothesis G1 as such legs were safely executed during CSET in wind speeds up to 20 m
s‐1. Such low‐level legs will be flown in benign conditions favorable to stratocumulus, away from fronts
or other potentially hazardous weather. More detailed flight plans are addressed in Section 4.3A.
It is highly likely that the Australian R/V Investigator will be present for operations, and funding
is being requested from NOAA for a U.S. global class ship to serve as a second shipboard platform.
Instruments on these ships will characterize summertime microlayer, surface, and sub‐surface seawater
properties controlling the emission of biogenic species to the atmosphere, BL aerosol, CCN, and INP
properties, and vertical aerosol and cloud properties through remote sensing. We are also requesting
the EOL ISS sounding system for the R/V Investigator during the project to give vertical thermodynamic
profiles important as context for the surface‐based measurements and for model evaluation.
Table 3: Timeline of proposed SOCRATES activities (red shaded: already funded; blue: requested)
2016 2017 2018 2019
Platform (campaign) Jan- Apr- Jul- Oct- Jan- Apr- Jul- Oct- Jan- Apr- Jul- Oct- Jan- Apr- Jul- Oct-
Mar Jun Sep Dec Mar Jun Sep Dec Mar Jun Sep Dec Mar Jun Sep Dec
Macquarie Island observations (MICRE)
Aurora Australis ship observations (MARCUS)
Macquarie Island observations (ACRE)
NSF OOI Climate Reference buoy
Australian IMOS buoy
R/V Investigator cruises (CAPRICORN)
US Research Vessel cruises
NSF/NCAR GV deployment
BAS Twin Otter and Ship (SEASCAPE)
R/V Tangaro (Deep South)
ARM Mobile Facility at McMurdo (AWARE)
Satellite observations
4.2 Instruments and instrument platforms
To address the SOCRATES G‐V hypotheses, observations of the following properties are needed:
(i) In‐situ cloud and precipitation microphysical measurements (sizes, shapes, phase, liquid and total
water contents, etc.) of the vertical variability of lower‐tropospheric cloud systems and in‐cloud
updraft/downdraft vertical velocities/turbulence;
12(ii) Remote sensing retrievals of cloud macrophysical (bases, heights of multiple cloud layers) and
microphysical (phase, effective radius) properties and up and down looking broadband radiative
fluxes;
(iii) In‐situ microphysical (size distributions, concentrations) and chemical properties (composition) of
aerosols and aerosol precursor compounds in the BL and FT; and
(iv) Measurements of CCN and INPs in the BL and FT.
If available, the following additional information will be obtained from the R/V Investigator and used
with the G‐V data to address the additional objective of characterizing biogenic aerosol over the SO:
(v) Surface seawater properties, including organic matter concentration, composition and biological
activity, which may impact the cloud‐nucleating ability of ocean‐derived CCN and INPs.
In this section, we describe all the platforms and instrumentation required to address the overarching
SOCRATES multi‐agency program objectives, with more emphasis on those being requested from the
NSF facility pool (i.e., the G‐V and sounding system for the R/V Investigator). In‐situ and remote sensing
measurements from airborne and shipboard platforms that cover multiple levels in the atmosphere are
included in the broad SOCRATES program. If all these platforms and instruments are used, multi‐agency
support is required: Appendix I documents the anticipated sources of support for those platforms. The
SPO defines those hypotheses that can be answered with the G‐V data alone together with related
modeling studies, satellite data and data from platforms for which funding has already been obtained.
A. NSF/NCAR G‐V
The G‐V instrument payload includes cloud and aerosol microphysical probes, as well as remote sensors
that provide a critical context for interpreting the in situ data because of a lack of surface sites and the
limitations of satellite observations. In addition to the standard G‐V instruments, we are requesting the
Droplet Measurement Technology (DMT) CCN counter to be operated by Greg Roberts, a Counterflow
Virtual Impactor (CVI) operated by Cynthia Twohy and Darin Toohey, a Continuous Flow Diffusion
Chamber (CFDC) and filter collections for offline immersion freezing measurements operated by Paul
DeMott, the Airborne Vertical Atmospheric Profiling System (AVAPS) operated by EOL, and High Spectral
Resolution Lidar (HSRL) and HIAPER Cloud Radar (HCR) operated by EOL.
The requested probes are summarized in Table 4. Microphysical probes will characterize the
size, shape and phase of cloud particles. A 3‐V Cloud Particle Imager (CPI) will provide high resolution 2.3
m images, from which phase can be ascertained (e.g., McFarquhar et al. 2013) from the CPI
component, and size distributions (SDs) of particles nominally as small as 10 m from the two‐
dimensional stereo (2DS) component. The two‐dimensional cloud probe (2DC) will provide redundancy
for particle SDs between about 125 m and 2 mm, and the Cloud Droplet Probe (CDP) will measure SDs
for liquid droplets from 3‐50 m; its effectiveness for measuring small ice crystals is unknown
(McFarquhar et al. 2007). Bulk measurements of liquid water content will be made from the King hot‐
wire probe, and the presence of SLW will be detected by the Rosemount icing detector (RICE). Because
measurements of total water content (liquid plus ice) are also required to address hypotheses G3, the
CVI will be installed: it has proven to be one of the most reliable measures of total condensed water in
the past (Twohy et al., 1997, Davis et al., 2007). Software is available at both RAF and U. Illinois to
process all these data: this will allow us to examine uncertainties not only in the probes, but also in
methodologies used to process the data (see McFarquhar et al. 2016).
Measurements of aerosol properties are equally important. Two CCN counters will provide
concentrations, one at fixed supersaturation for high spatial resolution and the other scanning between
0.07% and 1%. Aerosol SDs will be measured by the DMT Ultra‐High Sampling Aerosol Spectrometer
(UHSAS) measuring over the range 0.06 to 1 m and a CN counter. INPs will be measured by the CFDC
(DeMott et al. 2010). Sampling cloud residuals from the CVI enhances concentrations by about a factor
of 25, allowing sufficient statistical sampling for the expected low INP concentrations with
13approximately 10‐minute level flight legs (i.e., about 120 km). When outside of clouds, INPs will also be
assessed from larger volume filter collections of aerosols that are post‐processed via an immersion
freezing method, referred to as the CSU‐IS (Hiranuma et al. 2015). Although there is not sufficient space
for installation of an Aerosol Mass Spectrometer (AMS) or a Scanning Mobility Particle Sizer (SMPS) on
the G‐V, we will obtain data on particle composition from impactor samples for transmission electron
microscopy (TEM) for non‐organics and scanning transmission X‐ray microscope (STXM) for organics; to
get adequate filter samples, 5‐10 minute level legs will be required above and below cloud. A DMT
Wideband Integrated Bioaerosol Sensor (WIBS) will also sample fluorescent biological particles, which
may relate and contribute to the INP population. The WIBS, TEM and STXM all fit in the CVI rack. The
Giant Nuclei Inlet (GNI) will also give size and hygroscopicity information on giant aerosols between 2
and 30 m, which could have impacts on liquid cloud properties, especially in conditions of heavier
wind. These will be the only data acquired on aerosol composition, but extra data should also be
available from the R/V Investigator. The PIs responsible for the aircraft probes will reduce these data
into a form that is useful for other investigators to use in addressing relevant hypotheses.
Remote sensing of cloud and aerosol properties is also critical. The HCR and HSRL provide
complementary information, with the HCR measuring reflectivity and Doppler velocity and the HSRL
measuring polarized backscatter and extinction. The radar and lidar will allow determination of vertical
cloud boundaries and make possible retrievals of cloud microphysical profiles (e.g., Mace 2010; Delanoe
and Hogan, 2008; Deng et al. 2010) including cloud phase (for the portion of clouds that can be
penetrated by the lidar). Steering committee members R. Marchand and A. Protat have considerable
experience in retrievals, with the resulting retrieved parameters allowing us to characterize the
latitudinal dependence of quantities such as cloud cover, phase, altitude, extinction, ice water content
and effective radii as needed for relevant hypotheses. If additional planned development work from M.
Hayman of RAF produces retrievals of effective radius, these results will also be used in the data
analysis. Other instruments include a gust pod, pyrgeometers, side video and all other standard
instrumentation. The payload size precluded the use of some desirable instrumentation. For example,
the G‐band water vapor radiometer (GVR) is capable of providing a microwave integrated liquid water
path (LWP) measurement. While appropriate for our deployment, the GVR was not identified as critical
because we will obtain in‐situ distributions and bulk measures of LWC and TWC that will help estimate
the total LWP. Additional estimates will be obtained from the HCR and HSRL and through use of
measured cloud thickness and assumptions about adiabatic LWC for thin turbulent clouds.
Mission managers at RAF have reviewed our requested instrument payload and confirmed that
it should fit on the G‐V provided that all of their working assumptions hold true (e.g., it assumes the HCR
will be automated before SOCRATES and does not need an on board operator). The payload is limited by
the availability of power, the number of pylons, weight, and by the number of available instrument racks
and seats for operators. The need to carry supplemental oxygen on the long Southern survey flights also
puts pressure on the payload. The supplemental oxygen system takes up two of the three aft cylinder
locations, while the CVI requires two bottles (some shared with the CFDC for its modest requirements).
Thus, one CVI bottle will be stored in the aft cylinder location and another on the I‐beam near their rack.
Both the HSRL and HCR are critical to accomplish our scientific objectives during SOCRATES, but
each imposes logistical constraints. The HSRL has a large impact on instrument space, as the HSRL
optical bench and telescope take up the equivalent floor space as 4 standard GV racks and an operator.
The large pod of the HCR reduces the range of the G‐V.
An overall operational constraint is that the sum of instrument racks and operator/scientist
seats must be less than 16. Because of the remote and stormy sampling region, RAF will appoint one of
their staff as a on‐board mission coordinator to work with the pilots and the mission scientist to ensure
execution of a safe flight plan of maximal scientific value in case of adverse weather conditions. We are
currently planning on 5 onboard operators/scientists: an HSRL operator, an ADS technician, the RAF
14mission coordinator and two of a CFDC operator, CVI operator and mission scientist. Although there is
ideally a separate operator for both the CFDC and CVI, it is possible the combined tasks could be
performed by a single individual with assistance from the mission scientist. This is not ideal because
both the CFDC and CVI can require intervention from a trained operator, particularly with the chemical
sampling required. Thus, our preferred approach would be for the mission scientist to stay at the
operations center in Tasmania/Christchurch and communicate with the mission coordinator remotely to
make any refinements to the flight plan. Communications and data download capabilities should be
good enough to make this option work, but we would request an experienced scientist from RAF (e.g.,
Jorgen Jensen or Jeff Stith) to serve as mission coordinator if this option is pursued. Although neither the
use of one operator for the CFDC and CVI or presence of the mission scientist at the operations center is
ideal, this is regarded as a better option than further reduction of the payload.
Table 4: Summary of Instruments on the G-V
Observations Instrument Funding Source Contact
Facility cloud microphysics 3‐V CPI (2DS and CPI), CDP, NSF McFarquhar (Illinois)
and other probes 2DC, RICE, King probe, Gust
pod, HARP (radiation)
Bulk water measurements CVI NSF Twohy (OSU) & Toohey (CU)
Ice nucleating particles CFDC and CSU‐IS filters NSF DeMott (CSU)
Aerosol concentration UHSAS, GNI NSF Jensen (NCAR)
Aerosol Composition Filter Samples, WIBS, STXM NSF DeMott (CSU)
CCN DMT CCN Counter NSF Roberts (Scripps)
Cloud and aerosol remote HCR, HSRL NSF Vivek & Hayman (NCAR)
sensing
Profiles of T, q, winds AVAPS dropsondes NSF McFarquhar (Illinois)
B. Other Aircraft proposed for SOCRATES related projects
i. British Antarctic Survey (BAS) Twin Otter
As part of SEASCAPE the BAS Twin Otter is proposed to measure aerosol and cloud distributions, bulk
water content, turbulent fluxes, and up‐ and downwelling solar and infrared radiative fluxes above and
below cloud, and to collect filter samples to characterize INPs. These observations will be obtained
further south than the G‐V can make, and hence will provide for comparison with SOCRATES data
obtained further north. Although the flights will not be coordinated, considerable synergy will be
obtained from analysis of both datasets.
ii. UAS Observations from New Zealand
Proposed UAS observations in 2017 and 2018 under sponsorship from the New Zealand government
would involve the design of a small airborne meteorological package for Antarctic and SO BL aerosol
cloud interaction research with field testing over the SO.
C. Shipborne platforms
Shipborne observations will characterize SO seawater properties and near‐surface conditions that
determine the amount and composition of biogenic aerosol fluxed from the ocean into the PBL during
the Austral summer campaign. Ships are also invaluable platforms for the remote sensing of cloud
macro‐ and microphysical properties, precipitation, and aerosol properties required to improve our
understanding of cloud and aerosol processes over the SO and their parameterizations in models.
i. R/V Investigator
The Australian‐funded CAPRICORN project (Clouds, Aerosols, Precipitation, Radiation, and atmospherIc
Composition Over the southeRn oceaN), will involve three cruises; two one‐month cruises into the SO
during austral summer 2015‐2016, and a proposed two‐month cruise in austral summer 2017‐2018
during the time period of the extensive G‐V observations. A new research vessel the R/V Investigator will
15be equipped with extensive cloud, precipitation, aerosol, atmospheric composition, oceanographic, and
air‐sea flux instrumentation (Table 5). An Integrated Sounding System (ISS) is also requested from the
Facility Pool. The main objectives of CAPRICORN are to: (i) characterize the cloud macrophysical and
microphysical properties, atmospheric composition, and precipitation properties of atmospheric frontal
cloud systems and associated interactions; (ii) evaluate CloudSat‐CALIPSO cloud microphysics, CloudSat
and GPM rainfall properties, CALIPSO lidar‐derived ocean products, and CALIPSO aerosol/cloud
discrimination, and (iii) evaluate the current skills of the Australian Community Climate and Earth
System Simulator (ACCESS) model at different scales (from high‐resolution models resolving convection
explicitly to weather forecast and climate models with coarser resolution) to reproduce the properties
of SO frontal cloud systems. The two one‐month cruises are funded and secured, while sea time for the
cruise during SOCRATES has been requested in response to a call for proposals to the Australian Marine
National Facility in July 2015; it is known that the proposal was highly rated but final funding decisions
have yet to be made.
Table 5: Instruments to be installed on R/V Investigator
Observations Instrument Contact
Cloud microphysics and dynamics W‐band vertically‐pointing cloud radar Protat (BOM)
UV mini‐Raman lidar
Precipitation macrophysics, C‐band dual‐polarization scanning radar Protat (BOM)
microphysics and dynamics Disdrometer and rain gauge
Basic atmospheric state profile Radiosondes; O3 & Compact Aerosol Backscatter Schofield (U. of
Detector (COBALD) sondes Melbourne)
Polarsondes (liquid/ice partitioning) Hamilton (U. of Adelaide)
Atmospheric BL structure Soundings, ISS Brown (NCAR)
1‐min in‐situ atmospheric state RMYoung5106 anemometer, Gill 2D Sonic Schulz (BoM) & Thomas
(wind speed & direction, T, RH, anemometer, Vaisala HMT33, RMYoung50202 siphon (MNF/CSIRO)
rain rate, incoming longwave & rain gauge, OSI‐815 Optical rain gauge, Eppley PSP &
shortwave radiation) PIR
Remotely sensed liquid water path 2‐channel microwave radiometer Fairall (NOAA)
Turbulent fluxes (latent heat, NOAA Flux package Fairall (NOAA)
sensible heat, water, momentum)
1‐min bulk turbulent fluxes (wind See 1‐minute average in‐situ atmospheric state data Schulz (BOM)
stress, latent heat, sensible heat,
radiation, net heat, mass flux)
Aerosol size distribution Nano‐SMPS (3‐150 nm, 5 min) Keywood (CSIRO/O&A)
SMPS (10‐700 nm, 5 min) Ristovskki (QUT)
Aerosol Particle Sizer (APS, 500 nm‐10 m)
Aerosol absorption at one Multi‐Angle Atmospheric Keywood (CSIRO/O&A)
wavelength and multiple angles Photometer
Aerosol Scattering Nephelometer (520, 807,400 nm) Keywood (CSIRO/O&A)
Aerosol Optical Depth Sun photometer Keywood (CSIRO/O&A)
Aerosol samples (size‐resolved) cascade impactor Keywood (CSIRO/O&A)
Aerosol composition Aerosol Chemical Speciation Monitor 250 nm ‐ 2.5 m Keywood (CSIRO/O&A)
Fluorescent biological aerosols WIBS‐4A DeMott (CSU)
CO2, CH4, N2O, CO cavity ringdown Van der Shoot
(CSIRO/O&A)
Ozone concentration ozone monitor (real‐time) Galbally (CSIRO/O&A)
NO, NOx, NO2 NOx monitor Galbally (CSIRO/O&A)
CCN and CN CCN and CN counters Keywood (CSIRO/O&A)
INPs CFDC and CSU‐IS DeMott (CSU)
VOCs Proton Transfer Mass Spectrometer (PTMS), VOC Lawson (CSIRO/O&A)
concentration; Online GC (30 min)
VOC and carbonyl samples Sequencer, absorbent tubes Lawson (CSIRO/O&A)
Hygroscopicity & aerosol volatility VHTDMA Ristovski (QUT)
Concentration of ions NAIS Ristovski (QUT)
Underway seawater supply Thermosalinograph: temperature, salinity McKenzie (MNF)
observations Fluorometer : Chlorophyll
16You can also read