Detailed characterization of the CAPS single-scattering albedo monitor (CAPS PMssa) as a field-deployable instrument for measuring aerosol light ...
←
→
Page content transcription
If your browser does not render page correctly, please read the page content below
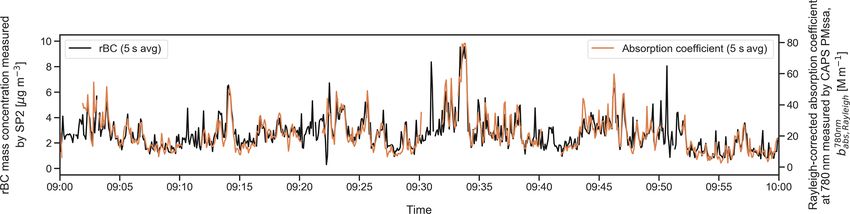
Atmos. Meas. Tech., 14, 819–851, 2021
https://doi.org/10.5194/amt-14-819-2021
© Author(s) 2021. This work is distributed under
the Creative Commons Attribution 4.0 License.

Detailed characterization of the CAPS single-scattering albedo
monitor (CAPS PMssa) as a field-deployable instrument for
measuring aerosol light absorption with the
extinction-minus-scattering method
Rob L. Modini1 , Joel C. Corbin2 , Benjamin T. Brem1 , Martin Irwin1,a , Michele Bertò1 , Rosaria E. Pileci1 ,
Prodromos Fetfatzis3 , Kostas Eleftheriadis3 , Bas Henzing4 , Marcel M. Moerman4 , Fengshan Liu2 , Thomas Müller5 ,
and Martin Gysel-Beer1
1 Laboratory   of Atmospheric Chemistry, Paul Scherrer Institute (PSI), 5232 Villigen PSI, Switzerland
2 Metrology   Research Centre, National Research Council Canada, 1200 Montreal Road, Ottawa K1A 0R6, Canada
3 Institute of Nuclear and Radiological Science & Technology, Energy & Safety N.C.S.R. ”Demokritos”, Attiki, Greece
4 Netherlands Organisation for Applied Scientific Research (TNO), Princetonlaan 6, 3584 Utrecht, the Netherlands
5 Leibniz Institute for Tropospheric Research (TROPOS), Permoserstrasse 15, 04318 Leipzig, Germany
a now at: Catalytic Instruments GmbH, Zellerhornstrasse 7, 83026 Rosenheim, Germany

Correspondence: Rob L. Modini (robin.modini@psi.ch)

Received: 17 July 2020 – Discussion started: 6 August 2020
Revised: 8 December 2020 – Accepted: 9 December 2020 – Published: 3 February 2021

Abstract. The CAPS PMssa monitor is a recently com-              calculation that enables the consideration of additional phys-
mercialized instrument designed to measure aerosol single-       ical processes such as reflection from the instrument’s glass
scattering albedo (SSA) with high accuracy (Onasch et al.,       sampling tube, which was neglected in an earlier truncation
2015). The underlying extinction and scattering coefficient      model. We validate the truncation calculations against com-
measurements made by the instrument also allow calculation       prehensive laboratory measurements. It is demonstrated that
of aerosol absorption coefficients via the extinction-minus-     the process of glass tube reflection must be considered in the
scattering (EMS) method. Care must be taken with EMS             truncation calculation, but that uncertainty still remains re-
measurements due to the occurrence of large subtractive er-      garding the effective length of the optical cavity. Another im-
ror amplification, especially for the predominantly scattering   portant source of uncertainty is the cross-calibration constant
aerosols that are typically found in the ambient atmosphere.     that quantitatively links the scattering coefficient measured
Practically this means that although the CAPS PMssa can          by the instrument to its extinction coefficient. We present
measure scattering and extinction coefficients with high ac-     measurements of this constant over a period of ∼ 5 months
curacy (errors on the order of 1 %–10 %), the correspond-        that demonstrate that the uncertainty in this parameter is very
ing errors in EMS-derived absorption range from ∼ 10 % to        well constrained for some instrument units (2 %–3 %) but
greater than 100 %. Therefore, we examine the individual er-     higher for others.
ror sources in detail with the goal of constraining these as        We then use two example field datasets to demonstrate
tightly as possible.                                             and summarize the potential and the limitations of using the
   Our main focus is on the correction of the scattered light    CAPS PMssa for measuring absorption. The first example
truncation effect (i.e., accounting for the near-forward and     uses mobile measurements on a highway road to highlight
near-backward scattered light that is undetectable by the in-    the excellent responsiveness and sensitivity of the instru-
strument), which we show to be the main source of under-         ment, which enables much higher time resolution measure-
lying error in atmospheric applications. We introduce a new,     ments of relative absorption than is possible with filter-based
modular framework for performing the truncation correction       instruments. The second example from a stationary field

Published by Copernicus Publications on behalf of the European Geosciences Union.
820 R. L. Modini et al.: Detailed characterization of the CAPS single-scattering albedo monitor (CAPS PMssa)
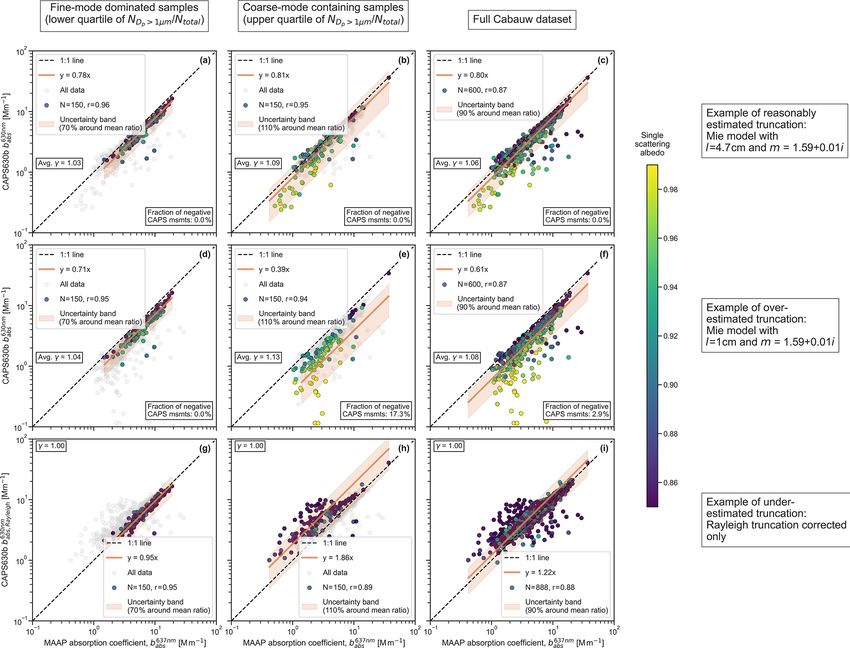
site (Cabauw, the Netherlands) demonstrates how truncation- 2004), which additionally measures the light backscattered
related uncertainties can lead to large biases in EMS-derived from aerosol-laden filter samples at two separate angles and
absolute absorption coefficients. Nevertheless, we use a sub- processes the resulting measurements with a simplified radia-
set of fine-mode-dominated aerosols from the dataset to show tive transfer model in order to improve the accuracy of the
that under certain conditions and despite the remaining trun- retrieved aerosol absorption coefficients. Collectively, these
cation uncertainties, the CAPS PMssa can still provide con- instruments are referred to as “filter-based absorption pho-
sistent EMS-derived absorption measurements, even for at- tometers”.
mospheric aerosols with high SSA. Finally, we present a de- While the popularity of filter-based absorption photome-
tailed list of recommendations for future studies that use the ters has provided critical insights into the optical proper-
CAPS PMssa to measure absorption with the EMS method. ties of atmospheric aerosols over the last decades, the lim-
These recommendations could also be followed to obtain itations of the technique are becoming more problematic
accurate measurements (i.e., errors less than 5 %–10 %) of as research efforts progress even further. Filter-based light
SSA and scattering and extinction coefficients with the in- absorption measurements are subject to large positive arti-
strument. facts due to the effects of multiple scattering from the filter
material and the deposited particles, and they are sensitive
to aerosol loading, humidity, and aerosol single-scattering
albedo, SSA (Moosmüller et al., 2009). An additional con-
1 Introduction cern is that the commercial production of some important
filter-based instruments has recently been discontinued (e.g.,
Light-absorbing aerosols such as black carbon (BC; Bond the PSAP by Radiance Research and the MAAP by Thermo
et al., 2013), brown carbon (BrC; Laskin et al., 2015), tar Fisher Scientific).
balls (Corbin and Gysel-Beer, 2019), anthropogenic iron ox- Motivated by the limitations in the filter-based tech-
ide (Moteki et al., 2017), and mineral dust (Sokolik and niques, instrumentation development efforts have recently
Toon, 1999) redistribute radiant energy in the Earth’s at- focused on methods for measuring light absorption by
mosphere as heat. This perturbs the Earth’s radiative bal- aerosols in their natural, suspended state. These techniques
ance directly (Haywood and Shine, 1995) and semi-directly include photoacoustic spectroscopy (Arnott et al., 1999;
through alteration of atmospheric circulation and cloud cover Lack et al., 2006), photo-thermal interferometry (Moos-
(Koch and Del Genio, 2010). Currently, large discrepan- müller and Arnott, 1996; Sedlacek, 2006), and extinction-
cies exist between global climate model simulations of minus-scattering (EMS) methods. Here we focus on the
column-integrated aerosol absorption (absorbing aerosol op- EMS method. The EMS method is comprised of two sepa-
tical depth, AAOD) and Sun photometer measurements of rate underlying measurements: one of the aerosol extinction
the same quantity taken within the AERONET network (bext ) and one of the aerosol scattering coefficient (bsca ). The
(Bond et al., 2013; Samset et al., 2018). The uncertainty aerosol absorption coefficient babs is then obtained by sub-
resulting from this discrepancy feeds into radiative forcing tracting bsca from bext :
estimates for absorbing aerosols, contributing to the large
and stubborn uncertainty in quantitative estimates of aerosol–
babs = bext − bsca . (1)
radiation climate effects (Myhre et al., 2013). One element
that is required to improve this situation and validate both the Traditionally, EMS measurements have been performed
model simulations and Sun photometer measurements is ac- by two separate instruments (e.g., an integrating nephelome-
curate and widespread measurements of atmospheric aerosol ter for aerosol scattering and a separate extinction monitor).
absorption coefficients (babs ). This activity requires sensitive, Additionally, the use of EMS measurements has mostly been
field-deployable, and robust in situ aerosol instrumentation limited to the laboratory where high absorption signals are
for measuring absorption (Cappa et al., 2016; Lack et al., easily achievable, and artifacts (e.g., due to the scattered light
2014; Moosmüller et al., 2009). truncation effect) can be avoided. In such a laboratory set-
Traditionally, aerosol light absorption has been derived ting, EMS measurements are considered a primary standard
by measuring the attenuation of light transmitted through for measuring aerosol absorption thanks to the traceability of
aerosol samples deposited on filter substrates (e.g., Rosen the underlying bext and bsca measurements (e.g., Bond et al.,
et al., 1978). A number of online (i.e., continuously mea- 1999; Schnaiter et al., 2003; Virkkula et al., 2005).
suring), field-deployable instruments have been developed The continued development of sensitive techniques for
based on this principle, including the aethalometer (Hansen measuring bext using multi-pass optical cavities (e.g., cavity
et al., 1984), the particle soot absorption photometer (PSAP; ring-down spectroscopy, Moosmüller et al., 2005, and cavity-
Bond et al., 1999), and the continuous light absorption pho- attenuated phase-shift spectroscopy, CAPS, Kebabian et al.,
tometer (CLAP; Ogren et al., 2017). An important further 2007) has created the possibility of extending application of
development of this class of instruments is the multi-angle the EMS technique more broadly to different types of at-
absorption photometer (MAAP; Petzold and Schönlinner, mospheric and/or test bench (i.e., emissions) measurements.
Atmos. Meas. Tech., 14, 819–851, 2021 https://doi.org/10.5194/amt-14-819-2021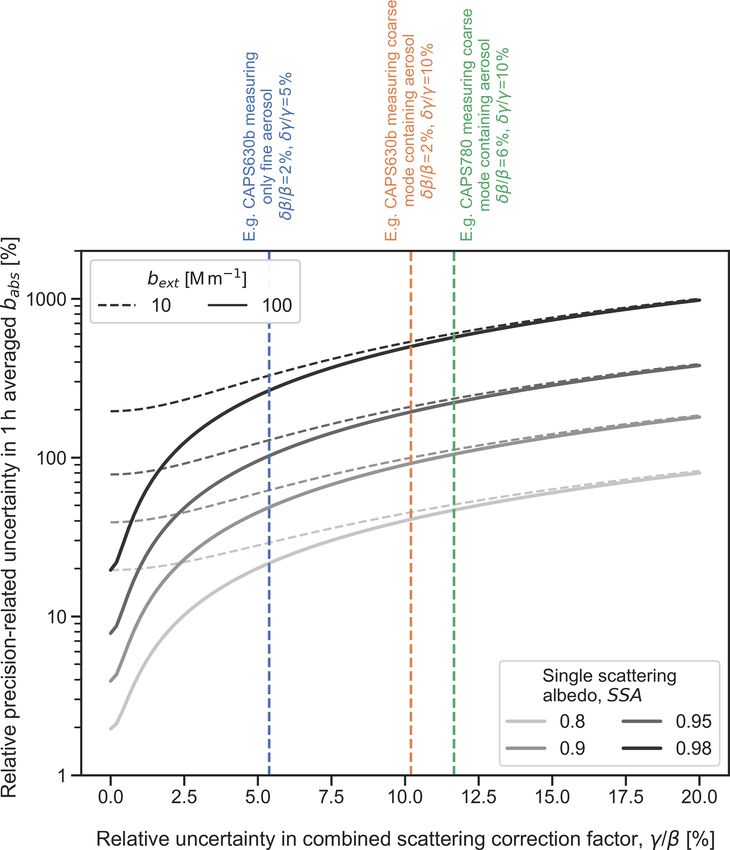
R. L. Modini et al.: Detailed characterization of the CAPS single-scattering albedo monitor (CAPS PMssa)                           821

This endeavor poses several challenges: (i) subtractive error         as we will show below – when using the very same measure-
amplification in EMS-derived babs can become very large               ments to derive babs . Therefore, the user must be concerned
when bsca is close to bext (i.e., as SSA → 1), which occurs           about errors on the order of only a few percent if they wish to
very commonly throughout the Earth’s atmosphere (Dubovik              use the CAPS PMssa to reliably measure atmospheric aerosol
et al., 2002), (ii) artifacts such as the scattered light trun-       absorption coefficients.
cation effect in integrating nephelometer measurements of                One of the key sources of uncertainty that must be con-
bsca are generally unavoidable and more difficult to quantify         sidered for the CAPS PMssa (and integrating nephelome-
for ambient aerosols (which are typically complex mixtures            try in general) is the scattered light truncation effect (e.g.,
of particles of varying size, composition, and morphology),           Moosmüller and Arnott, 2003; Varma et al., 2003). Integrat-
(iii) it is more difficult to ensure thorough and regular instru-     ing nephelometers seek to detect light scattered in all possi-
ment calibrations in a field vs. a laboratory setting, and (iv) it    ble directions. In reality, a fraction of near-forward and near-
is usually more difficult to control sampling arrangements in         backward scattered light is always lost due to unavoidable
the field to ensure that bext and bsca are measured under the         physical design limitations. As a result, bsca measurements
same (or at least well-known) environmental conditions.               are biased low and need to be corrected. The required cor-
   Despite these challenges, the possibility of performing            rection factor depends on a particular instrument’s geometry
EMS measurements of atmospheric aerosol absorption has                as well as the angular distribution of light scattered from an
recently been boosted by the development and commer-                  aerosol sample, which is a function of the optical wavelength
cialization of the cavity-attenuated phase-shift SSA monitor          and the size distribution, composition, mixing state, and mor-
(CAPS PMssa) by Aerodyne Research Inc. (Billerica, MA,                phology of the particles in that sample.
USA; Onasch et al., 2015). The CAPS PMssa monitor com-                   Onasch et al. (2015) presented a simple model for calculat-
bines measurements of bext and bsca in a single instrument            ing truncation correction factors for the CAPS PMssa based
and sample volume, following in the tradition of earlier com-         on Mie theory calculations with inputted particle size distri-
bined extinction-scattering instruments (Gerber, 1979; San-           butions. However, this model does not consider an important
ford et al., 2008; Strawa et al., 2003; Thompson et al., 2008).       physical process that serves to increase scattered light trun-
Its direct precursor instrument – the Aerodyne CAPS extinc-           cation: reflection of scattered light from the inner surface of
tion monitor (CAPS PMex) – uses the CAPS technique to                 the glass sampling tube within the integrating nephelometer.
measure bext values with high sensitivity in a compact opti-          Liu et al. (2018) developed a more sophisticated truncation
cal cavity and overall instrument unit (Massoli et al., 2010;         model based on solution of the radiative transfer equation
Petzold et al., 2013). The CAPS PMssa is based on the same            (RTE) configured specifically to the PMssa optical system.
optical cavity but additionally includes an integrating sphere        As well as allowing for the treatment of non-spherical par-
reciprocal nephelometer around the cavity for measurement             ticles (which is not possible with Mie theory), the RTE ap-
of bsca .                                                             proach also allows for the treatment of additional physical
   The CAPS PMssa was originally designed to measure SSA              processes (e.g., multiple scattering from the aerosol and glass
(i.e., the ratio of bsca to bext ), a quantity which is not subject   tube reflection). CAPS PMssa truncation values calculated
to the same subtractive errors as babs . However, its design          with these models have so far been validated against only
addresses two of the key challenges of atmospheric EMS                a limited dataset of experimental measurements (Onasch et
measurements that were listed in the paragraph above, which           al., 2015). Furthermore, there is a lack of systematic analy-
makes it an attractive candidate for performing such mea-             ses that aim to determine the sensitivity of EMS-derived babs
surements. Specifically, by simultaneously measuring bext             values to changes in calculated truncation (e.g., for ambient
and bsca for the same volume of air, there is no need to ac-          aerosol samples).
count for possible differences in environmental conditions               Despite the many unresolved uncertainties, the CAPS
or sampling losses that could affect these two coefficients.          PMssa has already been used as an instrument for measuring
Additionally, this feature allows the cross-calibration of one        babs in a number of different ambient field campaigns (Chen
coefficient against the other using white test aerosols (non-         et al., 2018; Han et al., 2017; Xie et al., 2019), emissions test-
absorbing, i.e., where bext = bsca ), which facilitates the de-       ing experiments (Corbin et al., 2018; Zhai et al., 2017), and
velopment of relatively simple field calibration procedures           soot characterization experiments (Dastanpour et al., 2017;
(in practice, bsca is cross-calibrated against bext in the CAPS       Forestieri et al., 2018; Perim de Faria et al., 2019).
PMssa). Nevertheless, great care must still be taken when                In this study, we present a compilation of theoretical cal-
performing EMS measurements with the CAPS PMssa to en-                culations, novel laboratory measurements, and example field
sure that errors in the underlying bext and bsca measurements         applications that all serve a common purpose: to improve the
are minimized and that very large subtractive error amplifica-        truncation correction approach and to determine the extent
tion is avoided. This essentially reduces down to the follow-         to which the CAPS PMssa can be used to measure aerosol
ing problem: errors that may be acceptable if one is interested       absorption coefficients via the EMS method.
in measuring bext , bsca , or SSA (say on the order of 5 %–              In Sect. 2 we present a theoretical description of the instru-
10 %) are substantially magnified – perhaps to over 100 %,            ment, including the introduction of a new truncation model

https://doi.org/10.5194/amt-14-819-2021                                                    Atmos. Meas. Tech., 14, 819–851, 2021
822 R. L. Modini et al.: Detailed characterization of the CAPS single-scattering albedo monitor (CAPS PMssa)
that includes the process of glass tube reflection and is suit- nal relative to the input signal. This phase shift is measured
able for application to large field datasets. This section cul- by the vacuum photodiode using a quadrature signal integra-
minates in the presentation of a detailed babs error model, tion method (Kebabian et al., 2007). This is the technique for
which is used to demonstrate why it is so critical to con- measuring extinction coefficients known as cavity-attenuated
strain errors in the truncation calculations and instrument phase-shift spectroscopy (CAPS), and its application in the
cross-calibration constant. This finding motivates the exper- CAPS PMssa is referred to as the “extinction channel” of the
imental work described in the remainder of the paper. Sec- instrument.
tion 3 details the experimental methods used. Section 4 then The second light detector in the instrument is a PMT that
presents some regular measurements of the CAPS PMssa is used to measure the integrated aerosol scattering coeffi-
cross-calibration constant in order to assess its precision and cient (Fig. 1). It is referred to as the “scattering channel” of
stability. In Sect. 5 we compare the results of novel and com- the instrument. The PMT is placed on the integrating sphere
prehensive laboratory truncation measurements with calcu- that surrounds the center of the optical cavity. The integrat-
lated values from a range of different truncation models. Syn- ing sphere has an inner diameter of 10 cm. The inside of the
thesizing all of these issues together, Sect. 6 then presents integrating sphere is coated white to form a Lambertian re-
two example field datasets that demonstrate both the poten- flector (reflectivity = 0.98), which functions to maximize the
tial and the limitations of using the CAPS PMssa to mea- amount of scattered light detected by the PMT and to mini-
sure atmospheric aerosol absorption. Finally, in the conclud- mize any bias between light collected from different scatter-
ing Sect. 7 we present a list of recommendations for future ing angles. Onasch et al. (2015) calculated that the variation
CAPS PMssa studies. in the angular sensitivity of the sphere as a function of scat-
tering angle is less than 1 %. The integrating sphere does not
contain a baffle as described by Onasch et al. (2015). A glass
2 Theoretical description of the CAPS PMssa monitor tube with an inner diameter of 1 cm passes through the center
of the integrating sphere in order to encapsulate the aerosol
2.1 General introduction flow along the central axis of the optical cavity.
In this study we define the central axis of the optical cavity
The CAPS PMssa monitor is described in detail previously as the z dimension and the center of the integrating sphere as
in the original technical paper by Onasch et al. (2015). A being at position z = 0 cm. A particle lying along the central
schematic diagram of the instrument is shown in Fig. 1. z axis scatters light in polar directions at scattering angles
Briefly, the instrument consists of an optical cavity formed θ defined with respect to the z axis (two limiting examples
by two high-reflectivity mirrors (reflectivity ∼ 0.9998), cre- for forward- (θ1 ) and back-scattered (θ2 ) light are shown in
ating a long effective optical path length (∼ 1–2 km). Aerosol Fig. 1) and azimuthal directions at scattering angles ϕ (not
samples are drawn continuously through this cavity at a shown in Fig. 1).
flow rate of 0.85 litres per minute (light blue arrows in
Fig. 1) with no size selection performed at the instrument
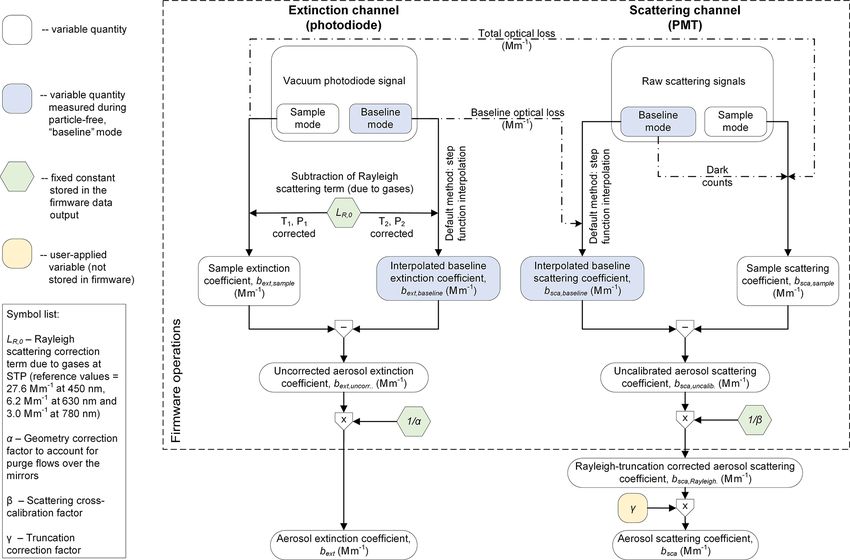
2.2 Data processing and important correction and
inlet, meaning that the samples generally contain both sub-
calibration factors
and super-micrometer particles. Smaller, particle-free purge
flows of ∼ 0.025 litres per minute are pushed continuously
over the high-reflectivity mirrors to prevent their contamina- The data processing chain applied by the CAPS PMssa in-
tion (green arrows in Fig. 1). The purge and sample flows are strument firmware to calculate aerosol extinction and scatter-
generated from the same double-headed membrane pump. ing coefficients from the measured photodiode and PMT sig-
The input light source to the cavity is provided by a sin- nals is displayed in Fig. 2 (Onasch et al., 2015). The instru-
gle light-emitting diode (LED). Units are available from the ment has two modes of operation where data are collected:
manufacturer Aerodyne Research, Inc. with LEDs centred at sample and baseline measurements. The sample and baseline
wavelengths of 450, 530, 630, 660, and 780 nm. The intensity measurements are achieved by a controlled three-way valve
of the LED input light is square-wave modulated (typically at that directs the sampled air either directly into the optical
17 kHZ), and the intensity of light leaking through one mir- cavity or first through a filter that removes all particles. The
ror is monitored by a vacuum photodiode or, in the case of instrument firmware allows the baseline measurements to be
the 780 nm unit, a photomultiplier tube (PMT). The intensity repeated automatically at a frequency and duration set by the
of the light circulating in the cavity increases exponentially user. Typically during field operation baseline measurements
during the LED on-phase and decreases exponentially during are performed for 1 min every 5 or 10 min.
the LED off-phase, with a timescale dependent on the reflec- In the extinction channel, the sample and baseline mea-
tivity of the mirrors and optical loss in the cell (Lewis et al., surements are first treated by subtracting out a constant fac-
2004). The introduction of a scattering or absorbing species tor that accounts for extinction due to Rayleigh light scatter-
to the cell enhances this optical loss, resulting in a shorter op- ing from the aerosol carrier gas. The subtraction term is cor-
tical lifetime in the cavity and a phase shift of the output sig- rected using temperature and pressure measurements taken
Atmos. Meas. Tech., 14, 819–851, 2021 https://doi.org/10.5194/amt-14-819-2021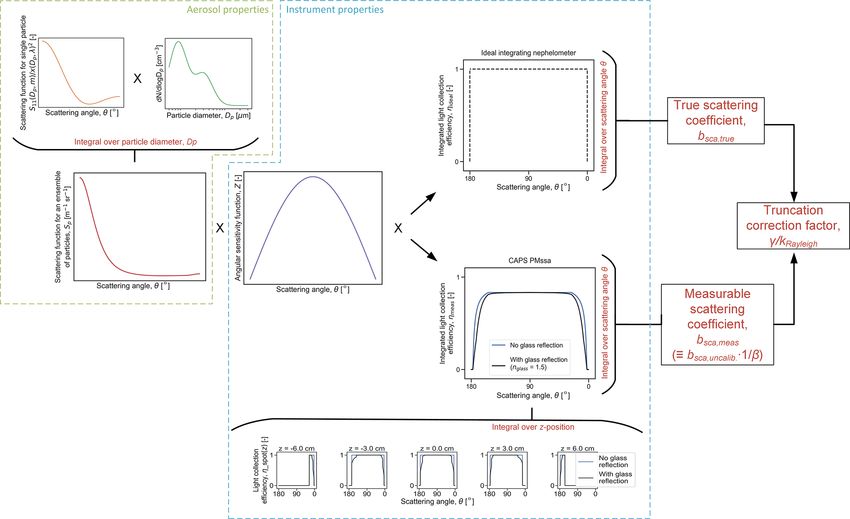
R. L. Modini et al.: Detailed characterization of the CAPS single-scattering albedo monitor (CAPS PMssa)                                823

Figure 1. Schematic diagram of the CAPS PMssa monitor with relevant components and variables highlighted. A glass tube encapsulates
the aerosol sample to be measured. A light-emitting diode (LED) delivers a square-wave modulated light signal as input to the optical cavity.
The phase shift of the output signal from the cavity relative to the input signal is measured by a vacuum photodiode: this is the extinction
channel of the instrument. Light scattered from the aerosol sample is collected by the integrating sphere and measured with a photomultiplier
tube (PMT): this is the scattering channel of the instrument. θ1 and θ2 are the two truncation angles for light scattered from a particle at
position z along the instrument axis (without considering reflection from the glass tube).

Figure 2. Data processing chain for the extinction and scattering channels of the CAPS PMssa. Blue boxes indicate quantities that are
measured during the periodic “baseline” mode of operation of the instrument. Hexagonal containers indicate fixed constants, and rounded
rectangular containers represent variable quantities.

https://doi.org/10.5194/amt-14-819-2021                                                        Atmos. Meas. Tech., 14, 819–851, 2021
824           R. L. Modini et al.: Detailed characterization of the CAPS single-scattering albedo monitor (CAPS PMssa)

by the instrument to account for possible variations in these            sured or calculated bext (e.g., Mie-calculated bext values for
quantities between sample and baseline periods.                          spherical, monodisperse test aerosols, Petzold et al., 2013,
   Full treatment of the PMT scattering signals is given by              or measured bext values for non-absorbing test aerosols ob-
Onasch et al. (2015). The scattering signals are counted dur-            tained with a reference nephelometer, Pfeifer et al., 2020).
ing the LED off-phase when only highly collimated light is                  Onasch et al. (2015) applied the Mie calculation approach
circulating in the cavity in order to minimize the contribu-             to measurements of polystyrene latex (PSL) spheres of vary-
tion of light scattered from interior surfaces of the instru-            ing diameter to determine an α value of 0.73 for a CAPS
ment. Consequently, the average intensity of circulating light           PMssa unit operating at 630 nm. This is lower than the
during the LED off-phase must be accounted for in the scat-              general value of 0.79 quoted by Onasch et al. (2015) for
tering calculation, as illustrated by the dot-dashed lines in            CAPS PMex monitors, which they note is expected due
Fig. 2 and described in detail in Onasch et al. (2015).                  to small differences in the cavity geometries. The CAPS
   Following these initial data treatment steps, uncorrected             PMssa units used in this study (Table 2) participated in Eu-
aerosol extinction and uncalibrated scattering coefficients              ropean Center for Aerosol Calibration (ECAC; http://www.
(bext, uncorr. and bsca, uncalib. , respectively) are obtained by        actris-ecac.eu/, last access: 29 January 2021) workshops
taking the difference between the sample-mode coefficient                (CAPS630b in August 2016 and CAPS450, CAPS630a, and
measurements (which we term bext, sample and bsca, sample )              CAPS780 in January 2017) where their geometry correction
and the interpolated baseline-mode coefficient measurements              factors were determined against reference instrumentation
(bext, baseline and bsca, baseline ). By default, the instrument         (CAPS PMex, nephelometer) using ammonium sulfate test
firmware uses a step function to interpolate the baseline val-           aerosols. The units were determined to have α values of 0.78
ues between each baseline period (i.e., the mean value of a              (CAPS450), 0.71 (CAPS630a), 0.7 to 0.73 (CAPS630b), and
baseline period is assumed to stay constant until it is replaced         0.78 (CAPS780). Therefore, it appears that α is instrument-
by the mean value of the next baseline period). However, the             unit-dependent. The stability of α over time is still an open
data output files from the instrument also provide sufficient            question. However, regular and frequent measurements of α
information for the user to apply custom methods for calcu-              in CAPS PMex monitors performed at the ECAC suggests
lating the interpolated coefficients bext, baseline and bsca, baseline   that it does not drift by more than 3 % over the period of a
(e.g., linear or cubic spline interpolation; Pfeifer et al., 2020).      year. By default, the CAPS PMssa firmware automatically
   Following the sample-baseline difference calculations,                applies an α factor of 0.73 to calculate bext (Fig. 2).
one extinction correction factor (the geometry correction
factor, α) and two scattering correction factors (cross-                 2.2.2   Scattering cross-calibration factor (β)
calibration, β, and truncation factors, γ ) are multiplicatively
applied to the respective signals in order to obtain the cali-           The scattering cross-calibration factor (β) is used to relate
brated and corrected aerosol coefficients bext and bsca . The            the PMT-measured scattering signal of the CAPS PMssa to
α and β factors are applied automatically by the instrument              an absolute aerosol scattering coefficient. The value of β can
firmware, while γ must be applied manually by the user in                be determined by cross-calibrating the uncalibrated aerosol
post-processing. All three correction factors are discussed in           scattering coefficient bsca, uncalib. against bext measured by
detail in the sections below. The aerosol absorption coeffi-             the extinction channel (Onasch et al., 2015). This approach
cient is then obtained as                                                is possible because the scattering and extinction coefficients
                                                                         are measured simultaneously for the same air sample, and
                                                                         bext measured using the CAPS method is effectively “cali-
                    1
babs =bext − bsca =   · bext, sample − bext, baseline                    bration free” (apart from the geometry correction factor, as
                    α                                                    discussed in Sect. 2.2.1, as well as potential non-linearities
         γ
        − · bsca, sample − bsca, baseline .                       (2)    at high baseline losses). Amongst other factors, β depends
         β
                                                                         on the PMT detector response, which can vary over time.
2.2.1   Geometry correction factor (α)                                   Therefore, regular cross-calibrations should be performed.
                                                                            Non-absorbing test samples are required to perform the
The purge flows that protect the high-reflectivity mirrors in            cross-calibration and to determine a value for β (i.e., purely
the CAPS PMssa shorten the effective optical path length                 scattering samples for which bext = bsca , or SSA = 1). In
of the cavity and may slightly dilute the instrument sam-                principle, the calibration can be performed with gases or
ple flow at the cavity inlet. Therefore, a correction factor             aerosol particles. In practice, we performed all calibrations
must be applied to the measured extinction coefficients in               in the present study with particles because readily available
order to account for these changes (Massoli et al., 2010;                calibration gases such as CO2 span a much smaller range in
Onasch et al., 2015; Petzold et al., 2013). We refer to this             bsca than is achievable with aerosols of different concentra-
correction factor as the geometry correction factor, α, which            tions, additional corrections are required to account for the
can be determined by external calibration, i.e., by compar-              changes in optical path length and dilution with the purge
ing CAPS PMssa measurements against independently mea-                   flows for different gases (see Sect. 2.2.1), and we have ob-

Atmos. Meas. Tech., 14, 819–851, 2021                                                      https://doi.org/10.5194/amt-14-819-2021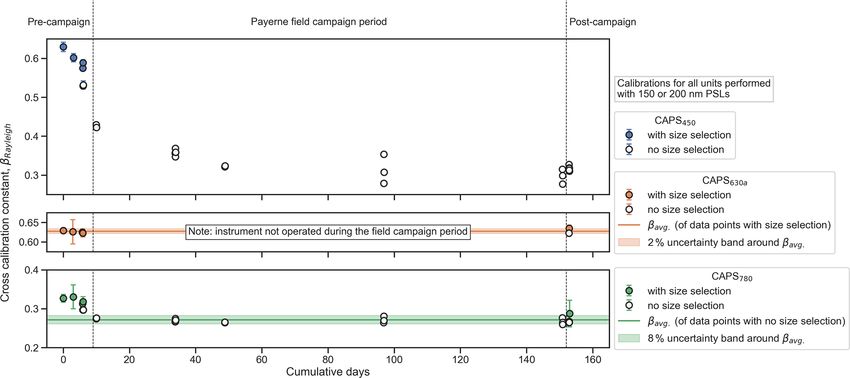
R. L. Modini et al.: Detailed characterization of the CAPS single-scattering albedo monitor (CAPS PMssa)                                 825

Table 1. Summary and description of uncertainties in the individual parameters comprising the error model described in Sect. 2.3. The
precision column represents uncertainty due to the limited precision with which a particular parameter can be determined during calibration
or measurement, and the drift column represents uncertainty due to possible drift of a parameter between available measurements. Estimated
values are taken from previous studies or this study as indicated. The estimated values with units of Mm−1 correspond to absolute errors,
and those with percentages relative errors.

 Parameter      Symbol             Precision             Drift (stability-       Description                                References
                                                         based uncertainty)
 Sample         bext, sample       1 Mm−1                n/a                     Conservative estimate of short-term,       Onasch et al.
 extinction                                                                      random noise.                              (2015)
 coefficient
 Baseline       bext, baseline     0.35 Mm−1             0.3 Mm−1                Values estimated from the Cabauw field     This study
 extinction                                              over 10 min             dataset (Fig. S8).
 coefficient                                             (CAPS630b)
 Sample         bsca, sample       1 Mm−1                n/a                     Conservative estimate of short-term,       Onasch et al.
 scattering                                                                      random noise.                              (2015)
 coefficient
 Baseline       bsca, baseline     0.66 Mm−1             0.1 Mm−1                Values estimated from the Cabauw field     This study
 scattering                                              over 10 mins            dataset (Fig. S8).
 coefficient                                             (CAPS630b)
 Geometry       α                  1%                    3 % over 1 year         Drift value determined from regu-          Petzold et al.
 correction                                                                      lar CAPS PMex measurements at the          (2013)
 factor                                                                          European Center for Aerosol Cali-
                                                                                 bration (ECAC; http://www.actris-ecac.
                                                                                 eu/, 29 January 2021) as part of the EM-
                                                                                 PIR BC project.
 Scattering     β                  2 % (CAPS450)         n/a (CAPS450)           Values estimated from the Payerne          This study
 cross-                            2 % (CAPS630a)        2 % (CAPS630a)          (Fig. 5) and Cabauw (Sect. 6.2.2) field
 calibration                       2 % (CAPS630b)        2.5 % (CAPS630b)        datasets.
 factor                            6 % (CAPS780)         8 % (CAPS780)
 Truncation     γ                  4 % for fine-mode-    n/a                     Values derived from the sensitivity        This study
 correction                        dominated aerosol                             analysis discussed in Sect. 6.2.3.
 factor                            9 % for coarse-
                                   mode-containing
                                   aerosol

Table 2. CAPS PMssa instrument units that were used in the present            When using the particle-based calibration method, non-
study.                                                                     absorbing aerosol particles with size parameters x in the
                                                                           Rayleigh light-scattering regime should be used to ensure
 Unit ID       Wavelength        Institute      Serial   Geometry          well-defined scattered light truncation, since the scattering-
                 (nm)                          number    correction        phase function is independent of particle size in the Rayleigh
                                                         factor (α)
                                                                           regime. We term cross-calibration constants derived in this
 CAPS450            450          PSI           314003         0.78         specific manner as βRayleigh . The size parameter x relates
 CAPS630a           630          PSI           313004         0.71         the aerosol particle diameter Dp to the wavelength of light λ
 CAPS630b           630          Demokritos    313003     0.7–0.73         through the expression π Dp /λ. The Rayleigh regime is de-
 CAPS780            780          PSI           314002         0.78
                                                                           fined by the condition x  1. In practice, there is a trade-off
                                                                           between selecting particle sizes that are small enough to lie
                                                                           within or near the Rayleigh regime limit but large enough
                                                                           to generate scattering and extinction signals with sufficiently
served that the instrument can take a long time (∼ hours) to               high signal-to-noise ratios. This means particles with diam-
adjust and stabilize when filled with different gases (as ex-              eter less than approximately 150 nm should be used to de-
pected due to the low flows and large filter areas in the purge            termine βRayleigh in the 450 nm CAPS PMssa, while slightly
flow setup).

https://doi.org/10.5194/amt-14-819-2021                                                        Atmos. Meas. Tech., 14, 819–851, 2021
826 R. L. Modini et al.: Detailed characterization of the CAPS single-scattering albedo monitor (CAPS PMssa)
larger particles (e.g., Dp ∼ 200 nm) can be used with 630 or pends on both the instrument properties as well as the an-
780 nm CAPS PMssa instruments. gular distribution of light scattered from the aerosol sam-
Formally, the Rayleigh-regime, particle-based cross- ple being measured (referred to in short as the ensemble
calibration approach can be expressed as scattering-phase function, Sp ), which depends on the aerosol
size distribution, morphology, mixing state, and composition
(refractive indices). The existing methods for calculating the
non−abs, Rayleigh non−abs, Rayleigh !
bsca, uncalib. bsca, uncalib. CAPS PMssa truncation correction factor γ either do not in-
βRayleigh = non−abs, Rayleigh
=α· non−abs, Rayleigh clude the process of scattered light reflection from the in-
bext bext, uncorr.
ner surface of the glass sampling tube (Onasch et al., 2015)
0
= αβRayleigh , (3) or are computationally expensive (Liu et al., 2018) and not
well suited for calculating time-resolved truncation factors
non−abs, Rayleigh non−abs, Rayleigh
where bext and bsca, uncalib. are the extinc- for large datasets (e.g., as required for the example Cabauw
tion and uncalibrated scattering coefficients, respectively, for dataset in Sect. 6.2). Therefore, we present here a new trun-
a population of non-absorbing particles with size parameters cation calculation framework that overcomes both of these
in the Rayleigh regime. The right-hand side of Eq. (3) is ob- limitations.
tained by substitution of the relationship bext = bext, uncorr. /α The new calculation framework is presented visually as a
into the left-hand side ratio. From this substitution, it can flowchart in Fig. 3. The full set of details and equations is
be seen that βRayleigh (and β, generally) is directly propor- given in Appendix A. Briefly, we define γ as the normalized
tional to the geometry correction factor α, which is required ratio of the true integrated scattering coefficient, bsca, true ,
to measure bext accurately as discussed in Sect. 2.2.1 (the re- to the truncation-affected scattering coefficient that is actu-
maining fraction of the cross-calibration constant is termed ally accessible to measurement, bsca, meas . The true scatter-
β 0 Rayleigh to distinguish it from βRayleigh ). Thus, Eq. (3) ing coefficient bsca, true represents the coefficient that would
demonstrates how the cross-calibration approach quantita- be measured by an ideal integrating nephelometer capable of
tively links bsca to bext in the CAPS PMssa. Following appli- collecting light scattered in all possible directions. The ratio
cation of βRayleigh , we refer to the calibrated aerosol scatter- requires normalization by a factor kRayleigh to represent the
ing coefficient corrected for the truncation of Rayleigh scat- fact that some scattered light truncation is already included
tered light as bsca, Rayleigh . This is to recognize the fact that implicitly in the cross-calibration constant, due to the way in
the cross-calibration approach represented by Eq. (3) implic- which it is measured. For the recommended case of cross-
itly corrects for the truncation of light scattered from the cal- calibration with Rayleigh scatterers according to Eq. (3),
ibration aerosol, which has been chosen specifically to have kRayleigh represents the truncation of the Rayleigh scattered
the well-defined phase function corresponding to Rayleigh light from the calibration aerosol. That is,
light scattering.
Onasch et al. (2015) demonstrated that the linearity shown Rayleigh
!
bsca, true bsca, true bsca, meas
by Eq. (3) is valid up to extinction coefficients of ∼ γ= · kRayleigh = · . (4)
bsca, meas bsca, meas Rayleigh
1000 Mm−1 , which is higher than typical ambient aerosol ex- bsca, true
tinction coefficients, excluding perhaps coefficients in heav-
ily polluted urban environments. The precise limit of lin- Defined in this manner, γ equals 1 for aerosols in the
earity should be examined for individual instrument units Rayleigh regime. For aerosols containing larger particles or
if it is relevant for a particular experiment. For very high non-spherical particles that produce more forward-focused
aerosol loadings above the limit of linearity the CAPS PMssa light scattering, γ is always greater than 1.
cross-calibration approach can still be used. However, this re- The equations for calculating the integrated scattering co-
quires the addition of empirically derived higher-order terms efficients in Eq. (4) are detailed in Appendix A. These equa-
non−abs, Rayleigh tions have been given in several previous publications (An-
in bext to Eq. (3). In addition, the potential occur-
rence of multiple scattering effects needs to be considered at derson et al., 1996; Heintzenberg and Charlson, 1996; Moos-
very high aerosol loadings (Wind and Szymanski, 2002). müller and Arnott, 2003; Müller et al., 2011b; Peñaloza,
1999). The novel aspect of our formulation is that we explic-
2.2.3 Truncation correction factor (γ ) itly define a function representing the efficiency with which
an integrating nephelometer is able to collect scattered light,
The final quantitative correction factor that must be applied η(θ, λ), which is a simple function varying between 0 and 1.
to the scattering coefficients measured with the CAPS PMssa Values of 0 indicate that a nephelometer collects no light of
is the truncation correction factor, γ . The truncation correc- wavelength λ at some scattering angle θ , while values of 1
tion factor γ is applied to bsca, Rayleigh to compensate for indicate that a nephelometer collects all the light scattered at
the light scattered in near-forward and near-backward di- angle θ . Considering η(θ, λ) explicitly has a number of ad-
rections that is not measured by the instrument due to ge- vantages: (i) it allows transparent representation of an instru-
ometric restrictions. The truncation correction factor γ de- ment’s truncation angles (i.e., by setting η equal to 1 between
Atmos. Meas. Tech., 14, 819–851, 2021 https://doi.org/10.5194/amt-14-819-2021R. L. Modini et al.: Detailed characterization of the CAPS single-scattering albedo monitor (CAPS PMssa) 827 Figure 3. Schematic diagram of the new model for calculating truncation correction factors for the CAPS PMssa. Full details of the calcu- lations are presented in Appendix A. The model requires as input a light collection efficiency function and an angular sensitivity function, which are determined by the geometry of the CAPS PMssa optical system; and a scattered light intensity function for the ensemble of parti- cles being measured, which is a function of the particle size distribution (dN,/ dlogDp) and size-dependent aerosol scattering-phase function. The main output of the model is the truncation correction factor, γ . two truncation angles and 0 beyond them), (ii) it allows for that needs to be considered outside the sphere’s boundaries the simple and explicit introduction of additional physical as the l parameter. The geometrical limits for the l parameter processes into light-scattering calculations (e.g., reflection are 0 (i.e., no extra path length considered) and 4.7 cm (the from the glass sampling tube can be considered by combin- distance between the integrating sphere and the sample inlet ing the Fresnel equation for reflection probability with η, as and outlet ports to the optical cavity). Onasch et al. (2015) shown in Appendix A), (iii) it provides a clear and intuitive and Liu et al. (2018) both used l = 1 cm in their calculations way to compare the abilities of different nephelometers to (i.e., they considered a z range from −6 to 6 cm). The ηspot collect scattered light, and (iv) it emphasizes the modular na- subplots in Fig. 3 also demonstrate the effect of glass tube ture of the truncation calculation. reflection: between a sphere’s truncation angles, reflection One of the important characteristics of integrating sphere- decreases the probability of light collection from 1 to some type reciprocal nephelometers like the CAPS PMssa is that value less than 1. Therefore, glass tube inner surface reflec- truncation is a function of position along the central axis tion serves to increase scattered light truncation. A single, of the optical cavity (which we denote as the z dimension, integrated light collection efficiency function for the CAPS Fig. 1). This characteristic is represented by the small sub- PMssa can be generated by integrating ηspot over all possible plots in Fig. 3 that show light collection efficiency curves z positions (Eq. A13). CAPS PMssa integrated η functions (termed ηspot in Appendix A) for six different z positions in are shown in Fig. 3 for the two cases of without and with the CAPS PMssa, including for two positions at 1 cm outside glass reflection. of the integrating sphere (i.e., z = −6 and 6 cm). Positions It is important to stress the implications of the modularity outside of the integrating sphere must be considered since it of truncation calculation. This modularity means that once is possible for particles outside the sphere to scatter light into the η(θ, λ) and angular sensitivity functions are known for a the sphere (e.g., Varma et al., 2003), even if only through a particular instrument, they can be combined with any mea- narrow range of scattering angles. We term the extra length sured or calculated ensemble scattering-phase function in or- https://doi.org/10.5194/amt-14-819-2021 Atmos. Meas. Tech., 14, 819–851, 2021
828          R. L. Modini et al.: Detailed characterization of the CAPS single-scattering albedo monitor (CAPS PMssa)

der to calculate γ . In the present study, we used Mie theory      samples being measured. Regarding uncertainties in the lat-
and co-located particle size distribution measurements to ef-      ter category, these can be further characterized depending on
ficiently calculate hourly resolved Sp functions and γ values      how the angularly resolved light-scattering information is ob-
for a month-long field campaign (Sect. 6.2; Fig. S12). This        tained. In the best-case scenario, the scattering-phase func-
Mie calculation method assumes spherical, homogeneous              tions would be obtained directly from co-located polar neph-
particles. If one wished to consider more complex particle         elometer measurements, in which case δγ would depend on
morphologies, a more sophisticated optical model could be          the accuracy of these measurements (and possible extrapola-
used to calculate the scattering-phase functions Sp , or if co-    tion of those measurements beyond a polar nephelometer’s
located polar nephelometer measurements of the scattering-         truncation angles). Since polar nephelometer measurements
phase function were available (e.g., Espinosa et al., 2018),       are rarely performed in measurement campaigns, it is more
these could be input directly into the truncation calculation.     likely that scattering-phase functions will be calculated with
                                                                   an optical model (e.g., Mie theory) using co-located size
2.3   Absorption error model for the CAPS PMssa and                distribution measurements (covering both sub- and super-
      discussion of the sources and effects of                     micrometer size fractions) as input. In this case, δγ will be a
      uncertainties in β and γ                                     function of the accuracy of the input size distribution mea-
                                                                   surements, as well as the representativeness of the optical
It is critical to carefully consider and understand the sources    model and its inputs (e.g., complex refractive index, parti-
of errors in EMS-derived babs values, since these can be very      cle morphology if the optical model includes treatment of
large when taking the difference of two potentially larger         this). In the worst-case scenario, which is expected to occur
numbers – bsca and bext – that each carry their own uncer-         frequently in field work, there might be no information avail-
tainties. Based on the data processing framework presented         able to constrain the scattering-phase function. In this case, γ
in the previous Sect. 2.2, an error model can be constructed       values would need to be assumed. For example, a user might
for CAPS PMssa absorption coefficients by considering the          simply assume that γ equals 1, which is equivalent to assum-
uncertainty in each of the individual parameters on the right-     ing that all particles in the sample are Rayleigh light scatter-
hand side of Eq. (2) and applying the standard rules of error      ers. In this case, δγ should reflect the possible consequences
propagation, including consideration of potential covariance       of that assumption. In Table 1 we provide some estimates for
of the errors in bsca and bext . The explicit equations for such   both δγ and δβ that are based on the results of the present
a model are given in Appendix B. Table 1 lists the individual      study. These estimates and results are discussed in specific
parameters in the error model along with realistic estimates       detail below in Sects. 4, 5, and 6.
of their uncertainties. In general, we consider two sources of        For now, we use our error model to assess the possible
uncertainties: uncertainty due to the limited precision with       impacts of δγ and δβ on the relative uncertainty in EMS-
which a particular parameter can be determined during cali-        derived babs , regardless of where the uncertainty in these two
bration or measurement and uncertainty due to possible drift       parameters actually comes from. Indeed, we generalize this
of a parameter between available calibrations or measure-          analysis even further by considering the relative uncertainty
ments (e.g., baseline drift between two subsequent baseline        in the combined bsca correction factor γ /β, given by the
measurements). For a given parameter, these two sources of         equation
errors are independent and can be added in quadrature, or if
one of the errors is much larger than the other, this larger
error can simply be used in error propagation calculations.                     s
                                                                                            2               2
   Many of the individual uncertainty estimates given in Ta-       δ (γ /β)             δγ                δβ
ble 1 are taken from previous studies and will not be dis-                  =                     +                 .          (5)
                                                                     γ /β                γ                β
cussed in great detail here. However, the uncertainties in the
bsca correction factors γ and β are still poorly constrained
and require further investigation. We refer to these uncertain-        This approach is motivated by the fact that δγ and δβ have
ties as δγ and δβ, respectively. Onasch et al. (2015) showed       equal impacts on the uncertainty in EMS-derived babs , and it
that β can be measured with high precision for a 630 nm            is justified because δγ and δβ are independent of one another.
PMssa unit, but the obtainable precision at other operation            The relative uncertainty in babs calculated with our error
wavelengths as well as the stability in β over time have not       model can be interpreted as the precision with which babs
been fully explored. Therefore, the overall δβ is still not well   can theoretically be determined for a given set of error model
characterized.                                                     inputs. It should be noted that in addition to this precision-
   The uncertainty in γ is more difficult to quantify. At the      based uncertainty, the absolute accuracy of babs will also de-
highest level it can be categorized into uncertainties related     pend directly on the accuracy of the geometry correction fac-
to the instrument properties (e.g., should glass tube reflection   tor α if the instrument is cross-calibrated as recommended
be considered, and an appropriate l value) and those related       in Sect. 2.2.2. This is because in the same manner as with
to knowledge of the scattering-phase functions of the aerosol      bsca , the cross-calibration serves to define babs with respect

Atmos. Meas. Tech., 14, 819–851, 2021                                                    https://doi.org/10.5194/amt-14-819-2021
R. L. Modini et al.: Detailed characterization of the CAPS single-scattering albedo monitor (CAPS PMssa) 829
to α, which can be seen by substituting the right-hand side of
Eq. (3) into (2):
!
1 γ
babs = · bext, uncalib. − 0 · bsca, uncalib. . (6)
α βRayleigh
In the present study we do not explicitly consider the α-
related uncertainty in babs , though it is important to keep this
in mind. Specifically, we note that the errors in α cause co-
variant errors in bext and bsca . Hence, the relative error in α
propagates 1-to-1 to the corresponding relative error in EMS-
derived babs , independently of SSA. This is not the case for
errors in β 0 Rayleigh , for example, which lead to an error in
bsca that is independent of errors in bext and therefore rel-
ative errors in babs that do vary with SSA. In practice, the
uncertainty due to α can only be determined by comparison
of CAPS PMssa measurements against an independent refer-
ence. It is also worthwhile noting that the uncertainty in SSA
measured by CAPS PMssa does not depend on the uncer-
tainty in α, since this factor simply cancels out when taking
the ratio of bsca to bext . This is one of the key design features
of the cross-calibrated instrument (i.e., the relative error in α
makes identical and covariant contributions to the errors in
bext , bsca , and babs ).
Figure 4. Theoretically calculated relative uncertainty in 1 h aver-
Focusing on the precision-related uncertainty in babs that aged CAPS PMssa babs measurements as a function of the relative
is quantified by our error model (Eq. B2), Fig. 4 dis- uncertainty in the combined scattering correction factor (defined in
plays this variable as a function of the combined rela- Eq. 5 using the ratio of the truncation correction factor γ and the
tive uncertainty in β and γ for a range of different at- instrument cross-calibration factor β). Curves are shown for four
mospheric conditions (two different aerosol loadings and different SSA values (grey shading) and two different aerosol load-
four different SSA values). The curves in this figure were ings (bext of 10 and 100 Mm−1 ). The curves were generated using
generated using the following model inputs designed to the error model presented in Sect. 2.3 and Appendix B with inputs
represent the CAPS630b instrument characteristics dur- that were chosen to represent instrument characteristics during the
ing the Cabauw field campaign (Sect. 6.2): [α = 0.73, Cabauw field campaign, as detailed in the main text.
δα√ = 0, β = 0.81, γ = 1.04, δbext, sample = δbsca, sample =
1/ 3600 Mm−1 , bext, baseline = 512 Mm−1 , δbext,baseline =
0.35 Mm−1 , bsca, baseline = 50 Mm−1 , and δbsca, baseline = these two points together and considering the example case
0.66 Mm−1 ]. Parameter δα was set to 0 to reflect the fact that demonstrated by the vertical red dashed line, a combined un-
the accuracy of α is not considered in the simulation as well certainty of only 10.2 % in γ and β leads to precision-related
as the assumption that α does not vary between subsequent uncertainties in babs of over 80 % at SSA greater than 0.9.
cross-calibration measurements. Figure 4 can be interpreted Such large SSA is very common for atmospheric aerosols,
as follows: taking an uncertainty of 5 % for γ and 2 % for β which highlights why it is so critical to minimize uncertain-
(which we will show later to be realistic estimates), the rela- ties in β and γ when using the CAPS PMssa to measure at-
tive uncertainty in the combined bsca correction factor equals mospheric aerosol absorption with the EMS method.
5.4 % based on Eq. (6). This example corresponds to vertical The divergences between the corresponding dashed and
blue dashed line in Fig. 4. Two other realistic examples are solid grey lines in Fig. 4 represent the effects of the errors
also shown in the figure as vertical dashed lines. in both the extinction and scattering baseline signals. These
Several important and general features are apparent in errors can be important under very clean atmospheric con-
Fig. 4. Firstly, it is seen that the precision-related uncertainty ditions (represented by the case bext = 10 Mm−1 ), since the
in babs increases dramatically with small increases in uncer- absolute differences between sample-mode and baseline sig-
tainty in either β or γ . As a result, small uncertainties in β nals are then small. However, these sources of uncertainty are
or γ can result in large uncertainties in babs . The relative un- quickly overwhelmed as uncertainties in β and γ increase,
certainty in babs is also a strong function of SSA due to the resulting in the convergence of the pairs of dashed and solid
large subtractive error amplification that results from taking grey lines moving from left to right across the figure. For the
the difference of two large and uncertain numbers. Taking high aerosol load case (represented by bext = 100 Mm−1 ), it
https://doi.org/10.5194/amt-14-819-2021 Atmos. Meas. Tech., 14, 819–851, 2021830 R. L. Modini et al.: Detailed characterization of the CAPS single-scattering albedo monitor (CAPS PMssa)
is interesting to note that for 0 % uncertainty in β and γ , wavelength of the instrument was 637 nm, not the nominal
the relative uncertainty in babs is still SSA dependent, even value of 670 nm. Assuming an absorption Ångström expo-
though bsca has been defined with respect to bext by the cross- nent of 1.02, a 5 % correction factor should be applied to the
calibration and δα set to 0 in the simulation. This is because firmware output of the MAAP to account for this wavelength
bext, sample and bsca, sample still carry independent uncertainty difference (Müller et al., 2011a). This correction factor was
due to random noise, even if this is relatively small (i.e., applied in the present study. A mass absorption cross-section
1 Mm−1 at 1 s temporal resolution). value of 6.6 m2 g−1 was used to convert the equivalent BC
The babs uncertainty values displayed in Fig. 4 were simu- mass concentrations reported in the firmware output of the
lated to represent 1 h averaged measurements. Figure S1 indi- MAAP to absorption coefficients (as specified by the manu-
cates that the equivalent values representing 1 min averaged facturer).
measurements are practically equivalent to those shown in During the RAOS campaign (Petzold et al., 2005), MAAP
Fig. 4, while those representing 1 s measurements are only absorption coefficients were observed to have no relationship
greater for low values of uncertainty in β and γ . This is be- with aerosol SSA. However, at extremely high SSA values
cause of all the uncertainties listed in Table 1, only the un- the absorption coefficient measurements from the MAAP can
certainties in bext, sample and bsca, sample are related to random be biased high. It is also important to consider that – to the
noise and hence can be reduced by signal averaging. Since best of our knowledge – no dedicated study has yet been per-
these error components are small relative to the other error formed to assess the precision and accuracy of MAAP mea-
components in the model, averaging for 1 min or 1 h has only surements of samples containing a large fraction of super-
a minor effect on the calculated uncertainty in babs . micrometer particles. To quantitatively compare the MAAP
and CAPS PMssa absorption coefficients during the Cabauw
field campaign, both coefficients were adjusted to standard
3 Experimental methods temperature (273.15 K) and pressure (1 atm). It should be
stressed that in this comparison we do not consider the
3.1 Instrumentation MAAP to be a true reference standard for measuring aerosol
absorption coefficients. Rather, the value of the instrument
3.1.1 Instruments for measuring aerosol light for the present study lies in the fact that it displays very
absorption and black carbon concentrations low instrument unit-to-unit variability, which means it can
provide a common and stable reference point against which
In this section we detail the experimental methods that we ap- CAPS PMssa absorption measurements can be compared.
plied to investigate and characterize the ability of the CAPS A single particle soot photometer (SP2; Droplet Measure-
PMssa to measure atmospheric aerosol absorption coeffi- ment Technologies, Longmont, CO, USA) was used to mea-
cients. A total of four different CAPS PMssa monitors were sure black carbon mass concentrations at high time resolution
used in this study: one operating at 450 nm, two at 630 nm, from a mobile laboratory deployed during the Bologna field
and one at 780 nm. The four units are listed in Table 2 along campaign (Sect. 3.4.2). The SP2 measures the mass of indi-
with their relevant specifications. vidual black carbon particles on a single-particle basis using
A multi-angle absorption photometer (MAAP; Thermo the principle of laser-induced incandescence. The instrument
Fisher Scientific, Waltham, MA, USA) was used during the has been described in detail previously (Schwarz et al., 2006;
Cabauw field campaign (Sect. 3.4.1) to measure absolute Stephens et al., 2003). Due to its very high sensitivity and re-
aerosol absorption coefficients at a wavelength of 637 nm sponsiveness, its specific purpose in the present study was to
(Petzold and Schönlinner, 2004). As discussed in the Intro- provide a high time resolution reference time series of rela-
duction, the MAAP is a filter-based absorption photometer tive absorbing aerosol concentration. Its configuration during
that incorporates additional measurements of back-scattered the present study is described by Pileci et al. (2020a).
light and a two-stream radiative transfer scheme in order to
constrain aerosol absorption coefficients more tightly than 3.1.2 Particle size classifiers applied for
is possible with simple light attenuation measurements. The cross-calibration and truncation measurements
MAAP is a well-known and well-characterized instrument
for measuring light absorption by atmospheric aerosols. The Two different types of aerosol size classifiers were used to
accuracy of MAAP absorption coefficients was investigated generate monodisperse test aerosols for the purposes of mea-
against laboratory reference EMS absorption measurements suring cross-calibration constants and scattered light trunca-
in the Reno Aerosol Optics Study (RAOS), and the two meth- tion: an aerodynamic aerosol classifier (AAC; Cambustion
ods were found to agree within 7 % for a range of differ- Ltd, Cambridge, UK) and a differential mobility analyzer
ent black-carbon-containing aerosols (Petzold et al., 2005). (DMA; custom-built version of the same design as the TSI
Müller et al. (2011a) demonstrated that the unit-to-unit vari- Model 3081 long-column DMA, TSI Inc. Shoreview, MN,
ability between six different MAAP instruments was less USA). The correct operation and sizing of both types of clas-
than 5 %. These authors also showed that the true operation sifiers was confirmed throughout all the experiments by mea-
Atmos. Meas. Tech., 14, 819–851, 2021 https://doi.org/10.5194/amt-14-819-2021You can also read