Considering the future of anthropogenic gas-phase organic compound emissions and the increasing influence of non-combustion sources on urban air ...
←
→
Page content transcription
If your browser does not render page correctly, please read the page content below
Atmos. Chem. Phys., 18, 5391–5413, 2018
https://doi.org/10.5194/acp-18-5391-2018
© Author(s) 2018. This work is distributed under
the Creative Commons Attribution 4.0 License.

Considering the future of anthropogenic gas-phase organic
compound emissions and the increasing influence of non-combustion
sources on urban air quality
Peeyush Khare1 and Drew R. Gentner1,2
1 Department of Chemical and Environmental Engineering, Yale University, New Haven, CT 06511, USA
2 SEARCH   (Solutions for Energy, Air, Climate and Health) Center, Yale University, New Haven, CT 06511, USA

Correspondence: Drew R. Gentner (drew.gentner@yale.edu)

Received: 17 August 2017 – Discussion started: 23 August 2017
Revised: 6 March 2018 – Accepted: 27 March 2018 – Published: 20 April 2018

Abstract. Decades of policy in developed regions has suc-      sions from this diverse array of sources that emphasizes a
cessfully reduced total anthropogenic emissions of gas-phase   life cycle approach over longer timescales and three emis-
organic compounds, especially volatile organic compounds       sion pathways that extend beyond the short-term evapora-
(VOCs), with an intentional, sustained focus on motor vehi-    tion of VOCs: (1) solvent evaporation, (2) solute off-gassing,
cles and other combustion-related sources. We examine po-      and (3) volatilization of degradation by-products. Further-
tential secondary organic aerosol (SOA) and ozone forma-       more, we find that ambient SOA formed from these non-
tion in our case study megacity (Los Angeles) and demon-       combustion-related emissions could be misattributed to fos-
strate that non-combustion-related sources now contribute a    sil fuel combustion due to the isotopic signature of their
major fraction of SOA and ozone precursors. Thus, they war-    petroleum-based feedstocks.
rant greater attention beyond indoor environments to resolve
large uncertainties in their emissions, oxidation chemistry,
and outdoor air quality impacts in cities worldwide. We con-
strain the magnitude and chemical composition of emissions
via several bottom-up approaches using chemical analyses of    1   Introduction
products, emissions inventory assessments, theoretical cal-
culations of emission timescales, and a survey of consumer     Anthropogenic emissions of gas-phase organic compounds,
product material safety datasheets. We demonstrate that the    including volatile organic compounds (VOCs), are of di-
chemical composition of emissions from consumer products       rect concern as toxic or carcinogenic air pollutants in in-
as well as commercial and industrial products, processes,      door and outdoor environments (Cohen et al., 2005; Nazaroff
and materials is diverse across and within source subcate-     and Weschler, 2004; Weschler and Nazaroff, 2008). Often
gories. This leads to wide ranges of SOA and ozone for-        they are more important for air quality as reactive precur-
mation potentials that rival other prominent sources, such     sors to the formation of outdoor tropospheric ozone and
as motor vehicles. With emission timescales from minutes       secondary organic aerosol (SOA) as well as indoor SOA
to years, emission rates and source profiles need to be in-    and thus play a central role in the elevated mortality and
cluded, updated, and/or validated in emissions inventories     morbidity rates caused by fine-mode particulate matter (i.e.,
with expected regional and national variability. In partic-    PM2.5 ) and ozone in both developed and developing regions
ular, intermediate-volatility and semi-volatile organic com-   (Destaillats et al., 2006; Jerrett et al., 2009; Lim et al., 2012;
pounds (IVOCs and SVOCs) are key precursors to SOA, but        Nazaroff and Weschler, 2004; Pope and Dockery, 2006; Sar-
are excluded or poorly represented in emissions inventories    war et al., 2004; Singer et al., 2006; Weschler, 2011). In ur-
and exempt from emissions targets. We present an expanded      ban and downwind areas globally, 20–70 % of PM2.5 is or-
framework for classifying VOC, IVOC, and SVOC emis-            ganic aerosol (OA), with SOA comprising 58 % of OA in

Published by Copernicus Publications on behalf of the European Geosciences Union.
5392              P. Khare and D. R. Gentner: The increasing influence of non-combustion sources on urban air quality

urban areas and 82 % downwind on average (Zhang et al.,                                                                          Generations of low-
                                                                                                                                 emission vehicles (LEV)
2007).                                                                     2020                                                      LEV-III (2017–)
                                                                                                                                     LEV-II (2004–2016)
   Yields of SOA and ozone are strongly dependent on pre-                  2015                                                      LEV-I (1994–2003)
                                                                                                                                     Pre-LEV (–1993)
cursor molecular size, volatility, structure, and moieties and
                                                                           2010
functionalities, as well as environmental conditions (Gen-

                                                                    Year
tner et al., 2012; Kroll and Seinfeld, 2008). SOA models                   2005

have struggled to reproduce observations due to incomplete                 2000
knowledge on SOA precursors and their sources (Hallquist et                1995
al., 2009; Kroll and Seinfeld, 2008). Gas-phase organic com-
                                                                           1990
pound measurements and emissions data have historically fo-
cused on VOCs (i.e., C2 –C12 alkanes and VOCs with equiv-                     0     2    4    6   8    0    4 8 12 16       0    2 4 6 8 10
alent volatilities), but research has demonstrated the preva-                     Vehicle                  Fuel use             VOC emissions
                                                                                                           6          -1            2
                                                                            population (x 106)        (x 10 gallons day )       (x 10 tons day-1)
lence and importance of larger, intermediate-volatility and
semi-volatile organic compounds (IVOCs and SVOCs, re-              Figure 1. Characteristic evolution and modernization of in-use mo-
spectively; Gentner et al., 2012; Kroll and Seinfeld, 2008;        tor vehicle fleets. Trends in motor vehicle population, fuel use,
Robinson et al., 2007; Zhao et al., 2014). With greater SOA        and VOC emissions for model years conforming to pre-LEV, LEV-
mass yields, IVOCs and SVOCs are key for modeling and              I, LEV-II, and LEV-III emissions standards in California’s South
mitigating SOA but are less studied due to measurement dif-        Coast Air Basin for 1990–2020 from CARB’s EMFAC database
ficulties (Gentner et al., 2012; Goldstein and Galbally, 2007).    (California Air Resources Board, 2014).
While their emissions from motor vehicles have received
more attention, emissions from most other sources are poorly
constrained.                                                       as commercial and industrial products, processes, and mate-
   In recent history, motor vehicles, power plants, and resi-      rials are important, widely distributed area sources of VOCs,
dential combustion have been the dominant drivers of detri-        IVOCs, and SVOCs with variable source profiles, making
mental air quality (e.g., VOCs, nitrogen oxides (NOx ),            their emissions and impacts difficult to observe and con-
PM2.5 , ozone, sulfur dioxide (SO2 )), with automobiles dom-       strain. Our demonstration builds on relevant indoor air qual-
inating anthropogenic VOC emissions in major cities (Gen-          ity studies observing emissions and substantial SOA forma-
tner et al., 2017; Hao et al., 2007; McDonald et al., 2013,        tion from ozone-initiated reactions with emissions from con-
2015; Warneke et al., 2012; Zhou et al., 2003). Yet due to         sumer products, building materials, and cleaning products
the success of combustion-related emissions control policies       (Chang et al., 2011; Destaillats et al., 2006; Gold et al., 1978;
over the past 60 years, motor vehicle VOC (and other pollu-        Lewis, 2001; Mitro et al., 2016; Nazaroff and Weschler,
tant) emission factors have decreased by orders of magnitude       2004; Singer et al., 2006; Weschler, 2011; Weschler and
en route to today’s diesel and gasoline vehicles, albeit with      Nazaroff, 2008; Wilke et al., 2004), as well as secondary
some recent on-road diesel NOx compliance issues (Hao et           emissions from oxidative degeneration of indoor paints, var-
al., 2007; Kirchstetter et al., 1999; US Environmental Protec-     nishes, and materials (Knudsen et al., 1999; Poppendieck et
tion Agency, 2011; Warneke et al., 2012). In no other place        al., 2007a, b; Salthammer and Fuhrmann, 2007).
has this been more studied than Los Angeles, CA where                 We outline a holistic framework to assist future research in
PM2.5 and ozone still exceed standards and OA comprises            the field and then use a multi-dataset approach to constrain
41 % of PM1 , 66 % of which is SOA (Hayes et al., 2013;            emissions, which includes the most detailed emissions inven-
Warneke et al., 2012). Recent work has suggested that motor        tory available, laboratory analysis of product composition, a
vehicle emissions in LA cannot fully explain observations of       survey of consumer product material safety datasheets (MS-
reactive precursors and SOA (Ensberg et al., 2014; Hayes et        DSs), and calculations of emissions timescales from theory.
al., 2015; McDonald et al., 2015; Zhao et al., 2014). In LA        Specifically, we (a) evaluate the pathways, chemical compo-
and beyond, the role of motor vehicles in degrading air qual-      sition, and magnitude of VOC, IVOC, and SVOC emissions
ity will decline further with the newest on-road emissions         from prominent types of products, processes, and materials;
standards (e.g., Tier 3/LEV-III, Euro 6/VI; Fig. 1), the use of    (b) calculate their potential to form SOA and ozone; and
electric-powered vehicles, and stricter regulations on emis-       (c) compare their emissions and potential air quality impacts
sions from off-road vehicles and other engines (Gentner et         to other prominent sources. We identify major knowledge
al., 2017; Giannouli et al., 2011; Gordon et al., 2013; Platt et   gaps in emission rates and composition, including IVOCs
al., 2014; Tessum et al., 2014; Weiss et al., 2011).               and SVOCs, which we explore via two examples: pesticides
   The main objective of this paper is to evaluate anthro-         and asphalt-related emissions.
pogenic sources of gas-phase organic compounds that are
gaining prominence as motor vehicles and other combustion-
related sources become cleaner in the developed and devel-
oping world. We demonstrate that consumer products as well

Atmos. Chem. Phys., 18, 5391–5413, 2018                                                      www.atmos-chem-phys.net/18/5391/2018/
P. Khare and D. R. Gentner: The increasing influence of non-combustion sources on urban air quality 5393
2 Defining a comprehensive framework for Sect. 4.1.3). Note: we exclude gasoline evaporation (from
non-combustion-related emissions vehicles or fuel stations) and fossil fuel extraction and pro-
cessing given their close connection to combustion. We
There is a wide body of work on some aspects of emissions briefly discuss food-derived cooking emissions for compari-
from products, processes, and materials in indoor or outdoor son, which are important and classified separately.
environments, but outdoor-focused emissions inventories are
mostly focused on evaporative emissions of VOC solvents at 2.3 Emission pathways
the time of application. Here we outline the current scope of
emissions and expand on it to define a comprehensive frame- We propose three general pathways of product- and process-
work to guide future studies on this class of emissions. related emissions:
1. evaporation of solvent from a product while it is in stor-
2.1 Volatility
age, being used, or during a process;
Emissions of gas-phase organic compounds can and should 2. volatilization of solute or active compounds from an
be differentiated by their volatility into VOCs, IVOCs, and applied coating, a solid product, or material (i.e., off-
SVOCs or further by their n-alkane-equivalent volatility gassing); and
(Murphy et al., 2014). One can broadly refer to compounds
emitted from products and processes as product- and process- 3. volatilization of by-products from the degradation or
related emissions. transformation of solute or active compounds or a solid
product or material.
2.2 Source categories
The first is the principal pathway previously considered and
While the spectrum of sources is very diverse, they are often often occurs over faster timescales (minutes–days) from liq-
grouped by use. The following source categories are consis- uids like cleaners, paints, and other solvents. The second acts
tent with the most detailed VOC inventories for consumer over longer timescales (weeks–years), is not always included
products, but are extended (shown with * below) to incor- in inventories, and is a key potential source of IVOCs and
porate a broader array of materials and products, including SVOCs (see Sect. 4.1.3). SVOC pesticides, flame retardants,
those used in commercial and industrial processes: and off-gassing plastics are examples studied for indoor air
quality (Batterman et al., 2009; Brodzik et al., 2014; Clausen
– paints (indoor and outdoor), et al., 2004; Faber et al., 2013; Kemmlein et al., 2003; Lewis,
– industrial adhesives, 2001; Wensing et al., 2005; Weschler and Nazaroff, 2008).
The third is due to the generation of degradation by-products
– consumer adhesives, via thermal or photochemical stress, exposure to oxidants
(i.e., OH, O3 , or NO3 ), or other reactive chemical processes.
– sealants,
These may have longer emission timescales depending on
– pesticides (consumer and agricultural), oxidant concentrations and the chemical and physical prop-
erties of degradation precursors. These emissions are largely
– general cleaning products, understudied with the exception of asphalt-related emissions
– targeted cleaners, and the ozonation of indoor materials (Poppendieck et al.,
2007a, b; Salthammer and Fuhrmann, 2007; Toftum et al.,
– personal products (e.g., beauty and hygiene), 2008).
– building materials (e.g., carpeting, flooring, insulation, 2.4 A life cycle approach
wood, gypsum),*
Emissions during application or immediate use are most
– furnishings (e.g., furniture),* commonly studied, but many emissions related to products,
– paving and roofing asphalt-related materials, and process, and materials occur over much longer timescales.
In the future, emissions studies need to include all three po-
– solid consumer products and packaging (e.g., plastics, tential emissions pathways across the full life cycles of the
elastomers) and their additives (e.g., plasticizers, flame following:
retardants).*
– storage,
However, the volatility range of most of the existing cate-
gories needs to be expanded to completely include IVOCs – transport,
and SVOCs. We discuss IVOC- and SVOC-containing pesti- – application,
cides and asphalt-related products and processes as exam-
ples that are not sufficiently included in inventories (see – curing,
www.atmos-chem-phys.net/18/5391/2018/ Atmos. Chem. Phys., 18, 5391–5413, 20185394 P. Khare and D. R. Gentner: The increasing influence of non-combustion sources on urban air quality
– active use, realistic assessment of products that are currently in signif-
icant public use and to avoid biasing the analysis towards
– weathering, less-common products. With a limited sample size, only one
water- and one ethanol-based product were included. Diluted
– restoration, and samples were prepared at a concentration of 1000 ng µL−1 in
either hexane or toluene depending upon the product com-
– removal and disposal. position provided in their MSDS. The chemical composi-
tion of the emittable fraction of products was determined us-
There are too many facets within the life cycles of each
ing gas chromatography with electron ionization mass spec-
source category to discuss in this paper, but our case study
trometry (GC-EI-MS; Agilent 7890B/5977). A 1 µL syringe
on asphalt-related emissions in Sect. 4.1.3 demonstrates sev-
(Hamilton) was used to directly inject the sample onto the
eral aspects. Production methods are not explicitly included
GC column through an inlet held at 320 ◦ C. During each in-
here since they may fall under the purview of industrial point
jection, the column was initially held at 40 ◦ C for 2 min, then
sources, but with small, distributed production it may be ap-
ramped at 10 ◦ C min−1 to 325 ◦ C, and lastly held at 325 ◦ C
propriate to consider the industrial and/or commercial pro-
for 5 min. Mass spectra of background subtracted individual
cesses as area-wide sources. Chemical transformations of
ion peaks were used to identify compounds in a sample us-
materials or products across their lifetimes need to be con-
ing the NIST mass spectra library. Calibration curves were
sidered since they can influence the chemical composition
drawn for five different concentrations of authentic standards
and rates of emissions. For example, transformations can oc-
(AccuStandard) for diesel range alkanes (C10 –C28 ), purge-
cur during a wide variety of in-use conditions or during the
able aromatics, and terpenes. The emittable organic fraction
storage of unused or partially used products and materials,
of raw products is defined by volatility and approximated
both of which can be over long storage periods in a variety
as VOCs + IVOCs via our chemical analysis and reported
of environmental conditions. Application methodology is a
MSDS data (note: SVOCs are excluded in this analysis to fo-
determining factor in both emission rates and composition
cus on compounds that are fully partitioned to the gas-phase
during application. For example, common methods include
at equilibrium under typical conditions). A carbon isotopic
direct liquid application or aerosolization, either via a pres-
analysis was also carried out at the Keck Carbon Cycle Ac-
surized can or a nozzle and air compressor, and aerosoliza-
celerator Mass Spectrometer (AMS) facility at UC Irvine to
tion provides a direct emission pathway for all components
measure carbon-14 (‰114 C) and carbon-13 (‰d13 C) rel-
and the subsequent evaporation of aerosol droplets. Finally,
ative to carbon-12 via a 0.5 MV Compact AMS (National
emissions in latter parts of life cycles (i.e., weathering, de-
Electrostatics Corp.) and estimate the fossil carbon content
terioration, restoration, removal, and disposal) all need to be
in individual products.
considered.
3.2 Urban emissions inventories
3 Methods
We used the California Air Resources Board (CARB) Al-
We constrain the magnitude, chemical composition, and manac emissions inventory and the US EPA SPECIATE 4.4
potential air quality impacts of emissions using multiple source profiles to generate the total and compound-specific
bottom-up approaches: chemical characterization of a se- emissions for California and Los Angeles (Cox et al., 2013;
lection of consumer products via gas chromatography–mass US Environmental Protection Agency, 2014). The CARB
spectrometry and carbon isotope mass spectrometry; a de- emissions inventory is the most detailed available with re-
tailed assessment of emissions inventories and estimation of spect to source categories and basin-level rates. Los Ange-
source contributions to potential SOA and ozone formation; les is our case study megacity given its historical role in air
theoretical calculations of emission timescales; and a sur- quality research and policy with a multi-decadal record of
vey of reported chemical composition in consumer product emissions data, ambient measurements, field campaigns, and
MSDSs. Details on the emission timescale calculations can publications (Bishop and Stedman, 2008; Fortin et al., 2005;
be found in Appendix B, and other additional methods de- Neligan, 1962; Warneke et al., 2012). In addition, the US Na-
tails pertaining to potential SOA and ozone estimation can tional Emissions Inventory and emission inventories from the
be found in the Supplement. Global Emissions Initiative (GEIA) were used for nationwide
and worldwide comparison of VOC emissions, respectively,
3.1 Chemical speciation of consumer products from solvents and on-road motor vehicles.
We estimated total daily potential ozone and SOA forma-
We selected 17 consumer products across a range of prod- tion in greater Los Angeles from the product- and process-
uct types with attention to those with unresolved alkane or related emissions included in the CARB inventory. Values
aromatic mixtures (Table 1). Top-selling products from ma- were also calculated for exhaust and evaporative emissions
jor commercial providers were selected in order to make a from on-road motor vehicles using CARB’s Emission Fac-
Atmos. Chem. Phys., 18, 5391–5413, 2018 www.atmos-chem-phys.net/18/5391/2018/P. Khare and D. R. Gentner: The increasing influence of non-combustion sources on urban air quality 5395
Table 1. Composition and emittable fraction of 12 commercially available consumer products and the results of their carbon isotope analysis.
Please see Table S1 for detailed mass distribution profiles and Table S7 for detailed carbon isotopic analysis resultsk .
Product name Percent fossil IVOC Aromatic Emittable d13 C 114 C
origin content content fraction (‰) (‰)
Naphtha cleaner > 99 % – – 100 % −29.0 ± 0.1 −999.4 ± 0.5
Nonpolar solvent > 99 % – 93 % 100 % −27.4 ± 0.1 −998.5 ± 0.5
Fogging insecticidem > 99 % 95 % – 95 % −26.7 ± 0.1 −999.1 ± 0.5
Semigloss furniture coating 56 % – 6% 30 % −29.9 ± 0.1 −565.4 ± 0.7
Multipurpose solventa > 99 % – – 100 % −30.6 ± 0.1 −997.8 ± 0.7
Furniture coatingm 65 % – 1% 40 % −30.2 ± 0.1 −650.0 ± 0.6
Roof paintb > 98 % – – – −22.7 ± 0.1 −985.0 ± 0.5
Sealantc, l 97 % 0.77 % 21 % 25 % −27.4 ± 0.1 −969.9 ± 0.5
Paint thinnerm > 99 % 2% 3% 100 % −29.1 ± 0.1 −999.7 ± 0.5
Asphalt coatingd, l > 99 % 4% 3% 25 % −27.6 ± 0.1 −994.8 ± 0.6
Detergente 81 % 3.5 % 4% 25 % −27.9 ± 0.1 −807.8 ± 0.6
General purpose cleanerf, m 81 % 1% – 3% −27.7 ± 0.1 −811.1 ± 1.3
Multipurpose lubricant – 39 % – 97 % – –
Aerosol coating productg, m – – 12 % 17 % – –
Flashing cementh, l – 0.2 % 3.5 % 27 % – –
Crawling insecticide 1i, m – 20 % – 20 % – –
Crawling Insecticide 2j, m – 8% – 8% – –
a Largely consists of acetone (80 %) with the rest as cyclotetrasiloxanes and aryl halides.
b Water-based product. Other components include titanium dioxide, silica, and aluminum hydroxide.
c Largely consists of petroleum asphalt, clays, and cellulose.
d Largely consists of petroleum asphalt.
e 46 % of the emittable fraction (EF) consists of mostly esters, 70 % of which have fewer than 12 carbon atoms. Terpenes including limonene,
eucalyptol, and α -terpineol form 37 % of the EF.
f Water-based product, with water excluded from emittable fraction. Also has terpenes including camphene, d3-carene, α -pinene, linalool, and
δ -limonene. 60 % of terpene fraction is δ -limonene.
g Contains 35 % acetone and 25 % hydrocarbon propellants not included in the EF. *25 % of EF is 75 % acetate + 25 % ketones.
h Largely consists of petroleum asphalt, kaolin, cellulose, and aluminum magnesium silicate.
i Contains 15 % hydrocarbon propellants not included in the EF.
j Contains 25 % hydrocarbon propellants not include in the EF.
k Crude oil and plant-derived ethanol were used for multiple reference blanks (Table S8).
l Asphalt-related products.
m Applied as aerosols.
Note: all fractions given in the footnotes refer to the emittable fraction of a product. Emittable fraction is confirmed with MSDS where possible.
tors (EMFAC) model database and literature ozone and SOA lower estimate of potential SOA without aqueous SOA de-
yields for each source pathway and low-emission vehicle spite studies showing that aqueous pathways to SOA increase
(LEV) generation (Gentner et al., 2013, 2017; Zhao et al., SOA yields for small oxidized precursors or their oxidation
2017). Potential ozone formation values are based on maxi- by-products (Daumit et al., 2016; Jia and Xu, 2014). For
mum ozone incremental reactivity (MOIR) values from the the case study city Los Angeles (and Mexico City), aque-
SAPRC-07 inventory (Carter, 2007; Gentner et al., 2013). ous SOA formation was relatively small during major field
The very diverse range of compound classes used in prod- studies (Dzepina et al., 2009; Hayes et al., 2015; Washen-
ucts, materials, and processes remain largely understudied felder et al., 2011). However, future work in other cities
with respect to their SOA yields (e.g., esters, siloxanes). should consider aqueous SOA given the magnitude of the
Hence, specific literature SOA yields were used wherever oxygenated fraction in product- and process-related emis-
possible (Algrim and Ziemann, 2016; Chacon-Madrid et sions (see Sect. 4.1.2).
al., 2010; Chan et al., 2010; Gentner et al., 2012; Kwok
and Atkinson, 1995; Ng et al., 2006; Pankow and Asher, 3.3 Survey of material safety datasheets (MSDS)
2008; Sadezky et al., 2006; Tsimpidi et al., 2010) and es-
timated for other unstudied compounds without existing
We obtained the MSDS data by surveying a set of 88 MSDS
SOA yields (see Table S6 for details). SOA yields are es-
entries from the websites of major home improvement stores
timated at 10 µg OA m−3 in urban, “high-NOx ” conditions
focusing on their top-selling products. Five product cat-
(approx. > 5 ppb). Ozone and SOA yields for each analyzed
egories were chosen including paints, adhesives, cleaning
consumer product and product category are compared to
products, sealants, and pesticides. Chemical composition in-
other key sources. The SOA yields provide a conservative,
formation was extracted from the “composition and infor-
www.atmos-chem-phys.net/18/5391/2018/ Atmos. Chem. Phys., 18, 5391–5413, 20185396 P. Khare and D. R. Gentner: The increasing influence of non-combustion sources on urban air quality
mation on ingredients” section reported in the datasheets.
MSDS entries for commercial products frequently report 30
to 60 % of product composition as “proprietary mixtures”, so
this survey only identifies the presence and establishes gen-
eral ranges for current product types (Table 2).
4 Results and discussion
4.1 Composition and magnitude of product- and
process-related emissions
The organic compositions of consumer products and com-
mercial and industrial products, materials, and processes are
very diverse, which leads to similar diversity in emissions,
and further regional and national heterogeneity can be ex-
pected. We calculate the magnitude and average chemical
composition of emissions from source categories included
in the CARB emissions inventory and SPECIATE database
(Fig. 2a) with the goal of assessing the distribution of emis-
sions across organic compound classes and product types
(i.e., source profiles) in a megacity with the most representa-
tive inventory available. We find that the consumer products
and the commercial and industrial processes that comprise
product- and process-related sources in the inventory are al-
together large emitters of a diverse suite of VOCs, but view
these results as a lower estimate given likely missing emis-
sions, such as those discussed in Sects. 2 and 4.1.3.
4.1.1 Chemical composition
Laboratory analysis of consumer products
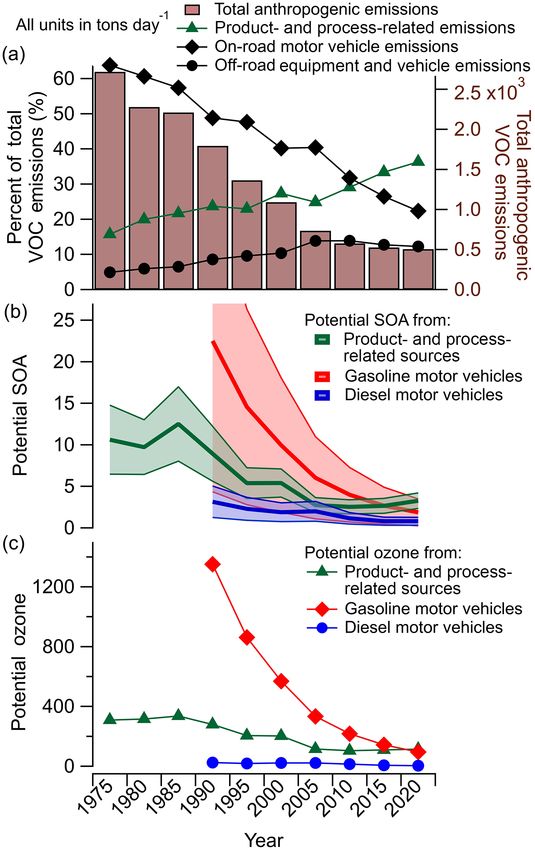
Our results summarized in Table 1 demonstrate the preva- Figure 2. Emissions and potential air quality impacts of product-
lence of non-benzene, single-ring aromatics and C6 –C12 and process-related sources and motor vehicles over time in the
alkane mixtures as solvents and the presence of IVOCs South Coast Air Basin (i.e., Los Angeles). (a) Total anthro-
and SVOCs in consumer products. The emittable fraction pogenic VOC emissions (excluding ethane). (b) Potential SOA from
of products ranged from 3–100 %, and the single-ring aro- product- and process-related emissions compared to on-road motor
vehicles, with uncertainties based on the ranges of compound-class-
matic and IVOC content ranged from 3.5–93 and 0.77–95 %,
specific SOA yields. (c) Ozone formation potential via compound-
respectively. Another key result of this analysis is the fre- specific maximum ozone incremental reactivity values (SAPRC,
quency of many functionalized aliphatic or aromatic VOCs no uncertainty given). All units are in t day−1 for panels (a–c).
and IVOCs that are not traditionally measured in atmospheric Product- and process-related results are produced using CARB
monitoring (e.g., esters, acetates, siloxanes), which is echoed emissions data and EPA source profiles; see Methods for further
in the MSDS survey results. More detailed speciation results detail. Note: none of the panels include VOCs, IVOCs, or SVOCs
with a breakdown of alkanes and single-ring aromatic com- from products and processes that we identify in Sects. 2 and 4
pounds can be found in Table S1 in the Supplement. Vali- as missing from emissions inventories, but SOA and ozone for-
dation of real-world product- and process-related emission mation from motor vehicle emissions does include IVOCs and
rates and timescales is necessary to advance the field but will SVOCs. Maximum potential SOA from gasoline vehicles in 1990
require examining a wide range of products and geographic was ∼ 41 t day−1 (off graph). Pre-1990 potential SOA and ozone
for motor vehicles is excluded due to the lack of fleet-resolved data.
conditions.
Analysis of emissions inventories
ing SPECIATE source profiles with the CARB emissions in-
Figure 3a shows the estimated overall composition of ventory for the South Coast Air Basin (SoCAB). Alcohols
product- and process-related emissions in Los Angeles av- and miscellaneous emissions together make up 50 % of the
eraged over the years 2005 to 2020 determined by combin- total product- and process-related emissions with ethanol as
Atmos. Chem. Phys., 18, 5391–5413, 2018 www.atmos-chem-phys.net/18/5391/2018/P. Khare and D. R. Gentner: The increasing influence of non-combustion sources on urban air quality 5397
Table 2. Analysis of material safety datasheets commercially available with products.
Product category Fraction of products MSDS aromatics % wt. Fraction of products with MSDS IVOCs and SVOCs
with aromatic content mean (range) IVOC and SVOC content % wt. mean (range)
Paintse 0% 0 24 %a 2.5 (1–5)
Adhesives 27 % 8 (1–30) 7 %b 20 (10–30)
Cleaning products 8% 5 (1–10) 23 %c 3.5 (1–7)
Sealants 53 % 9 (1–30) 7 %d 4 (1–10)
Pesticidesf NS NS NS NS
a Consists of benzoates. Log K
OA = 7.75, which puts them in the IVOC range.
b Does not include potential emissions from petroleum asphalt, which on average constitutes 36 % in 13 % of the surveyed products. 50 % of products contain 38 %
limestone on average.
c Includes C –C ethoxylated alcohols.
9 14
d Does not include potential emissions from petroleum asphalt, which on average constitutes 40 % in 33 % of the surveyed products. 60 % of products contain 36 %
limestone on average.
e 20 % of MSDSs include “nonhazardous” or “proprietary” component in composition ranging from 60–100 %.
f MSDSs do not present sufficient information on the composition of pesticides (NS: not sufficient).
one of the largest individual species emitted, which is con- not clear due to uncertainties in these changes to unspeciated
sistent with SoCAB ethanol observations that were substan- assignments and the uncertainties in SOA yields.
tially greater than what would be expected with gasoline ve-
hicles as the only source (de Gouw et al., 2012). 70 % of MSDS survey
the miscellaneous emissions are made up of mineral spir-
its whose composition varies greatly with application but As summarized in Table 2, the greatest single-ring aromatic
are generally comprised of acyclic and cyclic C7−12 alkanes content was observed in adhesives (8 %) and sealants (9 %),
with variable amounts of aromatic content. The remaining while the 30 surveyed paints did not have aromatic VOC con-
30 % includes unresolved asphalt mixtures, oxygenates, fra- tent in contrast to the SPECIATE source profiles (Figs. 3b
grances, and undefined petroleum distillates, oils, and spirits, and S4). In comparison, the chemical speciation of 42 major
some of which also fall into the IVOC and SVOC categories products categorized as “solvents” (across C6−13 ) in 2002 re-
discussed below. Single-ring aromatics are estimated at 13 % ports a wide range of total aromatic content (0–100 %) and
of total emissions with a mix of 43 % toluene, 38 % C8 , 3 % an average of 41 % (±46 %) with the remainder comprised
C9 , and 1.5 % C10 aromatics, with minor PAH emissions. of acyclic and cyclic alkanes (Censullo et al., 2002). Dif-
Carbonyls represent 10 % of total emissions, 36 % of which ferences when compared to our present-day laboratory and
is acetone. Anthropogenic terpenoid emissions in the inven- MSDS paint speciation show reductions in aromatic content
tory, while highly reactive, are small relative to other sources due to increasingly stringent regulations in the US. However,
and biogenic contributions (see Sect. S4 in the Supplement). for other locations, it highlights the likely continued preva-
Figure 3b shows the distribution of organics in the SoCAB lence of single-ring aromatics in solvents, especially for de-
emissions inventory from major product- and process-related veloping regions. We also found that MSDSs did not report
source categories. Paints emerged as the highest VOC emit- IVOC and SVOC content in the composition of pesticides.
ter, ∼ 21 % of which is single-ring aromatics (Figs. 3b and S4 However, we observed 8–95 % IVOC content in the emit-
in the Supplement). Targeted cleaners, pesticides, and gen- table fraction of the pesticide samples analyzed in our labo-
eral cleaners were the next largest source types in the in- ratory. For all of the product categories examined, especially
ventory. A more detailed breakdown of emissions broken up for pesticides, the amount of compositional information pro-
by source category and compound class can be found in Ta- vided by the MSDSs is limited and hinders our ability to
ble S3. We used the EPA SPECIATE database for source pro- constrain the average aromatic or IVOC and SVOC content
files in this study, which had a national scope, some inclusion since compounds outside the VOC range are often not dis-
of IVOCs and SVOCs, and greater chemical detail (i.e., num- closed due to proprietary claims or regulatory exemptions,
ber of species). We examined changes in the chemical spe- and where provided all compound concentrations are usually
ciation of total emissions with CARB’s 2010 adjustment to provided as a wide range. For example, under “fragrance ex-
SPECIATE in the final years of our study period. We found emptions” VOCs and IVOCs are often not disclosed and can
minor differences in the overall emissions (Fig. S5) that are even be labeled as “VOC free”.
largely attributable to changes in the assignment of unspeci-
ated (i.e., miscellaneous) VOC, IVOC, and SVOC emissions 4.1.2 Emission rates
that do not affect our conclusions. Differences in potential
SOA and ozone in the SoCAB for 2010–2020 (Sect. 4.2) are While motor vehicles are still major sources in developed
regions, their total gas-phase organic compound emissions
www.atmos-chem-phys.net/18/5391/2018/ Atmos. Chem. Phys., 18, 5391–5413, 20185398 P. Khare and D. R. Gentner: The increasing influence of non-combustion sources on urban air quality
(a) shows California’s statewide bi-decadal emissions estimates
from CARB in which product- and process-related VOCs
(averaged over 2005–2020)
Total product- and process-related
25 emissions averaged over will reach 450 t day−1 in 2020, exceeding motor vehicles by
% of total emissions
2005–2020 in the SoCAB
20 region: 174 tons day
-1 116 t day−1 . A similar picture may emerge in developing na-
15 tions as the control of motor vehicle emissions is greatly
10 accelerated by the advancements and knowledge of devel-
5 oped nations such that emission standards in major emerging
0 economies employ either US or EU policies and are gener-
ally only one generation behind (Kodjak, 2015). International
s
at ic
s IV nes
C P ics
Te ilox nyls
S bo s
en es
-ri a ke s
ar cy es
on s ll s s
d ro nd e rs
Ac ds
Al the s
co rs
O atic mi s
C
ar AH
le om Al ane
N bon sce E hol
E id
om cl
SV m a ou
an a a an te
rp an
ng tic n
oi
O
studies over the past 2 decades show highly varying contribu-
k
Al
tions (∼ 5–45 %) to the total anthropogenic VOC emissions
C
i
ng ar
from just “solvent” use at both regional and national scales
ar M
Si on
N
(summarized in the Supplement; van den Born et al., 1991;
oc
al
Caserini et al., 2004; Chen et al., 2009; Deguillaume et al.,
H
(b) Compound type 2008; Lu et al., 2007; Markakis et al., 2009; Menut, 2003;
Alkanes Ethers Nielsen et al., 2008; Piccot et al., 1992; Song et al., 2007; US
Total emissions (tons day )
-1
Alkenes Alcohols
50 Cycloalkanes Esters Environmental Protection Agency and Office of Air Quality
Single-ring aromatics Miscellaneous compounds
PAHs
Planning and Standards, 1991).
40 (includes mineral spirits)
Carbonyls Halocarbons and amines Emissions inventory data for Los Angeles demonstrate
Siloxanes Nonaromatic IVOCs
30 Terpenoids and SVOCs that anthropogenic emissions have consistently decreased
Acids
20 over the last 4 decades (Fig. 2a), which is consistent with
10
ambient observations (1960–2010; Warneke et al., 2012). As
the contribution of on-road motor vehicles to total anthro-
0 pogenic emissions has declined, product- and process-related
es
s
rs
rs
es
ts
ts
ve
an
in
ne
ne
sources have become a major contributor of VOCs. Based
iv
id
si
Pa
es
ic
al
ea
ea
he
st
Se
dh
on the CARB emissions inventory, contributions of product-
cl
cl
Pe
ad
la
al
ed
er
er
ria
and process-related sources are the largest single contribu-
et
m
en
rg
st
su
G
du
Ta
tor of VOC emissions in the basin and state (Figs. 2a and
on
In
C
Selected source type S1) and are growing with population (i.e., increased in-basin
usage). While consumption volume is low compared to com-
bustion fuels, emission factors are higher given that most of
Figure 3. Average emissions from product- and process-related
the volatile components are emitted, whereas fuels are burnt
sources for 2005–2020 based on data from CARB inventory and
at ≥ 99 % efficiency. Yet, no region can be fully represen-
SPECIATE database as a function of (a) compound class (shown
with standard deviations) and (b) major product- and process- tative of product- and process-related emissions on a larger
related source categories in the inventory (values in Table S3). “Mis- scale, and regional and/or national specifics will influence the
cellaneous” contains 70 % mineral spirits (C7−12 hydrocarbons). magnitude and composition of emissions. For example, Cali-
IVOCs and SVOCs do not include an estimate of the missing emis- fornia’s extensive regulations will modify the composition of
sions identified in Sects. 2 and 4. products sold in CA and likely elsewhere in the US.
4.1.3 Emissions of intermediate- and semi-volatile
have been gradually declining with the continued implemen- organic compounds (IVOCs and SVOCs)
tation of stricter emissions standards (Gentner et al., 2017),
increasing the relative importance of other sources (Figs. 1, Despite representing only a small to moderate amount of
2a). At a global scale, the MACCity and ACCMIP emissions emissions, IVOCs and SVOCs from motor vehicles are key
inventories estimate global solvent-related VOC emissions of precursors to urban SOA (Gentner et al., 2012; Robinson
15 Tg yr−1 in 2000 and year-over-year increases since 1960 et al., 2007). Similarly, we conclude that consumer prod-
(speciated by aromatics, C6+ alkanes, ketones, alcohols, and ucts and commercial or industrial products, processes, and
other VOCs), and emissions of aromatics from solvents are materials are also large sources of unspeciated IVOCs and
expected to outweigh those from transportation in 2020 (7.5 SVOCs, some of which are included in the CARB inventory,
vs. 6.7 Tg yr−1 ; GEIA, 2017). The 2014 US National Emis- while there is evidence that some other source pathways are
sions Inventory (NEI) data report that VOC emissions from not.
solvent-related sources are just 25 % less (300 t day−1 ) than Many common products and materials (e.g., pesticides,
those from on-road mobile sources nationally, while they fragrances, foams, plastics) have IVOCs or SVOCs that parti-
exceed on-road emissions by 25 % (21 t day−1 ) in Califor- tion to reach equilibrium and evaporate over long timescales
nia (US Environmental Protection Agency, 2011). Figure S1 (Fig. 4; Batterman et al., 2009; Clausen et al., 2004; Mitro
Atmos. Chem. Phys., 18, 5391–5413, 2018 www.atmos-chem-phys.net/18/5391/2018/P. Khare and D. R. Gentner: The increasing influence of non-combustion sources on urban air quality 5399
6 While CARB’s consumer products inventory includes
7 Ranges show variance with layer
10
10 thickness and vertical transport 4
100 years IVOCs and SVOCs due to manufacturer reporting require-
Emission timescale (h)
5 10 10 years ments, IVOCs and SVOCs are exempt from limits on VOC
10 s
c s OC ) 2 1 year content except for multipurpose solvents and paint thin-
3 ati SV tilt
y
10
10 om ola
Oxygenates
ar ners, and there are known limitations in their coverage, es-
(days)
tv
ng n 0
1 -ri ale 10 pecially of oxygenated species (California Air Resources
le uiv
s
10 ng OC q
Si IV fe -2
-1 b
ne
o
10 Board, 2000, 2015b). We conclude that there are other an-
10 a
a c alk thropogenic sources of IVOCs and SVOCs that have not been
-3 or -4
10 e s( 10 considered due to their long emission timescales (i.e., days–
an
-5 alk -6
10 n- 10 years; Fig. 4, Table S9; de Gouw et al., 2011; Weschler and
5 10 15 20 25 Nazaroff, 2008). We present evidence for two such examples
Carbon number in this paper: IVOC- and SVOC-containing pesticides and
asphalt-related products, materials, and processes, but other
Figure 4. Emission timescales for single-ring aromatics, alkanes, examples include the volatilization of IVOC and SVOC sol-
and prominent solvents: ethanol (a), ethylene glycol (b), and ace- vents, solutes, or solids (e.g., coatings, flame retardants) and
tone (c). Based on applied layers of 0.01–1 mm and vertical trans- materials that may degrade to form compounds with volatil-
port coefficients for neutral and stable outdoor conditions (10– ities of C13−26 n-alkanes (e.g., construction materials and
50 m h−1 ), with longer timescales in indoor environments or thicker coatings, including materials with petroleum distillates or
layers (e.g., asphalt, building materials). The left axis is reproduced residues, mineral oil, coal tar, or similar).
on the right in days. Timescales are limited by gas-phase transport
from the surface, but absorption into polymeric or porous substrates
could extend timescales (Weschler and Nazaroff, 2008). Volatility Example 1: Emissions of IVOCs and SVOCs from
range boundaries for VOC–IVOC and IVOC–SVOC occur between pesticides
C12 –C13 and C19 –C20 , respectively, for n-alkanes or compounds
with equivalent volatilities. See Appendix B for calculations and
Table S9. We have several pieces of evidence demonstrating that pes-
ticides (including herbicides, insecticides, and fungicides)
contain IVOCs and SVOCs, but they also highlight the fact
et al., 2016; Weschler and Nazaroff, 2010). Our chemical that they are poorly documented and regulated. We analyzed
analysis revealed IVOCs or SVOCs in 10 of the 17 products the chemical composition of three pesticides available as
(Tables 1 and S1). Including the MSDS survey, we found consumer products and they were comprised of 8, 20, and
total IVOC + SVOC compositions ranging from 0 to 95 %, 95 % IVOCs in the C14−17 range (Table 1, Fig. S3), with trace
with IVOCs or SVOCs present in 23 % of cleaners, 20 % of levels of larger compounds. Our MSDS survey (Table 2) was
adhesives, 24 % of paints, and 46 % of sealants (Table 2). inconclusive for pesticides since the majority of consumer
Aliphatic or aromatic IVOCs and SVOCs are frequently used pesticides are not disclosed in MSDSs due to claims of pro-
in some types of pesticides and are sometimes replaced with prietary mixtures, nonregulated components outside of the
biogenic oils (e.g., neem oil, fish oil) such that the bulk of VOC range, and/or because they use naturally derived oils
the pesticides in our MSDS survey were comprised of < 1– (e.g., neem oil). Studies have shown that such naturally de-
10 % active compounds and a balance of undisclosed, “non- rived oils are comprised of aliphatic and aromatic IVOC- and
hazardous” ingredients. SVOC-range compounds (Isman, 2000; Kumar and Parmar,
The SPECIATE profiles and CARB emissions inventory 1996). Our emissions inventory analysis shows that nonaro-
include some estimates of unspeciated “low-vapor-pressure matic IVOCs and SVOCs are the largest inventoried source
VOCs (LVP VOCs)” in consumer products that are defined as of IVOCs and SVOCs (Fig. 3), but the lack of data in MS-
larger than 12 carbon atoms (or equivalent volatility), which DSs and VOC exemptions from regulations suggests that this
is roughly consistent with the beginning of the IVOC range is a lower estimate of actual emissions. To examine com-
(California Air Resources Board, 2015b). While poorly con- mercial and industrial products, we also analyzed the com-
strained, nonaromatic IVOCs and SVOCs included in the in- position of three petroleum-based pesticides used in agricul-
ventory constitute ∼ 3 % (6 t day−1 ) of total SoCAB emis- ture (Fig. S2), which are comprised of C16 –C26 cyclic and
sions estimates in the CARB/SPECIATE case study, 90 % acyclic alkanes mostly in the SVOC range that are applied
of which are classified as unspeciated “LVP VOCs”. Con- as thin films via a sprayed water emulsion. These can par-
sumer product pesticides, general purpose cleaners, and tar- tition to the gas phase over a range of emissions timescales
geted cleaners (e.g., laundry) are the largest sources of IVOC (Fig. 4) and may impact urban (or downwind) areas in agri-
and SVOC contributions emitting 3.6, 1.0, and 0.4 t day−1 of cultural regions, with 18–29 Gg applied year−1 in Califor-
IVOCs and SVOCs, respectively. Consumer product pesti- nia. California-wide emissions from applied agricultural pes-
cide emissions had the highest fraction of IVOCs and SVOCs ticides were nearly one-fifth of those from consumer prod-
(29 %). ucts in 2015. However, the high IVOC and SVOC fraction in
www.atmos-chem-phys.net/18/5391/2018/ Atmos. Chem. Phys., 18, 5391–5413, 20185400 P. Khare and D. R. Gentner: The increasing influence of non-combustion sources on urban air quality
their composition and potential to emit over long timescales US, and EU inventories (California Air Resources Board
makes them an important consideration for air quality. and Sonoma Technology Inc., 2003; European Environment
Agency, 2017; San Joaquin Valley Air Pollution Control Dis-
Example 2: Emissions of IVOCs and SVOCs from trict, 2008; US Environmental Protection Agency, 2014; US
asphalt-related products, materials, and processes EPA, 1995). Road paving solvents are prohibited in non-
attainment areas in California (Table S4), so emissions in the
We propose asphalt-related products, materials, and pro- SoCAB case study are minor (1 t day−1 ) and mostly smaller
cesses as important sources of IVOCs and SVOCs whose than C10 in the SPECIATE source profiles (Table S5; Cox et
emissions are currently underestimated in inventories and re- al., 2013).
quire better quantification. Asphalt-containing materials are Emission factors of degradation by-products do not ex-
used in road paving and repair (and similar applications ist, so we approximate lower limits on emission factors only
for roofing or other surfaces), are comprised of petroleum- for the period immediately during application using limited
derived organic compounds that are predominantly non- published data (see Sect. S3 in the Supplement), but longer
distillable (i.e., nonvolatile) asphalts, and sometimes contain timescale experiments are necessary. Calculated lower lim-
smaller amounts of VOCs, IVOCs, and/or SVOCs. They are its range from 100–2000 mg kg−1 of asphalt (not including
used as sealers, coatings, and binders, mixed with aggregates aggregate) with a strong dependence on storage and applica-
to pave roads, and applied using either high application tem- tion temperature. This is on the same order as motor vehicle
peratures, water emulsions, and/or solvent. emission factors and is greater than CARB’s current emis-
The three paving- and roofing-related products we ana- sion factor for hot-mix asphalt (Hernandez, 2016; Gentner et
lyzed contained aliphatic and aromatic VOCs and IVOCs al., 2017; San Joaquin Valley Air Pollution Control District,
up to C18 present as solvents, with minor SVOC content 2008). Yet, California’s asphalt consumption of 1 540 000 t
(Fig. S3). Similarly, there were no IVOCs or SVOCs declared liquid asphalt year−1 (Table S4) represents statewide IVOC
in the asphalt-containing products in our MSDS survey. Non- and SVOC (+ VOC) emissions of 0.5–8 t day−1 during ap-
solvent emissions during the hot storage, application, or plication alone (The Asphalt Institute, 2015). This does not
resurfacing of these asphalts are caused by the degradation overwhelm current solvent VOC emissions from paving and
(i.e., fragmentation) of larger organic compounds from as- roofing (33 t day−1 ) but emphasizes the need for further re-
phalts to form smaller compounds (C7 –C30 ), which include search since the poorly constrained emissions largely include
cyclic and acyclic alkanes, single-ring aromatics, PAHs (2- IVOCs and SVOCs emitted over long timescales and are
ring, 3-ring, and 4-ring), and sulfur- or nitrogen-containing known to have high SOA yields.
species (i.e., benzo- and dibenzo- thiophenes and furans), Asphalt-related emissions exemplify the stated need
all of which were not present in the asphalt prior to heat- for life-cycle-focused approaches, with potential emissions
ing (Cavallari et al., 2012b; Gasthauer et al., 2008; Kitto et across storage, transport, application, curing, weathering
al., 1997; Kriech et al., 2002; Lange et al., 2005; Lange and (e.g., degradation due to climate or UV radiation), and resur-
Stroup-Gardiner, 2007; The Asphalt Institute and European facing. Their magnitude and composition will vary with pro-
Bitumen Association, 2015). The total mass and composition duction and handling methods, geologic source, and appli-
of emissions is dependent on production methods, asphalt cation type and location (especially climate). Emission path-
grade, and increases in magnitude and maximum molecular ways (from Sect. 2) include (1) the volatilization of appli-
weight with storage and application temperatures (i.e., more cation solvents and (3) the production and release of degra-
SVOCs at high temperatures), which ranged 100–240 ◦ C or dation by-products, while pathway (2) does not apply due
higher for roofing asphalts (Cavallari et al., 2012c; Gasthauer to negligible off-gassing from extremely low-volatility un-
et al., 2008; Kitto et al., 1997; Kriech et al., 2002; Lange et degraded asphalt constituents. The emission of asphalt degra-
al., 2005; Lange and Stroup-Gardiner, 2007; The Asphalt In- dation products may peak during construction-related activi-
stitute & European Bitumen Association, 2015). ties primarily due to asphalt’s exposure to high temperatures
Emissions of aromatic and aliphatic VOCs, IVOCs, and during its storage, application, or resurfacing. Still, seasonal
SVOCs from heated asphalt mixtures (“hot mix”) during ap- highs in surface temperature (summer pavement maximums
plication have also been documented in occupational health are 47–67 ◦ C and up to 70 ◦ C for roofs; Parker et al., 1997;
studies on “asphalt fumes” (Cavallari et al., 2012a, b; Kriech Pomerantz et al., 2000) will likely affect the rate of internal
et al., 2002; Lange et al., 2005; Lange and Stroup-Gardiner, transport and diffusion out of the “cured” asphalt layer, re-
2007). Yet, current emissions inventories do not include sulting in emissions extended over its lifetime (note: paving
emissions of VOCs, IVOCs, and SVOCs from the degra- solvents are currently assumed to be emitted over several
dation of larger compounds during and after the applica- months; California Air Resources Board and Sonoma Tech-
tion of asphalt mixes. Estimation methods focus solely on nology Inc., 2003).
the evaporation of VOC solvents from “cutback asphalt”,
which is a mixture of asphalt and solvent included as an area
source in the “solvent evaporation” category in Californian,
Atmos. Chem. Phys., 18, 5391–5413, 2018 www.atmos-chem-phys.net/18/5391/2018/P. Khare and D. R. Gentner: The increasing influence of non-combustion sources on urban air quality 5401
Gasoline vehicle exhaust (a) (b) ics and PAHs constitute only 11 % of the total product- and
process-related emissions, they are responsible for ∼ 80 %
Diesel vehicle exhaust
of the potential SOA from those sources in the region (4 %
Evaporative gasoline PAHs and 76 % single-ring aromatics, largely toluene and
xylenes). Existing emission inventories badly underestimate
Commerical cooking
emissions of IVOCs and SVOCs and their contributions
Commercial products to SOA. They are shown to be responsible for 0.18 % of
100 200 300 10
2 2 4 6 3
10
2 4 6 4
10
2 product- and process-related SOA, but this excludes 87 %
SOA yield (mg OA g )
-1
Ozone formation potential (mg O3 g-1 ) of the total IVOC and SVOC emissions that are labeled as
unspeciated “LVP VOCs” in the inventory and thus have no
Figure 5. Comparison of (a) SOA yields and (b) ozone forma- assigned SOA yield in calculations. Additionally, our calcu-
tion potential of five major sources. Blue markers represent aver-
lations do not include “missing” emissions or their potential
age yields of the product- and process-related source categories in
SOA. Anthropogenic terpenoids, including lemon oil, pine
Fig. 3 and do not include “missing” emissions. The red markers
show yields of sampled consumer products calculated from specia- oil, orange oil, orange terpenes, D-limonene and α-pinene,
tion obtained after GC-MS analysis. All are shown as a function of are responsible for ∼ 8 % of the total product- and process-
mass emitted, not product composition. related SOA.
It is important for future work to consider modifying fac-
tors for SOA (and ozone) formation chemistry. Relative VOC
4.2 Potential SOA and ozone formation of product- to NOx ratios have been shown to affect the chemistry and
and process-related emissions compared to other production rates of SOA and ozone (Hallquist et al., 2009;
major sources Sillman, 1999; Zhao et al., 2017). For many cities outside
Los Angeles, urban air quality develops against a backdrop
Products and processes emit a diverse array of organic com- of biogenic emissions of VOCs and IVOCs, which is crit-
pounds (Fig. 3). Some are of relatively low direct concern for ical to keep in mind as we pursue stricter emission targets
human health (e.g., terpenoids), while others present issues for reactive organics. In some cases, such as in the South-
as primary emissions, especially in indoor or concentrated east US, biogenic emissions dominate over anthropogenic
workplace environments (e.g., aromatics, ethers, PAHs). Yet, gas-phase organics, and emissions of SO2 and NOx are large
most are reactive and will oxidize in outdoor or indoor envi- drivers of biogenic SOA formation (Xu et al., 2015). Sim-
ronments to form oxidized VOCs with unknown but large po- ilarly, gas-phase cooking emissions from food represent an
tential health effects (Pöschl and Shiraiwa, 2015). This sec- additional uncertain source in urban air quality along with
tion focuses on their impacts on air quality via SOA or ozone cooking POA, which has been more studied (Bruns et al.,
formation. However, the health or environmental effects of 2017; Hayes et al., 2013; Klein et al., 2016).
the primary emissions should be especially considered in de-
veloping regions where primary VOC emissions are larger or 4.2.2 Ozone formation potential
for specific compound classes near sensitive natural environ-
Over the past several decades, potential ozone has been dom-
ments. A comparison of the SOA yields and ozone formation
inated by emissions from gasoline motor vehicles. Yet, in
potentials for major source categories (Fig. 5) demonstrates
2015 potential ozone from gasoline vehicles was only 30 %
that product- and process-related emissions have SOA yields
greater than product- and process-related sources, and by
and ozone formation potentials that are on par with other ma-
2020 product- and process-related emissions will surpass
jor urban sources, such as motor vehicles, and are strongly
on-road motor vehicle contributions in the basin (Fig. 2c).
dependent on composition.
Potential ozone from on-road diesel vehicles in 2015 was
4.2.1 SOA formation potential only ∼ 5 % of that from product- and process-related sources.
Contributions to potential ozone from product- and process-
The potential SOA from on-road gasoline vehicles in the related sources are 33 % alcohols, 29 % aromatics, and 12 %
greater Los Angeles region decreased by ∼ 65 % between alkanes (not including unspeciated “LVP VOCs”; Table S2).
the years 1990 and 2015. By 2020, a further reduction by A recent ozone formation sensitivity analysis of solvent-
25 % is expected relative to the 2015 value of 3.3 t day−1 . related emissions speciation with 22 lumped species demon-
These numbers for diesel vehicles are 75 % and 1.3 t day−1 , strated that using input source profiles that are more detailed
respectively. If the emissions inventory is accurate, then the in terms of contributing compound classes would improve
2015 potential products- and process-related SOA in the So- ozone model performance (von Schneidemesser et al., 2016).
CAB is nearly equal to the SOA formation potential of on-
road gasoline and diesel vehicles and is estimated to surpass
them by 2020 with an increasing share of SoCAB’s total an-
thropogenic emissions (Fig. 2b). While single-ring aromat-
www.atmos-chem-phys.net/18/5391/2018/ Atmos. Chem. Phys., 18, 5391–5413, 2018You can also read


