Agriculture and land use, land use change and forestry - The Sixth Carbon Budget
←
→
Page content transcription
If your browser does not render page correctly, please read the page content below
The Sixth Carbon Budget
Agriculture and land use, land use
change and forestry
This document contains a summary of content for the agriculture and land use,
land use change and forestry sectors from the CCC’s Sixth Carbon Budget Advice,
Methodology and Policy reports.

                                                                             2
The Committee is advising that the UK set its Sixth Carbon Budget (i.e. the legal limit
    for UK net emissions of greenhouse gases over the years 2033-37) to require a
    reduction in UK emissions of 78% by 2035 relative to 1990, a 63% reduction from
    2019. This will be a world-leading commitment, placing the UK decisively on the
    path to Net Zero by 2050 at the latest, with a trajectory that is consistent with the
    Paris Agreement.

    Our advice on the Sixth Carbon Budget, including emissions pathways, details on
    our analytical approach, and policy recommendations for the agriculture and
    land use, land use change and forestry sectors is presented across three CCC
    reports, an accompanying dataset, and supporting evidence.

    An Advice report: The Sixth Carbon Budget – The UK’s path to Net Zero, setting out
    our recommendations on the Sixth Carbon Budget (2033-37) and the UK’s
    Nationally Determined Contribution (NDC) under the Paris Agreement. This report
    also presents the overall emissions pathways for the UK and the Devolved
    Administrations and for each sector of emissions, as well as analysis of the costs,
    benefits and wider impacts of our recommended pathway, and considerations
    relating to climate science and international progress towards the Paris
    Agreement. [Section [1] of Chapter 3 contains an overview of the emissions
    pathways for the agriculture and land use, land use change and forestry sectors.

    A Methodology Report: The Sixth Carbon Budget – Methodology Report, setting out
    the approach and assumptions used to inform our advice. [Chapter [2] of this
    report contains a detailed overview of how we conducted our analysis for the
    agriculture and land use, land use change and forestry sectors.

    A Policy Report: Policies for the Sixth Carbon Budget and Net zero, setting out the
    changes to policy that could drive the changes necessary particularly over the
    2020s. [Chapter [2] of this report contains our policy recommendations for the
    agriculture and land use, land use change and forestry sectors.

    A dataset for the Sixth Carbon Budget scenarios, which sets out more details and
    data on the pathways than can be included in this report.

    Supporting evidence including our public Call for Evidence, 10 new research
    projects, three expert advisory groups, and deep dives into the roles of local
    authorities and businesses.

    All outputs are published on our website (www.theccc.org.uk).

    For ease, the relevant sections from the three reports for each sector (covering
    pathways, method and policy advice) are collated into self-standing documents
    for each sector. A full dataset including key charts is also available alongside this
    document. This is the self-standing document for the agriculture and land use, land
    use change and forestry sector. It is set out in three chapters:

       1) The approach to the Sixth Carbon Budget analysis for the agriculture and
          land use, land use change and forestry sectors.
       2) Emissions pathways for the agriculture and land use, land use change and
          forestry sectors.
       3) Policy recommendations for the agriculture and land use, land use change
          and forestry sectors.

3
The approach to the Sixth Carbon
Budget analysis for the agriculture
and land use, land use change
and forestry sectors
The following sections are taken directly from Chapter 7 of the CCC’s
    Methodology Report for the Sixth Carbon Budget.

    Introduction and key messages

    This chapter sets out the methodology for the agriculture and land use, land use
    change and forestry (LULUCF) sectors for the Sixth Carbon Budget pathways.

    The scenario results of our costed pathways are set out in our accompanying
    Advice report (The Sixth Carbon Budget - The UK's path to Net Zero), and policy
    implications in our accompanying Policy report (Policies for the Sixth Carbon
    Budget & Net Zero). For ease, these sections covering pathways, method and
    policy advice for the agriculture and land use sector are collated in The Sixth
    Carbon Budget - Agriculture and Land Use. A full dataset including key charts is
    also available alongside this document on the CCC website.

    The key messages from this methodology chapter are:

       •   Background. GHG emissions in agriculture and land use were 54.6 MtCO2e
           and 12.8 MtCO2e respectively in 2018. The two sectors account for 12% of
           all UK emissions.

       •   Options for reducing emissions and increasing removals. These include
           behavioural change within wider society; productivity improvement;
           significant land use change for planting more biomass and restoring
           degraded peat; sustainable management of existing broadleaf woodlands
           and cropland peat; the take-up of technological options to reduce non-
           CO2 emissions from soils, livestock and waste and switching away from fossil
           fuel use in agricultural machinery to low-carbon alternatives.

       •   Analytical approach. The analysis is based on a detailed review of
           available evidence, including academic research and literature,
           monitoring of latest developments and trends in the sectors, modelling
           conducted by the CCC and two research projects commissioned by the
           CCC, which are published alongside this report. 1

       •   Uncertainty. The scenario framework is used to test the impacts of
           uncertainties, to inform our Balanced Net Zero Pathway. The key areas of
           uncertainty include behaviour change; productivity improvements, scale of
           land use change and costs.

    We set out our analysis in the following sections:

       1. Current and historical emissions from agriculture and land use

       2. Options to reduce emissions in these sectors

       3. Approach to analysis for the Sixth Carbon Budget

5
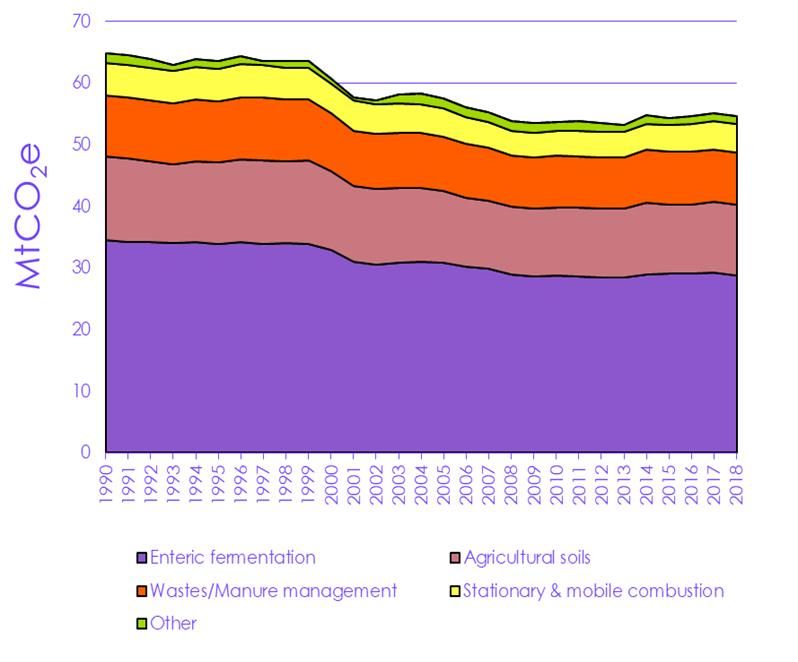
1. Current and historical emissions from agriculture and land use
a) Agriculture
Agriculture GHGs as a share of Agricultural emissions were 54.6 MtCO2e in 2018 using the Global Warming
all UK GHGs has increased
from 7% in 1990 to 10% in 208. Potential of AR5 for methane. This represents 10% of UK GHG emissions in 2018
compared to 7% in 1990. This increase reflects both the slow rate of progress in
reducing the sector's emissions, and the faster pace of decarbonisation elsewhere
in the economy. Agricultural emissions are mainly from livestock and soils. Key
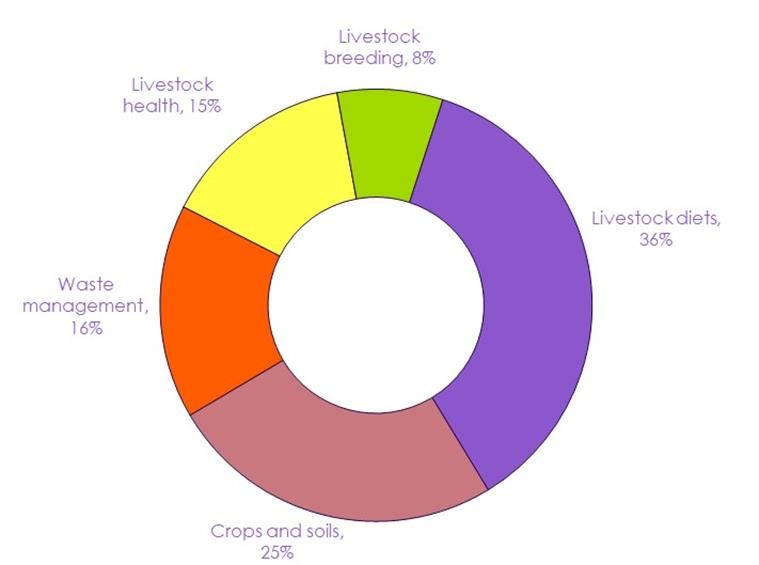
sources of emissions in 2018 were:
• 63% of emissions were methane from livestock, 26% are nitrous oxide (N2O)
mainly from soils and 11% are carbon dioxide (CO2) from the use of fossil
fuels.
• Enteric fermentation from the digestion process of ruminant livestock is the
largest source (53%), agricultural soils (21%), wastes and manure
management (16%), and mobile and stationary machinery 8% (Figure
M.7.1).
Emissions have declined by 16% since 1990. This is mainly due to successive reform
of the Common Agricultural Policy (CAP) in the 1990s and early 2000s, which
reduced livestock numbers, coupled with changes in farming practices due to EU
environmental legislation to address non-GHG pollutants (e.g. Nitrates Directives).
There has been little change in emissions since 2008 (Figure M.7.2).
Figure M.7.1 Breakdown of agriculture emissions
(2018)
Source: BEIS (2020) Provisional UK greenhouse gas emissions national statistics 2019; CCC analysis.
6Figure M.7.2 UK agricultural emissions (1990-2018)
Source: BEIS (2020) Provisional UK Greenhouse Gas National Statistics for the UK; CCC analysis.
7b) Land use, land use change and forestry
Land can remove CO 2 from The land use, land use change and forestry sector (LULUCF) captures carbon
the atmosphere, which makes
it unique among sectors in the
removals and GHG emissions from the use and change in use of different land
GHG Inventory. types in the UK. The main land categories are forestry, cropland, grassland,
wetlands and settlements. There is also an additional category that captures
changes in carbon stocks of harvested wood products (HWP).
Under the current methodology of the Greenhouse Gas Inventory, the LULUCF
sector is a net carbon sink. 2 The sector sequestered 10.3 MtCO2e in 2018, which is
equivalent to abating 2% of UK emissions.
Future improvements to the GHG LULUCF inventory will move the sector from a net
sink to a net source of emissions:
• Only about 6% (1.5 MtCO2e) of peatland emissions are currently reported in
the inventory. Capturing all sources of peatland emissions would bring total
peat emissions to between 18.5 and 23 MtCO₂e in 2018 depending on the
method to estimate forestry peat.
• The adoption of the new Global Warming Potential (GWP) values in 2024, in
line with IPCC guidance, will increase methane emissions by 36% and N2O
emissions will be unchanged if the GWP values include for feedbacks on
the carbon cycle. 3
Including all peatland
emissions in the GHG inventory Including the higher estimate of peatland emissions of 23 MtCO2e would leave the
will turn the sector from a net
sink to a net source of
LULUCF sector a net source of emissions of around 11 MtCO2e in 2018. This rises to
emissions. 12.8 MtCO2e (2% of UK emissions) using the new GWP AR5 values, which we use as
the starting point in our analysis.
A breakdown of land emissions and removals in 2018 shows the dominance of
peatland and forestry (Figure M.7.3):
• Peatlands are the largest emissions source (24.5 MtCO2e), followed by non-
organic cropland (9.8 MtCO2e) and settlements (7 MtCO2e).
• Forestry is the largest net sink at around 18 MtCO2e, which is equally split
between broadleaf and conifer woodlands. Non-organic grassland
sequesters a further 9 MtCO2e, and HWP just over 2 MtCO2e.
The sector’s net emissions decreased by 1% on the previous year. Since 1990 net
The ageing profile of existing
woodlands in the UK is
emissions have fallen by 43% (equivalent to 9.6 MtCO2e) since 1990 (Figure M.7.4):
weakening the strength of
forests to absorb CO 2. • A strengthening of the forestry sink by around 3 MtCO 2e, driven by a steady
programme of afforestation from the 1960s saw annual planting rates reach
40,000 hectares in the early 1970s and close to 30,000 hectares in the 1980s.
The non-organic grassland sink increased by 2 MtCO2e over the period.
• Emissions from non-organic croplands have fallen by 4 MtCO2e.
Peatlands are the largest • The pace of emissions reduction has slowed since 2011. This is due to the
source of land emissions and
forests the largest sink.
weakening of the forestry sink with the ageing profile of existing woodlands
and the decline in planting rates, with an annual average of 9,000 hectares
planted between 2008 and 2018.
8Figure M.7.3 Breakdown of land emissions (2018)
Source: BEIS (2020) Provisional UK Greenhouse Gas National Statistics for the UK; CEH (2020) CCC analysis.
9Figure M.7.4 Land based emissions and removals
(1990-2018)
Source: BEIS (2020) Provisional UK greenhouse gas emissions; CCC analysis.
102. Options to reduce emissions in these sectors
Our previous work (Land Use-Policies for a Net Zero UK (2020) and Net Zero
Meeting Net Zero and other Technical report (2019)) has shown that deep emissions reductions in the
key objectives of land means
we need to change the way agriculture and land sectors cannot be achieved without changes in how we use
we use and manage our land.
our land. The contribution to emissions reduction from these sectors requires actions
to change farming practices and consumer behaviour to release agricultural land
for uses that reduce emissions and sequester carbon. Our analysis assumes that
land needed for food production, housing and other activity is met before climate
mitigation objectives. Key actions are set out in the following sections:
a) Low carbon farming practices and technology
b) Options to release agricultural land for other uses
c) Afforestation and forestry management
d) Agroforestry and hedges
e) Peatlands
f) Bioenergy
a) Low carbon farming practices and technology
i) Low-carbon farming practices
It is not possible to reduce Based on current understanding and knowledge, it is not possible to reduce
agricultural emissions to zero
on current understanding of agricultural non-CO₂ emissions to zero due to the biological and chemical
biological and chemical processes inherent in crop and livestock production. Emissions can be reduced
processes in food production.
through the take-up of farming practices and the adoption of technological
options that improve nitrogen use efficiency, livestock diets and breeding and the
management of wastes and manures.
We commissioned the Scottish Rural College (SRUC) to assess the abatement
potential of such measures.4 SRUC was able to draw upon updated evidence from
Defra’s on-going project, Delivering Clean Growth through Sustainable
Intensification, which aims to deliver sustainable growth in agriculture (Box M.7.1).
Our scenarios include the deployment of 18 measures. A more detailed description
of each measure is set out in the accompanying SRUC report:
Livestock measures
• Breeding measures: breeding aims to select animals with beneficial traits
(e.g. to improve health and fertility), which can also lower emissions
intensity of production as well as increase profitability. We include four
measures:
Low-carbon farming measures
can reduce emissions from soils – Genomics. Genetic improvement can be enhanced by using
and livestock but would still genomic tools in current breeding goals (the specification of the
leave agriculture as one of the
largest emitting sectors. traits to be improved). This requires farmers to collect
performance information on the individual animals which is used
to develop the breeding goal. This measure can be applied to
90% of dairy and 20% of beef cattle.
11– Current breeding. Using current breeding goals to improve
genetic material. Current uptake is around 25% for the dairy herd
and lower for beef cattle, but this measure is applicable to 90%
of dairy.
– Low methane. This includes selecting lower-emitting animals for
breeding which can reduce the methane emissions in
subsequent generations.
– Genetic modification of cattle involves altering the genetic
material to reduce enteric methane emissions. This measure is
currently not legal within the UK and the EU, and yet to be
proven. Deployment should only occur once current
uncertainties relating to efficacy, animal welfare, and the
unknown wider impacts on ecosystems are fully addressed. We
therefore assume this measure is deployed from 2040 at the
earliest.
• Increasing the milking frequency from the common practice of twice to
three times a day can reduce N 2O emissions. More milking increases the
nitrogen utilisation of the cow, which leads to a fall in nitrogen excretion.
Milk yields are assumed to increase by 10%, which can partly offset the
infrastructure costs (robotic milk parlour).
Measures such as breeding, • Livestock diets. We include measures comprising animal feed and additives
diets and health can help that can reduce enteric emissions in cattle and sheep, and one that
reduce emissions from
livestock and improve improves the feed conversion efficiency (FCR):
productivity.
– Feeding high sugar content grasses (HSG), grown on grassland
for grazing livestock, and a high starch diet for dairy cattle
reduce methane emissions. A high starch diet will also reduce
methane emissions from waste. Current uptake of HSG is 9% and
30% for high starch diet.
– 3NOP (3-nitrooxypropanol) is a chemical that can inhibit the
production of methane in livestock rumen. It is a novel option
which we assume is available from 2025. Nitrate additives can
partially replace non-protein nitrogen sources or high protein
sources (e.g. soya).
– Precision feeding involves monitoring and adjusting feed intake
to better match each animal’s nutritional requirements with the
aim of improving the feed conversion ratio (FCR). It is suitable for
housed livestock (dairy cattle, pigs and poultry). As well as
lowering feed costs, increasing the FCR can reduce N 2O and
methane by reducing the rate of nitrogen and volatile solid
excretion in manure.
• Livestock health: Grazing livestock are particularly vulnerable to endemic
disease. Improving health can reduce emissions intensity by improving the
FCR and fertility and reduce mortality, all of which can increase growth
rates and milk yields. Better health includes preventative measures e.g.
changing housing and management to reduce stress and exposure to
pathogens, vaccination, and improved screening, and curative treatments
such as anti-parasitics and antibiotics.
12Soil measures
• Grass and legumes (e.g. clover) mix fix nitrogen into the soil thereby
reducing the need for synthetic nitrogen fertiliser (e.g. by 200 kg per
hectare), which reduces N 2O emissions. Current uptake is assumed to be
26%.
• Cover crops are non-cash crops that are incorporated into the main crop
rotation to minimise soil erosion and maintain soil carbon. Depending on
the type of cover crop used, they can also reduce N 2O emissions by
reducing nitrogen leaching and when ploughed in as green manure can
reduce nitrogen use. Current uptake is assumed to be zero.
• Grass leys are perennial non-woody biomass that are planted as part of an
arable and temporary grassland rotation. It can improve the soil structure
and increase soil organic matter. Current uptake is assumed to be zero.
Waste and manure management
• Anaerobic digestion (AD). We include two types of AD plants, one fed with
cattle manure (536 kW capacity) and the second using pig and poultry
manure (984 kW capacity), both of which are co-digested with maize
silage. Current uptake is 2.5% for both systems.
• Covering slurry tanks with a retrofitted impermeable cover. There is no
current uptake of these on beef and dairy farms, while around a quarter of
pig slurry tanks are fitted with a cover. The measure is applicable to all slurry
tanks and lagoons.
Box M.7.1:
Modelling abatement from low -carbon farming practices
SRUC developed a long-list of 31 measures covering crop and soils management, livestock and
management of wastes and manures, that could be deployed to reduce non -CO 2 emissions
across farms in the UK. These were assessed according to their technical abatement potential and
cost-effectiveness against our assumed carbon values (£181/tCO 2e in 2035).
This resulted in 18 measures which we deployed in our scenarios. Each of these was assigned a
feasibility rating and categorised into type of measure, reflecting whether they mainly relied on
behaviour change, or mainly on innovation which determined the level of ambition of our
scenarios:
• A feasibility rating (hard, medium or easy) corresponding to the ease of implementing the
measure on-farm. The ratings were derived based on farmer feedback undertaken as part
of Defra’s Sustainable Intensification project (Work Package 2: Improving the understanding
of social factors).
• We used this rating to determine an uptake rate for each measure, with the ‘easy’ measure
assigned a high uptake ranging 75-80% dependent on scenario, and the ‘hard’ measures a
lower take-up rate of 50-60%.
• Measures were categorised as either ‘behavioural’ (e.g. planting cover crops) or
‘innovative’ (e.g. genomics breeding), and we assume that the Wider Engagement
scenario has the highest uptake of behavioural measures, while the Wider Innovation has
the highest uptake of innovative measures.
• A lead-in time to deployment to reflect technical and/or policy readiness. We assume that
measures we categorised as being low -cost and low-regret could be deployed immediately
(from 2022) achieving a higher-level of uptake earlier, while a lead-in time of between five,
10 and 20 years was assumed for the more innovative measures (e.g. GM cattle is deployed
from 2040).
Source: SRUC (2020) and CCC analysis.
13The abatement potential from these measures depends on the area of land used
for agriculture and the structure of production. The measures set out in section (b)
below already imply large changes in livestock numbers and land use in the UK:
• The number of cattle, sheep, pigs and poultry falls by between 6% and 24%
by 2035.
• Grassland area decreases by 12–32% and land for crops by10–23% by 2035.
The land release from these measures is used productively for other uses.
This reduces the abatement potential from the take-up low-carbon farming
practices relative to a baseline with no change in land use and livestock numbers:
• Where there is no change in land use and agricultural production remains
as in 2018, the implementation of a high level of low-carbon farming
practices could deliver around 6 MtCO2e emissions savings by 2035 (Figure
M.7.5).
• Abatement from the take-up of low-carbon farming practices falls to
between 3–5 MtCO2e after taking account of changes in the composition
of agricultural production resulting from the measures in our scenarios.
• Our scenarios exclude the take-up of four crop and soil related measures
assessed by SRUC; pH crops, crop health, bio-stimulants and precision crop
farming. Our assumptions on crop yield improvements (section b), already
imply a more efficient use of nitrogen and adding these to our scenarios
would be double-counting. Although we have not included the
abatement savings from these measures, it is important that farmers are
encouraged to take these up to reduce emissions from crops and soils.
14Figure M.7.5 Abatement potential of low carbon
farming practices (2035)
Source: SRUC (2020), CCC analysis.
Notes: Cost-effective abatement up to our assumed carbon value of £181/tCO2e in 2035.
i) Low carbon technology
Fossil fuels used in agricultural machinery and buildings are currently responsible for
4.6 MtCO2e. There were around 40,000 sales of new agricultural equipment in 2019,
covering a wide range of uses including tractors, loaders, ploughs, utility vehicles
and combines. These can be decarbonised through take-up of zero carbon
technologies with our assumptions on decarbonisation technologies aligned to
those in the industry and the off-road machinery sectors. We assume that
electrification of smaller machinery and equipment starts around 2023, with larger
electric machinery entering the market after 2025. Hydrogen options start to be
taken-up in the 2030s.
• Stationary machinery. Emissions are reduced to zero by 2050. Opportunities
to switch to zero carbon options (e.g. renewables and low-carbon
electricity) will reflect action undertaken in the wider-commercial sector.
• Mobile machinery. The bulk of agricultural vehicles switch away from diesel
and biofuels by 2050. Options include hydrogen and electrification and the
uptake of robotics. This sector can draw on advances made to
commercialise low-carbon heavy goods vehicles (HGVs) e.g. reduction in
battery costs and deployment of hydrogen in buses. Data on fleet size,
composition and turnover was drawn from various sources.5 6
15b) Options to release land for other uses
Societal behavioural change The use of the UK’s land has evolved over time. Deep emissions reduction in
and farm productivity
improvements play a crucial
agriculture and land cannot be met without further changes in the way UK land is
role in shifting land use. used. The options we consider shift land use from traditional agricultural production
towards alternative uses to reduce carbon and increase sequestration. These
changes will present new challenges to farmers and landowners. Policy will need
to be designed to ensure new opportunities and revenues are created to reflect
the benefits these measures bring to society (see Policy Report).
In this section we consider the following measures to change the way land is used
while maintaining a strong food production sector:
i) Improving agricultural productivity
ii) Moving horticulture indoors
iii) Diet shift towards healthier eating guidelines
iv) Food waste reduction
v) Summary of impact of measures
i) Improving agricultural productivity
Crop yields
Cereal crop yields in the UK have risen modestly (e.g. 0.5% annual average
increase for wheat, barley and oats) or fallen (e.g. for rye) over the past three
decades. While these yields are higher than the EU average, they remain lower
than key competitors such as France, Germany and the Netherlands. 7 Within the
UK there are also wide yield variation between the best and worst performing
farms, irrespective of soils and climate.
Crop yield improvements can deliver productivity improvements on farm, enabling
the same level of production with less land and other inputs. Our scenarios for
future crop yields are based on the latest literature, discussion with experts and
internal analysis. 8 They take account of climate impacts, management practices
and the role of technology and innovation:
We sought feedback on • Climate impacts. The scenarios are designed to be compatible with limiting
our crop yield assumptions
from experts in Defra,
global average temperatures to 1.5°C. Climate impacts represent both risks
AHDB, Rothamsted and opportunities to crop yields:
Research, ADAS and
academia.
– Higher CO2 concentrations leading to higher fertilisation rates
and longer growing seasons.
– Risks from reduced water availability, particularly in East Anglia
and the south of England.
– Increased risk of soil erosion (e.g. through increased incidents of
high intensity rainfall).
– Increased incidence of floods in winter may limit planting of
winter crops.
– Risk of increased incidence and severity of native and non-
native pests and diseases.
16• Management practices. There is evidence of a large gap between the best
and worst performing farms and wide distribution of yield rates, irrespective
of soils and climate. Better management practices through measures such
as good soil structure and fertility (e.g. through crop rotation); selecting the
optimum planting period and tillage; ensuring good crop nutrition (both
optimum fertiliser and trace elements) and protection from weeds, pests
and diseases could support higher average yields and close the
performance gap between the best and worst farms narrows.
There is also the opportunity to maximise the land resource through spatial
planning and the protection of better-quality land, which could also
address the inefficiencies in the use of land for crops. 9
• Technology and innovation. Crop breeding and selection could lead to
higher yields through development of new cultivars /traits that allow the
next generation of wheat and other crops to be more sustainably
productive and resilient to disease in a warmer climate. It is assumed that
policy will enable technological developments to be transferred to farmers
(e.g. through information, skills and other incentives) to ensure the take-up
of climate-resilient varieties that are most suitable to local conditions.
It should be possible to Our scenarios assume average crop yields rise from 8.2 tonnes/hectare for wheat
sustainably increase crop
yields in the future. If (the average over the past four years) to between 11 and 13 tonnes/hectare by
climate risks dominate then 2050 (and equivalent increases for other crops). We also include a sensitivity to
yields could fall – we
demonstrate the impact of reflect a reduction in crop yields, where the adverse impacts of climate change
this. dominate (Table M.7.1).
Table M.7.1
Crop yield assumptions
Average crop yields Description
(wheat), with equivalent
increases for other crops
Baseline Current farming practices and agronomy largely continue, with no focus on improvements
8.2 tonnes/hectare in the sector. R&D leads to some new varieties but these do not deliver across the board
increases in yields. Some areas are negatively impacted by climate impacts, which affect
yields in some years. No improvement in soil fertility, and continued degradation in some
areas. These impacts offset the CO 2 fertilisation effect and longer growing season.
Medium Some positive impacts of climate change on yields through increased CO 2 fertilisation
11 tonnes/hectares rates and longer growing season. Risks of higher temperatures and flooding do not
significantly impact on yields. No significant water scarcity constraints, but on -farm
adaptive measures including increased water storage capacity help to overcome periods
of water shortage. More widespread take-up of good agronomy practices leading to
better soil fertility and structure which reduces the yield gap between the best and worst
farms. R&D and innovation leads to improvements in crop varieties and policy supports a
moderate level of take-up in the sector.
High Increased fertilisation rates from climate change lead to positive gains on yields. Risks of
13 tonnes/hectare higher temperatures and flooding do not significantly impact on yields. On -farm reservoirs
help to overcome periods of water shortage. High take-up of good agronomy practices
across the sector leads to substantially improved soils. R&D and innovation in crop
breeding results in new cultivars and traits. There is a concerted effort across the sector to
improve yields, and a co-ordinated effort between industry and farmers to share learning
and experience. Lower productivity farms are driven out of the sector/taken -over by
higher productive farms, with some more innovative techniques such as vertical farming
becoming more widespread for certain crop types.
17Climate risk sensitivity Climate risks dominate future yields. Risks of higher temperatures significantly impact on
6 tonnes/hectare yields e.g. heat stress affects yields during flowering time. Crops are affected by water
related constraints, including reduced water availability from trends to drier summers and
increased incidents of water-logged fields from increased flood events in winter.
There is insufficient planning and take-up of measures to mitigate these impacts on crop
production. Increased susceptibility of plants to diseases and genet ic improvements and
breeding lead to failure connected to unanticipated crop susceptibility to new pests and
diseases. Farming practices continue as present, with no focus on improving soils and
adapting to climate impacts.
Livestock stocking density
Grass, as grazed grass and cut for silage for the winter months, is an important feed
for ruminant livestock. It can provide 85% -95% of the energy requirements of beef
and sheep in England. 10 But it is estimated that most of the grassland area is under-
utilised by as much as half, such that grazing cattle and sheep eat just 50% of the
grass that is produced.
Utilisation can be improved by grazing at the right time, to the right height and with
the right amount of livestock. This presents an opportunity to increase stocking
rates without impacting feed requirements (quantity and quality) to enable some
grassland to be used for other uses.
There is considerable scope to
improve grassland utilisation,
Key to achieving this is good grassland management, which includes grazing
improve productivity and management systems. The Agriculture and Horticulture Development Board
enable land to be used for
other uses. (AHDB) estimate that switching away from set-stocking to alternative grazing
management systems can increase grass yields and reduce costs:
• Increasing utilisation rates (i.e. the grass that is eaten) from the current 50%
to 80% with paddock grazing can lead to a near-doubling in yields as
measured by dry matter per hectare.
• These can deliver multiple benefits and offset additional costs to improve
farm profitability:
– Extending the grazing period reduces the costs of housing.
– An increase in improved grass quality can lead to higher
livestock yields, higher dry matter yields and more silage. This
reduces the need to buy in more expensive feed for the winter.
– There will be additional costs associated with infrastructure (e.g.
fencing) and additional labour hours needed to move animals
and fencing.
Our scenarios model the impact of increasing livestock stocking rates by:
• Moving livestock in upland grazing areas and redistributing to other
grassland, resulting in an overall increase in the stocking rate on the
remaining grassland by 5–10%.
• A higher level of ambition with stocking density on both uplands and other
grasslands increasing by 10%.
ii) Moving horticulture indoors
Indoor horticulture can raise Horticultural products such as fruit, vegetables and salad crops are grown on
productivity while reducing
nutrient, land and water
163,000 hectares, or 3% of cropland in the UK.
footprints.
18Indoor systems such as vertical farming, where crops are grown in stacks in a
controlled environment, can raise productivity while reducing the nutrient, land
and water footprint.
Indoor horticulture in the UK is mainly for high value salad crops and is currently
small scale. Some systems are based on hydroponic and vertical production
systems using LEDs. Our analysis assumes that this system could be applied to 10–
50% of current horticultural production.
Given the small area of land currently used for horticulture, moving production
indoors has a limited impact on land area and carbon impacts. More significant
emissions savings would come from moving horticultural production from lowland
peat, although we have not included this in our analysis.
Greater benefits could accrue from shifting arable crop production indoors. The
controlled environment could allow for quicker and multiple harvests each year.
Estimates suggest that combined with a ten-tier stacking system, yields could be
220 to 600 times higher than the current global average annual wheat yield of 3.2
tonnes/hectare. 11 However, this production method is still at the experimental
stage, with trials on-going at Rothamsted Research, while the costs of energy (e.g.
LED lighting) would also have to reduce to make this a cost-effective option.
Indoor wheat production is not included in our scenarios.
iii) Diet shift towards healthier eating guidelines
A shift in diets away from meat There is good evidence that a shift in diets away from meat and dairy products to
and dairy products is good for
health and the climate. more plant-based options is good for both climate change mitigation and for
human health. The National Food Strategy is committed to looking at sustainable
diets (including GHG emissions) as part of its second report, due out in 2021.
Climate change mitigation
Protein can be sourced from a wide range of plant and animal products, some of
which have high GHG and other environmental footprints. The most
comprehensive and up-to-date life-cycle assessments (LCAs) identifies several
robust conclusions regarding the GHG-intensities of different food types produced
around the world (Figure M.7.6):
• Ruminant meat is the most GHG-intensive source of protein. In general,
beef from dedicated beef herds has the highest level of total GHGs, beef
from the dairy herd is generally less GHG-intensive, with a similar emissions
intensity to lamb.
• Plant-based protein sources have significantly fewer GHG emissions than
animal-sourced proteins when compared on a like-for-like basis. The most
GHG-intensive production methods for plant-based proteins generally have
lower emissions than even the most GHG-efficient sources of animal-based
protein.
• Although pigs and poultry produce less emissions directly compared to
ruminant livestock, there are concerns that imported animal feed, in
particular soy, may have high embedded emissions and wider
environmental costs (e.g. loss of natural habitats and biodiversity)
associated with land use change. A 2019 study assessing the livestock
supply chains of 11 European retailers including UK supermarkets found that
only 25% of the 1.8 million tonnes of soy sourced was certified to a
deforestation free standard. 12
19As well as being the most In addition to the emissions impact, livestock require land for grazing and cropland
carbon-intensive protein
sources, meat products have a to grow feed. A study published in 2017 illustrates the relative land inefficiency of
high land footprint. producing livestock products: 13
• In 2010 only 15% of UK agricultural land area was used to grow crops that
are directly grown for human consumption with a further 22% to grow
livestock feed crops. Grassland for livestock accounted for the remaining
63% of agricultural land.
• 85% of the land footprint used to produce animal products contributed
about 32% of total calorie supply and 48% of total protein supply.
• However, cropland and grassland should not be treated equally. In some
regions, crops and livestock farming do not compete for the same land as
many grassland areas (e.g. the uplands) are not suitable for crop
production.
Figure M.7.6 Lifecycle GHG emissions associated
with different protein sources
Source: Poore, J. & Nemecek, T. (2018) Reducing food’s environmental impacts through producers and consumers.
Science, 360 (6392), 987-992.
Notes: Solid bars indicate the production weighted global mean GHG-intensity of different food categories from
studies looking at production across the world. Lifecycle emissions are expressed on the basis of equal protein
content. Error bars indicate the 5th and 95th percentile of studies within the database. GHG emissions are
aggregated using the GWP100 metric. Long-lived GHGs refer to CO2 and N2O and short-lived GHGs to methane.
There has been a growing interest in ‘alternative’ meats that are not animal-
based. Initial LCA studies suggest that these products can have significantly lower
lifecycle emissions than animal-based protein (Box M.7.2).
20Box M.7.2
Novel protein sources
There are a number of 'alternative' protein sources that have a less developed LCA
literature than conventional animal and plant-based sources:
• Lab-grown meat is produced from animal cells cultured in a lab and is a possible
replacement for animal-based meat in the longer-term, but it is currently far from
large commercial scales. If it can be made economically competitive at scale
and achieve customer acceptability, it could offer significant environmental
benefits with no non-CO 2 emissions and very small land footprints. Electricity
requirements (and its carbon intensity) are the biggest uncertainty in assessments
of GHG-intensity. Estimates in the literature range from 1.1 - 3.7 kgCO 2e per 100
grams of protein.
• Insects are efficient converters of their feed into edible calories and protein and
are consumed by humans in some parts of the world. If they could achieve
widespread acceptability with consumers and lower production costs more
insects may be eaten in western diets. Insects could also be used for animal feed.
When fed on waste biomass, insects can be a low GHG protein source (around 0.2
kgCO 2e per 100 grams of protein) and have minimal land-use impacts, but scale
may be limited by the available waste resource. If fed with dedicated crop
feedstocks, emissions and land-use impacts are higher.
Source: SRUC and ADAS (2019) Non-CO2 abatement in the UK agricultural sector by 2050.
Human health
Current UK average protein A healthy diet requires eating a sufficient amount of protein. The recommend daily
consumption is significantly protein consumption is 55.5 grams per person for adult men and 45 grams per
higher than the recommended
daily amount based on the person for adult women based on the Dietary Reference Values:14 Particular
Dietary Reference Values.
individuals or groups may need to consume more or less than this to remain
healthy, depending on age, lifestyle and medical conditions. Current consumption
of protein in the UK is on average significantly above these levels:
• Average daily protein intake was 76 grams per person per day in 2018/19. 15
60% of this protein is derived from animal sources, with 40% from plant-
based sources.
• Modelling by Oxford University of Public Health’s Eatwell Guide, the
Government’s official guide to achieving a healthy and balanced diet,
estimate that meeting the Guide would require an average reduction in
the consumption of meat by around 89% for beef, 66% for pork and 63% for
lamb, and a 20% reduction in dairy products.
• The assumed levels of meat reduction in our scenarios (20–50%) are below
the Oxford University estimates. Dairy reduction in our Balanced Pathway is
in line with the Oxford modelling with further reductions post-2030 in some
scenarios. In both cases we assume that the same amount of protein intake
is delivered through plant-based options, but we also include lab-grown
meat in the Widespread Innovation Scenario.
Consuming more of a plant-based diet can reduce non-communicable diseases
like diabetes, heart disease and a range of dietary-related cancers, which in turn
can lower the risk of developing severe complications from COVID-19. People with
Type 2 diabetes (both controlled and uncontrolled) are 81% more likely to die from
the virus. 16 NHS England estimate that over 100,000 lives could be saved each year
from healthier diets.17
21Official data indicate that consumption of some meat and dairy products has
fallen in the UK. Recent survey data suggests an increased willingness to adopt
more of a plant-based diet, while the increased focus on healthier diets due to the
impact of COVID-19 may be leading an acceleration in this trend amongst certain
groups (Box M.7.3).
Box M.7.3
Trends in UK food consumption
Official government data shows that the consumption of some meat and dairy products
have fallen between 2008 and 2018. * Recent survey data points to an increased
willingness to adopt more of a plant-based diet than official estimates suggest with the
impact of COVID-19 providing an added impetus:
• The average per person meat consumption decreased by 6%, with fresh meat (i.e.
beef, lamb and pork carcass) down by 23%. However, processed meat, which
accounts for around 80% of the meat consumed has remained broadly constant.
• The consumption of dairy products has decreased by 16%, largely due to cuts in milk
and milk products, while cheese consumption increased by 14% over the period. The
overall consumption of fruits and vegetables also decreased by 13%.
• Official data suggest that the proportion of the UK population that is vegetarian or
vegan has increased from 1.6% in 2009/10 to 2.5% in 2015/6. However, more recent
survey data suggests higher figures and a willingness to eat less meat in the future:
– Around 9% of the 2,095 people that participated in a public attitude survey don’t
eat meat. The 2020 survey commissioned by the Eating Better Alliance also found
that around 65% of those surveyed were willing to eat less meat in the future,
citing that more knowledge on how to plan and cook less meat dishes would
help them to cut back.
– Research from Mintel reveal that due to COVID-19 a quarter or people between
21-30 years of age (and 12% of all people surveyed) would find a vegan diet
more attractive. The same research found that consumption of fruit and
vegetables had increased since the start of the pandemic.
Source: Public Health England (2019) National Diet and Nutrition Survey; Mintel (2020).
Our ambition on diet change In our previous ‘Further Ambition’ scenario set out in our Net Zero advice, we
are within range of the Climate assumed a 20% shift away from beef, dairy and lamb by 2050 towards plant-based
Assembly’s recommendations
for a 20-40% change in diets by alternatives. All but one of one of our Sixth Carbon Budget scenarios go further
2050
than this, with the Balanced Pathway towards the middle of the Climate
Assembly’s recommendations for a 20-40% change in diets by 2050. 18
In this stylised analysis, our model assumes that farmers do not respond to the
change in diets by increasing meat and dairy exports. This has three main impacts:
• It reduces emissions from livestock (e.g. methane from enteric
fermentation) and from managing grassland and cropland used to grow
animal feed (e.g. N 2O from fertiliser use).
• It increases the area of cropland used to grow crops for human
consumption and reduces land required for livestock production – both
grassland for grazed livestock and cropland for livestock feed.
• There is a corresponding fall in imports of meat, dairy and animal feed
which reduces the carbon footprint of the UK’s food imports.
22There are uncertainties as to whether these could all be achieved in practice. This
will require a strong policy framework in place to encourage a shift in diets and,
incentives for farmers to improve productivity and to use their land for measures to
sequester carbon (see our accompanying Policy Report: Policies for the Sixth
Carbon Budget & Net Zero).
iv) Food waste reduction
UK households waste between The Waste Reduction Action Programme (WRAP) estimate that around 13.6 million
one fifth and a quarter of food
they buy. tonnes of food and drink is wasted each year. Of this, around 3.6 million tonnes
occurs on-farm, with the remainder post-farm gate. 19 Householders account for the
largest share of post-farm gate waste (70%), while the supply chain comprising
manufacturing (17%), hospitality and food service (9%) and retail (2%) make up
almost all of the remainder.
Reducing the level of food waste could reduce agricultural emissions by avoiding
unnecessary food production and enabling land to be used differently. It would
also reduce emissions downstream (e.g. from avoided emissions from landfill),
which is covered in the Waste chapter of this report.
The private sector has signed up to various international commitments to reduce
food waste and some devolved administrations have their own targets:
• The UN’s Sustainable Development Goal 12.3 has the objective of cutting
per capita global food waste at the retail and consumer level by half
compared with 2007 levels and reducing food losses along production and
supply chains (including post-harvest losses) by 2030.
• This UN target has been adopted by WRAP and the Institute of Grocery
Distribution, in its UK Food Waste Reduction Roadmap (2018) but goes
further by also including on-farm food waste. Around 260 organisations,
including 16 retailers and 162 producers/manufacturers had signed up to
the Road Map as of September 2020. 20
• The Welsh Government is aiming to meet the UN target five years earlier
and are proposing to go further beyond 2025. 21
• The Scottish Government are targeting a 33% reduction (against 2013
levels) by 2025. 22
WRAP announced this year that the UK is halfway to achieving UN SDG12.3.23 All
our Sixth Carbon Budget scenarios deliver a 50% reduction (pre-and post-farm) by
2030 as a minimum, with a higher level of 60-70% reduction by 2050 in all but one
scenario.
v) Summary of impact of measures
Diet change has the biggest Our analysis shows that 1.1 million hectares (7%) more land will be needed to
potential to change how land is
used.
maintain current levels of per capita food production and for settlement growth by
2035 if there is no change in productivity. The measures we identify above could
free up between 3 and 6 million hectares (or (17–35%) of current agriculture land
for other uses. Diet change has the largest impact followed by improvements in
crop yields and increased stocking rates (Figure M.7.7).
• 1.1 million hectares of agricultural land is needed to maintain existing per
capita levels of food production and settlement growth to 2035.
• In the Balanced Pathway, diet change alone accounts for almost two-
thirds (3 million hectares) of land released in 2035.
23• Improvements in crop yields, higher livestock stocking rates and food waste
reduction release about the same area of land (0.5 to 0.6 million hectares
each) in 2035.
• The impact of moving horticulture indoors is limited (7,000 hectares by 2035)
due to the current low land footprint of these products.
Figure M.7.7 Agricultural land area released by
different factors in the Balanced Pathway
Source: CCC Analysis.
Notes: A negative number indicates land is released; a positive number land is required.
24c) Afforestation and forestry management
i) Afforestation
Planting new woodland on previously unforested land delivers carbon
sequestration as well as a range of other benefits for health and well-being and
the environment e.g. air quality and flood alleviation. The future profile of carbon
and other impacts depend on assumptions on the planting and rates, planting
density, tree type and productivity.
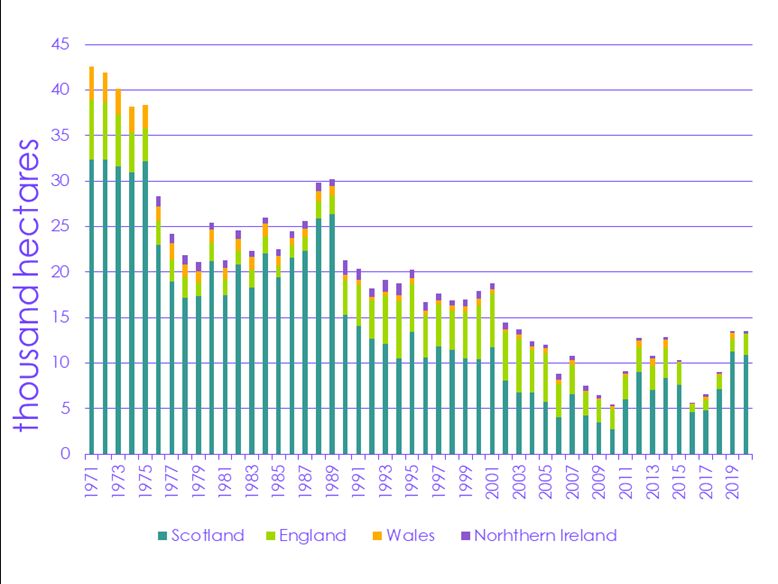
Planting rates
UK Woodland area could increase Around 13% of UK land area is woodland currently, compared with 43% for the EU-
from 13% of land to 17-20% by
2050 in our scenarios. 28 area. 24 We assume annual planting rates range reach 30,000–70,000 hectares
from 2035, recognising it will take time for the sector to scale up to reach these
levels. This would increase woodland cover to between 17% and 20% by 2050. *
The lower bound corresponds to the Government’s commitment to plant 30,000
hectares in 2025 while the upper bound is within range of our assessment of what is
feasible:
• A programme of afforestation after the Second World War increased UK
woodland area from 6% in 1947 to around 8.7% over a 30-year period. 25 This
corresponds to planting around 22,000 hectares each year.
• Annual afforestation rates averaged 40,000 hectares in the early 1970s and
close to 30,000 hectares in the late 1980s in Great Britain. If we include the
restocking of existing forested areas, planting rates reached over 50,000
hectares in the early 1970s and over 40,000 hectares in the late 1980s. This
serves as a useful indicator of the supply chain’s capability to meet higher
levels of tree planting (Figure M.7.8).
• In France, woodland area expanded by almost 7% between 1990 and 2015
to 17 million hectares.26 This is equivalent to an average annual
afforestation rate of 46,000 hectares during the period. The UK has a similar
ratio of population to land area as Germany, but Germany has over 30% of
land that is forested compared to the UK’s 13%.
• Studies by industry and the voluntary sector suggest higher levels of UK
planting:
– The Confederation of Forest Industries’ (Confor) call for UK
planting rates to reach 40,000 hectares a year by 2030 takes
account of their assessment of the industry’s capacity to scale-
up (e.g. nurseries and foresters). 27
– The Woodland Trust set out an ambition to deliver 19% of UK
woodland cover by 2050, with preference given to the planting
of native woods and trees. 28
– Friends of the Earth cite an ambition to double woodland to 26%
by 2045, both to support efforts to increase carbon removals and
protect and restore nature. 29
* This excludes the area of small woodlands of less than 0.5 hectares in size, and less than 20 metres in width, which
currently totals 355,000 hectares.
25Figure M.7.8 Afforestation rates (1971-2019)
Source: Forestry Commission, Natural Resources Wales, Forest Service and Forestry Commission statistics.
Notes: Planting year ends end March. Data not available for Northern Ireland from 1971-1975.
Type of woodland created
The right trees need to be The UK Forestry Standard prohibits the planting of mono-cultures and limits the
planted in the right place and
take account of soil, climate and planting of any one species on one site. The ratio of broadleaf and conifer
other land uses. planting vary across our scenarios to reflect different objectives for woodland
creation, and regional differences in climate and soils (e.g. conifers can withstand
cold weather in the north of Scotland). Existing woodlands in England are
predominantly broadleaved and conifers dominate in Scotland:
• We develop different scenarios in favour of broadleaved forestry and in
favour of conifers:
– A 67:33 planting ratio in favour of broadleaves is assumed for the UK
where the focus is on biodiversity. Taking account of regional
differences, the ratio increases to 80/20 in England, and is lower in
Scotland at 50:50.
– A 33:67 planting ratio in favour of conifers is assumed where the focus
is on productive forestry. This increases to 75% for conifers in Scotland.
• In our modelling, Sitka spruce is used to represent conifer forestry and
sycamore/ash/birch to represent broadleaf forestry.
26Planting density
We model different planting
densities to better reflect
Tree planting density is important for determining tree growth, carbon
differences between broadleaf sequestration and wood density as well as wider impacts such as soil health and
and conifer woodland creation.
biodiversity.
Our scenarios reflect different planting densities (number of stems planted per
hectare) to better reflect differences between broadleaf and conifer woodland
creation, and to understand the trade-off between maximising carbon
sequestration and other impacts such as biodiversity. We assume:
• A planting density of 3,000 stems/hectare for conifers to maximise carbon
sequestration and timber output, and 2,000 stems/hectare for broadleaves,
which is commonly seen as the upper end.
• Where society places a higher value on biodiversity, the planting density for
broadleaves is reduced to between 1,200–1,800 stems/hectares. Lower
density planting also allows for the retention of landscape features and
open views, and glades. Our range is consistent with the planting regime
supported by the Woodland Trust.
While the planting density we use are averages for the UK, we recognise that in
practice there will be variation across the UK than we can capture in our analysis.
Forest productivity
There is scope to increase Different trees have different growth rates and levels of productivity as measured
productivity of new forests.
by their Yield class (YC). This has a bearing on the time profile and rate of carbon
sequestration, and the quantity of timber output. We have updated our yield class
assumptions since our Net Zero advice based on data from the National Forest
Inventory (NFI) and stakeholder engagement (Box M.7.4):
• The average yield class of existing conifer and broadleaf woodland is YC14
and YC6 respectively under the NFI.* We take this as the baseline yield class
for new planting.
• Best practice in silviculture and innovation through breeding can increase
productivity to an average of between YC16–18 for conifers and up to YC8
for broadleaves. We assume it takes 10 years before YC18 and YC8 are
introduced in our scenarios.
Box M.7.4
Tree productivity
Improving yields enables trees to be more productive both in terms of the amount of
CO 2 they can sequester and the volume of harvested products. In addition, breeding
can improve the quality of the wood to be used as timber and increase resilience to the
impact of climate change. Our assumptions on improvements in average yield class
follow discussions with a wide range of stakeholders that include the Forestry
Commission, Scottish Forestry, Future Trees Trust, the Woodland Trust, Confor and Pryor
and Rickett Silviculture. We considered two factors that could deliver higher productivity
rates:
• Silvicultural practices. The adoption of best silvicultural practice covers the nursery
stage, choice of planting stock and area, establishment and on -going management
as the tree grows.
* Weighted mean yield class based on stands aged 15-50 years.
27Measures would include site preparation to ensure the successful establishment of
saplings. Selecting the right trees for the right area means taking account of the level
of moisture and nutrients in the soil. For example, Sitka spruce does not tolerate
drought and requires moisture, while beech is no longer considered a good option
due to susceptibility to drought. On-going management could entail protection of
young trees from deer and squirrels, managing the surrounding vegetation to reduce
competition and ensure successful establishment, and decisions on when to
respace, thin and fell.
• Breeding. Research is being led by the commercial sector with organisations such as
the Conifer Breeding Co-operative, and the broadleaved focused Future Trees Trust.
Work of the latter is focused on six major broadleaf species of British origin (ash, oak,
sycamore, chestnut, birch and cherry) that are genetically diverse and resilient. Due
to its susceptibility to drought beech is no longer considered an appropriate specie.
Breeding requires selecting the best parents, whereby seeds are collected from the
mother tree, and bringing them together to cross-fertilise. Their progeny breeding
work to date is still based on theoretical gains (3-5% by 2030 and 10% by 2050 for the
six broadleaf species) rather than real gains. More time is needed to test the real
gains, with trees of at least 10 years old, when yield and height measurements can
be assessed across a variety of UK situations and sites.
Open ground
We allow for an area of open The UK Forestry Standard (UKFS) sets out a requirement that new woodland over 10
ground in new woodland to
improve biodiversity. hectares in size should include a minimum 10% of open ground or ground
managed for the conservation and enhancement of biodiversity as the primary
objective.
Our scenarios are consistent with these standards, with the lower bound of open
ground in line with the minimum 10% set out by the UKFS, and an upper bound of
20% is used where we place an increased value on biodiversity. This area of open
ground increases the land area needed to meet our afforestation ambition by an
additional 10-20%.
ii) Forestry management
Around 80% of broadleaf woodlands in England (74% of woodland area) are in an
un-managed or under-managed state. Introducing sustainable management
broadleaf woodlands that is compliant with the UK Forestry Standard has several
benefits:
• It can improve woodland health and productivity and increase carbon
sequestration by allowing young and better-quality trees to thrive.
• Improve habitat quality and biodiversity by allowing in more light.
• Increase the resilience of woodlands to wind, fire, pests and diseases, which
could increase under a warming climate.
• Management can generate revenue from the sale of harvested material.
We assume that 67–80% of broadleaf woodlands are managed sustainably by
2030. The lower level is the ambition set by Defra, covering both broadleaf and
conifer woodlands, to be achieved by 2018. The target was missed, with 59% of
woodland currently managed. Management increases timber output and
accounts for 75–90% of the material used for fuel across our scenarios by 2035. Our
analysis assumes that all conifers are in some form of management, although not
necessarily compliant with the UK Forestry Standard.
28You can also read