Sustainable Agriculture 2018 Market Intelligence Report
←
→
Page content transcription
If your browser does not render page correctly, please read the page content below
Sustainable Agriculture
–
2018
Market Intelligence Report
–
GreenCape
                                                                GreenCape is a non-profit organisation that supports and
                                                                promotes the green economy – low carbon, resource efficient and
                                                                socially inclusive – in the Western Cape, South Africa. We assist
                                                                businesses and investors focusing on green technologies and
                                                                services to remove barriers to their establishment and growth.

                                                                Acknowledgments
                                                                We thank Inge Kuschke and Jana Jordaan for the time and effort
                                                                that went into compiling this market intelligence report. We also
                                                                thank Louw Pienaar and the Association for Vertical Farming for
                                                                their feedback on earlier drafts of this document.

                                                                Disclaimer
                                                                While every attempt has been made to ensure that the
                                                                information published in this report is accurate, no responsibility
                                                                is accepted for any loss or damage that may arise from any person
                                                                or entity relying on any of the information this report contains.

                                                                Copyright © GreenCape 2018

                                                                This document may be downloaded at no charge
                                                                from www.greencape.co.za. All rights reserved.

                                                                Subscribe to receive e-mail alerts or GreenCape news, events
                                                                and publications by registering as a member on our website:
                                                                www.greencape.co.za.

                                                                Image courtesy of: Western Cape Department of Agriculture

                                                                18 Roeland Street, Cape Town, 8001, South Africa

                                                                Editorial and review:              Lauren Basson, Salomé Bronkhorst, Catherine Pineo and Nicholas Fordyce
                                                                Images: 			                        Bruce Sutherland (City of Cape Town), Western Cape Department of Agriculture and GreenCape
                                                                Layout and design: 		              Deep Agency

II   Sustainable Agriculture: Market Intelligence Report 2018   Sustainable Agriculture: Market Intelligence Report 2018                                                                        III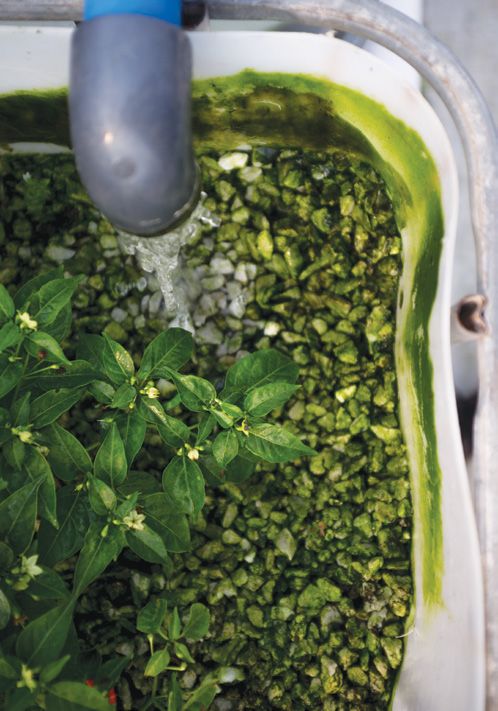
Contents

Executive summary 		                                                                                           x     5. Funding and incentives 		                               39
1. Introduction and purpose 		                                                                                 1        5.1. Agriculture funding and incentives 		              39
2. Sector overview 		                                                                                          3        5.2. ICT funding incentives 		                          40
    2.1. Physical geography and climate 		                                                                     3        5.3. Financing for climate-smart agriculture 		         40
    2.2. Economic overview 		                                                                                  3        5.4. General funding opportunities 		                   40
         2.2.1. South African agriculture 		                                                                   3             5.4.1. Green Finance Database 		                   40
         2.2.2. Western Cape agriculture 		                                                                    5             5.4.2. Other databases 		                          40
    2.3. Key players 		                                                                                        7             5.4.3. Funding opportunities of note 		            41
    2.4. Drivers of green technologies and approaches in agriculture                                           7             5.4.4. Funding gaps of note 		                     42
         2.4.1. Water scarcity as a driver for greentech uptake in agriculture 		                              8             5.4.5. Assistance available 		                     42
    2.5. Support available in the Western Cape 		                                                             10        5.5. Manufacturing incentives 		                        42
3. Policies and regulations 		                                                                                13     6. The Western Cape: Africa’s growing greentech hub 		     43
    3.1. Agriculture policies and regulations 		                                                              13     7. GreenCape’s support to businesses and investors 		      47
         3.1.1. Carbon tax 		                                                                                 13     Appendix A: Key role players 		                            49
         3.1.2. Water 		                                                                                      15     References 		                                              50
         3.1.3. Land reform                                                                                   16
         3.1.4. Initiatives promoting sustainable production 		                                               17
    3.2. Investment policies and regulations 		                                                               17
4. Opportunities and barriers 		                                                                              19
    4.1. Market updates for 2018: energy efficiency, renewable energy, and conservation agriculture           19
    4.2. Controlled environment agriculture 		                                                                24
         4.2.1. Overview 		                                                                                   24
         4.2.2. Market update 		                                                                              24
         4.2.3. Barriers to investment 		                                                                     28
    4.3. Precision agriculture: drone technology in agriculture 		                                            29
         4.3.1. Overview 		                                                                                   29
         4.3.2. Market uptake 		                                                                              30
         4.3.3. Barriers to investment 		                                                                     33
    4.4. Emerging trends 		                                                                                   34
         4.4.1. Mobile applications in agriculture 		                                                         35
         4.4.2. ICT for smallholder farmers: improving risk profiles for credit and access to insurance       36

IV                                                        Sustainable Agriculture: Market Intelligence Report 2018   Sustainable Agriculture: Market Intelligence Report 2018    V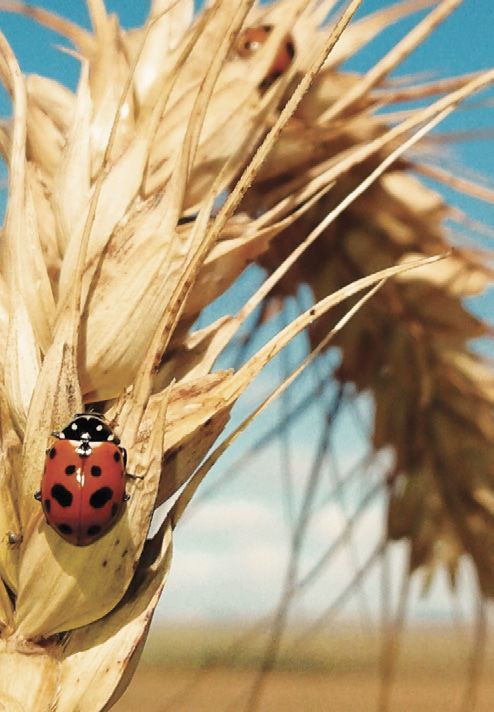
List of figures                                                                                                           List of tables
Figure 1                                                                                                         Table 1
South Africa GDP contributions from agriculture (ZAR million per quarter)                                   4    Top 10 products exported by the Western Cape in 2016                                            5
Figure 2                                                                                                         Table 2
Benefits of saving water on the farm                                                                        9    Key role players in agriculture                                                                 7
Figure 3                                                                                                         Table 3
Uptake of solar PV by the agriculture sector		                                                             21    Water availability in the Western Cape (million m3 a year)                                      8
Figure 4                                                                                                         Table 4
Small-scale embedded generation in the Western Cape                                                        22    Potential costs and savings associated with the application of precision agriculture           10
Figure 5                                                                                                         Table 5
Cropland area taken up by conservation agriculture from 2008/09 to 2015/16                                 23    Support for Western Cape agriculture                                                           10
Figure 6                                                                                                         Table 6
Types of blueberry production systems in South Africa                                                      24    Selected acts and plans relevant to the agricultural sector                                    14
Figure 7                                                                                                         Table 7
USA vertical farming market size per technology from 2013–24 (US$ billion)                                 26    Main water-related legislation                                                                 15
Figure 8                                                                                                         Table 8
Forecast of worldwide drone opportunities			                                                               32    Energy efficiency market update                                                                19
Figure 9                                                                                                         Table 9
Drone use in industries in the USA			                                                                      32    Renewable energy market update                                                                 20
Figure 10                                                                                                        Table 10
McKinsey Global Institute Industry Digitization Index 2015			                                              34    Conservation agriculture market update                                                         23
Figure 11                                                                                                        Table 11
Mobile phone users per global region			                                                                    35    Results of comparative study between open field and undercover farming for tomato production   25
Figure 12
GreenCape’s focus areas 		                                                                                 48

VI                                                    Sustainable Agriculture: Market Intelligence Report 2018   Sustainable Agriculture: Market Intelligence Report 2018                                       VII
List of acronyms
             and abbreviations
ARC         Agriculture Research Council                                                                  PA                   Precision Agriculture
CA          Conservation Agriculture                                                                      PQRS                 Power Quality and Renewable Services
CARA        Conservation of Agricultural Resources Act                                                    PV                   Photovoltaic
CCAFS		     Climate Change, Agriculture and Food Security                                                 PwC                  PricewaterhouseCoopers
CCC		       Confronting Climate Change                                                                    R&D		                Research and Development
CEA		       Controlled Environment Agriculture                                                            RE                   Renewable Energy
CoCT		      City of Cape Town                                                                             REEEP                Renewable Energy and Energy Efficiency Partnership
DAFF		      Department of Agriculture, Forestry and Fisheries                                             SANEDI               South African National Energy Development Institute
DEA		       Department of Environmental Affairs                                                           SME                  Small- and Medium-sized Enterprise
DWS		       Department of Water and Sanitation                                                            SA                   South Africa
EE          Energy Efficiency                                                                             SEZ                  Special Economic Zone
EIA         Environmental Impact Assessment                                                               UAV                  Unmanned Aerial Vehicles
ELU         Existing Lawful Use                                                                           USA                  United States of America
ESCo		      Energy Services Company                                                                       V&V		                Validation and Verification
EU          European Union                                                                                VSD		                Variable Speed Drive
GDP         Gross Domestic Product                                                                        WC		                 Western Cape
Greentech   Green technologies                                                                            WCDoA                Western Cape Department of Agriculture
GHG		       Greenhouse Gas                                                                                WCWSS                Western Cape Water Supply System
Ha          Hectares                                                                                      WMA		                Water Management Agency
IB          Irrigation Board                                                                              WSA		                Water Services Act
IBI         Index-based insurance                                                                         WWF		                World Wide Fund for Nature
ICT         Information and Communication Technology                                                      ZAR                  South African Rand
IGDP        Integrated Growth and Development Path
kW          Kilowatt
kWh         Kilowatt-hour
kWp         Kilowatt-peak
Mha		       Million hectares
MIR         Market Intelligence Report
NCPC        National Cleaner Production Centre
NDP         National Development Plan
NEMA        South Africa National Environmental Management Act
NWA         National Water Act
NWRS2       National Water Resource Strategy 2nd Edition

VIII                                           Sustainable Agriculture: Market Intelligence Report 2018   Sustainable Agriculture: Market Intelligence Report 2018                   IX
Executive summary
     The South African and Western Cape agriculture sectors offer numerous
     opportunities for investors, green technology manufacturers, service
              providers, distributors, and others in the value chain.

The South African agriculture sector is a competitive      ■■     Mobile applications: Between 2010 and 2015               The main drivers of these opportunities include:
and robust sector in which to invest. Despite losses              there was an increase of 400%, from 300 000 to
due to the recent drought in South Africa (SA),                   1.5 million, in mobile apps for agriculture. There       ■■   water availability in the agricultural sector; and
agricultural exports have continued to grow from                  are opportunities for various role-players, such as      ■■   the need for improved resource efficiency to
R106.8 billion in 2015 to R131.9 billion in 2016.                 app developers and entrepreneurs in agriculture               reduce inputs and improve productivity.
                                                                  and other cross-cutting sectors.
The Western Cape (WC) province dominates                                                                                   Water availability is critical for agriculture. Various
agricultural export production and contributes 24% to      ■■     Energy efficiency: Although there have been              parts of SA experienced droughts over the last three
SA’s agricultural Gross Domestic Product (GDP), with              minor market developments in SA’s agri-related           years, with ongoing drought conditions in many
agriculture and agro-processing responsible for 18% of            energy efficiency (EE) market, the known                 regions. The WC is currently experiencing one of the
all formal employment opportunities in the province.              investment to date is R3.6 million with an               worst droughts on record. The drought is in its third
The province also offers a healthy investment climate             estimated market value of R266 million. There            year and the winter rainfall season of 2017 delivered
as it has sound agricultural (and other) infrastructure,          are opportunities for farmers, energy consultants        significantly less rainfall than the long-term average.
support systems and programmes.                                   and service providers in EE.                             This has highlighted the urgency to adapt to this ‘new
                                                                                                                           normal’ for SA in light of:
There are opportunities in the agriculture sector for      ■■     Renewable energy: SA’s agri-related solar PV
investment in controlled environment agriculture and              market has grown substantially from previous             ■■   climate change predictions, which indicate a
drone technologies, and emerging opportunities in                 years with 8 395 kWp of solar PV installations in             drier climate and greater rainfall variability across
mobile applications and software programmes for                   2017, of which 2 233 kWp (26%) was installed in               southern Africa; and
agriculture. There are also opportunities in energy               the WC. The estimated market size for this sub-          ■■   a growing urban population, causing further
efficiency, renewable energy, and conservation                    sector in the WC is between R120 million and                  pressure on water allocation to agriculture.
agriculture.                                                      R190 million. There are opportunities for various
                                                                  players along the value chain, including solar           Resource efficiency and availability are critical
■■   Controlled environment agriculture: The                      PV developers, installers, service providers and         in agriculture. Agriculture production takes place
     current market for controlled environment                    farmers.                                                 in a highly competitive global market and greater
     agriculture (CEA) is conservatively valued at                                                                         efficiencies are necessary for producers to stay
     R28 million (for low-tech CEA) to R600 million        ■■     Conservation agriculture: Globally, conservation         competitive. Rising input costs (such as diesel and
     (high-tech CEA), with growth predicted to be                 agriculture (CA) covers 180 Mha (12% of global           electricity) and deteriorating natural resources,
     15% a year. In the past year, the market size for            annual cropland), representing an increase of            particularly soil health, are driving the uptake of a
     CEA increased by at least R128 million in the                15% increase from the previous year. In SA,              number of opportunities highlighted here. With few
     WC. There are opportunities for manufacturers,               uptake varies greatly across the country. The WC         incentives available for investment in greentech and
     suppliers, installers, and operators.                        is leading uptake with 80% of grain production           practices, the promising business case for resource
                                                                  cropland under CA; KwaZulu-Natal is second               efficiency (i.e. greater profits due to lower input
■■   Drones: The South African drone industry, a key              with an uptake of 70%. Uptake in the rest of             costs), predominantly drives uptake of greentech and         Copyright © Bruce Sutherland, City of Cape Town
     component of precision agriculture, generated                the country’s grain areas is at 20%. The main            services by the agriculture sector.
     an estimated R2 billion in 2017. There are                   greentech opportunity is for no-till equipment
     opportunities for various cross-cutting industries,          manufacturers and distributors.
     particularly service providers.

X                                                               Sustainable Agriculture: Market Intelligence Report 2018   Sustainable Agriculture: Market Intelligence Report 2018                                                       XI
What’s new?

      The 2018 Sustainable Agriculture MIR discusses the economic impact
      of the drought on Western Cape agriculture & highlights water scarcity
      as a key driver for the uptake of greentech in South African agriculture.
                              It specifically highlights:

      •   market growth in controlled environment agriculture (CEA),
      •   driven by the need to mitigate production losses, and;
      •   greentech that supports precision farming.

      The 2018 Sustainable Agriculture MIR provides key updates for
      energy efficiency, renewable energy and conservation agriculture
      opportunities explored in detail in the 2017 report. It also provides
      greater insight into the local opportunities in CEA and drone
      technology applications in agriculture production. Insight on
      emerging opportunities in information and communication technology
      (ICT), in particular mobile applications and software programmes for
                   agriculture, are also discussed in this report.

      For new readers, we advise that you first read the 2017 Agriculture
          MIR for an in-depth understanding of the opportunity areas.

                                                                                                         Copyright © GreenCape
XII                                           Sustainable Agriculture: Market Intelligence Report 2018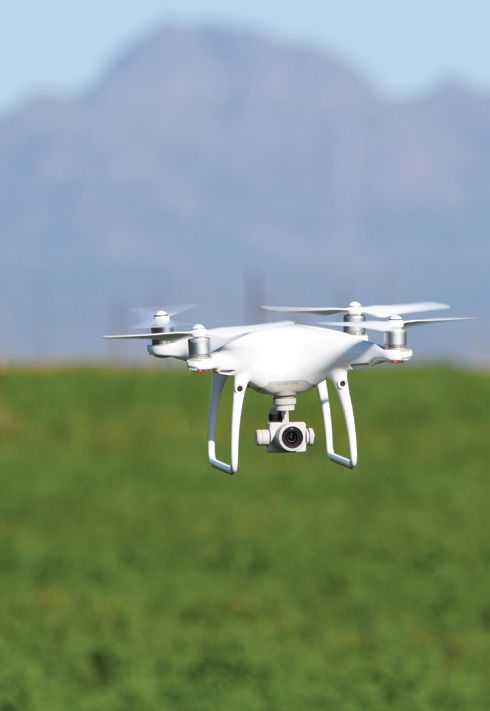
1–
        Introduction and purpose
             This market                  intelligence report (MIR) has been compiled by
             GreenCape’s                 Agriculture Sector Desk. It highlights opportunities
             for greening                agriculture production, and is written for investors,
             particularly                new entrants to the South African sustainable
                                                    agriculture sector.

GreenCape’s Agriculture Sector Desk was                                              The main focus is on controlled environment
established in 2014 in partnership with the Western                                  agriculture     (CEA)    and     drone    technology
Cape Department of Agriculture (WCDoA).                                              applications in agriculture production. Investment
The desk aims to support the development of                                          in information and communication technology
sustainable and competitive agricultural value                                       (ICT), in particular mobile applications and software
chains through the uptake of green technologies                                      programmes for agriculture, is also discussed as
(greentech) and sustainable production practices1.                                   an emerging trend. Updates are provided on the
This is achieved by raising awareness of the                                         areas explored in detail in the 2017 MIR: energy
benefits of greentech uptake (i.e. driving demand                                    efficiency, renewable energy and conservation
within agriculture), and highlighting opportunities                                  agriculture.
for greentech manufacturers and service providers
(i.e. supporting supply).                                                            In what follows, there is a sector overview
                                                                                     (Section 2) that provides a national and provincial
This MIR provides updates on key issues and                                          economic overview of agriculture with the focus
opportunities identified in previous MIRs, and                                       on macro-economic trends and key players. This is
highlights new opportunities related to technologies                                 followed by an overview of policies and regulations
and practices that:                                                                  (Section 3) that guide and affect investors in the
                                                                                     agriculture sector. Key opportunities and trends
■■     increase production efficiency (i.e. producing                                are then highlighted (Section 4). The final sections
       more with fewer inputs);                                                      outline various finance and investment incentives
■■     benefit the environment, primarily by                                         (Section 5), present the case for the Western
       conserving resources, reducing negative                                       Cape as a potential greentech hub for Africa
       impacts such as pollution, and increasing                                     (Section 6), and explain GreenCape’s work in the
       resilience to climate change; and                                             green economy (Section 7).
■■     have the potential to attract international and
       cross-sector investment.                                                      For assistance, or if you have any questions after
                                                                                     reading this MIR, please contact the agriculture
                                                                                     team on telephone +27 (0)21 811 0250 or email
                                                                                     agri@greencape.co.za.

1    In this context, greentech and sustainable production practices are those that increase resource efficiency and decrease greenhouse gas emissions.

                                                                                                                                                          Copyright © Western Cape Department of Agriculture
1                                                                                        Sustainable Agriculture: Market Intelligence Report 2018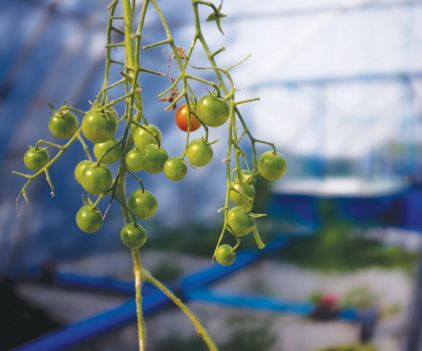
2–
                                   Sector overview
            This section provides an overview of the South African and
            Western Cape agricultural sectors and their structure, macro-
            economic trends, key players, and drivers of green technology
                  and sustainable production practices in agriculture.

2.1. Physical geography and climate                                                The agriculture sector has been affected by various
South Africa (SA) is a semi-arid country, making water                             exogenous factors, which have put pressure on its
a key constraint to production. Water availability and                             output performance. These include the 2015/16
the business case for improving water efficiency in                                drought, which affected major parts of the grain
agricultural production are examined in Section 2.4.1.                             producing regions of the country. This can be seen in
                                                                                   Figure 1 below, which shows sustained contractions in
Climatic regions in SA include Mediterranean,                                      value added by the sector for six consecutive quarters.
subtropical and semi-desert, enabling the production                               However, due to improved weather conditions in
of a wide range of agricultural commodities. A                                     large parts of the country and a recording-breaking
detailed overview of the physical geography and                                    maize harvest, the sector has seen a strong rebound
production of commodities in SA is available in                                    in 2017. This turnaround, together with growth in the
GreenCape’s 2016 Agriculture MIR.                                                  mining sector, has ensured a positive balance for the
                                                                                   aggregate SA economy after having experienced a
Detailed analysis of production areas and climate                                  technical recession in the previous two quarters.
change trends in the Western Cape (WC) province
is provided by the SmartAgri2 publications for                                     South African agricultural exports have continued to                              Figure 1: South Africa GDP contributions from agriculture (ZAR million per quarter)
farmers, policymakers, agricultural organisations and                              rise despite the drought, growing from R106.8 billion                             Source: WCDoA (2017)
researchers.                                                                       in 2015 to R131.9 billion in 2016 (Business Day 2017).
                                                                                   Africa remained SA's largest export market in 2016,
2.2. Economic overview                                                             accounting for 44% of exports. Growth was also seen                               However, SA financial institutions report that foreign     ■■   Grain: provision of agri services (financial,
This section provides an overview of the agricultural                              in the Asian (13%), European Union (EU) (5%) and                                  agriculture businesses are investing in South African           mechanisation and irrigation), grain storage,
economy in SA and the WC, with the focus on the                                    American (5%) markets. The main export products                                   horticulture to diversify their supply base. Global             milling, packaging and logistics in regional grain
sector’s economic contribution, value of commodities                               were beverages, spirits, fruit, and wine. These figures                           companies are primarily investing in land, production           concentrated markets.
and production trends. For a more detailed overview,                               bear testimony to a resilient sector with a strong                                and packing infrastructure, including controlled
refer to the 2016 Agriculture MIR and as the latest                                global demand for the country's agricultural products.                            environment agriculture (CEA) infrastructure, with less    ■■   Dried fruit: packaging and logistics to distribute
Bureau for Food and Agricultural Policy (BFAP)                                                                                                                       investment in value-add through processing. Land                a wide range of selected dried fruit, nuts and
Baseline Report3.                                                                  Investment trends                                                                 is strategically selected and often rented to local             related products to local and regional markets,
                                                                                   Investment in agriculture is widely recognised as a key                           farmers or agri-businesses who are responsible for              as well as export of high-quality dried fruit as
  2.2.1. South African agriculture                                                 driver in achieving various goals relating to increasing                          production, but not for the land or infrastructure.             healthy snack food.
The agricultural sector only contributes 2.5% to the                               agricultural production, improving food security and
overall South African economy’s Gross Domestic                                     reducing poverty (Lowder et al. 2015). Current barriers                           Another investment trend is local private equity           ■■   Livestock: livestock agri services (finance,
Product (GDP) (Quantec 2017). However, the sector                                  to investment in SA agriculture include relatively high                           investment in small and medium-sized enterprises                auctioneering and logistics), and marketing of
plays a significant role in SA in terms of creating                                labour costs, water insecurity, rising electricity costs,                         (SMEs) with scalable business models, particularly in           wool and mohair.
employment opportunities, generating foreign                                       rural security concerns, and the quality and availability                         fast growing industries in sub-Saharan Africa. These
reserve income through exports, and ensuring a stable                              of export-commodity seedlings.                                                    investments capitalise on the consolidation of agri        Other investors are focusing on providing CEA
food supply to the country. For these reasons, the                                                                                                                   and food businesses in Southern Africa. They link with     infrastructure to improve seedling supply, and on
National Development Plan (NDP) has highlighted the                                Gross fixed capital formation (GFCF) in SA’s agricultural                         established agri businesses that are already operating     selective breeding of high feed efficiency livestock,
importance of this sector to drive rural development                               sector has increased in the past decade, but there                                in the market and that have the infrastructure and         such as Boerbok goats, for the global halal market.
and create additional jobs.                                                        have been worrying declines in the past two years.                                scale to do business in Africa. Investments have
                                                                                                                                                                     focused on the following:

2   SmartAgri publications can be found at https://goo.gl/kvoVxc
3   BFAP’s purpose is to objectively inform and support decision-making by stakeholders in the agro-food, fibre and beverage sectors of Africa. It provides
    independent, rigorously tested, research-based market and policy analyses. BFAP consists of a network of associates and researchers at universities across the
    African continent. The latest report (2017) can be found at https://goo.gl/PWPA8a.

3                                                                                       Sustainable Agriculture: Market Intelligence Report 2018                     Sustainable Agriculture: Market Intelligence Report 2018                                                        4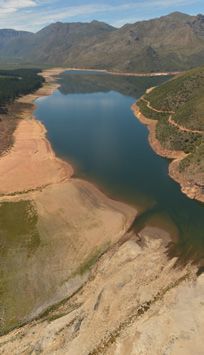
2.2.2. Western Cape agriculture Most of the WCWSS’s water is supplied by six major Overall, monetary losses at primary production
The WC agricultural sector contributes 24% of dams. The water is integrated and collectively level due to the drought for the 2017/18 season
the total national agricultural GDP. Agricultural Eight of the top ten managed to allow for transfer between dams and was R 5.9 billion, while job losses amounted to
value chains play a significant role in contributing products exported from the catchment systems, and to help optimise the use of approximately 30 000.
to the provincial economy by generating foreign WC are fresh or processed water resources in the region. Dams are recharged
reserve income and employment. Although the by rainfall in their catchment areas during the Further interventions to reduce water consumption
WC agricultural sector contribution to the total agricultural products cooler winter months of May to August. Dam levels include restricting the use of groundwater5
economy is ~4%, upstream and downstream decline during the warm, dry summer months of resources. Farmers that reached their allocated
linkages increase this to ~9.4% (Quantec 2017). December to February, during which urban and limit have had (and will continue to have) their
Furthermore, agriculture and agro-processing are Economic impact of the drought on WC agricultural water use increase. water supply cut off, with the Lower and Upper
responsible for 18% of all formal employment agriculture Berg River areas cut off from irrigation access to
opportunities in the province. SA is ranked the 30th driest country in the world. In 2015 the Western Cape experienced a drought, the Berg River in early February 2018.This is likely
As such, water scarcity possess a great risk to the first of three consecutive years of dry winters to have a significant impact on crop yields and
The WC dominates much of SA’s agricultural export agricultural production and growth of the economy, brought on by the El Niño weather pattern and output in 2017/2018.
production. The province’s agricultural sector especially when a natural disaster exacerbates climate change. Overall rainfall in 2017 was the
operates in a unique climate compared to rest of scarcity. This is evident for users reliant on the lowest since 1933 and significantly lower than At the time of writing (March 2018), the reductions
the country and this Mediterranean winter-rainfall Western Cape Water Supply System (WCWSS). the long-term average. This has severely affected in water consumption by the CoCT and WCWSS
region produces fruits and wines that are mainly During a non-drought year, most water from the dryland production, resulting in record losses in users appear to be sufficient to avoid reaching “Day
destined for high-value export markets. As shown WCWSS is consumed by the City of Cape Town wheat production for the 2017/18 season from 1.1 Zero” in 20186. Agricultural water consumption is
in Table 1 below, eight of the top ten products (CoCT), followed by the agriculture sector for million tonnes in 2017 to 586 800 tonnes in 2018. expected to drop further as the sector reaches its
exported from the WC are fresh or processed irrigation purposes. The system also supplies some This decline has resulted in a R2.4 billion loss in allocations. The CoCT has also received 10 billion
agricultural products (Quantec 2017). water to towns in the Overberg, Boland, West income to the grain sector, while overall income litres of water reallocated from the Groenland
Coast and Swartland areas in the WC. losses in the grain industry amounted to R2.8 Water Users Association in Elgin and Grabouw. This
billion (WCDoA 2018). substantial contribution has added an additional
20 days to the City's supply.
Table 1: Top 10 products exported by the Western Cape in 2016 In response to the resulting water shortages, the
Source: Quantec 2017 WC agricultural sector’s water allocation, since the The persistent drought conditions have effectively
start of 2018, has been cut by more than 60%, and highlighted the need for increased resource
in some cases such as the Lower Olifants River by efficiency. Water efficiency technologies in
Ranking Ranking Value Avg growth up to 86%. particular are crucial to the agriculture sector. The
(R million) (% 2012-2016) business case for water efficiency in agriculture and
This, and previous allocation restrictions (~30%), its key role in driving greentech uptake is discussed
1 Refined petroleum oils and oils obtained from bituminous minerals 13 897 8.66%
resulted in the production decreases for the in Section 2.4.1.
2 Citrus, fresh or dried 10 099 0.89% following major commodities in the 2017/18
3 Wine 9 320 -2.51% season compared to the 2016/17 season (WCDoA
2018):
4 Apples, pears and quinces, fresh 6 970 3.54%
5 Grapes, fresh or dried 6 163 1.85% ■■ Wine grapes (20%)
6 Flat-roll products of iron or non-alloy steel, of a width of 600 mm 2 570 4 624.29% ■■ Table grapes (18.1%)
or more ■■ Pome fruit (8.7%)
7 Fruit juices 2 277 4.41% ■■ Stone fruit (8.2%)
■■ Citrus (7.7%)
8 Fruit, nuts and other edible parts of plants 2 273 -1.07%
■■ Major vegetables4 (20.2%)
9 Cigars 1 818 16.17%
10 Fish fillets and other fish meat 1 650 2.65%
Total 121 089 2.27%
4 Potatoes, Onions, Butternut, Pumpkin, Carrots, Cabbage
5 For more information, please see section 3 of this report, which gives a detailed overview of policies and regulations.
6 Day Zero will be declared when the water level of the City's major dams reaches 13.5%. When this occurs, municipal water supplies will be largely switched off,
and residents will rely on water collection points around the city to collect a daily ration of 25 litres of water per person.
5 Sustainable Agriculture: Market Intelligence Report 2018 Sustainable Agriculture: Market Intelligence Report 2018 62.3. Key players
As shown in Table 2, key players in the agriculture ■■ Labour organisations provide support for 2.4.1. Water scarcity as a driver for greentech Large-scale augmented water supply has been slow
sector can be divided into seven broad categories: employees in the agricultural sector by assisting uptake in agriculture to come online and deliver in the drought crisis. As a
government, producers, research/academia, input them in attaining the best possible financial and SA has an average annual rainfall of 470 mm, compared result, municipalities have remained reliant on the bulk
suppliers, technology suppliers and service providers, social benefits in all employment positions along to the world average rainfall of 857 mm. Water is the infrastructure that services the entire region, limiting
industry associations, and labour organisations. the entire value chain. key limiting factor to agriculture growth in SA (WWF the overall available water supply. In response to the
SA’s national Department of Agriculture, Forestry 2010). Water supply and efficiency is, and will continue water shortage, farmers are diversifying water supply
and Fisheries (DAFF) governs the whole industry. Table 2 shows a simplified value chain with key role to be, a driver for greentech uptake, particularly in the sources and investing in small-scale water supply
players involved. A detailed list of role players can be WC, which is currently in a severe drought. systems and water demand management.
■■ Government provides support through various found in the 2017 Agriculture MIR7.
initiatives, including research, practical infield Many farmers in the WC rely on surface water and Water supply
assistance, market development, regulatory 2.4. Drivers of green technologies and associated bulk water infrastructure. The table below As desalination is not currently economically viable
development and monitoring and financial support. shows water availability for the four major catchments for farmers, with costs at >R40/kl water, farmers have
approaches in agriculture in the WC as at October 2017. It indicates that the increasingly sought to access groundwater. Although
The key drivers of greentech and innovation in the
Producers/farmers produce commodities and current demand for water is higher than the supply of this drought-buffered resource has been important to
■■ agriculture sector include7:
largely do their own harvesting, storage and transport. surface water. sustain farmers (to some extent), it is acknowledged
that it needs to be collectively and carefully managed.
■■ rising input costs for energy (particularly Future water availability remains uncertain, particularly
■■ Academic research institutes investigate all electricity and diesel), fertiliser and pesticides; as climate change predictions suggest that the Water demand management
aspects of the value chain. scarce natural resources (particularly arable land
■■
province will experience9: Many farmers have been proactive in conserving
and water) that are primarily affected by climate
Production input suppliers provide production water. Common on-farm water saving practices are:
■■ and farming practices; ■■ more frequent severe weather events;
inputs such as fertiliser, seeds, pesticides and detrimental environmental effects associated
■■
■■ increases in temperature in many regions and installing monitoring systems, e.g. soil
biological control agents. with conventional (i.e. traditional) inputs and
■■
resulting changes in precipitation patterns; moisture probes;
practices, pollution and soil degradation, which ■■ more flooding events resulting in less infiltration installing water-efficient irrigation systems,
Technology suppliers and service providers are
■■
■■ leads to lower production yields, loss of arable and recharge of ground water; and e.g. drip irrigation;
found across the value chain, i.e. inputs, production, land and reduced resilience; ■■ population increases of 30% in the next ■■ introducing measures to retain soil moisture and
processing, logistics and waste processing. They climate change, which exacerbates water scarcity
■■
15 years. reduce evaporation, e.g. uptake of mulching
include machinery and greentech suppliers, such as through increasing evaporation and occurrences and use of netting systems.
solar photovoltaic (PV) manufacturers, and precision of droughts; It is estimated that by 2050 rainfall is likely to
agriculture services, such as drone data analyses. market pressure through increasing consumer
■■ have decreased by 30% in the WC. Thus, the WC In addition to these interventions, the drought has
demand for sustainable products, driving stricter cannot rely on surface water alone. It is crucial to forced farmers to consider irrigation trade-offs,
■■ Industry associations are involved in all aspects of regulations, particularly for chemical usage; develop alternative sources such as water reuse and e.g. only irrigating orchards that will result in the
the value chain. They support farmers and provide decreasing costs of greentech such groundwater10, and to reduce water demand.
■■
highest income, or removing blossoms and less
them with relevant and reliable information regarding as solar panels. productive trees.
regulations, logistics, cultivar development, etc. They
also do or support research in various fields, including
soil, water, production practices and cultivars.
Table 3: Water availability in the Western Cape (million m3 per year)
Source: WCDoA (2017)
Table 2: Key role players in agriculture
Water Natural Ecological Yield Irrigation Other use Total use Balance
Management MAR8 Reserve use
R&D Inputs Production Harvesting Storage Transport Processing Wholesale, Waste
Area
retail &
exports Gouritz 1 679 325 275 254 84 338 -63
Government Olifants / 1 108 156 335 356 17 373 -35
Doorn
Producers
Breede 2 472 217 668 576 56 632 36
Research institutions
Berg 1 429 217 678 301 403 704 -26
Production input suppliers
Technology suppliers & service providers
Industry associations
Labour organisations
8 MAR: Mean Annual Runoff
7 Refer to the 2017 Agriculture MIR for a more detailed discussion of the drivers of green technology and innovation in agriculture. 9 According to studies done by the Western Cape Department of Agriculture
Available at www.greencape.co.za/market-intelligence 10 For more information see GreenCape’s Water MIR available from the GreenCape website (www.greencape.co.za)
7 Sustainable Agriculture: Market Intelligence Report 2018 Sustainable Agriculture: Market Intelligence Report 2018 8Table 4: Potential costs and savings associated with the application of satellite farming12
The business case for water efficiency ■■ conservation agriculture, which improves
Monetary and other benefits related to improved soil health, allowing for better water-holding Source: WCDoA (2015)
on-farm water efficiency are highlighted in the figure capacity and infiltration, improving yields of rain-
Crop Cost saving per hectare
below. fed grains; and
■■ certain ICT applications (precision agriculture), Wine grapes R4 130
These benefits drive the demand for the uptake of which improve irrigation efficiency. Table grapes R23 590
greentech that improve water efficiencies. Water Deciduous fruit trees R25 160
efficiency will always be an extremely (if not the These are discussed in detail in Section 4.
most) important factor to consider when one invests
in greentech in SA agriculture. For updates on Precision agriculture11 in particular can reduce
2.5. Support available in the Western Cape to develop the sector and support investors;
water efficiency related opportunities, see the 2018 inputs, and thus input costs. By using satellite including farmers, agri-businesses and other
An enabling environment increases technology
GreenCape Water MIR, which focuses on opportunities imagery, for example, farmers can reduce water use role players in the WC. More information on the
uptake and supports the growth of agriculture
stemming from the drought in the province. by at least 10%. This in turn has reduced energy support environment for investment in the WC can
and related sectors. The table below summarises
costs, which are often significant as it requires less be found in Section 6 of this report.
the programmes, initiatives and tools available
In agriculture, water and cost savings are driving water to be pumped for irrigation. Further evidence
a number of greentech opportunities, including: for this is shown in Table 4 overleaf, which highlights Table 5: Support for Western Cape agriculture
the expected benefits per hectare for different
■■ practices and systems to decrease water crops, assuming a 10% increase in yield and a 10% Programme / initiative / tool Purpose
use for irrigated crops, resulting in reduced reduction in the cost of water, fuel, fertiliser and
Research and Development Programme – WCDoA provides support in six districts of the Western Cape through timely and
electricity use and costs; chemicals. The savings sharply contrast with the
Western Cape Department of Agriculture relevant research and development (R&D) services. This ensures agricultural role play-
■■ controlled environment agriculture, low cost of Fruitlook, an open access satellite-based (WCDoA) ers are provided with the most advanced scientific and technical advice. WCDoA can
which can save up to 95% water compared to portal that supports precision agriculture, at R150 collaborate with international partners to explore opportunities and develop local
per hectare. innovative solutions.
conventional open systems;
LandCare Programme (WCDoA) A main function of the programme is to ensure that the national Conservation of
Agricultural Resources Act (CARA: Act 43 of 1983) is executed. Through regulations
Less Pumping, Less More Money in Bank Better Yield & Fewer Input Increased Plant Performance under this Act, public funds can be used to subsidise land users for specific conserva-
Maintenance on tion work and can incentivise multi-sectoral partnerships.
Equipment
Fewer Pests & SmartAgri Initiative (WCDoA & UCT) SmartAgri has provided a road map for actionable and prioritised initiatives that
Saving on will direct the agricultural sector towards greater resilience in the face of climate
Water Bill Diseases
Better Quality Foods challenges. It is committed to six priority projects to catalyse the early adoption of
important climate change response interventions with high impact. These include:
Saving on Better Management of Fewer Chemicals ■■ driving the uptake of conservation agriculture;
Energy Cost - Drought Required ■■ restoring ecological infrastructure;
less pumping Improved Soil Health ■■ enabling collaborative integrated catchment management;
Smaller Carbon ■■ supporting improved energy efficiency and uptake of renewable energy;
Footprint
Saving water ■■ climate-proofing the growth of agri-processing in the WC; and
Fewer Actions ■■ providing climate-smart agricultural extension services.
on the farm Required
Healither Root Zones
Smaller Water Less water Withdrawn GreenAgri (WCDoA & GreenCape) GreenAgri is an updated, curated, one-stop online information portal for all farmers,
More Responsible
Farmers
footprint from ecosystem researchers, private and non-governmental agencies interested in smart agricultural
practices, initiatives and research.
Less Leaching Better Quality FruitLook (WCDoA) FruitLook provides relevant and timeous satellite-based information to the fruit and
More Water Irrigation Water
Marketing Edge of Nutrients wine production sectors to help increase water use efficiency.
CapeFarmMapper (WCDoA) CapeFarmMapper is an online mapping tool designed to assist with spatial infor-
Less Fertiliser Less Polloution Better Quality Water Larger Biodiversity
mation queries and decision making in the fields of agriculture and environmental
More Money in Bank Required of Ground Water management.
Western Cape AgriStats (WCDoA) AgriStats is a tool providing aggregated summaries of the 2013 WC Agricultural
Commodity and Infrastructure Census. These statistics are disaggregated per local
Better Water Quality Healthier Ecosystem
in Dams & Rivers
municipality. Information categories include agri-tourism, crops, infrastructure and
livestock.
Carbon Footprint Calculator (Blue North) The Confronting Climate Change (CCC) initiative is a carbon footprinting project. It
was developed to support the SA fruit and wine sectors to identify and respond to
Figure 2: Benefits of saving water on farm the risks and opportunities associated with carbon emissions.
More information on the programmes can be found on the GreenAgri portal13 and the WCDoA web page14.
12 Derived from Fruitlook, an open-web portal for fruit and wine grape growers, provided by the Western Cape Department of Agriculture (WCDoA), to assist
11 Precision agriculture involves the observation, impact assessment and timely strategic response to fine-scale variation in causative components of an agricultural irrigators with optimising water use.
production process. This farming-management concept is based on observing and measuring spatial and temporal characteristics of a number of crop variables. 13 www.greenagri.org.za/
The goal of precision agriculture is to have a management strategy that results in optimisation of returns on inputs, while preserving resources. 14 www.elsenburg.com/
9 Sustainable Agriculture: Market Intelligence Report 2018 Sustainable Agriculture: Market Intelligence Report 2018 10Copyright © Western Cape Department of Agriculture 11 Sustainable Agriculture: Market Intelligence Report 2018 Sustainable Agriculture: Market Intelligence Report 2018 12
3–
Policies and regulations Table 6: Selected acts and plans relevant to the agricultural sector
Name Relevant objectives/purpose
With South Africa’s extensive and diverse agriculture sector The Conservation of Agricultural ■■ Use of natural agricultural resources
comprising various commodities and stakeholders, there is a Resources Act 43 of 1983 (CARA ■■ Conservation of soil
range of policies and regulations that directly and indirectly 1983) ■■ Conservation of water sources
Combating weeds and invader plants
affect the development of the sector. ■■
The National Development Plan ■■ Elimination of poverty
2030 (NDP 2012) ■■ Reduction of inequality
■■ Highlighting the importance of agriculture to the green economy
Many of these have specific relevance to the Part of the strategy to achieve this is the enforcement The Agriculture Integrated Growth ■■ Plans to develop equitable, productive, competitive, profitable and
sustainability of the sector, as they aim to protect of a carbon tax, encouraging all sectors and activities, and Development Plan (IGDP 2012) sustainable agriculture, forestry and fisheries sectors
natural resources such as land and water. They are including agriculture, to adopt mitigation strategies17. ■■ Emphasises that the sector needs to benefit all South Africans
also relevant to investors, greentech suppliers and It is determined that the carbon tax would lead to an The Agricultural Policy Action Plan ■■ A programmatic response to key policy documents, including the
service providers as they guide the developmental estimated decrease in emissions of 13 - 14.5% and (APAP 2014) National Development Plan (NDP) and the New Growth Path (NGP)
pathway of the agricultural sector. 26 - 33% by 2035, compared with business-as-usual
The Medium Strategic Framework ■■ Outcome 4 – Decent Employment through Inclusive Growth
(National Treasury 2017). The Paris Agreement comes
(MTSF 2014-2019) ■■ Outcome 7 – Comprehensive Rural Development and Food Security
3.1. Agriculture policies and regulations into operation in 2020. ■■ Outcome 10 – Environmental Assets and Natural Resources Protected
The national Department of Agriculture, Forestry and Continually Enhanced
and Fisheries (DAFF) and the national Department of Background
Strategic Plan for the Department ■■ Provides an effective framework to address various challenges facing
Environmental Affairs (DEA)15 are primarily responsible The national Department of Environmental Affairs the sector
of Agriculture, Forestry and Fisher-
for legislation related to the agricultural sector. Table (DEA) has developed a Mitigation, Reporting and ies (DAFF 2013) ■■ Sets targets for the departmental programmes from 2012 to 2017
6 summarises the relevant acts and policy documents. Verification (MRV) strategy as well as baselines ■■ Focuses on building a leading, dynamic, united, prosperous and
towards 2050 for the agriculture, forestry and other people-centred sector
More information on key policies and legislation land uses sector (Agri SA 2017). This does not only
The Spatial Planning and Land Use ■■ Provides for a uniform, effective and comprehensive system of spatial
is provided on the GreenAgri portal16 under Action provide guidance for GHG reduction by the sector, Management Act (SPLUMA 2013) planning and land use management for South Africa
Plans and Policies and the Green Compliance Tool. but also forms the foundation for developing the ■■ Provides for sustainable and efficient use of land
proposed carbon tax and offset schemes. ■■ Redresses the imbalances of the past and ensures equity in the application
The Green Compliance Tool, funded by the of spatial development planning and land use management systems
WCDoA, was developed in 2017 with the aim to Updates and implications National Environmental Manage- ■■ NEMA is the overarching legislative framework for environmental
simplify key legislative processes. The tool provides The Second Draft Carbon Tax Bill was issued for public ment Act 107 of 1998 (NEMA 1998) governance
information on processes, timelines and key contacts comment on 15 December 2017 and is expected to ■■ Core values are reflected through the following principles:
for environmental impact assessments (EIAs), be formally tabled in Parliament in mid-2018. In the ■■ Environmental management must place people and their needs at
application for water use licences, the water use budget speech on 22 February 2018, the Minister of the forefront of its concern, and serve their physical, psychological,
validation and verification (V&V) process, disaster Finance announced the date of implementation of developmental, cultural and social interests equitably
■■ Development must be environmentally, socially and economically
and risk management processes and conservation of the carbon tax to be 1 January 2019. A grace period
sustainable
agriculture resources (CARA). will be given to companies to comply with the law and
bring their emissions down, with the first set of taxes National Environmental Manage- ■■ Provides for the management and conservation of biodiversity within
to take effect in January 2020. The implementation ment Biodiversity Act 10 of 2004 the framework of NEMA
3.1.1. Carbon tax
(NEMBA 2004) National protection of species and ecosystems that warrant national
The South African Government is committed to will be accompanied by a package of tax incentives ■■
protection
reducing greenhouse gas (GHG) emissions by 34% and revenue recycling measures. ■■ Sustainable use of indigenous biological resources
and 42% below its business-as-usual growth trajectory ■■ Fair and equitable sharing of benefits arising from bioprospecting
by 2020 and 2025 respectively (National Climate Apart from the forestry sector where plantations and involving indigenous biological resources
Change Response Policy 2011). South Africa ratified natural forests exceed 100 ha, agriculture, forestry ■■ Establishment and functions of a South African National Biodiversity
the Paris Agreement in November 2016 and endorsed and other land use and waste sectors will be exempt Institute (SANBI)
its nationally determined contribution (NDC) requiring from direct GHG emissions taxation during phase
that SA’s greenhouse gas emissions peak in 2020 to one (2020 to 2022), but will be indirectly taxed for
2025, plateau for the period from 2025 to 2035 and energy and fuel use. Although there are uncertainties
decline from 2036 onwards (National Treasury 2017). post 2022 or after phase one, taxation of direct GHG
15 DEA is specifically involved in EIAs, natural resource protection (e.g. wetlands) and legislation on invasive species.
16 www.greenagri.org.za/
17 A breakdown of the carbon tax system is provided in the Second Draft Carbon Tax Bill of 2017.
13 Sustainable Agriculture: Market Intelligence Report 2018 Sustainable Agriculture: Market Intelligence Report 2018 14emissions from the agriculture, forestry and other land Updates to regulations and implications The V&V for the Breede-Gouritz WMA is being
uses sector is expected to apply only to farms and for agriculture finalised, while the V&V for the Berg-Olifants area
enterprises that exceed 100 000 tonnes of carbon Agriculture will be exempt There have been two major updates: is underway. Any water use not part of the ELU
dioxide equivalent (CO2eq) per year (Agri SA 2017). (determined from the V&V) will be considered
from direct GHG emissions
This threshold is comparatively high, which suggests Water restrictions: In response to the unauthorised, except where a water use licence
that very few agricultural enterprises will be taxed taxation during phase one ■■
has since been obtained or a general authorisation
drought, the national Department of Water
through the direct GHG emissions route. However, (2020 to 2022), but will be and Sanitation (DWS) has curtailed agricultural applies. The V&V project requires a signed application
they will experience the knock-on effects of the tax on indirectly taxed for energy water use by 60% in the WC, with the extent of form for each property.
other sectors, e.g. those associated with agricultural and fuel use. the restrictions varying per region (DWS 2018).
inputs and logistics. In addition, the DWS curtailed groundwater The GreenAgri portal21 provides more information
resources for agricultural water use by 60% in on the water use V&V process under the Green
Large-scale carbon sequestration and storage the Berg-Olifants and Breede-Gouritz Water Compliance Tool.
projects may provide opportunities for the sector18. Table 7: Main water-related legislation Management Areas (WMA) (DWS 2017a). As
Several local institutions are actively trying to unlock water is a key input to agriculture and the critical 3.1.3. Land reform
this opportunity, but to date there have been few factor constraining future growth, restrictions on The White Paper on South African Land Policy (1997)
successes. Among others, the correct policy and Name Selected objective / its use have a significant impact on the sector. addresses the injustices and land inequalities that
financing tools (incentives / offset schemes) would be purpose came about during colonialism and apartheid. As the
needed. Further information on the carbon tax and Measurement, recording and reporting of 2017 Agriculture MIR identified, this has had some
National Water Act 36 of Redefines water rights ■■
its potential implications for the agriculture sector can 1998 (NWA) in SA to stimulate water consumption: On 17 February 2017 the implications for investors in the agricultural sector,
be found in ‘Implications of a carbon tax and offset inclusive growth. DWS, in terms of Section 26 of the National particularly uncertainty over land rights and fears of
system for Agriculture in South Africa’19 presented by Water Act, required ‘the taking of water for unconstitutional land expropriation.
Agri SA (2017). Water Services Act 108 Defines the role of the
of 1997 (WSA) national government irrigation purposes [to] be measured, recorded
and reported’ (DWS 2017b). The regulation In response, several support strategies have been put
as a regulator, the role
3.1.2. Water of water boards as bulk specifies the requirements and procedures for in place over the past few decades to ensure successful
There were several new regulatory developments providers, and the role measuring the irrigation water extracted from all transition of land under land reform. New landowners
for water and its use in 2017 that have ultimately of municipalities as water sources. receive support in the form of infrastructure, inputs,
driven the need for improved water management. service providers. extension services and training. Various policies have
Table 7 provides an overview of some of the main The National Water Assists in the Agricultural producers had to comply with the new been introduced, including the Land Redistribution
acts regulating the water sector, with the 2017 Resource Strategy 2 of implementation regulations at very short notice. However, as the for Agricultural Development (LRAD) programme, the
regulatory developments discussed thereafter. For 2013 (NWRS2) of the NWA while Irrigation Boards (IB) or Water User Agency (WUA) Settlement Production Land Acquisition Grant (SPLAG),
more information on water legislation and regulation, protecting, developing act as the controlling authorities, the institutional and the Proactive Land Acquisition Strategy (PLAS).
refer to the 2018 Water MIR20. and controlling
structures and infrastructure are in place to some
water resources in On 27 February 2018, the SA parliament passed a
a sustainable and extent to facilitate compliance. By monitoring water
meters, the IB and WUA are in a position to exercise motion to look at the feasibility of amending Section
equitable manner.
control over water abstraction, although monitoring 25 of the Constitution, also known as the ‘property
of irrigators abstracting directly from river and ground clause’, to allow for land expropriation without
water sources remains a great challenge (Keuck 2017). compensation. There is much speculation around
This has resulted in access to irrigation water being the approach to implementation; however, the
cut in some areas, specifically the Berg River area, in government has assured that the approach (which is
February 2018. still to be decided upon at the time of writing) will
safeguard food security and the continued growth
The DWS is continuing the roll-out of the water use of the economy and agricultural production sector.
validation and verification (V&V) project. The V&V Government leaders have insisted that farming
project determines existing lawful use (ELU) to which activities and investment should continue as normal.
each property was entitled under the old Act (pre-
1998) and to determine each property’s entitlement More information is available from the Department of
under the NWA of 1998. All industrial and commercial Rural Development and Land Reform23.
water users, including those in the agricultural sector,
are expected to verify their water use.
18 The Agri SA Commodity Chamber has recommended that agricultural enterprises that exceed the emissions threshold should be allowed to offset their emissions
by submitting carbon storage / sequestration inventories. 21 http://www.greenagri.org.za/
19 https://goo.gl/iapXKM 22 https://goo.gl/uAd8J9
20 www.greencape.co.za/market-intelligence/ 23 http://www.drdlr.gov.za/
15 Sustainable Agriculture: Market Intelligence Report 2018 Sustainable Agriculture: Market Intelligence Report 2018 16Industrial, commercial and
agricultural water users are
required to verify their water
3.2. Investment policies and regulations
use to determine their existing There are several key policies and regulations of direct
lawful use (ELU). Any water use relevance to investors in SA. Detailed information
not part of the ELU, and not can be obtained from Wesgro, the official tourism,
corroborated by a water licence trade and investment promotion agency for the WC.
or general authorisation, will be Wesgro has developed a document, Doing Business
in South Africa24, which includes information on
deemed unauthorised.
corporate tax rates and access to finance.
In 2016/17 Wesgro developed an Invest in Cape
Town25 report that provides key insights for investment
3.1.4. Initiatives promoting sustainable in Cape Town and the WC. The report contains
production information on the WC’s support for agro-processing
In 2017, the deciduous fruit industry signed the through Project Khulisa, a WC government initiative
Bee and Pollination Charter. This agreement that supports the economic sectors in the province
prevents producers from spraying pesticides while that are growing the fastest and have the potential to
bees are active. The charter also requires chemical create job opportunities, of which agro-processing is
representatives to provide products with clear one. It also highlights key interventions to promote
instructions to producers. This is a positive move by the sector, including a focus on halal exports,
the agro-chemical industry to help protect the bee increasing exports of wine and brandy, and improving
population. local capacity to process agricultural produce.
24 https://goo.gl/7TyJV9
25 https://goo.gl/xVbM9F
Copyright © Bruce Sutherland, City of Cape Town
17 Sustainable Agriculture: Market Intelligence Report 2018 Sustainable Agriculture: Market Intelligence Report 2018 18You can also read