THE FUTURE OF ELDERCARE ON NANTUCKET - SK Advisors & Rabig Consulting 3/23/2016
←
→
Page content transcription
If your browser does not render page correctly, please read the page content below
T HE F UTURE           OF    E LDERCARE   ON
N ANTUCKET

SK Advisors & Rabig Consulting
3/23/2016

                                               1|Page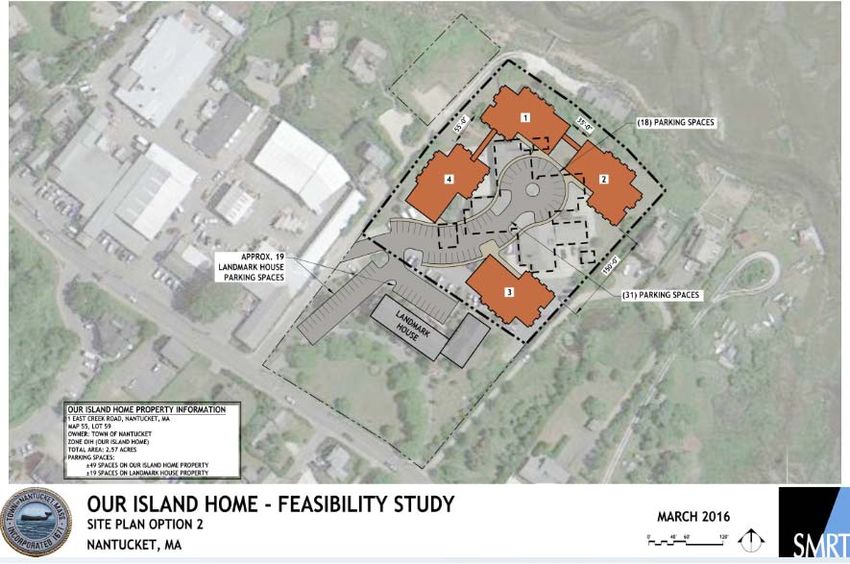
The Future of Eldercare on Nantucket

ABSTRACT

This report provides a detailed analysis of the various factors which will affect decision-making
regarding Our Island Home. It includes consideration of trends in long-term care, public policy,
islands demographics, Island service provision system, the opinions of stakeholders, and financial
analysis of the various options.

The conclusion of the report is that the best option for the citizens of the town of Nantucket is the
construction of a new facility in the small house model of care on a new site. The recommended
size is a total of 40 beds, 30 designated as the long-term care and 10 as affordable assisted-living.

                                                                                           2|Page
TABLE OF CONTENTS

I.     Introduction
       Consulting Team ..................................................................................................................... 6

       Scope of Work ......................................................................................................................... 7

       Consulting Approach ............................................................................................................. 8

II.    Macro Trends & Considerations
       Trends in Long-Term Care .................................................................................................. 10

       Reimbursement Trends ........................................................................................................ 12

       Public Policy & Regulatory Trends .................................................................................... 14

       The Resident Experience – Culture Change ..................................................................... 17

III.   Our Island Home Analysis
       Site Visit Participants & Materials Reviewed ................................................................... 21

       Market Dynamics.................................................................................................................. 25

       Analysis of Operation .......................................................................................................... 53

            1. Physical Plant ........................................................................................................... 53
            2. Resident Interviews ................................................................................................. 53

            3. Satisfaction Measures .............................................................................................. 58

            4. Staffing Patterns ....................................................................................................... 59

            5. Clinical Quality Measures ...................................................................................... 60

            6. Center for Medicare and Medicaid Services, Quality Ratings .......................... 65

            7. Quality of Life and Culture Change ..................................................................... 66
       Analysis of Admissions and Community Resources ...................................................... 69

       Analysis of Current Financials............................................................................................ 70

       Olmstead and Right Sizing.................................................................................................. 80
       White Box Scenarios ............................................................................................................. 81

                                                                                                                                              3|Page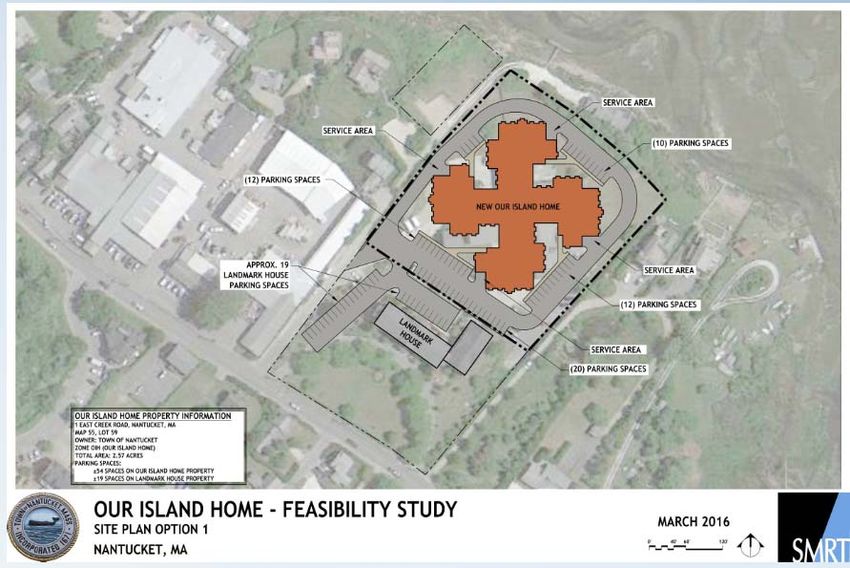
Analysis of Replacement Scenarios ........................................................................................
1. Maintain The Status Quo .............................................................................................. 82
2. Renovate The Existing Building ................................................................................... 83
3. Sale to Outside Entity before or after Rebuild ........................................................... 84
4. Construction of Traditional Nursing Home at Existing Site or New Site .............. 85
5. Construction at Existing Site ........................................................................................ 86
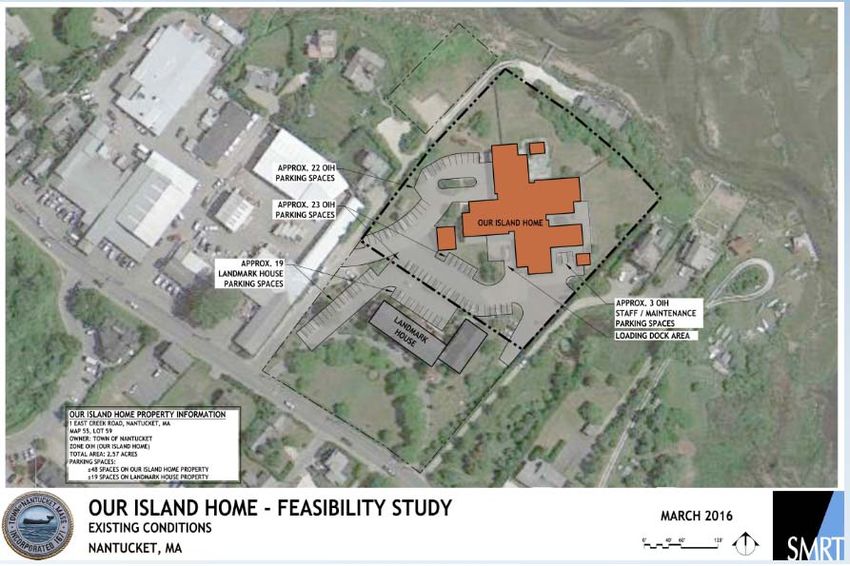
6. Construction of The Small House Nursing Home/Assisted-Living with Services at
Sherburne Common ...................................................................................................... 91
7. Additional Recommendations ..................................................................................... 96
4|Page
I.   INTRODUCTION

                    5|Page
CONSULTING TEAM

  Toby Shea and Michael Kivov, SK Advisors, have a combination of deep expertise in the
  disciplines of Strategy and Capital. Toby has over 20 years of experience in the senior living
  field as a commercial banker, investment banker, and CFO for a multi‐property senior care
  provider. Michael has nearly 20 years of experience focused on developing successful
  market and positioning strategy. Mike is considered to be the industry leader in assisting
  clients in developing strategies that improve performance and better meet the needs of
  current and future residents. Through this combination of strategy and capital, SK provides
  its clients with a more integrated and comprehensive approach to problem solving and
  execution.

  Jude Rabig, Principal, Rabig Consulting is a Registered Nurse, gerontologist, who holds a
  PhD in gerontology and a business certificate from Stanford School of Business. She is a
  nationally recognized leader, change agent and strategist who has a deep understanding of
  organizational change and its application to long term care. Since 2001 she has partnered
  with over 35 organizations to design lead change initiatives.

  Toby Shea                       Mike Kivov                    Jude Rabig, RN, PhD
  tshea@skadvisors.net            mkivov@skadvisors.net         juderabig@gmail.com

                                                                                      6|Page
SCOPE OF WORK
The Request for Qualifications (RFQ) issued by SMRT on December 21, 2015 requested
an examination of the following issues as part of an expanded evaluation of the future
for Our Island Home (OIH):
1. Current State Assessment
Medicare/Medicaid Pro-Forma
Staffing Assessment
Program Assessment
Care Model Assessment
Resident Experience
2. Future State Options
Demographic Projections including Bed Needs for Special Populations
including Skilled Nursing, Geri-Psych, Memory Care, Special Needs
(Including Bariatric)
3. Care Models
Medical/Institutional
“Small House”
Blended models
Staffing Models
Culture Change Programs
4. Resident Experience
5. Opportunities and constraints established by the Commonwealth of
Massachusetts nursing home licensing and certification that will impact care
model, staffing ratios, unit size etc.
a. Specific Massachusetts State Requirements for Medicaid and Medicare
reimbursement
6. Financial Pro-Forma for options identified
7. Other Considerations
Consideration of the viability of partnering with Sherburne Commons
Consideration of the feasibility/advisability of bringing in an outside
private operator
Consideration of expanding home health programs on the island to
provide community members support in their homes rather than
moving them at OIH
7|Page
CONSULTING APPROACH
The SK Advisors and Rabig Consulting team utilized the project approach White Box
Thinking. This approach promotes an examination of all possibilities within the
boundaries of a problem solving space. Potential solutions are placed in the white box
and analyzed individually. This assures that no idea is eliminated before an analysis is
conducted. The parameters of white box thinking in long-term care include the resident
experience, the financial constraints, the regulatory and legal limitations and the
philosophy of the sponsoring organization. The analysis also incorporates consideration
of the larger environment.

Thus, the analysis of the Our Island Home project included consideration of the island of
Nantucket and the strengths and challenges it presents.

                                                                              8|Page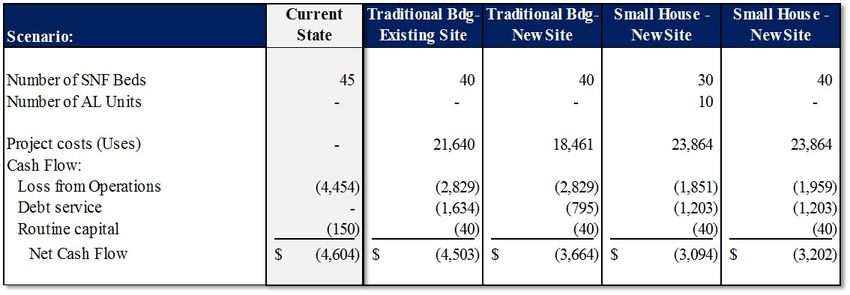
II. MACRO TRENDS & CONSIDERATIONS

                             9|Page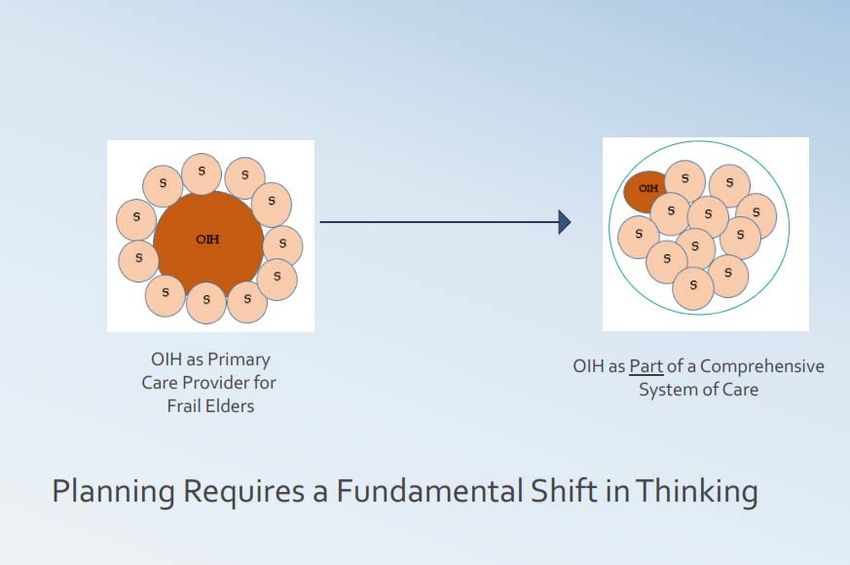
TRENDS IN LONG TERM CARE
Long Term Care (LTC) refers to a broad range of supportive services needed by people
who have limitations in their capacity for self-care because of a physical, cognitive, or
mental disability or condition. A person’s need for LTC is generally measured,
irrespective of age and diagnosis, by functional status through measurement of his or
her inability to perform basic activities necessary to live independently and by the need
for assistance from another person to carry out these activities. These ADLs include
bathing, transferring, toileting, and dressing, and incidental activities to daily living
(IADLs), which include cooking, housekeeping, transportation, and managing finances.
Long-term care can be provided informally or formally in a variety of settings.
A key question for consideration in planning for changes at Our Island Home is: How
many people on Nantucket will need care in 2030? There is not a simple answer to this
question in the year 2016. Reliance on straight demographic projections would point to
an increased need for nursing home beds, yet other factors need to be considered. Since
the mid-1980s, there has been a concern that increased longevity and the aging of the
Baby Boom generation will result not only in a larger elderly population, but also in an
increased prevalence of disability. Increased survival could mean more years of
disability and higher long term care and other medical costs if medical interventions are
able to prolong life, but not health and independence. However recent findings have
provided evidence to the contrary. These studies suggest that there has been a decrease
in the prevalence of disability among the elderly, an increase in disability-free life
expectancy and a decrease in physical limitations such as lifting 10 pounds, walking
short distances, and climbing a flight of stairs, which are related to onset of disability.1 If
efforts at healthy aging and improvements in medical care for chronic conditions
continue to be successful and the total number of frail elders who need formal services
in a community in 2030 could be quite similar to the number in 2000, even though the
number of elders will more than double.

Even if the aggregate number of frail elders stays the same or grows slowly, formal care
capacity must be better structured at the community level. Most communities rely

1 Kickman& Snell. The 2030 Problem: Caring For Aging Baby Boomers, Health Services
Research 37(4):849-84 · August 2002

                                                                                  10 | P a g e
heavily on nursing homes as the source of long term care. Sixty-seven cents of every
public dollar supporting long-term care for the elderly is spent on institutional care2
despite the clear preferences of frail elders for services in the community. This mismatch
of dollars versus preferences happens in part because nursing homes are seen as the
long-term care “safety net”. This overreliance on nursing homes—what some people call
an “unbalanced” long-term care system is financially unsustainable and this financial
strain has prompted policymakers to rethink the balance between nursing home services
and community-based services. This is evidenced by new funding for Medicaid assisted
living and community based services, an expansion of incentives for purchase of long
term care insurance and programs that support family caregivers. The challenge over
the next decade is to develop new approaches to delivering community-based care.
Home care, using a range of unskilled to highly skilled workers, represents the
dominant type of community-based care. But, this service type, relying on a one-on-one
model, is expensive and creates challenges. Congregate models such as adult day
services and housing-based services that can use one caregiver to assist more than one
elder at a time, need to become more prevalent. Utilization of technology including
health monitoring and telehealth visits and other emerging technologies might increase
the ability to care for individuals in their homes. The current trend is for collaborative
interagency planning to foster and increase the types of community based support
available and to reserve institutional care for the frailest.
2 Congressional Budget Office 1999
11 | P a g eREIMBURSEMENT TRENDS
WHO PAYS FOR LTC
There are a variety of payers in the long term care arena. The charts below illustrate the
programs and their proportion of spending.
WHAT
SOURCE WHO QUALIFIES LTC SERVICES ARE
COVERED
Medicaid Income based Nursing home care and
Medicaid is a joint federal and spend down of resources is personal care services
state program that helps with expected community programs vary
medical costs for some people from state to state
Medicare People who are 65 or older, Post Hospital care:
Medicare is the federal health certain younger people with Skilled nursing home for 1-
insurance program disabilities & people with 100 days after a qualifying
End-Stage Renal Disease hospital stay – must need
skilled service not just ADL
support
Out of Pocket Those with resources to All systems accept private
Payment by self or family for cover expensed funds
services
Long Term Care Insurance Privately purchased Community care
Nursing home care
Administration on Over 65 Nutrition
Aging/Administration for Qualifications vary by Transportation
Community Living program In home care
Caregiver support
Veterans Administration Some veterans and their Some nursing home care
wives/widows
12 | P a g eINFORMAL AND FAMILY CAREGIVERS
The value of services provided by informal caregivers has steadily increased over the last
decade, with an estimated economic value of $470 billion in 2013, up from $450 billion in
2009 and $375 billion in 2007. 3 At $470 billion in 2013, the value of unpaid caregiving
exceeded the value of paid home care and total Medicaid spending in the same year. The
federal government has introduced programs to provide support to caregivers which has
assisted in the increased value.
3 AARP Public Policy Institute. Valuing the Invaluable: 2015 Update.
13 | P a g ePUBLIC POLICY & REGULATORY TRENDS
OLMSTEAD: COMMUNITY FIRST
On June 22, 1999, the United States Supreme Court held in Olmstead v. L.C. that
unjustified segregation of persons with disabilities constitutes discrimination in
violation of title II of the Americans with Disabilities Act. The Court held that public
entities must provide community-based services to persons with disabilities when (1)
such services are appropriate; (2) the affected persons do not oppose community-
based treatment; and (3) community-based services can be reasonably accommodated,
taking into account the resources available to the public entity and the needs of others
who are receiving disability services from the entity.
The Supreme Court explained that its holding "reflects two evident judgments." First,
"institutional placement of persons who can handle and benefit from community
settings perpetuates unwarranted assumptions that persons so isolated are incapable of
or unworthy of participating in community life." Second, "confinement in an institution
severely diminishes the everyday life activities of individuals, including family relations,
social contacts, work options, economic independence, educational advancement, and
cultural enrichment." Further the Court directed all states to create a plan for managing
the maximization of community alternatives to institutionalization. The overall purpose
of an Olmstead Plan is to maximize the extent to which elders and people with
disabilities are able to live successfully in their homes and communities. In
Massachusetts, this effort has been named Community First.4 The vision of Community
First is:
Empower and support people with disabilities and elders to live with dignity and
independence in the community by expanding, strengthening, and integrating systems of
community-based long-term supports that are person-centered, high in quality and provide
optimal choice.
4The Community First Olmstead Plan accessed 3/2 at:
http://www.mass.gov/eohhs/docs/eohhs/olmstead/olmstead-plan.pdf
14 | P a g eThe Goals of Community First
The overarching purpose of the Massachusetts Olmstead Plan is to maximize the
extent to which elders and people with disabilities are able to live successfully in their
homes and communities. Six goals provide the framework for achieving that vision:
1. Help individuals transition from institutional care.
2. Expand access to community-based long-term supports.
3. Improve the capacity and quality of community-based long-term supports.
4. Expand access to affordable and accessible housing and supports.
5. Promote employment of persons with disabilities and elders.
6. Promote awareness of long-term supports.
The overarching significance of this plan to the skilled nursing facility is that the
creation and availability of more community-based services and additional funding
for the services will move the nursing home from the core provider of services to a
smaller part of a more comprehensive system of services which will provide support
and care for older adults in the future, as shown in the chart below.
15 | P a g eThe trend towards community based services and away from nursing home services is
illustrated in the graph below, and continues to shift with latest 2014 figures indicating a
46% utilization of funding for long-term care beds.
16 | P a g eRESIDENT EXPERIENCE – CULTURE CHANGE
The quality history of nursing homes has been beleaguered since its inception. The early
problems were primarily life safety issues such as fire hazards and sanitary conditions.
Once these were under control, attention then morphed into focusing on quality of life
issues such as physical restraint, abuse, inadequate nutrition and poor clinical care.
Many of these problems remain: the industry is struggling with quality concerns such as
core restraints, psychotropic medications, unexplained weight loss, skin breakdown,
and the triad of quality of life problems; loneliness, helplessness and boredom. The
various attempts to address these issues have coalesced into a movement named culture
change. Various early interventions included modest adjustments of the operating model
and met with modest success. In 2000 a total reinvention of the nursing home was
envisioned and operationalized. Initially named the Green House®, this model of care
transitions from an institutional model of care which prices efficiency sameness and
policy and procedure into the paradigm of home where the architecture care patterns
and rhythms of life represent the patterns one would find in home. The model requires a
holistic reinvention, new policies and procedures, empowerment of line staff, person
centered care, which involves the resident in all decision-making, and outcomes-based
management. The model was created using an analysis of the literature in long-term
care and the literature of organizational development. Funded by the Robert Wood
Johnson Foundation and piloted in Tupelo, Mississippi the implementation was
carefully followed by Dr. Rosalie Kane and her research team from the University of
Minnesota. A video of the project can be seen at:
https://www.youtube.com/watch?v=l4Ap1ByNgKE . This research demonstrated strong
outcome improvements. The Green House model has become a registered trademarked
model of care which has tightly prescribed implementation guidelines, and now belongs
to a larger model of care, known as the small house model of care. The small house
implementation is similar to the greenhouse model. However, it affords providers
flexibility and implementation. There are over 200 operating small houses in the country
and an estimated 180 to 210 in development, and an unknown number of small house
like implementations. In addition to its research demonstrated improved outcomes, the
small house model of care has greatly influenced the long-term care industry. The
implementation of person centered care is becoming more widespread and it is very rare
to find a new nursing home building that is being constructed in the old institutional
hospital like model. In addition to the research outcomes listed below, the Alzheimer’s
foundation has named the small house a preferred model of care for those with memory
impairment5.
5Excellence in Design: Optimal Living Space for People With Alzheimer’s Disease and
Related Dementias. Accessed at:
http://www.alzfdn.org/documents/ExcellenceinDesign_Report.pdf
17 | P a g eResearch 6 has demonstrated improvement in resident, family, and staff experience,
summarized below:
Resident
Improvement in 7 domains of Quality of Life
o Privacy
o Dignity
o Meaningful activity
o Strength of relationship
o Autonomy
o Food enjoyment
o Individuality
Improved Quality of Care
o Elders maintain self-care abilities - longer
o Less depression
o Less boredom
o Less loss of appetite and weight loss
Higher direct care time: 21 to 31 minutes more per resident per day in staff time spent on
direct activities.
Increased engagement with others: more than a fourfold increase in staff time spent
engaging with elders outside of direct care activities.
Earlier identification of change in condition related to consistent staffing and highs staff
to resident ratios.
Staff
Direct care staff report less job-related stress.
Stabilized projects show decrease in staff turnover, and overtime costs.
Decrease in work-related repetitive stress injuries//workers compensation costs.
6Kane & Cutler JAGS, 2007
Kane & Cutler Health Care Financing Review, 2009
Sharkey et al JAGS, 2011
Jenkens, Sult, Senior Housing Journal, 2011
Bowers & Nolet, University of Wisconsin, 2009
18 | P a g eFamilies
Improved satisfaction with resident care.
Improve relationships with caregivers.
Financials
Cost neutral or improved operational costs.
Lower capital costs related to building size and common space decreases.
19 | P a g eIII. OUR ISLAND HOME ANALYSIS
20 | P a g eSITE VISIT PARTICIPANTS & MATERIALS REVIEWED
In conducting our analysis, it was important for the Consulting Team to consider all
available materials and conduct interviews with key stakeholders, including residents of
Our Island Home. While on-site, the team conducted interviews with many different
individuals and groups. During our analysis, we reviewed several documents and
artifacts that have been written on the future of Our Island Home. The following serves
to document the individuals and groups that were interviewed by the team, as well as
the various materials that were reviewed and considered.
Interviews were conducted by phone or in person with the following:
Nantucket Government
Libby Gibson, Town Manager
Brian Turbitt, Financial Director
Rick Atherton, Board of Selectmen
Bobby DeCosta, Board of Selectmen
Dawn Hill-Holdgate Board of Selectmen
Tobias Glidden Board of Selectmen
Matt Fee Board of Selectmen
Jim Kelly, Finance Committee
Our Island Home Leadership Staff (focus group)
Rachel Chretien - Administrator
Gail Ellis - Director of Nursing
Heather Francis, Staff Development Coordinator
Taylor Hilst, Activities
Susan Balester, Business Office
Deb Bechtold, Dietician
Karen Correia, Food Supervisor
Edward King, Plant Supervisor
Erin Kopecki, Assistant Administrator
Others
Peter MacKay, Social Worker, Cottage Hospital
Peter Morrison, Demographer
David Worth, President, Sherburne Commons
Melissa Philbrick Board of Directors, Sherburne Commons
Chuck Gifford, Executive Director Sherburne Commons
Sherri Hunt, Director, Case Manager, Elder Services of Cape Cod
Phil Stambaugh, Capital Program Committee
21 | P a g eFocus Groups
Focus groups were held with the following:
Direct Care Staff
Family Members
OIH Leadership Team Members
Resident Interviews
One-on-one resident interviews were conducted with 10 residents 4 males and 6
females. There were 16 questions which were a mix of yes and no and open ended
questions. Residents were selected by the Nursing Home Administrator who did not see
the survey tool in advance of the selection. A random selection process was not used
because of the challenges of survey when individuals have cognitive verbal or hearing
issues. The Administrator was asked to select residents who were able to be
interviewed, i.e. they have the cognitive ability to comprehend and answer questions,
had speech and verbal skills that allow them to answer questions and had adequate
hearing skills. 10 residents represent a sample size of 22% which is an adequate sample
size. Interviews were conducted in a private space. Residents were told that their
answers would be recorded on paper, and reported but not associated with their
individual names. The list of questions, along with a summary of the responses, can be
found on page 53.
Materials Reviewed
Reports
Our Island Home Management Report Lanzikos 1996
Annual Report to the Residence at Sherburne Commons, 2015
Our Island Home Board of Selectmen Meeting SMRT Presentation, October 2015
Nantucket Community Health Needs Assessment and Implementation Plan
Nantucket Cottage Hospital, 2015
Our Island Home Work Group Presentation to the Board of Selectmen, July 2013
Our Island Home’s Future – a Future Demographic Perspective, Peter Morrison,
December 2015
22 | P a g eMaterials Reviewed (cont’d)
Operating Reports
OIH Organizational Chart 2016
OIH Nursing Administration Job Descriptions
OIH Staffing Lists, Staffing and Rooms and Schedules
Massachusetts DPH Survey Reports
Massachusetts DPH Life Safety Survey Reports
Census & Case Mix Reports
Clinical Reports
Pharmacy Quarterly Reports
Harmony Consulting Reports
Infection Control Policies
Pain Management Policies
MMQ (care intensity) Scores
Financial Reports
FY2017 Budget Reports
Annual and Interim Operating Statements (“Enterprise Update Reports”)
Payor Source data
Census Reports
Medicaid Rate Certification Letter
Medicare RUG Rates
OIH Cost Reports
OIH Staffing Reports
23 | P a g eMaterials Reviewed (cont’d)
Concerned Individuals
Report prepared by Friends of Our Island Home relating to meeting of family members
held March 5, 2016
The opinions of concerned citizens were reviewed at the websites:
Change.org: https://www.change.org/p/nantucket-board-of-selectmen-our-seniors-
need-a-view-keep-our-island-home-where-it-is
Friends of Our Island Home: http://www.friendsofourislandhome.org/
Our Island Home: http://www.nantucket-ma.gov/157/Our-Island-Home
24 | P a g eMARKET DYNAMICS
This section provides a summary of the key market dynamics impacting Our Island
Home (and other long-term and post-acute care on the island). This includes for distinct
sub-sections on Demographics, Competitive Environment, and Demand, before
concluding with our observations and key takeaways. In addition to nursing care, the
competition and demand analyses focus on other products and levels of care—including
assisted living, specialized dementia care, and adult day care—in order to assess
alternative opportunities available to Our Island Home. While this is not intended to be
a comprehensive market analysis, we believe that an understanding of the
demographics, competitive factors, and demand in the local market area is critical to
both ascertaining likely root causes of the challenges at Our Island Home and assessing
its future outlook, as well as devising strategies and initiatives for solving for the future,
and in particular enhancing occupancy and revenue.
Demographics
This section examines in detail the demographics of the defined primary market area—
which is Nantucket Island—for Our Island Home. Demographic data features 2015
estimates and five-year future projections (2020). The estimates and projections are
developed by Nielsen Claritas, one of the country’s largest demographers. Nielsen
Claritas demographic data utilizes the US Census 2010 as its base and then applies
proprietary interpolations and adjustments. We note that in recent years Nielsen
Claritas has condensed some of its data reporting and does not provide the same level of
detail and specificity by age and income cohorts as it used to going back to 2009.
Consequently, where appropriate, we have performed some independent interpolations
as necessary to extend the level of detail and precision provided in the data and to
develop certain data points as necessary for our analysis and also develop population
and household projections for 2016.
Population and Household Trends
Population and household data and trends exhibit most notably that the market area is
small; as of 2015 there is an estimated total year-round population on the island of only
approximately 10,600 persons. There is some growth occurring, and in particular strong
growth projected in older adult age cohorts. Overall, the market is relatively affluent,
although our understanding of the island is that averages can be somewhat deceptive, as
there are many high-income households that push up indicators of wealth, but at the
same time the island also has a sizeable lower to moderate income and working class
25 | P a g epopulation. Table 1 shows population trends and Table 2 displays household trends in
the market area.
Key data and findings for Table 1 are summarized below.
The total population in the primary market area in the current year (interpolated
for 2016) is estimated to be approximately 10,680 persons.
The total population will increase nominally by approximately 500 persons over
the next five years through 2020 (0.9% per annum).
The total population age 65 and older in the market area, in the current year, is
approximately 1,600, comprising 15.0% of the total population. This is in line
with the corresponding national concentration of the 65+ population of 14.9%
(per the latest Census Bureau national projections).
The 75+ population in the market area is estimated at nearly 640 in the current
year, comprising 6.0% of the total population. This is somewhat lower (5%) than
the corresponding national concentration of the 75+ population of 6.3%.
The 65+ population is projected to grow by 4.8% per annum over the next five
years to a projected total of 1,890 by 2020.
The 75+ population is projected to increase by 3.2% per annum through 2020 to a
projected total of approximately 720.
The strongest projected growth by percentage is in the 65 to 74 age cohort (5.8%
per annum).
Of note, there is strong growth projected over the next five years in the 75 to 84
age cohort at 4.5% per annum, after experiencing more modest growth (2.4% per
annum) from 2010 through 2014. This largely mirrors national trends. As is the
case in the market area, across the country the 75 to 84 age segment has been
showing limited to modest growth in most markets (and even contracting in
some) due to the birth dearth that occurred nationally coming out of the Great
Depression. From 2015 through 2020, however, growth in the 75 to 84 age cohort
nationally is projected to accelerate significantly, increasing to over 3% per
annum.
26 | P a g eTable 1
Older Adult Population by Age and Year
Our Island Home Market Area
Population 2010 2016 2020 % Annual Change
# % of Total # % of Total # % of Total (2010‐2015) (2015‐2020)
Total 10,172 100.0% 10,680 100.0% 11,070 100.0% 0.8% 0.9%
55 to 64 1,285 12.6% 1,493 14.0% 1,574 14.2% 2.9% 1.4%
65 to 74 692 6.8% 961 9.0% 1,173 10.6% 6.2% 5.8%
75 to 84 373 3.7% 436 4.1% 511 4.6% 2.4% 4.5%
85+ 162 1.6% 202 1.9% 206 1.9% 4.8% 0.5%
55+ 2,512 24.7% 3,092 29.0% 3,464 31.3% 3.9% 3.1%
65+ 1,227 12.1% 1,599 15.0% 1,890 17.1% 4.9% 4.8%
75+ 535 5.3% 638 6.0% 717 6.5% 3.1% 3.2%
Key data and findings for Table 2 are summarized below.
There are approximately 4,420 households in the market area in the current year
(interpolated to 2016).
Similar to population, there will be some growth in the number of households in
the market over the next five years, increasing by 0.8% per annum.
There are approximately 1,250 households age 65 and older in the market area,
comprising 28.3% of all households. The number of 65+ households is projected
to increase by 4.8% per annum over the next five years, adding approximately 50
such households each year.
There are just over 500 households age 75 and older in the market area,
comprising 11.4% of all households. The number of 75+ households is projected
to increase by 3.4% per annum through 2020, adding approximately 15 such
households annually.
As with the population data, the strongest growth amongst older adult
households is projected in the 65 to 74 age cohort (5.9% per annum). Also similar
to population trends, the 75 to 84 age cohort is projected to significantly
accelerate its growth through 2020 (4.7% per annum), mirroring national trends.
Table 2
Older Adult Households by Age and Year
Our Island Home Market Area
Households 2000 2016 2020 % Annual Change
# % of Total # % of Total # % of Total (2010‐2015) (2015‐2020)
Total 3,701 100.0% 4,421 100.0% 4,570 100.0% 1.2% 0.8%
55 to 64 468 12.6% 907 20.5% 952 20.8% 6.1% 1.3%
65 to 74 322 8.7% 747 16.9% 747 16.3% 5.3% 5.9%
75 to 84 255 6.9% 371 8.4% 371 8.1% 1.2% 4.7%
85+ 70 1.9% 131 3.0% 131 2.9% 5.5% 0.5%
55+ 1,115 30.1% 2,156 48.8% 2,201 48.2% 4.7% 3.1%
65+ 647 17.5% 1,249 28.3% 1,249 27.3% 3.7% 4.8%
75+ 325 8.8% 502 11.4% 502 11.0% 2.1% 3.4%
27 | P a g eHousehold Composition
The following displays the relationship between households and population in the
market area by age group. As shown in Table 3, the headship ratio in the market is 0.41,
meaning that there are 0.41 households per person. This is equivalent to an average
household size of 2.41 persons per household. In most markets, as households age,
household size typically becomes smaller (and thus the headship ratio increases)
although often the 85+ age cohort has a larger household size than other senior age
cohorts; this pattern holds true in the market area as well. On aggregate, the headship
ratio for a household age 75+ in the market area is 0.69 (a household size of 1.44
persons).
Table 3
2015 Headship Ratios
Our Island Home Market Area
Age HHs Pop. HH Size Ratio
Total 4,384 10,583 2.41 0.41
65 to 74 577 908 1.57 0.64
75 to 84 301 417 1.39 0.72
85+ 128 201 1.57 0.64
75+ 429 618 1.44 0.69
The market area is disproportionately weighted towards renters compared to national
standards. Approximately 58% of households in the market area are homeowners,
compared to two-thirds of all households across the country. As shown in Table 4,
homeownership actually is much higher among older adult households than it is among
the overall population. Overall, the homeownership rate for households age 75 and
older is 70%.
Table 4
Household Tenure
Our Island Home Market Area
Age Owner Renter Total
# % # % # %
All Households 2,559 58.4% 1,825 41.6% 4,384 100.0%
55‐64 663 74.0% 233 26.0% 896 100.0%
65‐74 485 84.1% 92 15.9% 577 100.0%
75‐84 224 74.4% 77 25.6% 301 100.0%
85+ 78 60.9% 50 39.1% 128 100.0%
75+ 302 70.4% 127 29.6% 429 100.0%
28 | P a g eHousehold Income
The following examines older adult households by income within the market area. The
data shows that on the whole, older adult households in the market are relatively
affluent. Table 5 and Table 6 display 65+ and 75+ households in the market by income,
respectively; Table 7 displays the median income by age cohort.
Key findings for Table 5 are summarized below:
Of the approximately 1,000 households age 65 and older in the market (in 2015),
just over three-fifths have incomes in excess of $35,000, 48% are estimated to
have incomes in excess of $50,000, and approximately 36% are estimated to have
incomes in excess of $75,000.
The number of age 65 and older households with incomes in excess of $50,000
will increase by 180 over the next five years to approximately 650 by 2020,
representing 53% of all 65 and older households. This represents an increase of
7.5% per annum.
The number of age 65 and older households with incomes in excess of $75,000
will increase by 130 to over 490 by 2020, representing 39% of all 65+ households.
This represents an increase of 7.5% per annum.
Table 5
Households 65+ by Income
Our Island Home Market Area
Income 2000 2015 2020 % Annual Change
# % # % # % (2000‐2015) (2015‐2020) Additionally, it is estimated that 103 households (nearly one-quarter) have
incomes in excess of $75,000.
The number of age 75 and older households with incomes in excess of $50,000
will increase by 46 to approximately 190 by 2020, representing 38% of all 75 and
older households. This represents an increase of 6.4%, or 9 households per
annum.
Table 6
Households 75+ by Income
Our Island Home Market Area
Income 2000 2015 2020 % Annual Change
# % # % # % (2000‐2015) (2015‐2020)Table 7
Median Household Income of Older Adult Households by Age
Our Island Home Market Area
Age 2000 2015 2020 % Annual Change
(2000‐2015) (2015‐2020)
All Households $56,539 $84,710 $86,308 3.3% 0.4%
55 to 64 $59,043 $90,827 $95,000 3.6% 0.9%
65 to 74 $31,667 $64,482 $70,943 6.9% 2.0%
75 to 84 $40,054 $37,602 $40,395 ‐0.4% 1.5%
85+ $27,500 $26,000 $30,227 ‐0.4% 3.3%
Home Value
Nielsen Claritas provides current year estimates and future year projections of home
value. This data is based on US Census data and interpolated and adjusted by Nielsen
Claritas. It is not considered as reliable or valid of an indicator of home values/prices in
a market as is actual sales data. We note, however, that it can be a good indicator of
relative value or affluence of one area as compared to another.
The Nielsen Claritas home value data displayed in Table 8 shows that home values on
the island are extremely high (which in fact creates a significant housing affordability
issue). The estimated median home value across the market in the current year (2015) is
approximately $980,000. This is an increase of 68% since the year 2000, which takes into
account the significant gains in the residential real estate values experienced in the early
to mid 2000s then tempered for the pullback in values and struggles of the home market
in the past few years. The median value in the market is projected to remain essentially
static through 2020, increasing just 1% over this time.
We note that this data was not available by age cohort or for older adults. In our
experience, however, home values for the older adult population tend to be higher than
those for the overall population as many homeowners in these age cohorts have bought
up over the years. Older adults also as a rule will have significantly more equity in their
homes than younger homeowners.
31 | P a g eTable 8
Home Value Distribution (Census Data)
Our Island Home Market Area
2000 2015 2020 2014‐2019 Growth
Home Values # % # % # % Period Per Annum Sherburne Commons is the largest senior living and long-term care provider on
the island, with 38 independent living residences (18 apartments in a main
building and 20 cottages) and a 14-unit assisted living component. The
community also has a wing that previously operated as an eight-bed specialized
dementia care unit which has been taken off line (the space is presently being
rented to physicians as medical offices.). Sherburne Commons has had a
somewhat checkered history, with underperformance that has led to multiple
changes in ownership. It is presently owned and operated by a locally-based
non-profit organization specifically formed for the expressed purposes of taking
over the facility, which it acquired from a real estate investment group that was
the previous owner. Thus, Sherburne Commons is a small, single-site operation.
Performance has been improving, bringing the facility from the brink of default
to a somewhat more stable (but still stressed and somewhat precarious) financial
and operating position. At present, 25 of the 38 independent living units are
resident-occupied (three other cottages reportedly are rented by the hospital) and
just 6 of the 14 assisted living units are occupied. (And as noted, the dementia
unit did not succeed, reportedly never having more than one occupant at any
given time.) Occupancy peaked at one point at 75%, but the community has
never stabilized since opening.
The product itself presents decently. Architecturally, it is in line with the
preferred look on the island and has decent curb appeal. The entrance opens into
a comfortable and inviting reception area and lobby, and interior décor overall is
comfortable. Common areas and amenities are limited for independent living,
but actually represent a decent allocation given the small number of residences.
There is a main dining room which is attractive though traditional, as well as a
casual café with a fireplace and large dining table, and a small library space
within it. On the second floor around the landing above the main stairwell is a
larger library space and a game room. Not surprisingly (given the small size of
the community), wellness spaces are lacking: there is only a very small (perhaps
100 square feet) fitness room with a few machines. Residences are relatively
spacious, and feature contemporary, open design and floor plans, with nine-foot
ceilings on the ground floor (eight-foot on the second floor). In-unit features and
finishes are relatively basic (laminate counters, builder grade carpeting, etc.)
The assisted living unit has its own distinct (and cozy) dining room and also a
country kitchen, as well as a generously sized great room (that functions for
activities/programming, exercise, and therapy). Assisted living resident rooms
are a plus, consisting primarily of small one-bedroom units with a kitchenette, as
well as a few two-bedroom units. They have decent size closets and full baths
with walk-in showers.
33 | P a g e Nantucket Cottage Hospital, which as the only hospital on the island is the
dominant referral source for Our Island Home, in many ways also is its most
direct competitor. This is due to the fact that the hospital has a swing bed unit
that provides therapy and rehabilitation to patients discharged from the acute
care beds in the hospital (or other hospitals on the mainland). Consequently, it is
serving a market segment that otherwise would be served within Our Island
Home: rehabilitation patients. Unfortunately for Our Island Home, this market
segment is primarily Medicare beneficiaries and is usually quite lucrative. In
fact, Medicare-funded rehabilitation often generates profit margin at most
nursing facilities that offsets the deficits typically resulting from Medicaid
patients. Thus, the hospital has encroached on Our Island Home’s market share,
and in particular its most lucrative market share. Unquestionably, this has been
adversely impacting the financial performance of Our Island Home.
Importantly, the hospital’s focus on this market segment ensures that it will
receive the most desirable rehab discharges and renders it highly unlikely that
Our Island Home can expand into this arena and increase census and revenues
from Medicare beneficiaries. Simply put, the hospital essentially meets this
demand and precludes Our Island Home’s opportunity to serve this segment.
Cottage Hospital is essentially a tertiary acute care facility. Among the specialty
services it provides include cardiovascular, emergency, oncology, and
radiology/imaging, and as noted has a skilled nursing bed sub-provider unit.
According to data available on the American Hospital Directory online
(www.ahd.com), Cottage Hospital has 19 certified beds. In the fiscal year ending
September 2014, the hospital reported 429 discharges and approximately $57
million in total patient revenue. The average length of stay was 3.8 days and the
average daily census was just 4.5 persons. The ahd.com data exhibits that the
swing beds accounted for 510 patient days, all of which were Medicare.
Demand
This analysis focuses on the quantitative analysis and measures of demand in the market
first for assisted living, then following this for specialized Dementia/Alzheimer’s care
(with sensitivity to test for demand for low acuity care more appropriate for an adult
day services setting as well as more moderate to higher acuity care typically placed
within a licensed assisted living setting), and finally for long-term nursing care. This
process tests the depth in the market and its capacity to support existing product, and
also tests for the capacity to support additional inventory such as an expansion or even a
new facility.
34 | P a g eMarket Rate Assisted Living Demand
We conducted quantitative measures of the defined market area’s capacity to support
private pay (market rate) assisted living beds in the market. In the methodology for
calculating demand for assisted living beds market penetration rates and project capture
rates are the major indicators of the depth of demand, or lack thereof. There are two
primary differences between demand for independent senior housing products and
assisted living analyses: 1) assisted living demand is based upon persons, as opposed to
households, and 2) age- and income-qualified demand is factored through an additional
screen to take into account ‘need’ or ‘frailty’. The application of a need-based
qualification screen reflects the fact that assisted living is a need driven, long-term care
product. The core of the assisted living concept is that residents have difficulty in
performing activities of daily living (including eating, bathing, toileting, ambulating,
and transferring) and require assistance from a caregiver to perform these activities.
Thus the target market for assisted living services is all age-, income-, and need-qualified
persons within the market.
We conduct the analysis for the current year (2016). Reflecting the relatively strong
incomes in the market and to provide a conservative picture of demand, we define the
minimum income for qualification in the market as $60,000. It is generally accepted that
a household would be willing to spend as much as 80% to 90% of its income on the fee
for an assisted living bed given the vast array of care and services provided. Based on
this assumption, a monthly fee of approximately $4,000 to $4,500 would be affordable to
a household with an income of $60,000.
We note, however, that our analysis does not include any allocation for spend down of
assets to supplement assisted living costs—which is a reality amongst a significant
number of residents—nor does it include potential contributions from family members,
which also is a factor in reality. Therefore, we believe that setting $60,000 as the
minimum income qualification for the market creates a realistic but at the same time
appropriately conservative definition of the age- and income-qualified market.
The need qualification factor that we employ is extremely conservative. We utilize data
from a survey by the US Census Bureau updated in 2004 that depicts limitation with
activities of daily living (ADLs) by age cohort and by severity of limitation (with
categories for no limitation, with an instrumental activity of daily living only, limitation
with 1-2 ADLs, and limitation with 3-5 ADLs). Our standard assisted living
methodology utilizes limitation with 3-5 ADLs as predictive for need for assisted living
care. This approach is conservative in that it yields a relatively high acuity target
market. We believe, however, that it is most reflective of what the assisted living
product has evolved into: a need-driven, formal caregiving setting that effectively has
replaced the traditional private pay long-term care nursing home. Our reasoning is
based on the following factors:
35 | P a g e1) It is well established that prospects do not want to move into assisted living
facilities and will remain at home as long as possible before needing to move to a
facility.
2) In most professionally managed facilities a significant number of residents have
recently suffered a catastrophic event that required hospitalization, and many in
fact are direct discharges from acute care or subacute care facilities. This
underscores the need-driven nature of assisted living and that many prospects
have numerous health complications and are relatively high acuity.
3) The rise of assisted living has been in part to the detriment of nursing homes,
many of which have experienced encroachment into their traditional private pay
long-term care market share by assisted living facilities.
4) Length of stay in assisted living facilities across the country is only
approximately two years, another sign of the high acuity of residents at move-in.
5) Persons with need for assistance with 1 or 2 ADLs are better able to have their
care needs met in informal care settings such as through a family caregiver or
even through adult day and also home health services, as well as many group
homes and “mom and pop” care homes. Screening out these lower acuity
individuals attempts to remove from the potential pool of competitive
alternatives these informal caregiving settings.
Our market penetration analysis for the $60,000+ income scenario is presented in Table
9. The bullet points that follow summarize the steps and findings of this analysis.
Based on interpolation, and broken down by age cohort, we estimate that there
are 135 age- and income-qualified households (age 75 or older with incomes
greater than $60,000) in the market area in 2016.
To convert age- and income-qualified households into persons, we apply the
household size, or ratio of population (persons) to households within a given age
cohort throughout the market. After applying the persons per household ratios
we estimate that there are 193 persons in age- and income-qualified households
in the market.
We then apply the need qualification factor. The US Census Bureau data
indicates that 9.7% of the population age 75 to 84 has a limitation with 3 to 5
ADLs and 28.6% of the population age 85 and older has a limitation with 3 to 5
ADLs. Applying the need screen yields a total age, income, and need qualified
target market (assisted living bed need) of 28 persons.
We then account for competitive supply. Based on our competitive analysis we
estimate that there are 14 existing assisted living beds in the market, all of which
are located at Sherburne Commons.
36 | P a g e There are no known planned additions to the supply within the market area.
Subtracting out the 14 competitive beds within the market from the total assisted
living bed need of 28 produces the net demand or surplus of demand over
supply. The result in the market area is a modest net demand of 14 beds.
The 14 total beds competing in the market equates to a market penetration rate
of approximately 50% of the total assisted living demand of 28 persons. This
actually is right in line with our typical target for a healthy competitive market of
under 50%. (That being the case, this usually applies to markets with a larger
need and that are more developed with inventory, in which the penetration rate
is measuring the combined inventory of a number of properties and not just one
provider.)
In a typical project capture (or supportable beds) calculation we subtract out the
existing competitive beds in the market from the qualified target market to leave
the unserved target market. In this market this leaves an unserved target market
(net bed demand) of just 14 persons.
Since we do not have a specific community or number of beds for which we are
testing, we conduct a supportable beds analysis rather than a traditional project
capture analysis. This assumes a capture rate of the unserved qualified market
(or market share) that should be achievable and calculates the number of
supportable residences based on the capture assumptions. In this analysis we
also include for projected in-migration of residents from outside the market and
adjust for stabilized occupancy at the subject. As Nantucket is an island, we do
not believe it is realistic to assume any significant in-migration, although there
will invariably be some move-ins that come from outside the market due to the
presence of adult children/family in the area or some other factor. (In support of
this assessment, we understand that three of the occupied residences at
Sherburne Commons are households that moved in from outside of Nantucket.)
Consequently, we assume that 90% of residents would come from within the
defined market and that just 10% would be the result of in-migration. (In a more
typical market, in-migration often accounts for 25% to 35% of move-ins.) We also
assume a stabilized occupancy of 92% based on current national trends and
underwriting standards.
In our experience, any given project generally has the capacity to capture
approximately 15% of the available qualified target market. Again, this is typical
of a more developed market with competitive alternatives. For Nantucket island
and its “captive” population, a much larger market share or capture rate seems
reasonable and achievable, perhaps 50% of the unserved market or more.
37 | P a g e If we assume that any assisted living beds would be in addition to those already
in existence at Sherburne Commons, there is very limited demand remaining in
the market. Even assuming that a new facility would capture 50% of the
unserved market of 14 persons, and taking into account some modest in-
migration, the market could support only approximately eight beds at another
facility.
We also conducted sensitivity analysis to test for demand overall for the island,
irrespective of the beds already at Sherburne Commons. The supportable beds
analysis displays that assuming a typical capture rate of 15% the unserved target
market of 28 persons could support approximately only 5 beds at a given project.
Again, typical capture rates for mainland markets likely are not valid indicators
of demand on any island (including Nantucket). Assuming a likely more valid
50% capture rate, the market could support approximately 17 beds of assisted
living at any one community. This is similar in size (in fact a few beds larger)
than the assisted living unit at Sherburne Commons that the community has
struggled to fill. By some arguments, even more than 50% of the total demand
could be captured by a provider with a strong product and program, and an
appealing value position. This analysis is displayed in Table 10.
38 | P a g eTable 9
2016 Assisted Living Demand
Net Demand & Market Penetration Analysis
Our Island Home Market Area
Household Income Qualification
Age Households Income Age/Income
$60,000+ Qualified HHs
75‐84 315 33.2% 105
85+ 129 23.7% 30
Total 444 30.5% 135
Conversion of Households to Persons
Age/Income Persons Per
Age Qualified HHs Household Qualified Persons
75‐84 105 1.39 145
85+ 30 1.57 48
Total 135 1.43 193
Assisted Living Need Qualification
Assisted Care
Age Qualified Persons Need AL Demand
75‐84 145 9.7% 14
85+ 48 28.6% 14
Total 193 14.4% 28
Total Assisted Living Bed Need 28
Competitive Supply
Existing Beds 14
Planned Beds 0
Subject Existing Beds 0
Total Assisted Living Bed Supply 14
Net Bed Demand (Surplus) 14
Market Penetration Rate 50.4%
39 | P a g eTable 10
2016 Assisted Living Demand
Supportable Beds Analysis
Our Island Home Market Area
Capture Rate Calculation
Total Unserved Market 28
Achievable Project Capture Rate 50.0%
Supportable Beds at Project from Market 14
Stabilized Occupancy 92.0%
Market Draw 90.0%
Total Supportable Beds in Market 17
Low Income (Medicaid) Assisted Living Demand
We also conduct the same assisted living demand calculation specifically targeted to the
low income population that represents potential Medicaid beneficiaries and could in
theory be served by an assisted living program sponsored by a Medicaid-funded Home
and Community-Based Services Waiver or similar program. This program has proven
to be viable in Massachusetts and could represent an option to be considered at Our
Island Home (and on the island in general).
The approach is exactly the same as the market rate assisted living demand calculation.
The difference is that we apply an income ceiling rather than a minimum income. For
the purposes of this analysis we assume a maximum household income of $25,000; thus
the target market is comprised of all individuals age 75 and older from households with
incomes of less than $25,000 and with need for assistance with activities of daily living,
as defined in the market rate examination.
The result of this calculation is a determination of a total low income (Medicaid) assisted
living bed need of 41 persons, as exhibited in Table 11. In our experience, demand for
such care significantly outweighs potential supply in most markets and there is typically
a sizeable unserved population. Furthermore, it is realistic for a facility with low income
targeted beds to capture a significant portion of the available target market and capture
rates are much higher than for market rate assisted living (due to the lack of viable and
comparable alternatives in most markets). Given the unique situation on Nantucket, it
does not seem unreasonable for a facility to meet most of this available demand and
capture more than 50% of the available market share. Consequently, we conclude that a
facility readily could fill approximately 20 beds of low income targeted assisted living
(and likely more).
40 | P a g eYou can also read