The capacity of existing end markets in Australian jurisdictions
←
→
Page content transcription
If your browser does not render page correctly, please read the page content below
The capacity of existing C&D waste end-markets in Australian jurisdictions

The capacity of existing end markets in
Australian jurisdictions

Research Report 2
Authors
Tayyab Maqsood
Salman Shooshtarian
Peter SP Wong
Malik Khalfan
Rebecca J Yang

SBEnrc P1.75 Creation and Stimulation of End-Markets for Construction and Demolition Waste

Date: February 2021
ACKNOWLEDGEMENTS
This research has been developed with funding and support provided by Australia's Sustainable Built
Environment National Research Centre (SBEnrc) and its partners.

Core Members of SBEnrc include BGC Australia, Government of Western Australia, Queensland
Government, Curtin University, Griffith University and RMIT University.

Core Partners: This research would not have been possible without the ongoing support of our core
industry, government, and research partners:

Project Leader: Tayyab Maqsood, RMIT University

Researchers:
Salman Shooshtarian, RMIT University
Peter Wong, RMIT University
Malik Khalfan, RMIT University
Rebecca Yang, RMIT University
Tim Ryley, Griffith University
Savindi Caldera, Griffith University

Citation: Maqsood, T., Shooshtarian, S., Wong, P., Khalfan M., Yang R. (2021) The capacity of existing
end markets in Australian jurisdictions. SBEnrc 1.75 - Creation and Stimulation of End-Markets for
Construction and Demolition Waste. https://sbenrc.com.au/research-programs/1-75/

                                                                                                    2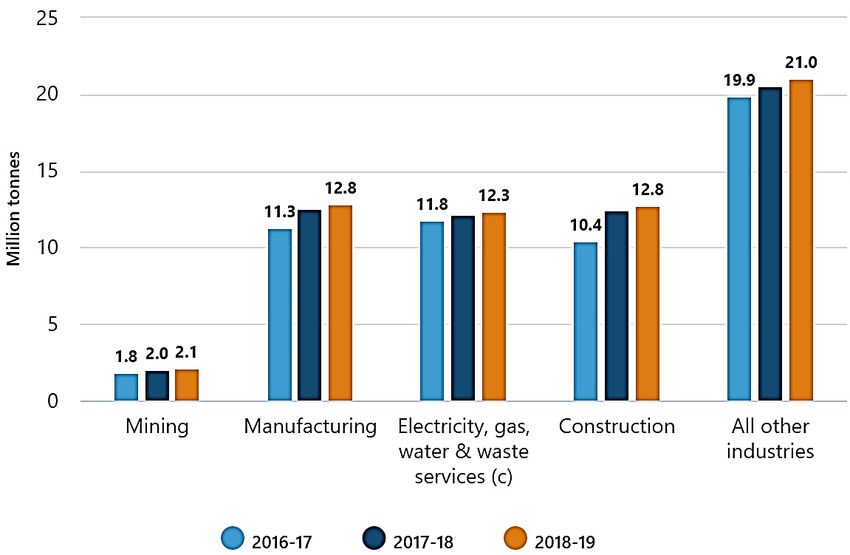
EXECUTIVE SUMMARY
In the 2018 National Waste Policy Strategy 14 (market development and research), it is recommended
that all Australian governments and businesses generate and report information to support creating
and maintaining markets for recycled materials. Drawing on this recommendation, this report explores
the capacity of existing end markets in Australian jurisdictions and provides strategies to stimulate and
create markets for recycled C&D waste materials. This report complements the findings in Report No.
1 (Objective 1. Review and identify jurisdictional regulations/specifications/guidelines/standards
affecting the development and operation of end-markets for C&D waste streams)1. In total, more than
120 documents and reports were reviewed to shed light on the market capacity of recycled C&D waste
products across Australian states and territories. For each jurisdiction, specific recommendations were
made to assist public organisations to develop and stimulate end markets for recycled C&D waste
materials. The review findings show that market development activities significantly differ in various
states and territories. Hence, a national effort towards sustainable end-market development and
stimulation is urgently required.
Furthermore, the report investigated the major barriers to transition towards a circular economy and
several strategies to overcome these barriers are suggested accordingly.
The major barriers include:
Increase in energy and transport costs
Limited knowledge of recycled products
Limited technologies for waste recovery
Low quality and reduce performance
Lack of market availability of the products
Limitations caused by specifications, standard and permits
Limited acceptability and negative perception.
For each of these barriers, relevant mitigation strategies were recommended as below:
Increase community awareness and education on recycled products
Develop supportive regulations, policies and specifications
Facilitate sustainability programs
Promote product certification
Advocate targeted technologies and innovative practice.
1
Maqsood, T., Shooshtarian, S., Wong, P., Khalfan M., Yang R. 2021. Review and identify jurisdictional regulations/
specifications/ guidelines/standards affecting the development and operation of end-markets for C&D waste streams. SBEnrc
1.75 - A National Economic Approach to Improved Management of Construction and Demolition Waste.
https://sbenrc.com.au/research-programs/1-75/
3
TABLE OF CONTENTS

1.   Introduction ............................................................................................................. 8
     1.1. Overview ............................................................................................................... 9
     1.2. Research scope and objective ............................................................................... 9
     1.3. Report structure .................................................................................................... 9
2.   Methodology .......................................................................................................... 10
     2.1. Overview ............................................................................................................. 11
     2.2. Data collection and processing ........................................................................... 11
     2.3. Limitations ........................................................................................................... 11
3.   Analysis of Existing C&D waste End markets: Australia ............................................ 13
     3.1. Overview ............................................................................................................. 14
     3.2. C&D waste data ................................................................................................... 14
     3.3. The economy of C&D waste ................................................................................ 16
     3.4. The market for recycled C&D waste ................................................................... 16
4.   Analysis of Existing C&D waste End markets: Australian Capital Territory ................ 17
     4.1. Overview ............................................................................................................. 18
     4.2. C&D waste data ................................................................................................... 19
     4.3. Existing markets .................................................................................................. 19
     4.4. Material recovery facilities .................................................................................. 21
     4.5. Use of C&D waste recycled in construction projects .......................................... 22
     4.6. Government ........................................................................................................ 22
     4.7. Recommendations .............................................................................................. 23
5.   Analysis of Existing C&D waste End markets: New South Wales .............................. 24
     5.1. Overview ............................................................................................................. 25
     5.2. C&D waste data ................................................................................................... 25
     5.3. Existing markets .................................................................................................. 26
     5.4. Material recovery facilities .................................................................................. 28
     5.5. Use of recycled products ..................................................................................... 28
     5.6. Government ........................................................................................................ 29
     5.7. Recommendations .............................................................................................. 30
6.   Analysis of Existing C&D waste End markets: Northern Territory ............................. 31
     6.1. Overview ............................................................................................................. 32
     6.2. C&D waste data ................................................................................................... 33
     6.3. Existing markets .................................................................................................. 33
     6.4. Material recovery facilities .................................................................................. 33
     6.5. Use of recycled products ..................................................................................... 33
     6.6. Government ........................................................................................................ 34
     6.7. Recommendations .............................................................................................. 34
7.   Analysis of Existing C&D waste End markets: Queensland ....................................... 35
     7.1. Overview ............................................................................................................. 36
     7.2. C&D waste data ................................................................................................... 36
     7.3. Existing markets .................................................................................................. 37
     7.4. Use of recycled products ..................................................................................... 38
     7.5. Government ........................................................................................................ 39
     7.6. Recommendations .............................................................................................. 39
8.   Analysis of Existing C&D waste End markets: South Australia .................................. 41
     8.1. Overview ............................................................................................................. 42

                                                                                                                                  4
8.2. C&D waste data ................................................................................................... 43
      8.3. Existing markets .................................................................................................. 43
      8.4. Material recovery facilities .................................................................................. 44
      8.5. Use of recycled C&D waste products .................................................................. 44
      8.6. Government ........................................................................................................ 45
      8.7. Recommendations .............................................................................................. 45
9.    Analysis of Existing C&D waste End markets: Tasmania ........................................... 46
      9.1. Overview ............................................................................................................. 47
      9.2. C&D waste data ................................................................................................... 48
      9.3. Existing markets .................................................................................................. 48
      9.4. Material recovery facilities .................................................................................. 49
      9.5. Use of recycled C&D waste products .................................................................. 49
      9.6. Government ........................................................................................................ 49
      9.7. Recommendations .............................................................................................. 49
10.   Analysis of Existing C&D waste End markets: Victoria .............................................. 51
      10.1. Overview ............................................................................................................. 52
      10.2. C&D waste data ................................................................................................... 52
      10.3. Existing markets .................................................................................................. 53
      10.4. Material recovery facilities .................................................................................. 55
      10.5. Use of recycled C&D waste in construction projects .......................................... 55
      10.6. Government ........................................................................................................ 55
      10.7. Recommendations .............................................................................................. 56
11.   Analysis of Existing C&D waste End markets: Western Australia .............................. 57
      11.1. Overview ............................................................................................................. 58
      11.2. C&D waste data ................................................................................................... 58
      11.3. Existing markets .................................................................................................. 59
      11.4. Material recovery facilities .................................................................................. 61
      11.5. Use of recycled products in construction projects ............................................. 62
      11.6. Government ........................................................................................................ 63
      11.7. Recommendations .............................................................................................. 63
12.   Barriers to Creation and Stimulation of End-Markets .............................................. 64
      12.1. Overview ............................................................................................................. 65
      12.2. Increase in energy and transport costs ............................................................... 65
      12.3. Limited knowledge of recycled products ............................................................ 66
      12.4. Limited technologies for waste recovery ............................................................ 66
      12.5. Low quality and reduced performance ............................................................... 66
      12.6. Lack of market availability of the products ......................................................... 66
      12.7. Limitations caused by specifications, standards and permits ............................ 67
      12.8. Limited acceptability and negative perceptions (Public and the Industry) ...... 67
13.   Strategies to Create and Stimulate End-Markets ..................................................... 68
      13.1. Overview ............................................................................................................. 69
      13.2. Increase community awareness and education on recycled products............... 69
      13.3. Develop supportive regulations, policies and specifications .............................. 69
      13.4. Facilitate sustainability programs ....................................................................... 69
      13.5. Promote product certification ............................................................................ 70
      13.6. Advocate targeted technologies and innovative practice .................................. 70
14.   Concluding Remarks ............................................................................................... 71
      14.1. Conclusions.......................................................................................................... 72
15.   References ............................................................................................................. 73
                                                                                                                                   5
16. Appendices ............................................................................................................. 78
List of Tables
Table 1. Priority C&D waste materials statistics in the ACT .................................................................................. 19
Table 2. The market for case study materials ....................................................................................................... 20
Table 3. An example of the tipping fees and price list in a recycling facility in the ACT........................................ 21
Table 4. An example of the tipping fees and price list in a recycling facility in the ACT........................................ 22
Table 5. Priority C&D waste materials statistics NSW ........................................................................................... 26
Table 6. Recycled product price list in NSW .......................................................................................................... 27
Table 7. Priority C&D waste materials statistics in NT .......................................................................................... 33
Table 8. Priority C&D waste materials statistics in Qld ......................................................................................... 37
Table 9. Price example of C&D waste recycled products in Qld ............................................................................ 38
Table 10. Priority C&D waste materials statistics in SA ......................................................................................... 43
Table 11. Priority C&D waste materials statistics in Tas ........................................................................................ 48
Table 12. Priority C&D waste materials statistics in Vic ........................................................................................ 53
Table 13. Priority C&D waste materials statistics in WA ....................................................................................... 59
Table 14. Product received, processed and relevant main end-markets. ............................................................. 61
Table 15. The main barriers to the use of recycled materials ............................................................................... 65
List of Figures
Figure 1. Waste generation by waste material in Australia (2016-2019) .............................................................. 14
Figure 2. The waste generation by industry in Australia (2016-2019) .................................................................. 15
Figure 3. The waste recovery rate for various waste streams............................................................................... 15
Figure 4. Expenditure on waste services ............................................................................................................... 16
Figure 5. The value of construction activities in the ACT between 2013 and 2020 (until Sep) ............................. 18
Figure 6. The value of construction activities in NSW between 2013 and 2020 (until Sep) .................................. 25
Figure 7. The potential market for priority materials in NSW ............................................................................... 28
Figure 8. The value of construction activities in NT between 2013 and 2020 (until Sep) ..................................... 32
Figure 9. The value of construction activities in Qld between 2013 and 2020 (until Sep) .................................... 36
Figure 10. The value of construction activities in SA between 2013 and 2020 (until Sep) ................................... 42
Figure 11. The value of construction activities in Tas between 2014 and 2020 (until Sep) .................................. 47
Figure 12. The value of construction activities in Vic between 2013 and 2020 (until Sep). .................................. 52
Figure 13. The potential market for priority materials in Vic. ............................................................................... 54
Figure 14. The value of construction activities in WA between 2013 and 2020 (until Sep). ................................. 58
Figure 15. The potential market for priority materials in WA. .............................................................................. 60
6List of abbreviations
Abbreviation Extended word
ABS Australian Bureau of Statistics
ACT Australian Capital Territory
C&D waste Construction and Demolition waste
C&I waste Commercial and Industrial waste
CE Circular Economy
EfW Energy from Waste
EPA Environmental Protection Authority
GISA Green Industries SA
IPWEA Institute of Public Works Engineering Australasia
kt Kilo tonne
MRF Material Recycling Facility
MSW Municipal Solid
Mt Million tonnes
NSW New South Wales
NT Northern Territory
NWP National Waste Policy
Qld Queensland
RCA Recycled Concrete Aggregate
RCG Recovered Crushed Glass
RPA Reclaimed Pavement Asphalt
SA South Australia
SV Sustainability Victoria
t Tonne
Tas Tasmania
Vic Victoria
WA Western Australia
71. Introduction
81.1. Overview
Within the Australian context, the circular economy of waste has five principles, the third of which is
to ‘increase the use of recycled material and build demand and markets for recycled products’; that
is, market development. In the Australian National Waste Policy, Strategy 14 places emphasis on
market development and research. Estimations, based on the current solid waste generation rates in
Australia, project that Australian recycling capacity must increase by 400% by 2040 to address the
issue of solid waste in the future. Furthermore, the influence of China’s new waste policy and anti-
waste movements in other countries, including Thailand, Malaysia and the Philippines urgently
necessitates the development of domestic market capacity in Australia.
Construction and demolition (C&D) waste is the largest source of waste in Australia. The latest
records2 show that the annual quantity of waste produced in eight states and territories of Australia
is about 27 mt, which is followed by commercial and industrial (C&I: 21.9 mt) and municipal solid
waste (MSW: 12.6 mt). Management of such a quantity within Australia requires the adoption of a
circular economy approach that is underpinned by resource efficiency and waste recovery
enhancement. Market development is believed to be a sustainable option that ideally engages all
stakeholders who have a role to play in the construction materials supply chain and their lifecycle
extended beyond their end-of-life.
1.2. Research scope and objective
This report aims to achieve the second objective of Project 1.75 (Creation and stimulation of end-
markets for construction and demolition waste). The project investigates the factors that impact the
operation of the existing market for recycled C&D waste resources and development. The second
objective covers the capacity of existing end-markets in Australian jurisdictions and how the existing
markets can be stimulated, and new end-markets created for sustainable management of C&D
waste.
1.3. Report structure
The report structure comprises 14 sections: Section 1 presents a background to the research and
briefly provides the C&D waste market development in Australia; Section 2 provides the
methodology used, and Sections 3 to 11 review waste management conditions as well as existing
market situations and provide state-specific recommendations to create and stimulate the market
for C&D waste materials. In Section 12, barriers to achieving sustainable end-markets are discussed,
followed by details on the strategies to remove these barriers (Section 13). Lastly, the concluding
remarks to this project are presented.
2Blue Environment. National waste report 2020. Retrieved from https://bit.ly/3pnRE5D
92. Methodology
102.1. Overview
The operation of end markets for C&D waste materials is subject to multiple factors. This report,
therefore, focuses on the major factors identified as having an impact on the creation and stimulation
end-markets for the C&D waste stream. As waste regulation occurs at the state and territory level,
the research methodology is designed to individually analyse market conditions across the Australian
jurisdictions. In order to define the study scope, five case materials were selected for detailed market
analysis. These five materials are concrete, brick, steel, glass and asphalt. The materials were selected
from a list of different construction materials by the project industry and government partners using
five criteria, the embodied energy, embodied water, embodied greenhouse gas emission, the rate of
annual waste and whether the material is considered a priority resource in each state and territory.
2.2. Data collection and processing
A desktop literature review was employed to capture information regarding the operation of existing
markets and the development of new markets for recycled C&D waste in Australian states and
territories. The document analysis involved reviewing government and industry reports, research
publications, industry magazine articles and articles published through online news agencies. To
reflect the status quo of market development in Australia, only recent information that was released
after 2016 was considered. In total, 121 unique references were used to shape this report.
Waste data were primarily extracted from the latest national waste dataset that was released in late
2020. This dataset includes aggregated and individual waste data both nationally and jurisdictionally
and indicates the waste fates (e.g. disposal, recycling and energy from waste recovery). However, in
this dataset, the quantity of each waste material generated in states and territories is not specified.
Hence, we assume that the total waste generated is equal to the sum of the quantity of waste
recycled and landfilled. Furthermore, the recommendations provided for the stimulation of the
existing end-markets in each state and territory were primarily based on the experts’ views published
in different reports and the issues identified for market development in the states and territories.
2.3. Limitations
There were a few limitations that presented challenges in data collection. Below is a selection of
these limitations, plus the strategies used to minimise their impact on the study’s quality:
Firstly, In the absences of primary data, this report is confined to secondary data that is publicly
available. Some of the resources were outdated and might not reflect the current market conditions.
Furthermore, due to using desktop research, resources found were not necessarily consistent in
terms of the methodology applied. Therefore, a degree of information disparity is to be expected.
That said, care was taken to ensure that the most recent studies, reports and resources that were
also consistent are used where available. Secondly, the information sensitivity of construction and
resource recovery centres hindered the collection of data pertaining to the estimation of market size
and strength for the priority materials. For instance, as the market is highly competitive, recycling
facilities, suppliers and those who are involved in trading recycled C&D waste products do not tend
to reveal their price list on their webpages, and the final price is typically determined after reviewing
order size, transport distance and other available quotes. To this end, price averaging was applied to
all prices obtained from various available resources to ensure a true reflection of the market for
different recycled products under study.
Thirdly, the availability of waste data in the smaller states and territories (e.g., NT) was another
barrier. While it is possible that there is a market for recycled C&D waste materials in these regions,
the lack of documented information impedes our ability to capture market operation in these areas.
To minimise the impact of this, the public authorities responsible for waste management in these
11states and territories were contacted, a strategy that did not always result in the required
information being acquired. Lastly, there is a caveat regarding the use of the national waste dataset;
it does not provide complete data for the waste fates of the priority case materials in each category
and territory. Therefore, where available, supplementary data were sought from jurisdictional
reports and datasets.
123. Analysis of Existing C&D
waste End markets:
Australia
13The capacity of existing C&D waste end-markets in Australian jurisdictions
3.1. Overview
This section of the report presents an analysis of the capacity of existing C&D waste end markets in
Australia. The analyses are based on C&D waste statistics, the economics of C&D waste, and existing
markets for recycled C&D waste resources.
3.2. C&D waste data
The C&D waste stream is the largest source of waste in Australia. The quantity of waste materials
generated in the C&D waste stream has increased since 20162. The latest data shows that in the fiscal
year of 2018-19 about 22.7 mt of C&D waste was generated (Figure 1), which was the largest
contributor to the total solid waste (91.7%) in Australia.
Figure 1. Waste generation by waste material in Australia (2016-2019)
Source: ABS (2020)
In 2018-19, the construction and manufacturing industries generated the largest quantity of waste
(12.8 mt) followed by electricity, gas and water & waste services (12.3 mt). The waste quantity has
increased by 23% (Figure 2).
14Figure 2. The waste generation by industry in Australia (2016-2019)
Source: ABS (2020)3
In terms of waste recovery activities, the C&D waste materials ranked first among other waste streams
(Figure 3). In the fiscal year of 2018-19, more than 81% of the C&D waste was recovered throughout
Australia, followed by metals, and the paper and cardboard category (66.9%). During the same time,
Australia exported 6% of the total waste generated in the country.
Figure 3. The waste recovery rate for various waste streams
Source: ABS (2020)3
3Australian Bureau of Statistics. 2020. Waste Account, Australia, Experimental Estimates. Retrieved from
https://bit.ly/3ppc7r1
153.3. The economy of C&D waste
The waste management and resource recovery sector contributes to 0.3% of Australia’s GDP. In 2019,
36,000 jobs were recorded in this sector, which has increased 16% from 2016. The sector has
contributed 4,866 million to the economy. ABS (2020) Reported that among various sectors, the
construction industry had spent $2 billion on waste collection, treatment, and disposal services. These
expenditures are calculated through the indicator of waste intensity, which quantifies the amount of
waste generated per million dollars of value-added to the economy (Figure 4). This indicator for the
construction industry is 87 tonnes per million dollars. These figures suggest the large magnitude of the
C&D waste economy and the potential for the development of domestic markets.
Figure 4. Expenditure on waste services
Source: ABS (2020)3
3.4. The market for recycled C&D waste
Market development activities for C&D waste significantly vary across the Australian states and
territories. However, most Australian jurisdictions have now acknowledged the significance of a
circular economy in the construction industry and sought to transition to non-linear construction
material end-of-life management. In some states such as Vic, WA and NSW, large public infrastructure
projects have unlocked the potential of using recycled C&D waste in construction projects and present
an opportunity to develop sustainable end-markets for these materials. The following review of market
conditions in each state and territory will provide an insight into the main factors affecting local market
creation and stimulation, and can be used to establish a national platform to facilitate C&D waste
trading across Australia.
16The capacity of existing C&D waste end-markets in Australian jurisdictions
4. Analysis of Existing C&D
waste End markets:
Australian Capital
Territory
17The capacity of existing C&D waste end-markets in Australian jurisdictions
4.1. Overview
The Australian Capital Territory (ACT) has a population of 400,000 residents living in about 145,000
households and is one of the fastest-growing regions in Australia. This territory is one of the leading
jurisdictions in waste management, with about 70% of waste being reused and recycled4. In 1996, the
ACT was the first jurisdiction in the world to employ a 'No Waste‘ strategy; this important initiative
promoted the idea of consideration of waste as a resource between 1996 and 2000. Governance and
regulation of C&D waste in the ACT is performed by the Environmental Protection Authority (EPA) and
Transport Canberra and the City Services Directorate. In 2018, the ACT government set a 95% target to
recover C&D waste in this territory. The rate of waste generation has a linear relationship with
construction activities. Since 2014, the value of the construction industry in the ACT has surged, and
the total value of work done has reached AUD $766, 681 in 20205 (Figure 5), approximating a more
than 36% increase from that figure recorded in 2014.
Figure 5. The value of construction activities in the ACT between 2013 and 2020 (until Sep)
Source: ABS (2020)5
This section of the report presents data relevant to the waste management of five priority construction
materials, an overview of the existing markets, the conditions of material recovery facilities (MRFs),
some case studies of using recycled products in construction projects, the extent of government
support, and recommendations to enhance market operation across the territory.
4 Meegan Fitzharris MLA. 2017. Waste and recycling industry in Australia- Submission 20: ACT Government's response
5ABS. 2020. Building Activity, Australia. https://bit.ly/3pdAokx
184.2. C&D waste data
The latest report commissioned by the Department of Agriculture, Water and the Environment2
showed a growth in the overall rate of ACT waste generation, which was less than that in population
growth. The territory government had set a target of 90% resource recovery by 20256, which later
increased to 95%.
Table 1. Priority C&D waste materials statistics in the ACT
Material Waste generation (t) Disposal (t) Recycling (t)
Brickᵃ 0 0 25,098
Concrete 116, 646 1,177 115,469
Asphalt 12,009 0 12,009
Steel * 0 0 0
Glass * 8 8 0
Source: 2020 National Waste Database
a recycling figure is for the total waste stream
*numbers are for C&D waste stream only.
It is worth noting that there is a significant waste exchange between ACT and NSW. For instance, about
562 kt of Queanbeyan (NSW) disposable C&D waste was sent to the ACT for re-landfilling; at the same
time, C&D waste that was originally generated in the ACT was shipped to NSW because it is a shorter
distance than to ACT facilities and offers disposal in non-levy landfills7. In 2018, the Waste
Management Review8 reported that the NSW EPA has partnered with police, the ACT Government and
local councils to target rogue operators supplying waste soil from construction sites advertised as clean
fill to innocent property owners. Compliance and roadside checks were part of the crackdown to ensure
fill going to a site had the appropriate council approval to accept it.
4.3. Existing markets
The market for certain C&D waste materials such as concrete, brick, steel and glass are well-established
in the ACT. Table 2 provides a summary of the conditions of the market for the case study C&D waste
materials in the ACT. The information is sourced from the existing literature and secondary data
available publicly. Conversely, the market for EfW recovery (extraction and combustion of methane
gas) has been diminished due to the change in the government policy following public concerns about
the pollution associated with the operation of EfW facilities, notably West Belconnen Resource
Management Centres and Mugga Land Landfills9. Currently, the BusinessRecycling platform10 provides
critical information on C&D waste recyclers in the Capital Region.
6Australian Government. National waste Policy Action Plan. 2019. https://bit.ly/2TtBTiy
7 Wu, H., Zuo, J., Yuan, H., Zillante, G. and Wang, J., 2020. Cross-regional mobility of construction and demolition waste in
Australia: An exploratory study. Resources, Conservation and Recycling, 156, p.104710.
8 Waste Management Review. 2018.NSW Crackdown Targets Illegal Waste Transporters. https://bit.ly/3vYbB6k
9 ACT NoWaste. 2018. Waste feasibility study: Discussion paper. Prepared for the ACT Government
10 Planet ARK. 2020. BusinessRecycling. Retrieved from https://businessrecycling.com.au/>.
19The capacity of existing C&D waste end-markets in Australian jurisdictions
Table 2. The market for case study materials
Material Types/Application Description End-users
Brick Brick dust, crushed brick and whole brick. The market for this material is quite strong in the ACT. Brick and tiles are The main clients are private
The whole brick is cleaned and reused; the second-highest recycled product in the Capital Region. builders, civil and
crushed brick is used as a raw material for infrastructure contractors
brick production, generate fill, drainage, and landscaping suppliers
road pavement.
Concrete Major concrete based products include Concrete recycling involves the utilisation of crushing machinery that The main end-users include
crushed concrete, crushed dust, aggregated, crushes concrete into various sizes. There is a strong market within the private building contractors,
sub-base. Crushed concrete is used as a Capital Region for recycled concrete for road base and fill and for civil and infrastructure
substitute for virgin aggregates (e.g. drainage lines as aggregate. Traditionally, the demand for recycled contractors and wholesale
limestone, rock and gravel). concrete in civil, commercial and residential activities outweighs its landscape suppliers
supply generated from construction activities.
Asphalt Asphalt millings There is a well-established recycling process and the market for asphalt
in the ACT.
Steel Steel scrap, rebar, and stainless steel There is a mature market for ferrous metals, including steel, in the ACT. Scrap metal merchants are
Builders, skip operators and demolition contractors separate steel from the main clients for recycled
waste mix-loads. Hence, there is a high level of recycling of steel in the steel
Capital Region. The approximate figure for buying steel waste by
recyclers is $250; along with the cost-saving associated with avoiding
landfill levy fees, this induces strong economic incentive for steel
recycling, and hence the market is quite viable for this material. This
waste source is the third most recycled product in the Capital Region.
Source: Canberra Business Chamber (2014)11.
11
Canberra Business Chamber 2014. Building and construction waste materials: Reduce, Reuse and Recycle-Opportunities and strategies for the Capital region. Canberra Sustainability Special Interest
Group
20The capacity of existing C&D waste end-markets in Australian jurisdictions
4.4. Material recovery facilities
A 2017 report4 on the ACT waste management system indicated that the increased waste landfill levy
has resulted in a massive diversion of C&D waste materials (>80%) to Material Recovery Facilities
(MRFs). Since 2004, the ACT recovered 65-74% of this waste stream. This report also specified that on-
site waste separation by construction companies could reduce the cost charged at MRFs from
$130/tonne to $20/tonnes.
The ACT government has ruled out energy from waste (EfW) from the available waste management
options for this territory in favour of the territory‘s climate change direction objectives. In the ACT,
from 2020, the new MRFs that intend to engage in EfW extraction activities are prohibited from
incineration, gasification, pyrolysis or variations of these for energy recovery12. This policy limits the
market availability for combustible C&D waste such as timber. It also includes:
Evaluation of the operation of existing recycling facilities
Evaluation of issues impacting recycling facilities
Identifying strategies to overcome these issues.
Canberra Concrete Recyclers Pty Ltd13 is an active recycler that accepts a wide range of C&D waste in
the Capital Region. This company structures its operation costs based on the mix of the load it receives
at the weighbridge. Table 2 exemplifies the charges associated with C&D waste acceptance at a
recycling facility based in the ACT and provides cost information for a range of recycled products. The
figures in the table show that gate fees at recycling facilities are way cheaper than landfilling fees,
which are currently sitting at $199.2 and $146.2 in metropolitan and regional areas, respectively.
Table 3. An example of the tipping fees and price list in a recycling facility in the ACT
Waste material Tip fee ($)/t Waste material Tip fee
($)/t
Brick/Terracotta tiles/pipes clean 23 Concrete oversize (+600- +800), 16-100
including blocks, piers, poles, beams
Clean concrete (± 400 mm) 12-14 Coloured Tiles (excl. White tiles) 23
Brick and Concrete Mix 30 Asphalt 6
Virgin excavated natural material 41 Demolition waste all categories 160
(VNEM)
Products
Asphalt subbase (20 mm) 20 Compactable fill 8
Asphalt oversize (40 mm) 18 Top soil (unspecified) 16
Road-base / sub-base -20mm DGS 16 Bricks unclean 35
Aggregate (5, 14, 20 mm) 16-29 Uncrushed screened concrete 27
Crushed concrete dust (7, 14, 20 12.5-16 Landscaping rocks 25
mm)
Source: https://www.canberraconcreterecyclers.com.au/- extracted in December 2020
12 ACT Government. 2020. ACT Waste-to-Energy Policy 2020-25.
13 Canberra Concrete Recyclers. 2020. Retrieved from https://www.canberraconcreterecyclers.com.au/
21Table 4. An example of the tipping fees and price list in a recycling facility in the ACT
Waste material Tip fee Waste material Tip fee
($)/t ($)/t
Drilling fluid 60.50 Rock 7.70
Non-clean fill 66 Clean concrete 9.90
Contaminated concrete 110
VNEM 24.75 All metals Nil
Asphalt 7.70 Clean brick 7.70
Mixed masonry- 22 C&D waste "A" Grade (primarily 132
Terra/Ceramics/Coloured Brick (not Clean recyclable materials, i.e. timber, brick,
Red Brick) / Concrete / Natural Marble / asphalt)
Natural Granite) C&D waste "B" Grade (primarily non- 154
recyclable materials, i.e. plastics,
plywood, cardboard, fence palings)
Products
Top soil (screened) 15.40 Aggregates 10-60 mm 15.40
Top soil (unscreened) 3.30
Scalps (brick) Free Asphalt millings 17.60
Scalps (Dark) 11 Crushed brick:
5-7 mm 17.60
10-20 mm 33
Concrete backing 15.40 Recycled golden mulch (m3) 15.40
Brick dust/crusher dust 3.30 Rock 44
Source: ACT recycling. Source: https://actrecycling.com.au/ - extracted in December 2020
The full list of MRFs operating in this territory that recovers the study materials is provided in
appendices.
4.5. Use of C&D waste recycled in construction projects
Below are examples of using recycled materials in construction projects in the ACT. These case studies
are representative of market operation in the Capital Region.
Case study 1 - In March 2019, the ACT laid around 1,000 tonnes of asphalt containing recycled products
during an ACT roads trial. The asphalt contains several waste materials including 250 kilograms of
reclaimed asphalt. The ACT Government has planned to use this product in other road infrastructures.
The cost of using this product is equivalent 22to that of traditional asphalt. The impact on local
government budgets of not using recycled product could also contribute to higher waste disposal costs.
Case study 2- In November 2018, a recycled product called Plastiphalt, which is composed of recycled
glass and soft plastics, was trialled on existing sections of Horse Park Drive and Gundaroo Drive under
the 2018-19 road resurfacing program. The project was completed in April 2019.
4.6. Government
In 2020, an agreement between the federal government and ACT government was reached to deliver
a major upgrade to MRF through financial support under the Government’s $190m Recycling
Modernisation Fund14. The Government committed to providing $21m to the ACT MRF. The objective
14Australian Government. 2020. Joint Media Release: $21 million for better recycling for the ACT. https://bit.ly/3ieOelg
22of this fund is to better separate and process recycling streams. This fund will enhance market
development and stimulation for waste materials, including C&D waste sources.
The government—in pursuit of its 95% target for C&D waste recovery—plans to deliver exemplars of
waste resource recovery in the construction and operation phases of Canberran projects8.
4.7. Recommendations
The report prepared for Canberra Business Chamber has made some recommendations to improve
the C&D waste management system in the ACT; some of the recommendations are relevant to the
scope of this report. Furthermore, in the National Waste Data and Reporting (cycle 2017-19) report,15
some suggestions to improve the C&D waste market are provided. Below are the selected
recommendations from these two reports:
1. Establish a website or mobile application to develop a market for exchange in the soil (the
most relevant to the scope of this report).
2. Establish a regional website or mobile application to provide information about the
location, opening hours and restrictions of all landfill sites.
3. Require tenders for government contractors to have criteria that favour the recycling of
materials.
4. Determine and fix a standard and protocol for the collection of C&D waste data.
5. Revisiting the ACT’s EfW policy to reinstate the government support for EfW activities for
combustible C&D waste materials.
6. The responsible organisation should account for solar panels as an emerging issue.
15Blue
Environment. 2019. National waste data and reporting cycle 2017-19. State and territory feedback and suggested
improvements https://bit.ly/2S4cbAZ
23The capacity of existing C&D waste end-markets in Australian jurisdictions
5. Analysis of Existing C&D
waste End markets: New
South Wales
24The capacity of existing C&D waste end-markets in Australian jurisdictions
5.1. Overview
New South Wales is a south-eastern Australian state, distinguished by its coastal cities and national
parks. It has a total area of 800,642 km² and covers 10.4% of Australia. NSW is also known to have the
largest population in Australia. Based on predictions, NSW‘s population will reach 8.196 million by the
end of June 202116. The construction industry is required to provide residential builds and
infrastructure to accommodate and provide urban amenities for the growing population. The
construction industry, therefore, plays an important role in the state‘s economic profile. The industry
is the fourth contributor to NSW‘s gross state product (GSP). Except for 2019, the value of building
work done (all construction sectors and building types) in NSW (Figure 6) has steadily grown over the
last few years5 reaching $10.68 billion. NSW has commenced work on the largest infrastructure
upgrade program in Australia. The state government has committed to spending $80 billion on new
economic infrastructure over the next four years from 202017.
Figure 6. The value of construction activities in NSW between 2013 and 2020 (until Sep)
5.2. C&D waste data
The latest report commissioned by the Department of Agriculture, Water and the Environment shows
that the five priority materials in this report were recycled in significant quantities in 2018-19 (Table
5). Brick and concrete are the primary waste materials that were recycled in almost equivalent amount.
In a recent report, there is no waste disposal data recorded for the fiscal year 2018-19. However, the
collective trend in C&D waste generation shows an increase in the quantity; it is likely that NSW’s
significant infrastructure program and its spill over into private sector investment has contributed to
this growth18.
In NSW, about 7,752 kt of C&D waste was recycled in 2018-19, which is 3% down from 2016-17.
Similarly, the C&D waste disposal quantities witnessed a 3% decrease compared to 2016-17, reaching
16PopulationAustralia. 2020. Population of New South Wales 2021. Retrieved from https://bit.ly/3irLnDB
17 NSW Industry Report. 2020. Infrastructure and construction. Retrieved from https://bit.ly/3sHEGC4
18 PWC. 2019. NSW Waste Sector Volume II: Situational Analysis. Retrieved from https://bit.ly/3bRy0eF
251, 905 kt. In 2018, C&D waste was the largest source of waste, accounting for 60% of waste generation
volume18. In contrast, EfW records show a significant increase in energy recovery between 2016-17
and 2018-19; the state recovered energy from 40 kt of C&D waste, which is a 288% increase compared
to the previous data reporting period15. Since 2007, the resource recovery rate in the state has
followed a growing trend. The latest estimated waste recovery rates for NSW are 68% and 77%2. The
recycling target rate for the C&D waste stream is 80%.
Table 5. Priority C&D waste materials statistics NSW
Material Waste generation (t) Disposal (t) Recycling (t)
Brickᵃ 1,291,546 0 1,291,546
Concrete 1,291,339 0 1,291,339
Asphalt 85,275 0 85,275
Steel * 0 0 547,471
Glass * 995 0 995
Source: 2020 National Waste Database
a recycling figure is for the total waste stream
*numbers are for C&D waste stream only.
Table 5 indicates that asphalt has found its way to market; indeed, the government‘s support—focused
on using recycled products in road constructions—has unlocked the potential of application of
reclaimed asphalt in NSW road infrastructure19.
5.3. Existing markets
The state’s focus on the development of the market tends to have prioritised municipal waste
materials. However, in recent years, with changes in policies and the introduction of the circular
economy concept, coupled with increased construction activities and elevation of its quantity2,
addressing the C&D waste stream is gaining traction among policymakers. The government, in
collaboration with the private sector, intends to increase resource efficiency in the construction
industry through market development and stimulation.
In partnership with the NSW Government (Department of Planning, Industry and Environment), Plant
Ark launched Australia's most comprehensive online database that helps small to medium businesses
find recycling collection and support services for the workplace. This platform20, which was established
in 2019, invites providers of recycling and waste disposal services to list their details for free.
The market operation heavily hinges on private businesses and recycling facilities that individually
contribute to C&D waste trading; online versions of these have become popular recently. The volume
of construction activities and the quantity of C&D waste generated and recycled in the state has been
a convincing motive for recycling businesses to create and stimulate markets for such products. For
instance, the Recycled Building Centre, which is a Sydney-based recycler, sell reclaimed building waste
materials from the demolition of houses, factories and warehouses. The major share of their materials
belongs to bricks, timber, sandstone and steel. The company has an online shopping platform to sell
19Local Government NSW. 2020 Recycled materials in roads and pavements a technical review. Retrieved from
https://bit.ly/35VCZXW
20Plant ARK. Business Recycling. 2020. Retrieved from https://businessrecycling.com.au/
26these products. Another recycler, the Building Recyclers Depot PTY Ltd
(https://www.therecyclers.com.au/), sorts and sells C&D waste based on their previous/future
application and function i.e., kitchen, bathroom, windows and doors, and landscaping. In addition to
their webpage, these recyclers also use other popular trading platforms such as Gumtree and Facebook
Marketplace to trade their products. Table 6 shows a (live at the time of writing) price list of recycled
products that are supplied in the NSW metropolitan area.
Table 6. Recycled product price list in NSW
Item Turtle Nursery and Gumtree
landscape supplies Price (A$/t)
Price (A$/t)
Recycled Roadbase 46 Recycled Roadbase 35
RCA (10, 20mm) 55 10mm recycled brick 44
Aggregate
Recycled asphalt 46 10mm recycled brick 55
aggregate (bulk bag)
Recycled concrete dust 45 Recycled concrete dust 10
RCA 40/70 55 RCA 40/70 20
The prices are current in January 2021.
Concrete—To roughly estimate the potential market for recycled concrete products in NSW, the
following calculations are made. Assuming all recycled concrete is to be converted to 10mm (concrete),
which is priced at $55/t (Table 6), and accounting for 10% residual waste during recycling (Table 5), the
total potential market for recycled concrete is $63.9 million per year.
Total potential market size = the state’s concrete recycling quantity - 10% residual waste allowance ×
the retail price of recycled product
Total market worth = $1,291,339 – $129,133 × $55 = $63,921, 330
Brick—Using the above equation and considering 10% residual waste for 10mm brick aggregate and
recycled asphalt, the total potential markets are $51.1 million and $3.5 million, respectively. The
potential market for steel and glass is $690 m and $7.96 m, respectively, based on a retail price of 1.26
per kg21 and 8 per kg22.
21 Current scrap metal prices Australia, 2021. Scrap metal prices Sydney. Retrieved from https://bit.ly/2MnsEx2
22 Shop crushed glass aggregate. Retrieved from https://bit.ly/2Mhpyul
27Concrete
$64 m
Brick Glass
$51 m $7.96 m
NSW
Asphalt Steel
$3.5 m $690 m
Figure 7. The potential market for priority materials in NSW
5.4. Material recovery facilities
Despite the C&D waste recycling industry in NSW being considered to be mature and the state’s overall
strategy to support diverting waste from landfills, MRFs lag behind the state’s ambitious waste
recycling target, set at 80%23. A report by the NSW EPA shows that many licensed C&D recycling
facilities are diverting from landfill well under 50% of the waste they receive, representing a significant
loss of valuable resources from the productive economy23.
A recent report by PWC18 has shown that the C&D waste recycling rate in 2018 throughout the state
varied between metropolitan levy areas (81%), non-levied areas (34%) and regional levy areas (64%).
The low recycling rate in non-levied areas indicates the need for imposing a landfill levy that will
eventually result in further recycling and market development. The full list of MRFs operating in this
state which recovers the study materials is provided in appendices.
5.5. Use of recycled products
NSW is a pioneer in the testing and application of recycled products in pavements and road
constructions. Since 2008, the state has invested heavily in trials demonstrating the suitability and
performance of recycled waste materials in infrastructure projects24. Below are two case studies in
which multiple organisations cooperated to encourage market development for MRF products.
Crushed glass in pavement construction25- In 2010, Waverley Council, in partnership with NSW
Department of Planning, Industry and Environment, NSW Roads and Traffic Authority, Institute of
Public Works Engineering Australia and the Packaging Stewardship Forum, provided the first site
within NSW to demonstrate alternate use of crushed glass in pavement construction as an accepted
23 NSW EPA. 2016. New minimum standards for managing construction and demolition waste in NSW. Retrieved from
https://bit.ly/39LELMq
24GHD. 2009. Packaging Stewardship Forum, Australian Food and Grocery Council. Retrieved from https://bit.ly/35UZcp5
25Edge Environment Pty Ltd. 2012. Construction and demolition waste guide recycling and re-use across the supply chain.
Retrieved from https://bit.ly/2Kuruz4 f
28product in NSW roads. Waverley Council substituted 15 tonnes of glass cullet into the road projects,
7.5 tonnes into the asphalt and 7.5 tonnes into concrete.
Asphalt construction for heavy vehicle load19- in 2018, Downer Pty Ltd, in collaboration with two
councils (i.e., Hume City Council and Randwick Council) and some other organisations, used asphalt in
some NSW roads with heavy vehicle load traffic. The project objectives were to minimise reliance on
natural resources and virgin materials and reduce carbon emissions and the amount of waste being
landfilled. From the C&D waste stream, reclaimed asphalt pavement and coarse aggregate were used.
The produced asphalt contained 20 to 30% reclaimed asphalt pavement. The performance testing of
the product shows that it improves fatigue, has superior deformation resistance for heavy vehicle
loads, last 15% longer than standard asphalt and is capable of withstanding 20% increase traffic
loading.
5.6. Government
The government sector in NSW has a pivotal role in creating and stimulating the market for using
recycled products. The government, through various initiative and grants, has provided support for
market development. As indicated earlier, the government support of the Business Recycling platform
is a practical facilitating approach that directly impacts market development. Another initiative is the
EPA’s Circulate Industrial Ecology Program that supports the transition to a circular economy in NSW
by funding innovative commercial industrial ecology projects that recover materials. An initiative that
is more specific to the C&D waste market is the Civil Construction Market Program, which provides
grants to organisations to divert C&D waste from landfill and produce post-consumer recyclate such
as glass, paper and plastic through reuse, recycling and industrial ecology projects in the NSW civil
construction sector26. The grant objectives are to reduce the amount of C&D material sent to landfill,
create new markets and opportunities for C&D waste material within NSW civil construction projects,
create new markets and opportunities for post-consumer recyclate within NSW civil construction
projects and remove the risk associated with trialling innovative resource recovery methods27.
Furthermore, the government sector provides guidelines that aim to stimulate the market for recycled
C&D waste materials in construction projects. For instance, in 2020, Local Government NSW, in
partnership with the University of Sydney, prepared and released a guideline28 to drive the use of
recycled products on roads and pavements in local councils. address the concerns preventing the use
of recycled materials by local councils and thus promote national uniformity and good practice in the
specification and application of material reuse in roads and pavements by local council engineers. In
addition to Local Government NSW, other organisations have supported case studies of using recycled
products in construction projects; these include the Institute of Public Works Engineering Australasia
IPWEA (NSW), the Roads &Transport Directorate, Transport for NSW, EPA, Environment, Energy and
Science (EES) and the NSW Environmental Trust.
26 Laclette, A. 2021. Circular economy projects eligible for grants. Planet Ark. Retrieved from https://bit.ly/3bRaBtL
27NSW EPA. 2021. Civil construction market program grants. Retrieved from https://bit.ly/38WHdjV
28Local Government NSW. 2020. Recycled materials in roads and pavements. Retrieved from https://bit.ly/2NkzB2m
29You can also read