Lithium ion battery value chain and related opportunities for Europe
←
→
Page content transcription
If your browser does not render page correctly, please read the page content below
Lithium ion battery value chain
and related opportunities for
Europe

                    Natalia Lebedeva
                    Franco Di Persio
                    Lois Boon-Brett
This publication is a Science for Policy report by the Joint Research Centre (JRC), the European Commission’s
science and knowledge service. It aims to provide evidence-based scientific support to the European
policymaking process. The scientific output expressed does not imply a policy position of the European
Commission. Neither the European Commission nor any person acting on behalf of the Commission is
responsible for the use that might be made of this publication.

JRC Science Hub
https://ec.europa.eu/jrc

JRC105010

© European Union, 2016

The reuse of the document is authorised, provided the source is acknowledged and the original meaning or
message of the texts are not distorted. The European Commission shall not be held liable for any consequences
stemming from the reuse.

How to cite this report: Lebedeva, N., Di Persio, F., Boon-Brett, L., Lithium ion battery value chain and related
opportunities for Europe, European Commission, Petten, 2016

All images © European Union 2016 unless otherwise specified

Title: Lithium ion battery value chain and related opportunities for Europe

Abstract
Outline of automotive Li-ion battery value chain identifying current market volumes, leaders and status of the
EU industry. The EU industry is far from being self-sufficient in all segments of the value chain. R&I investment
are essential to respond to new opportunities presented by the EV market.

Printed in The Netherlands

Contents

Acknowledgements ................................................................................................ 1
1 Introduction ...................................................................................................... 2
2 Automotive lithium-ion battery value chain ........................................................... 5
3 Value chain segments – status, recent developments and opportunities ................... 7
   3.1 Raw and processed material .......................................................................... 7
       3.1.1 Cobalt ................................................................................................ 9
       3.1.2 Natural graphite .................................................................................. 9
       3.1.3 Silicon metal ..................................................................................... 10
       3.1.4 Lithium ............................................................................................. 10
   3.2 Cell components manufacturing ................................................................... 12
       3.2.1 Cathode materials .............................................................................. 12
       3.2.2 Anode materials ................................................................................ 15
       3.2.3 Electrolytes ....................................................................................... 17
       3.2.4 Separators ........................................................................................ 19
       3.2.5 Future cell chemistries ........................................................................ 21
   3.3 Cell manufacturing ..................................................................................... 26
       3.3.1 Cell manufacturing – current status ..................................................... 26
       3.3.2 Projected market growth .................................................................... 34
       3.3.3 Global cell production over-capacity ..................................................... 35
   3.4 Battery pack manufacturing ........................................................................ 39
   3.5 Electric vehicles manufacturing.................................................................... 45
       3.5.1 Production volumes and deployment .................................................... 45
       3.5.2 OEMs Tier 1 and Tier 2 supply chain ..................................................... 52
   3.6 Recycling .................................................................................................. 55
4 Conclusions .................................................................................................... 62
5 References...................................................................................................... 65
List of abbreviations and definitions ....................................................................... 72
List of figures ...................................................................................................... 73
List of tables ....................................................................................................... 75

                                                            i
Acknowledgements
Authors gratefully acknowledge helpful discussions with C. Pillot (Avicenne Energy),
M. Krausa (Kompetenznetzwerk Lithium-Ionen Batterien e.V. (KLiB)), D. Chung (National
Renewable Energy Laboratory), V. Ries (DK Recycling and Roheisen), A.D. Devaney
(Albemarle Lithium), T. Buhrmester (Rockwood Lithium GmbH an Albemarle Company),
D. Klanecky (Albemarle Corporation).

Authors
Natalia Lebedeva
Franco Di Persio
Lois Boon-Brett

1
1 Introduction
Europe is on the cusp of an energy transformation - a transformation reducing energy
demand, improving energy use efficiency and moving away from a high reliance on fossil
fuels to an increased use of renewable energy sources for power and heat production
and for transportation.     The economic impacts of the energy transformation are
important to consider as it should not hinder growth of the European economy - on the
contrary Europe's ambition is to exploit its energy transformation as an opportunity for
high value job creation and increased economic output, in addition to creating a more
secure and resilient energy system with an ambitious climate policy.

Against this backdrop Europe has adopted the Energy Union Framework Strategy (COM
(2015) 80 final) as part of its commitment to bring about the transition to a low-carbon,
secure and competitive economy. The Energy Union Strategy is structured around five
closely interrelated and mutually reinforcing dimensions addressing (i) energy supply
security, (ii) a fully-integrated energy market, (iii) energy efficiency, (iv) decarbonising
the economy and (v) research, innovation and competitiveness.

In September 2015 the Commission published a Communication on an Integrated
Strategic Energy Technologies Plan (SET-Plan) [1]. This Communication defines a new
European R&I Strategy for the coming years and as such is the first deliverable on which
the fifth (v) dimension of the Energy Union will be built. It provides the overall
framework for promoting strengthened cooperation in R&I between the European
Commission, Member States and stakeholders such as research institutes, universities
and industry (e.g. car manufacturers, chemical industry, mining industry, battery
manufacturers, collectors and recycling industry), in order to step up the efforts to bring
new and more efficient low-carbon technologies faster to the market and to deliver the
energy transition in a cost-competitive way. Based on an integrated approach, going
beyond technology silos, the Integrated SET-Plan identifies 10 R&I Key Actions to
accelerate Europe's energy system transformation.           The Integrated SET-Plan is
supported by the EU Industrial policy (COM(2014) 14 final), which aims to stimulate
growth and foster competitiveness in the manufacturing sector and the EU economy as a
whole, by encouraging innovation through the support of actions related to innovation
and research.

Key Action 7 of the Integrated SET-Plan (Become competitive in the global battery sector
to drive e-mobility forward) is one of two Key Actions dedicated to the pursuit of more
sustainable, efficient, low-emission transport systems, explicitly identified in the fifth
dimension of the Energy Union. Strategic R&I targets and priorities up to 2030 have
been set in Key Action 7 to strengthen European competences and capacities to become
competitive in the global battery sector.

2
Similar as in other Key Actions these targets have been agreed in consultations between
the European Commission and European experts from industry, academia and Member
States. The targets are enshrined in a so-called "Declaration of Intent" [2]. Targets set
in Key Action 7 aim at fostering research and innovation in the European battery sector
to make EU industry more competitive. Unlike the other Key Actions, which cover
exclusively     research   and     innovation   aspects,     Action   7     explicitly    considers
competitiveness with respect to scaled-up manufacturing of higher performance
batteries. Accordingly, targets set in Action 7 cover not only battery technology
performance and cost parameters, they also cover battery manufacturing and recycling.
Ratified   by   the   national   representatives   from    the   SET-Plan    countries     and   the
Commission, these targets help define the expected actions, deliverables and time
frames for a co-ordinated R&I&C agenda in the European battery sector.

Related to the competitiveness aspect of Key Action 7, a number of questions arise when
considering ways for Europe to co-ordinate its R&I efforts and where to invest available
research resources. For example, is it reasonable to assume that Europe could be
competitive in all segments of the battery value chain or should European R&I&C
investments focus on certain segments only? Which segment could offer the best return
on investment, in terms of the overall return to the European economy?

Answering such strategic questions demands judicious consideration of the current
status and market outlook for electric vehicle batteries, but also for batteries used in
other applications, as well as of the position and competitive edge enjoyed by the
various global economies active in this sector.            The European Commission's Joint
Research Centre (JRC) has prepared the current report for this purpose.                  This report
outlines the Li-ion battery value chain, and indicates for each segment current market
volumes and leaders as well as the status of the EU industry. This report does not
provide an exhaustive economic assessment with a detailed entry barrier analysis (e.g.
evaluation of market centralization rate, capital requirements, human resources,
consumer purchase behaviour) for the return of the investments in terms of productivity
and global competitiveness. Nevertheless the information can be used to help underpin
decisions regarding where R&I investments having the biggest impact in terms of
boosting European competitiveness can be made. In this context the global dimension
of the battery sector should be considered bearing in mind the competition from the US
and Asia, delocalization of manufacturing capacity and potential dispersion of the
knowledge base which has the tendency to move where production sites are located [3].

The scope of this report largely matches that of the Key Action 7 Declaration of Intent
which considers lithium ion and post lithium ion chemistries the most promising and
relevant chemistries for electrochemical energy storage in the time frame up to 2030.

3
Contrary to the Declaration of Intent, this report considers only automotive traction
battery applications for which relevant data on the current market situation, position of
the main global players and future market outlook has been sourced. Doing so does not
preclude the need or importance of battery R&I to advance the European position in
other   applications   such   as   for   stationary   energy   storage,   where   European
competitiveness can be further improved and enhanced.             Indeed development of
affordable and integrated energy storage solutions to accelerate full integration of
storage devices (including electrochemical) into a low-carbon energy system is explicitly
mentioned, in addition to electro-mobility, in the Accelerating Clean Energy Innovation
Communication (COM(2016) 763). As such it is one of the priority areas where future
EU funding under Horizon 2020 will be focused. Notwithstanding this, competitiveness
of the European battery sector for applications other than e-mobility is beyond the scope
of this report.

4
2 Automotive lithium-ion battery value chain
Figure 1 illustrates the value chain for automotive Li-ion batteries*. The value chain is
divided into 6 segments spanning the spectrum from raw material mining to battery
recycling. Mining and chemical industries provide the myriad of raw and processed
materials used in the production of the various cell components including the anode,
cathode, electrolyte and separator. These components are then assembled in individual
cells. Some materials are produced and used exclusively in Li-ion cell production while
others can be used for other purposes. While the majority of the produced Li-ion cells
are assembled for use in portable electronic devices, a fast growing share is destined for
use in battery packs for electric vehicles. When batteries reach the end of life in their
first application they can be recycled or alternatively employed in a second use
application (e.g. for stationary energy storage).

In the following section each battery value chain segment is discussed highlighting key
figures and relevant industry revenues. Revenues provided for cell component, cell and
pack manufacturing refer to the global Li-ion battery industry, whereas for other value
chain segments the relevant EU industry revenue is provided. While revenues specific to
the Li-ion traction battery industry are still marginal, its Compound Annual Growth Rate
(CAGR) for the upcoming years is quite significant.

Where possible, key global and European players have been identified for each segment.
It is worth noting that activities of some companies cover different segments of the
value chain. For instance some cell manufacturers also manufacture cell components
especially for the cathode, while other players active in the recycling sector are also
active in the materials processing segment. Furthermore, the US electric vehicle
manufacturer Tesla, demonstrates an approach to also lay claim on the manufacturing of
cells and battery packs.

The data presented for all segments was, at the time of publication of this report, the
most up-to-date representative data retrievable by the authors. However the extremely
dynamic nature of the market being considered is such that the absolute and relative
magnitude of the data reported is changing rapidly.

*
    In this report, the term "Automotive batteries" refers to batteries on-board a vehicle used for traction and is
       used as a synonym of "industrial batteries" as defined in the Battery Directive 2006/66/EU.

5
Raw and Cell
Cell Battery pack Electric vehicle
processed component Recycling
manufacturing manufacturing manufacturing
materials manufacturing
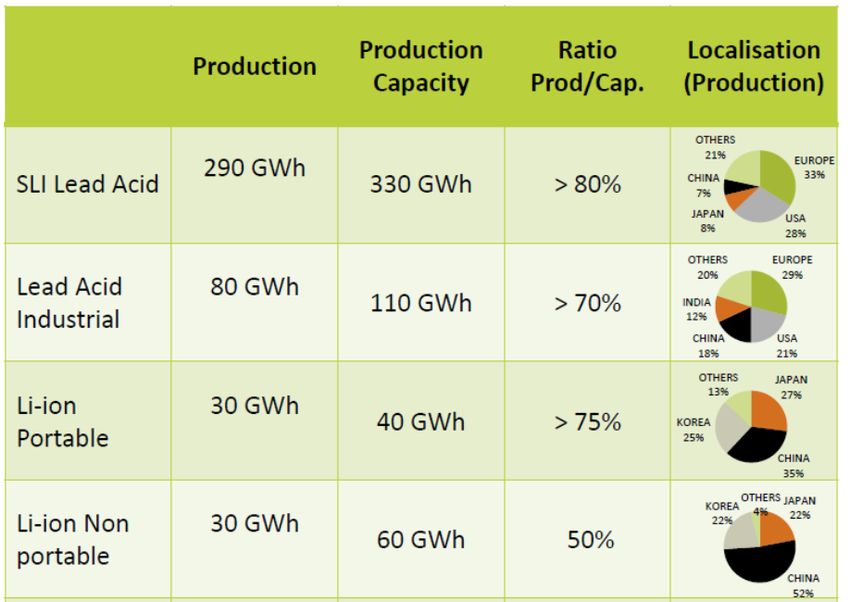
Most Relevant Statistics
.
51 % 43 % 88 % 40 % 31 % 50 %
Democratic Republic of
Cathode revenue Share of pack Recycling efficiency
Congo's share of global Asian share of Li-ion Automotive share of
as share of cell assembly cost over for Li-ion batteries set
cobalt production [4] - cell manufacturing Li-ion cell market in
components the total battery pack in the Battery
a critical material for Li- market [6] volume (MWh) [8]
market [5] cost [7] Directive [9]
ion technology
EU Waste collection &
EU Mining and EU Automotive
Global Li-ion cell Global Li-ion cell Global automotive Recycling Industry
quarrying industry industry
Revenues
components manufacturing battery pack Revenues: B$ 150
revenues: B$ 19 [1] Revenues: B$ 900
Industry revenues: revenues: B$ 16.7 manufacturing [10].
EU Chemical industry [10]. 20% of
B$ 7 [5] [5] revenues: B$ 22 [5] 75% of worldwide
Revenues: B$ 28 [1] worldwide [11]
[12]
Figure 1: Automotive lithium-ion battery value chain (data from 2015).
6
3 Value chain segments – status, recent developments and
  opportunities

3.1 Raw and processed material
A wide range of elements is used in Li-ion battery cells including lithium (Li), nickel (Ni),
cobalt (Co), manganese (Mn), aluminium (Al), copper (Cu), silicon (Si), tin (Sn),
titanium (Ti) and carbon (C) in a variety of forms, e.g. natural graphite. These elements
are harvested from raw materials mined from the earth's crust or recovered from surface
water.

Some of these materials have a high economic importance while at the same time have
a high supply-risk and as such are termed "critical raw materials (CRMs)" [4], [13], [14].
The European Commission publishes a list of CRMs which is reviewed and updated every
three years. As explained in the EC Communication [4]: "The purpose of the list is to
contribute to the implementation of the EU industrial policy and to ensure that European
industrial competitiveness is strengthened through actions in other policy areas. This
should increase the overall competitiveness of the EU economy, in line with the
Commission´s aspiration of raising industry’s contribution to GDP to as much as 20% by
2020. It should also help to incentivise the European production of critical raw materials
and facilitate the launching of new mining activities. The list is also being used to help
prioritise needs and actions. For example, it serves as a supporting element when
negotiating trade agreements, challenging trade distortion measures or promoting
research and innovation" [4]. A new CRM list is expected to be published in 2017.

Among the materials used in Li-ion cells, three are listed as CRMs namely, cobalt,
natural graphite and silicon (metal) [4]. Uses, current supply and forecasted availability
of each of these materials are reported in this section. Similar information is also
reported for lithium even though it is not considered a CRM. However for obvious
reasons availability and supply of lithium has a high impact on the Li-ion battery
industry. Table 1 lists the main producers, main European import sources, the
substitutability index † and the end of life recycling input rate ‡ for each CRM and for
lithium.

†
  ‘Substitutability index’ is a measure of the difficulty in substituting the material, scored and weighted across
all applications. Values are between 0 and 1, with 1 being the least substitutable.
‡
  ‘End-of-life recycling input rate’ measures the proportion of metal and metal products that are produced from
end-of-life scrap and other metal-bearing low grade residues in end-of-life scrap worldwide.

7
Table 1: Main producers, main source of import into EU, substitutability index and recycling rate
of cobalt, natural graphite, silicon metal and lithium. [4, 15-18]

Raw material               Main            Main sources        Substitutability    End-of-life
                       producers             of imports               index         recycling
                      (2014-2015)           into the EU                             input rate
                                          (mainly 2012)

                      Critical raw materials used in Li-ion batteries

Cobalt              Democratic            Russia:    96   %    0.71               16 %
                    Republic         of   (cobalt       ores
                    Congo: 51 %           and
                                          concentrates)
                    China: 6 %
                                          USA: 3 %
                    Russia: 5 %
                                          (cobalt       ores
                    Canada: 5 %
                                          and
                    Australia: 5 %
                                          concentrates)

Natural             China: 66 %           China: 57 %          0.72               0%
graphite
                    India: 14 %           Brazil: 15 %

                    Brazil: 7 %           Norway: 9 %

Silicon metal       China: 68 %           Norway: 38 %         0.81               0%

                    Russia: 8 %           Brazil: 24 %

                    USA: 5 %              China: 8 %

                    Norway: 4 %           Russia: 7 %

                    Non-critical raw material used in Li-ion batteries

Lithium             Australia: 41 %                            n.a.               n.a.

                    Chile: 36 %

                    Argentina: 12 %

                    China: 7 %

8
3.1.1 Cobalt Cobalt is used for a number of industrial applications such as in batteries, superalloys, hard materials – carbides, diamond tooling, pigments, catalysts, magnets etc. [14]. Use in batteries has the biggest share among these applications, equivalent to around 37% [4]. In Li-ion batteries, cobalt is a component in several widely used cathode active materials. Identified world terrestrial cobalt resources are about 25 million tons (for definitions of resources and reserves please see [19]). More than 120 million tons of cobalt resources have been identified in manganese nodules and crusts on the floor of the Atlantic, Indian, and Pacific Oceans [15]. At the beginning of 2016 world reserves were estimated to be 7,1 million tons and total world production of cobalt in 2015 amounted to 0,124 million tons [15]. Just as in previous years, production of cobalt in 2014-2015 was highly concentrated. Democratic Republic of Congo (DRC) continued to be the world's leading source of mined cobalt, supplying 51 % of the cobalt market volume (see Table 1) [15], with China, Russia, Canada and Australia each having a much lower share (see Table 1) [15]. In addition to the high concentration of cobalt production, there are further concerns regarding the social aspects of cobalt mining in the DRC such as forced and child labour and unsafe working conditions [20]. The vast majority of cobalt import into the EU comes from Russia (96 %). Cobalt has a low substitutability (substitutability index for all applications is 0.71 and for batteries it is 0.8) and a reasonably low end-of-life recycling input rate for all applications of 16 % [4]. The forecasted market balance for cobalt, covering all applications until 2020, indicates a small surplus while the market is forecasted to be balanced in 2020 (i.e. supply matching demand within 1 %) [13]. Longer term projections for penetration of electric vehicles up to 2050 show that the cumulative demand for cobalt would require all the resources known today, even considering its relatively high recycling rate in the battery sector. However this estimation is based on the assumption that NMC technology continues to be widely used up to 2050 [21], which is unlikely as gradual introduction of other cobalt-free chemistries is expected in this time frame (see Future cell chemistries section). 3.1.2 Natural graphite Natural graphite is used in a number of industrial applications: electrodes, refractories, lubricants, foundries and in batteries as anode active material [13]. Application in batteries has a relatively low share of 4 % [13]. World's inferred resources exceed 800 million tons of recoverable graphite, reserves of natural graphite are estimated to be 230,000 tons and world mine production in 2015 9
amounted to ca. 1,200 tons [16]. Production of natural graphite is highly concentrated
with China producing 66 %, India 14 % and Brazil 7 % of the natural graphite market
volume (see Table 1) [16]. The majority of natural graphite import into the EU comes
from China (57 %) followed by Brazil (15 %) and Norway (9 %). In some applications
natural graphite has a (very) low substitutability (substitutability           index for all
applications is 0.72), but in batteries substitution of natural graphite by other materials
is feasible (substitutability index is 0.3) [13]. The end-of-life recycling input rate of
natural graphite is 0 %.

It is forecasted that the natural graphite market in 2020 will experience a large surplus
of production (i.e. supply exceeding demand by more than 10 %) [13].

3.1.3 Silicon metal
Silicon metal is widely used in the chemical,        pigments, metallurgy and electronics
industries [13]. Silicon metal and silicon alloys are also emerging as anode active
materials for Li-ion battery cells, but at present their share is negligible compared to
other applications.

World resources for making silicon metal and alloys are abundant and adequate to
supply world requirements for many decades. The source of silicon is silica in various
natural forms, such as quartzite. The reserves in most major producing countries are
also ample in relation to demand, but no quantitative estimates are available [17].
World's production of silicon metal in 2015 amounted to 8,100 tons and was highly
concentrated with China producing 68 %, Russia 8 %, USA 5 % and Norway 4 % of the
silicon metal market volume (see Table 1) [17]. The majority of silicon metal imported
into the EU comes from Norway (38 %) followed by Brazil (24 %), China (8 %) and
Russia (7 %). Silicon metal has a (very) low substitutability having a substitutability
index of 0.81 for all applications [13]. The end-of-life recycling input rate of silicon metal
is 0 % [13].

It is forecasted that the silicon metal market in 2020 will be balanced (i.e. supply
matching demand within 1 %) [13].

3.1.4 Lithium
Although lithium is not classified as a critical raw material it is an important element in
lithium-ion battery technologies. Lithium has a relatively high average abundance in the
earth’s crust of 17 ppm [22], making it the 27th most abundant element in the
lithosphere. For various reasons, outlined in [22], exact data on global resources,
reserves and production of lithium is not available, figures cited below are best estimates
available. A comprehensive overview of lithium resources, reserves, production volume
and producers is given in [22]. Global resources and reserves are estimated to be 39.5-

10
45.2 million tons and 12.2-14 million tons Li metal equivalent§ (LME), respectively [18,
21, 22]. Geographical distribution of resources and reserves is shown in Figure 2.

Figure 2: Geographical distribution of Li resources and reserves. Source: [22]

Major Li resources and reserves - nearly 25 million tons Li metal equivalent (LME) and
8.5 million tons LME, respectively - are identified in South America, notably in Argentina,
Chile, Bolivia and Brazil, where 55% of the global resources and 69% of the global
reserves are located [22]. China possesses the biggest part of Li resources and reserves
found in Asia (ca. 5.3 million tons LME and 2.1 million tons LME respectively)
corresponding to around 12% of the global resources and nearly 17% of the global
reserves [22]. EU's share of the global Li resources and reserves is limited – slightly less
than 0.4 million tons LME and 0.013 million tons LME, respectively [22]. However,
unique deposits of jadarite – lithium boron silicate – were discovered in 2004 in Serbia.
So far only one such deposit is known, its resource is 1.5 million tons LME, which
corresponds to ca. 2% of the global resources [22]. Significant Li resources and reserves
are identified in North America – nearly 6 million tons LME and 0.8 million tons LME,
respectively. More than half of these is located in the USA, corresponding to nearly 8%
of the global resources and 5 % of the global reserves [22].

Global supply of lithium has been historically dominated by hard-rock mineral sources,
however development of large-scale lithium brine operations in South America
commenced in the early 1980’s. The actual global supply market for lithium products is

§
 Lithium is found in nature in a number of mineral forms and compounds with different Li metal content. To
account for this, numbers for Li resources and reserves are given in literature recalculated to Li metal
equivalent, i.e. amount of Li contained in ores, brines etc.

11
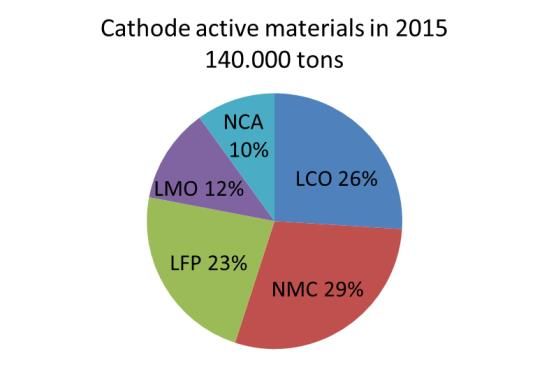
around 200,000 tons of lithium carbonate equivalent (LCE) (1 kg LCE = 0.1895 kg Li),
with almost 83% of it being sourced from four major producers: Albemarle (USA), SQM
(Chile), FMC (USA) and Sichuan Tianqi (China) with main fields located in Chile,
Australia, Argentina and China (see Table 1) [23].

In 2015 Li-ion batteries consumed around 40 % of the global LCE production, of which
14% was used for electric vehicle battery packs. Projection for 2025 shows that electrical
vehicle demand alone will utilise 200,000 tons of LCE, which equates to the total current
global LCE supply [23].

Therefore the known lithium reserves are sufficient to cope with this foreseen increase in
demand even without recovery of lithium from the recycling of Li-ion batteries. Today
the recovery of lithium from batteries is technically feasible, but is still not economically
viable. However, foreseen long term lithium price development or new practices may
make lithium recovery more viable in the future [21].

3.2 Cell components manufacturing

3.2.1 Cathode materials
Aluminium foil is used as a current collector for cathodes in Li-ion cells. Market leaders in
aluminium foil production for battery applications are Sumitomo Light Metal Industries
(JP) and Nippon Foil Mfg. (JP) [24].

Complex transition metal oxides and phosphates are currently the main cathode active
materials used in Li-ion battery cells. These include: Lithium Cobalt Oxide (LCO), Lithium
Nickel Manganese Cobalt Oxide (NMC), Lithium Nickel Cobalt Aluminium Oxide (NCA),
Lithium Manganese Oxide (LMO) and Lithium Iron Phosphate (LFP). With the exception
of LCO, all these materials are currently used in automotive Li-ion battery cells
[25],[26]. The total market demand for cathode materials for all applications of Li-ion
batteries was approximately 140,000 tons in 2015; revenues generated were B$ 3 and
the market showed a sustained growth with compound annual growth rate (CAGR)
amounting to 16% between 2005 and 2015 [27] (see Figure 3). It is estimated that
approximately 25% of the total global demand of the cathode active materials or ca.
5,000 tons was used in Li-ion batteries for HEVs, PHEVs and EVs.

12
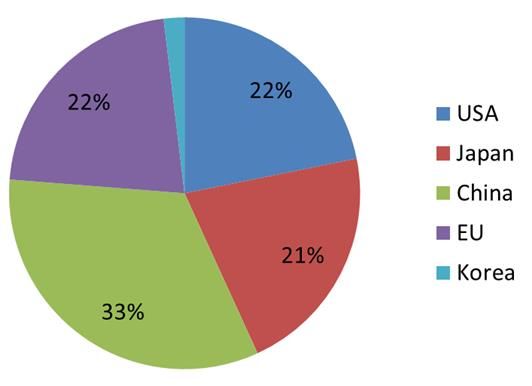
Figure 3: Left – Development of the cathode active materials market in 2000-2015. Right –
demand division per material type and regional distribution of the manufacturers (according to the
location of the headquarters) in 2015 (Used with permission from Avicenne Energy [5]).

Production of cathode active materials is dominated by Asia, with China manufacturing
ca. 39 % (by weight) of the total amount of cathode materials in 2015, Japan – ca. 19 %
and South Korea – ca. 7 % (see Figure 3).

Suppliers from the EU – Umicore** (BE) and Johnson Matthey (UK) – together produced
ca. 13 % (by weight) of the total amount of cathode materials or ca. 17,700 tons in
2015. Umicore produced ca. 5,550 tons of LCO (note however that LCO is less relevant
for automotive applications) and ca. 9,600 tons of NMC and Johnson Matthey (UK)
produced ca. 2,560 tons of LFP.

The cathode materials market remains very dynamic and is currently seeing "de-
concentration" with more and more companies entering the market and providing a
share of the global supply. For example, in 2011 61% of the global market for cathode
materials was shared by only three (3) dominating suppliers, namely Umicore (BE) with
32%, Nichia (JP) with 24% and Toda Kogyo (JP) with 5% [24]. In 2014 six (6) main
suppliers together had a market share of ca. 45% with Umicore (BE) having 11%,
Reshine (CN) 8%, L&F (KR) 8%, ShanShanTech (CN) 7%, Nichia (JP) 7% and Sumitomo

**
  Umicore is considered an EU-based company in this report, despite the fact that the actual production of the
cathode active materials takes place at the Umicore's facility in South Korea.

13
(JP) 5% [27]. In just one year, each of these main producers further increased their
production volume and together they held a 52% share of the total market in 2015 [5].

Companies such as BASF (DE), Dow (US), 3M (US), DuPont (US), Mitsubishi (JP) and LG
Chem (KR) have recently shown interest in this market but do not play a significant role
in the global supply of the cathode active materials yet [27].

Based on a number of assumptions [5], the market for cathode active materials is
expected to grow from ca. 140,000 tons in 2015 to ca. 400,000 tons in 2025 with the
relative fraction per material changing as shown in Figure 4. The highest growth rate is
expected for NMC (almost 5 times), NCA (ca. 3 times) and LMO (2.4 times), and EU
suppliers have the opportunity to increase their supply of NMC. Production of NCA
material, currently dominated       by Japan,       may also present       an opportunity for
existing/new EU manufacturers.

                                                     2015           2025           Expected
                                                                                   growth

                                                     %      ktons   %      ktons   times

                                            LCO      26     37      16     64      1.7

                                            NMC      29     40      48     192     4.8

                                            LFP      23     32      16     64      2.0

                                            LMO      12     17      10     40      2.4

                                            NCA      10     14      10     40      2.9

                                            Total    100    140     100    400     2.9

Figure 4. Expected market volume per material type in 2025 (left) and as compared to 2015
(right) (Used with permission from Avicenne Energy) [5].

However, the potential of technical breakthrough that leads to use of different cathode
materials/chemistry, intensive competition and government policy interference will
continue to affect global cathode manufacturing sector [23].

The quality of the cathode material impacts the overall performance of the cell. Quality
control starts in the raw material production stage and this is particularly true for
cathode manufacturing. For this reason many of the major battery cell manufacturers
such as Panasonic (JP), LG Chem (KR), BYD (CN) have chosen to develop their own in-
house cathode materials production capacity [23].

14
3.2.2 Anode materials Copper foil is used as a current collector for anodes in Li-ion cells. Market leaders in copper foil production for battery applications are Furukawa Electric (JP), Nippon Foil Mfg. (JP) and Nippon Denkai (JP) [24]. Various carbonaceous materials such as natural and artificial graphite, meso-phase and amorphous carbon and more recently tin and silicon oxides and alloys, as well as Lithium Titanium Oxide (LTO) are used as anode active materials [5, 27]. The total market for anode materials for all applications of Li-ion batteries exceeded 76,000 tons in 2015; revenues generated were B$ 1 and the compound annual growth rate (CAGR) amounted to 14% in the period from 2005 to 2015 [5]. Approximately 40% of the total global demand of the anode active materials (ca. 30,400 tons) was used in Li-ion batteries for HEVs, PHEVs and BEVs [5]. Development of the market in 2006-2015 and the division of the market per type of anode material is shown in Figure 5. It can be seen that the largest share of the market – ca. 91% - is taken by graphite and is almost equally divided between natural graphite and artificial graphite, 49 % and 42% (by weight), respectively, of all anode active materials for all Li-ion battery applications [5]. Figure 5: Development of the anode active materials market in 2006-2015, market division per material type and regional distribution of the top-12 manufacturers of natural and artificial graphite anode materials in 2015 (Used with permission from Avicenne Energy [5]). 15
Historically the production of anode active materials has been dominated by Japan and
China (see Figure 5) [5, 24, 25]. In 2011 three (3) producers together had a market
share of 65 % with Hitachi Chemicals (JP) having a share of 34 %, Nippon Carbon (JP) –
19% and BTR Energy (CN) – 12% [24], [25]. In 2015, these 3 companies remain the
leaders in the market of anode active materials supplying 61% of the market [5]. Hitachi
Chemicals (JP) remains the largest producer (31% of the market) with BTR Energy (CN)
following in second place (19%) and Nippon Carbon (JP) in third place (7%). Other
producers of anode active materials include Mitsubishi Chemical (JP), LS Mtron Carbonics
(KR), ShanshanTech (CN), Tokai Carbon (JP) [5].

EU-based companies such as SGL (DE), Imerys (CH) and Heraeus (DE), as well as 3M
(US), DuPont (US), Dow (US), Dow Corning (US), Envia (US), ShinEtsu (JP) have
recently shown interest in the anode active materials market for Li-ion batteries but
currently do not play any significant role in the global supply.

The market for anode active materials is expected to grow from 76,000 to more than
250,000 tons in 2025. The expected distribution of the market among various anode
active materials in 2025 is shown in Figure 6. The forecast is that the share of artificial
graphite will increase to 52%, that of natural graphite decrease to 24% and the share of
other anode active materials will grow to 24% [5].

                                                       2015           2025           Expected
                                                                                     growth

                                                       %      ktons   %      ktons   times

                                     Natural           49     36.75   24     60      1.6
                                     graphite

                                     Artificial        42     31.5    52     130     4.1
                                     graphite

                                     Amorphous         6      4.5     10     25      5.6
                                     carbon

                                     LTO               1      0.75    8      20      26.7

                                     Si compounds      2      1.5     6      15      10

                                     Total             100    75      100    250

Figure 6: Forecast market division per anode active material type in 2025 (left), and as compared
to 2015 (right) (Used with permission from Avicenne Energy [5]).

16
3.2.3 Electrolytes The global market for electrolytes for all applications of Li-ion batteries was slightly bigger than 62,000 tons in 2015; revenues generated were B$ 0.9 and the compound annual growth rate (CAGR) in 2005 to 2015 amounted to 20% [5]. The market for electrolytes for HEV, PHEV and BEV batteries has experienced a rapid growth in the period from 2010 to 2015, with electrolyte demand for these applications increasing from ca. 200 tons in 2010 to ca. 20,500 tons in 2015 (or ca. 33 % of the total market volume for Li-ion batteries) [5, 28]. Similar to cathode and anode active materials, the production of electrolytes for Li-ion batteries is dominated by the Asian suppliers, with China currently producing close to 60 % (by weight) of the total market, Japan – 18 % and Korea – 14 % (see Figure 7). Soulbrain - a producer with headquarters in the US and production facility in Korea – has supplied 7 % of the market in 2015. The EU-based electrolyte producer – BASF (DE) – has supplied ca. 200 tons of electrolyte or ca. 0.4 % of the total market volume in 2014, but decreased the supply significantly in 2015 [5, 28]. Figure 7: Left – Development of the electrolyte market in 2000-2015 and right – Regional distribution of the electrolyte producers in 2015 (Used with permission from Avicenne Energy [5]). 17
The competition in the market is very intense, with Chinese companies expanding their
production volume quickly and others slowing their growth or even experiencing a
decline [5, 28]. One of the quickest growing Chinese electrolyte producers, CapChem,
has more than doubled its share on the market from ca. 3,500 tons in 2013 to 8,600
tons in 2015 to become the global market leader with a 14 % share of the total
electrolyte market. Zhangjiagang Guotai-Huarong (GTHR) (CN) has also increased its
production from ca. 3,500 tons in 2011 to 8,000 tons in 2015 becoming the second
biggest electrolyte supplier with a 13 % share of the total electrolyte market in 2015.
Conversely, Korean (e.g. Panax-Etec) and mainly Japanese (e.g. Mitsui Chemicals and
Ube) electrolyte producers are currently experiencing a decrease of their market share
[5, 27].

New entrants on the global market of electrolytes for Li-ion batteries are companies such
as LG Chem (KR), DuPont (US) and Daikin (JP) [5, 28].

Worldwide there is currently a significant overcapacity for electrolyte production for Li-
ion batteries (see Figure 8) [5]. Less than half of the available production capacity is
currently being utilised in Japan and Korea and in the US and Europe only 5% and 1%,
respectively.

Figure 8: World-wide demand and offer of electrolytes for Li-ion batteries (Used with permission
from Avicenne Energy [5].)

18
Nevertheless, there may be opportunities in formulation and production of new advanced
electrolytes, e.g. for high-voltage Li-ion cells, where advanced (likely fluorinated)
additives and solvents will be required [5]. Given this dynamic market climate and taking
into account the expected market growth, there may be business opportunities present
for EU-based producers.

The market for electrolytes is expected to grow from the current 62,000 tons to more
than 235,000 tons in 2025, with the automotive share increasing from current ca. 33%
to ca. 50% of the market, see Figure 9 [5].

Figure 9: Electrolyte market forecast till 2025 (Used with permission from Avicenne Energy [5].)

3.2.4 Separators
The total market for separators for all applications of Li-ion batteries was approximately
900 Mm2 in 2015; revenues generated were B$ 1.1 and the compound annual growth
rate (CAGR) amounted to 15% in the period between 2005 and 2015 [5]. Approximately
30% of the global separator market volume or ca. 300 Mm 2 is supplied for production of
automotive Li-ion battery cells [5].

As for cathode and anode active materials and electrolytes, the market of separators for
Li-ion batteries is dominated by Asia, with Japan's current market share of 48 % (by
product surface area, Mm2) of the total market supply, China – 17 % and Korea – 10 %

19
(see Figure 10). Market leaders are Asahi Kasei (JP), Toray (JP) and SK (KR). The
separator market position of the US is also strong with Celgard having a market share of
9% and Entek of 3% in 2015 [5].

Companies such as DuPont (US), Dow (US), LG Chem (KR), Teijin (JP) and Mitsubishi
(JP) have recently shown interest in the separator materials market for Li-ion batteries
but currently do not play any significant role in the global supply. EU-based Evonik (DE)
is among the new entrants on the market of separator materials [5]. Litarion (DE) has
manufacturing capacity to produce electrodes and ceramic separators for lithium-ion
battery cells, but the actual production volume for 2015 is unknown [29].

Figure 10: Left – Development of the separator market in 2005-2015 [5] and right – Regional
distribution of the separator producers in 2015 (Used with permission from Avicenne Energy [5]).

It is expected that the separator market for Li-ion batteries will continue to grow steadily
with CAGR of 12% reaching ca. 2700 Mm2 in 2025 [5]. A major contribution to this
growth will come from the needs of electric vehicles and buses (see Figure 11).

20
Figure 11: Projected separator market growth (Used with permission from Avicenne Energy [5]).

3.2.5 Future cell chemistries

Significant research effort is dedicated world-wide to the development of several future
cell chemistries which have the potential to outperform contemporary Li-ion cells.
Chemistries which are often identified as the ones capable of advancing battery
technology to beyond the Li-ion include:

       a) Lithium metal (Li metal) batteries

       b) Solid State batteries (SSB)

       c) Lithium-sulphur (Li-S) batteries

       d) Lithium-air (Li-air) batteries

The development status as well as challenges facing these chemistries are briefly
outlined in the following sections.

Li metal [30]

With a specific capacity more than ten times that of the LiC6 anode used in present-day
lithium-ion batteries, cells based on Li metal anodes are of particular interest. Effective

21
strategies for stabilizing the anode in such cells are required for progress on future storage technologies, including Li–S and Li–air batteries. Several challenges — parasitic reactions of Li metal with liquid electrolytes, unstable and dendritic electrodeposition, and dendrite-induced short circuits — derailed early efforts to commercialize lithium metal batteries. Recent research efforts to minimise reactions between the metal and electrolyte use surface coatings to alter the composition and ion transport properties of the solid electrolyte interface (SEI) layer and are expected to yield lithium-metal batteries based on layered hybrid electrolytes in which Li anodes, protected by an artificial SEI, coexist with conventional liquid electrolytes. Artificial SEI designs which can also be applicable to other reactive metal anodes, e.g. Na, Al or Zn, are of particular interest because these anodes exhibit similar parasitic reactions to Li. In the longer term, the inherent design flexibility that comes from the malleability of Li will be exploited allowing Li metal batteries to be lithographied, 3D printed, gelated from sols, or integrated into load-bearing structures through layer-by-layer deposition or self- assembly. Design of Li-metal anodes compatible with manufacturing outside the glove box will emerge as an area of high priority. Solid State batteries [31] Solid-state batteries (SSBs) that use solid electrolytes (SEs) (either inorganic or polymer) instead of liquid ones could offer both high energy and high power density. SEs allow transfer of lithium ions only and act as functional separators with only minor self- discharge (due to negligible electronic conductivity). Moreover, lithium ions and anions are mobile in liquid electrolytes, causing severe concentration gradients of the conducting salts during current flow and limiting the cell current, whereas only lithium ions are mobile in SEs so this bulk polarization cannot occur. As a result higher current densities and quicker charging times are conceivable in SSBs. Some inorganic solid electrolytes are stable at elevated temperatures, improving battery safety. The mechanical rigidity of SEs may prevent the dendrite formation that is caused by the electrodeposition of lithium, and thus facilitate the use of lithium-metal anodes. Despite fast growing interest in SSBs, many challenges remain in both manufacturing and fundamental understanding of the technology. For example, lithium-ion conductivity of the polymer electrolytes is too low for battery operation at room temperature, and the operation in electric vehicles requires temperatures above 80 °C. Even then, their rate capability is limited, preventing fast charging. Hence, the search for stable polymer electrolytes for use with lithium-metal anodes and lithium nickel cobalt manganese oxide 22
or lithium nickel cobalt aluminum oxide cathodes at ambient temperature at sufficient C-
rates is one of the challenges scientists and engineers face in the forthcoming years.

The major drawback of many inorganic SEs is their low thermodynamic stability. Most
solid electrolytes are easily reduced at low potentials (for example, by lithium metal) —
just like their liquid competitors — and oxidized at intermediate potentials. Protecting
interphases are therefore required to stabilize the electrolyte/electrode contact, as
happens in conventional lithium-ion batteries.

Li-S [32]

Li-S batteries based on abundant sulphur, high-capacity sulphur-containing cathodes and
lithium anodes are considered among the most promising candidates to achieve a low-
cost and high-energy-density system. Fundamental challenges facing Li-S batteries
originate from the insulating properties of elemental sulphur and lithium sulphides, the
dissolution of lithium polysulphides in the electrolyte, the volume change at the cathode
on cycling and the need to passivate membranes at the anode to inhibit dendrite
formation. Moreover, it is now widely realized that high sulphur loading electrodes are
essential for Li-S technology in the marketplace.

Li-air [33]

The Li-air battery, which uses oxygen from air, has the highest theoretical specific
energy density of any battery technology, 3,500 Wh/kg. Estimates of practical energy
storage are uncertain, as many factors are unknown, but values in the range 500 to
1,000 Wh/kg – sufficient to deliver significantly in excess of a 500 km driving range if
deployed in an electric vehicle battery – have been proposed. Despite significant
research over the past decade, there is a lack of a true understanding of the
underpinning chemistry and electrochemical processes in Li-air batteries. Li-air batteries
combine two challenging electrodes, Li metal and oxygen. Li-metal electrodes still do not
deliver the necessary cycling efficiency (ratio of discharge/charge capacity) and related
suppression of dendrites. Aprotic Li-O2 faces a number of challenges, not least of which
is the stability of the electrolyte solution and the cathode towards reduced oxygen
species. Also, the issue of air handling and filtering would need to be addressed by new
engineering solutions.

Technology evolution [34]

Given the numerous fundamental challenges facing the above-listed future battery
chemistries, and taking into account that time-to-market for new battery materials and

23
concepts has historically been shown to range between 10 and 20 years [5], projections
regarding the commercialisation timeline of the future technologies need to be made
with   caution.   According   to   the   German   National   Platform   for   Electromobility
contemporary Li-ion cells (generations 1 and 2a in Figure 12), largely based on LFP,
LMO, NCA and NMC cathodes and graphite or carbon anodes, will soon be gradually
substituted by generation 2b technology with nickel-rich cathodes and higher energy
density.

Another advance is to be expected with the introduction of Generation 3, which is
characterized by the use of carbon-silicon anodes. Generations 3a and 3b can be
expected to subsequently upper the cut-off voltage, which will lead to an increase in
energy density.

In the medium to long term, a doubling of range or halving of costs appears to be
possible especially with traction battery cells of Generation 4. If the challenges related to
solid state and lithium-sulphur technology (and other conversion chemistries (Generation
4)) are resolved, they can become important parallel technologies co-existing with
lithium-ion on the market (see Figure 12).

It is still largely an open question whether the theoretically proven advantage of the
higher energy density at the cellular level can be efficiently implemented at a battery
pack level. Therefore, at present a question whether and when a transition to "post"
lithium-ion technology (traction battery cells with conversion materials (Generation 4)
and lithium-air (Generation 5)) will take place in future cannot be answered with
certainty. From today's perspective advancement to solid state systems in the near
future (Generation 4) looks more likely.

For all of these chemistries no significant manufacturing base has yet been developed by
any global economy. This leaves a potential opportunity open for Europe to break-in to
cell manufacturing for chemistries where currently no significant barrier to entry exists.

24
Figure 12: Forecasted battery technology evolution [34]

25
3.3 Cell manufacturing

3.3.1 Cell manufacturing – current status
The total sales volume of Li-ion battery cells in 2015 was ca. 5,600 million cells
(equivalent to ca. 60 GWh) and the cell market value was ca. B$ 16.7, its compound
annual growth rate (CAGR) amounted to 22% for volume and 15% in value between
2005 and 2015 [5]. In 2015 approximately 31% of the total Li-ion battery cell sales,
equivalent to more than 18 GWh in volume and ca. B$ 5.3 in value, were used in
automotive applications [5]. This number excludes Li-ion battery cells for SLI (Starting,
Lighting and Ignition) application, which at present has a very minor market share, but
is expected to grow in the future [5].

Lithium-ion batteries were first commercialised in the early 1990s by Sony. Their uptake
grew rapidly as they delivered a superior performance relative to other rechargeable
chemistries deployed at the time. The surge in demand, in terms of number and product
range,   for   portable   electronic   devices   drove   the   corresponding   need   for   high
performance lithium ion batteries. Asian battery manufacturers' dominance in this
market positioned them favourably to respond quickly and competitively to the growing
demand. This allowed establishment of a strong manufacturing base in Asia, which later
enabled quick scaling up of the production volume, further development and optimisation
of the technology and diversification of their product range toward emerging markets,
including automotive [35]. Asian companies, notably Samsung SDI (KR), LG Chem (KR),
Sanyo-Panasonic (JP), Sony (JP) and BYD (CN) among others, dominate the Li-ion
battery cell manufacturing (see Figure 13) [5, 34, 35].

Cell manufacturers for automotive applications include Panasonic (JP), Samsung SDI
(KR), LG Chem (KR), AESC (JP), GS Yuasa (JP), Li Energy Japan (JP), BYD (CN),
Wanxiang (CN), Lishen Tianjin (CN) and Toshiba (JP) [26, 34, 36].

26
Company               Market volume           Company                 Market value in
                           in 2015,                                        2015,
                                                                           million US $
                           million cells

     Samsung SDI                   1376            Samsung SDI                     3000

     LG Chem                       1008            LG Chem                         2530

     SONY                           490            ATL                             1490

     ATL                            465            Sanyo-                          1125

     Tesla                          430            Panasonic
                                                   BYD                             1120

     Sanyo-                         408            SONY                            1040
     Panasonic
     Lishen                         290            Tesla                            970

     Coslight                       185            Lishen                           850

     BYD                            180            NEC                              520

     Maxell                          76            Coslight                         450

     BAK                             67            GS Yuasa                         210

     Other                          625            Other                           3395

     Total                         5600            Total                          16700

Figure 13: Market share of various Li-ion cell producers in 2015, left – in volume, right – in value.
(Used with permission from Avicenne Energy [5])

27
Table 2 illustrates the total completed, under construction and planned Li-ion cell manufacturing capacities in various regions in 2014 according to the data cited in reports of the US Clean Energy Manufacturing Analysis Center (CEMAC) [7, 37]. As can be seen, in 2014 the global manufacturing capacity for Li-ion battery cells for all applications was ca. 76.3 GWh and 88% of this manufacturing capacity was located in Japan, China and South Korea (see Table 2). Production capacity for automotive Li-ion cells was 27.5 GWh in 2014, 79% of which was located in Asia [7, 37]. A similar number for the global production capacity for automotive Li-ion battery cells - 27.2 GWh- is quoted by the German National Platform for Electromobility [34]. According to Avicenne Energy, the global production capacity for Li-ion battery cells for all applications was approximately 100 GWh in 2015, from which 40 GWh were for portable Li-ion cells and 60 GWh for all other applications including automotive [5]. In the time period from 2014 to 2016 the global manufacturing capacity for automotive Li-ion cells has increased significantly (compare Table 2 and Table 3) [6, 38]. Korea has increased its manufacturing capacity for automotive cells ca. 1.5 times, Japan ca. 2.4 times and China 2.7 times from 2014 to 2016. China plans further expansion of its manufacturing capacity for lithium-ion battery cells and has announced construction of extra 19.3 GWh manufacturing capacity in addition to its 30.4 GWh. Especially aggressive growth in the manufacturing capacity for automotive cells is observed in the USA, where an explosive growth of the manufacturing capacity increasing almost 10 times from 2014 to 2016 is observed thanks to construction of the Tesla Gigafactory. The fully commissioned manufacturing capacity of the EU has not changed significantly. Please note that 5 GWh capacity mentioned as "under construction" in the CEMAC reports [7, 37] refers to a new BMZ Li-ion battery manufacturing facility in Karlstein (DE) (see section 3.4). 28
Table 2: Annual manufacturing capacity of Li-ion cells worldwide in 2014 [7, 37]

               Fully        Partially       Under          Announced        Total                 Share       of   Automotive           Share       of
               commis-      commis-         construc-                       manufacturing         total global     manufacturing        global
                                                           (GWh)
               sioned       sioned          tion                            capacity*             capacity*        capacity*            automotive
                                                                                                                   (GWh)                capacity*
               (GWh)        (GWh)           (GWh)                           (GWh)

China          16.704       3.576           18.730         12.847           39.010                51 %             11.240               41 %

Japan          10.778       0               1.200          0                11.978                16 %             5.750                21 %

Korea          16.059       0               0              0                16.059                21 %             4.600                17 %

U.S.           3.770        0               1.200          35.0             4.970                 7%               4.600                17 %

EU**           1.798        0               0              0                1.798                 2%               1.300                5%

Rest      of   2.440        0               0              0.564            2.440                 3%               0                    0%
world

TOTAL          51.549       3.576           21.130         48.412           76.255                100 %            27.490               100 %

* includes fully commissioned, partially commissioned and under construction capacity; excludes announced capacity

**Please note that JRC analysis of the underlying data for the EU indicated that numbers for the EU include data on pack manufacturing [38].

29
Table 3: Annual manufacturing capacity of automotive Li-ion cells worldwide in 2016 [6, 38]
Fully Partially Under Announced Total Increase
commissioned commissioned construction (GWh) manufacturing compared to
(GWh) (GWh) (GWh) capacity* 2014
(GWh) (%)
China 11.152 3.038 16.244 19.246 30.434 271
Japan 13.623 13.623 237
Korea 6.570 6.570 143
U.S. 8.925 8.750 26.250 0.150 43.925 955
EU** 1.293 5.000 6.293 0
Rest of world 3.390 0.120 3.390 139
TOTAL 44.953 11.788 47.494 19.516 104.235
* includes fully commissioned, partially commissioned and under construction capacity; excludes announced capacity
**Please note that JRC analysis of the underlying data for the EU indicated that numbers for the EU include data on pack manufacturing; 5 GWh capacity
mentioned as "under construction" refers to a new BMZ Li-ion battery manufacturing facility in Karlstein (DE) (see section 3.4) [38].
30The EU does not have a significant manufacturing capacity for Li-ion battery cells and
published data on capacity and on actual production differ slightly depending on the
sources:
a) According to the US Clean Energy Manufacturing Analysis Center (CEMAC)
whose reports are based on data from Bloomberg New Energy Finance (BNEF), the total
production capacity of fully commissioned facilities in Europe was nearly 1.8 GWh/year in
2014 (corresponding to 2% in the global production capacity of Li-ion cells for all
applications) out of which 1.3 GWh/year were for automotive Li-ion cells (corresponding
to 5 % of the global production capacity of automotive Li-ion cells) (see Table 2) [7, 37].
(Please note that JRC analysis of the underlying data for the EU indicated that numbers
for the EU include data on pack manufacturing [38]).
b) In its "Roadmap integrated cell and battery production Germany" the German
National Platform for Electromobility indicates that EU's production capacity for large
format Li-ion cells for automotive and energy storage applications was 1.5 GWh/year in
2014 [34]. This number, based on Roland Berger's data, takes into account only an
estimate of production capacity of AESC (Nissan) facility in Sunderland (UK) [34].
c) According to the analysis of Avicenne Energy, manufacturing capacity for Li-ion
cells in Europe was nearly 1.5 GWh/year in 2015 [5], distributed over a number of
relatively small producers, however it quotes the actual production volume of Li-ion cells
in Europe at only ca. 350 MWh [5].
Compared with Asian counterparts the number and relative size of European Li-ion cell
manufacturing companies are significantly smaller. These manufacturers include (see
also Table 4):
SAFT, recently taken over by Total [39], is currently the largest active European
producer of Li-ion cells. Its manufacturing facility in Nersac (FR) has a production
capacity of 60 MWh/year [5, 40], however SAFT's actual production volume in
2015 was 84 MWh, exceeding its nominal capacity [5]. SAFT cells and batteries
are used for various applications including space, military and aircraft applications
[41].
ABSL Power Solutions in Culham (UK), recently acquired by EnerSys, is a
European manufacturer of Li-ion battery cells for space applications [42].
AGM Batteries Ltd. in Thurso (UK) develops and manufactures rechargeable Li-ion
cells and non-rechargeable lithium cells. Its production facility with capacity of 50
MWh supplies Li-ion batteries across a range of markets including defence, oil
and gas markets [43].
31You can also read