Report on the Unexpected Emissions of CFC-11 - Ozone Research and Monitoring - WMO-No. 1268 - WMO Library
←
→
Page content transcription
If your browser does not render page correctly, please read the page content below
Report on the
 Unexpected
 Emissions of CFC-11
 Ozone Research and Monitoring
WEATHER CLIMATE WATER

 WMO-No. 1268
REPORT ON UNEXPECTED EMISSIONS
 OF CFC-11

A Report of the Scientific Assessment Panel
 of the Montreal Protocol on Substances
 that Deplete the Ozone Layer

 Advisory Group
 David W. Fahey Paul A. Newman
 Paul J.B. Fraser John A. Pyle
 Neil R.P. Harris Bonfils Safari
 Jianxin Hu Michelle L. Santee

 Authors
 Martyn P. Chipperfield Matthew Rigby
 Michaela I. Hegglin Andreas Stohl
 Stephen A. Montzka Guus J.M. Velders
 Paul A. Newman Helen Walter-Terrinoni
 Sunyoung Park Bo Yao
 Stefan Reimann

 Contributors
 Peter F. Bernath Megan Lickley
 Martin Dameris Emmanuel Mahieu
 Sandip S. Dhomse Alistair J. Manning
 Geoffrey S. Dutton J. David Nance
 Eric L. Fleming Matthias Nützel
 Paul J.B. Fraser Eric A. Ray
 Bradley D. Hall Helen K. Tope
 Lei Hu Cathy M. Trudinger
 Patrick Jöckel Isaac Vimont
 James Keeble Luke M. Western

 Report Coordinator
 Sarah J. Doherty

Editorial, Graphics, and Reference Support
 Susan K. McFadden
 Amy K. Moran
 Chelsea R. Thompson
 Kathy A. Thompson
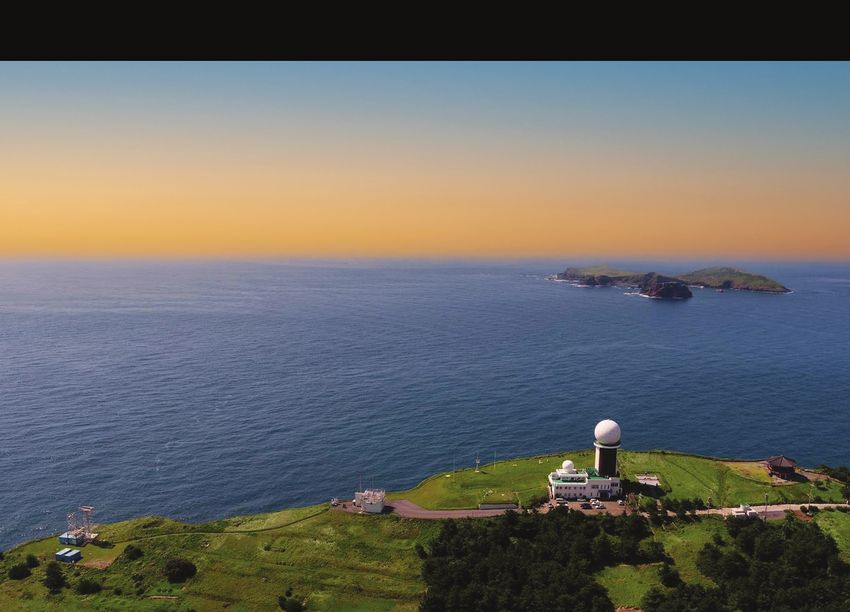
Cover illustration: The Gosan GAW Regional Station (Global Atmosphere Watch Programme of
the World Meteorological Organization), on the south-western tip of Jeju Island (Republic of
Korea), facing the East China Sea

WMO-No. 1268

© World Meteorological Organization, 2021

The right of publication in print, electronic and any other form and in any language is reserved
by WMO. Short extracts from WMO publications may be reproduced without authorization,
provided that the complete source is clearly indicated. Editorial correspondence and requests
to publish, reproduce or translate this publication in part or in whole should be addressed to:

Chair, Publications Board
World Meteorological Organization (WMO)
7 bis, avenue de la Paix Tel.: +41 (0) 22 730 84 03
P.O. Box 2300 Fax: +41 (0) 22 730 81 17
CH-1211 Geneva 2, Switzerland Email: publications@wmo.int

ISBN 978-92-63-11268-2

NOTE

The designations employed in WMO publications and the presentation of material in this
publication do not imply the expression of any opinion whatsoever on the part of WMO
concerning the legal status of any country, territory, city or area, or of its authorities, or
concerning the delimitation of its frontiers or boundaries.

The mention of specific companies or products does not imply that they are endorsed or
recommended by WMO in preference to others of a similar nature which are not mentioned or
advertised.

The findings, interpretations and conclusions expressed in WMO publications with named
authors are those of the authors alone and do not necessarily reflect those of WMO or its
Members.
CONTENTS

PREFACE ..................................................................................................................... V

EXECUTIVE SUMMARY .............................................................................................. VI
 ES.1 Key findings ................................................................................................... vi
 ES.1.1 CFC-11 emissions ..................................................................................... vi
 ES.1.2 Banks .................................................................................................... vii
 ES.1.3 CFC-12 and Carbon Tetrachloride Emissions ................................................... viii
 ES.1.4 Impacts of Recent CFC-11 Emissions .......................................................... ix

1. INTRODUCTION ................................................................................................... 1

2. OBSERVATIONS ................................................................................................... 3
 2.1 Overview of Global Measurement Capabilities ...................................................... 5
 2.1.1 Ground-based in situ networks .................................................................... 5
 2.1.2 Measurements by remote sensing ............................................................... 6
 2.2 Recent behaviour of CFC-11 in the global atmosphere .......................................... 7
 2.3 Regional measurements used to detect spatially resolved emissions ....................... 8

3. GLOBAL EMISSIONS .......................................................................................... 10
 3.1 Global CFC-11 emissions ................................................................................. 11
 3.2 On potential future global emissions of CFC-11 .................................................. 15
 3.3 CFC-12 global emissions ................................................................................. 16
 3.4 Global emissions of CCl4 .................................................................................. 17

4. REGIONAL EMISSIONS ...................................................................................... 22
 4.1 Methodology .................................................................................................. 22
 4.2 Regional CFC-11 emissions estimates 2008–2019 .............................................. 24
 4.2.1 East Asia ................................................................................................ 25
 4.2.2 United States of America .......................................................................... 28
 4.2.3 Australia ................................................................................................ 28
 4.2.4 India ...................................................................................................... 28
 4.2.5 Europe ................................................................................................... 28
 4.3 Regional emission estimates for related species ................................................. 29

5. CFC-11 SCENARIOS AND SENSITIVITY CASES ................................................... 30
 5.1 Scenarios in previous assessment reports ......................................................... 30
 5.2 CFC-11 scenarios and sensitivity cases ............................................................. 33
 5.2.1 Effects on EESC return dates .................................................................... 34
 5.2.2 Effects on radiative forcing of climate ......................................................... 39
6. MODELLED IMPACT ON THE STRATOSPHERIC OZONE LAYER ............................. 40
 6.1 Models and Simulations .................................................................................. 41
 6.2 Impact of increased CFC-11 emissions on current ozone levels ............................ 41
 6.3 Impact of increased future CFC-11 emissions on ozone levels .............................. 42
 6.4 Implications for future ozone recovery .............................................................. 43

APPENDIX A. HISTORICAL EVOLUTION OF THE ATMOSPHERIC MIXING
RATIO OF CFC-11 ..................................................................................................... 47

APPENDIX B. CFC-11 DATA FROM CAMPAIGNS ......................................................... 49
 B.1 Campaigns in specific regions and higher parts of the atmosphere ....................... 49
 B.2 Overview of Measurement Data from South Asian and East Asian Source Regions .. 49

APPENDIX C. CONSTRUCTING SCENARIOS ............................................................... 52

APPENDIX D. CFC-12 EMISSIONS ............................................................................. 54

APPENDIX E. CHEMICAL FORMULAE AND NOMENCLATURE ....................................... 55

APPENDIX F. ACRONYMS .......................................................................................... 56

APPENDIX G. LIST OF AUTHORS, CONTRIBUTORS, AND REVIEWERS ....................... 58
 Scientific Assessment Panel co-chairs ......................................................................... 58
 Advisory Group ........................................................................................................ 58
 Authors................................................................................................................... 58
 Report Coordinator ................................................................................................... 58
 Contributors ............................................................................................................ 58
 Reviewers ............................................................................................................... 58
 Editorial, Graphics, and Reference Support .................................................................. 58

REFERENCES ............................................................................................................. 59
PREFACE

This report has been written in response to Decision XXX/3: Unexpected emissions of
trichlorofluoromethane (CFC-11) of the Montreal Protocol, agreed upon in November 2018.
CFC-11 (CCl3F) was reportedly fully controlled under the Montreal Protocol since 2010. This
report augments and updates the Scientific Assessment Panel’s 2018 ozone assessment with
new and expanded scientific detail of CFC-11 emissions with respect to atmospheric monitoring
and modelling, and underlying assumptions in emission quantification. The Scientific
Assessment Panel convened a team of experts to write this report and arranged for two
separate peer reviews by independent scientists. The report was originally scheduled for
publication in late 2020 (as mandated in Decision XXX/3). However, it was delayed into early
2021 to allow for the inclusion of updated measurements and analysis provided in two
scientific publications released in February 2021 on CFC-11 emissions.

The report addresses: current and past observations of CFC-11 atmospheric abundances;
information on the CFC-11 global and regional emission increase and subsequent decrease;
changes derived for emissions of dichlorodifluoromethane (CFC-12, CCl2F2) and carbon
tetrachloride (CCl4); estimates of CFC-11 banks (CFC-11 that has been produced but has not
yet been emitted); scenarios of future emissions and atmospheric concentrations; and the
impact on the stratospheric ozone layer of the anomalous enhancement in CFC-11 emissions.
EXECUTIVE SUMMARY

Global CFC-11 emissions were expected to decrease steadily after 2010 because of the full
phaseout of production and consumption (see Figure ES.1, blue shading). Surprisingly,
however, CFC-11 emissions began to increase in 2013 and were high from 2014 to 2018
(Figure ES.1, purple line). After the publication of this emission increase in 2018, emissions
were substantially lower in 2019. A large fraction of the emission increase was attributed to
Eastern China based on regional emission estimates. These regional emissions also declined
substantially from 2017 to 2019. The increase in global CFC-11 emissions was not a result of
increased bank releases. The amounts of CFC-11 in banks and the release rates from the
banks remain highly uncertain (see Figure ES.1, blue shading). The increases in emissions
observed to date are small enough not to have a major impact on CFC-11 atmospheric
abundances, so they will not have a major impact on the expected stratospheric ozone
recovery. However, the increases in banks and how they might augment future emissions have
large uncertainties.

 Figure ES.1. Annual averaged global CFC-11 emissions derived from National Oceanic and
 Atmospheric Administration (NOAA) and Advanced Global Atmospheric Gases Experiment
 (AGAGE) observations (purple line and points). Expected bank emissions from a range of
 bottom-up inventory analyses of past uses, sales, and emission release functions (blue
 shading). Linear fit of emissions to observations over the 2002–2012 period (orange solid
 line). Extrapolation of this linear fit to the 2013–2019 period (orange dashed line). The
 purple-orange shaded area between the observations (purple) and extrapolation (orange
dashes) shows the lower limit of total emissions of 120 Gg (gigagrams) over the 2012–2019
period. Larger estimates for total unexpected emissions for 2012–2019 (440 Gg) are derived
 by comparing observed emissions with the expectations of the Technology and Economic
 Assessment Panel (TEAP) from bank-related emissions (blue shading). See section 3 in the
 main body for additional details.

ES.1 KEY FINDINGS

ES.1.1 CFC-11 emissions

 • The unexpected increase in global CFC-11 emissions first emerged in 2013 and
 continued until 2018; emissions then declined to pre-2013 levels in 2019
 (Figure ES.1). These emission changes are derived from atmospheric observations
 that enable estimates of globally averaged abundances and their changes inter-
 annually. The data are provided by the AGAGE and the NOAA global networks, which
REPORT ON THE UNEXPECTED EMISSIONS OF CFC-11 vii continually monitor the atmospheric abundances of CFC-11 and other ozone-depleting substances at remote sites across the globe (see section 3). o The unexpected increase in global CFC-11 emissions emerged in 2013 and was first reported publicly in 2018. By 2019, emissions had decreased to values consistent with those observed during the 2008–2012 period (see section 3). o The unexpected emissions were first detected as a slowing of the long-term decline in global CFC-11 abundances from 0.8% yr−1 (2002–2012) to 0.5% yr−1 (2014–2018) and as a concurrent increase in the hemispheric concentration difference (see sections 2 and 3). o Global CFC-11 emissions as derived on an annual basis from observations and highlight the important changes that occurred over the last decade (see Figure ES.1, section 3): In the initial publication announcing unexpected emissions, the mean value for 2014–2016 (67 ± 3 Gg yr−1) was estimated to be 13 ± 5 Gg yr−1 larger than for 2002–2012 (Gg = gigagram, 1 Gg = 1 kiloton = 109 g). In 2018, emissions were 70 ± 10 Gg yr−1, which were similar to the 2014–2017 mean. Emissions declined markedly in 2019 by 18 ± 6 Gg yr−1, which is 26 ± 9% lower than the mean values for 2018 and for 2014–2017. o Observations of interhemispheric differences in CFC-11 abundances strongly suggest that the sources of unexpected emissions from 2012 to 2018 were predominantly in the northern hemisphere (see section 2). o CFC-11 atmospheric concentrations declined by 0.8% yr−1 (2002–2012), then they declined more slowly, by approximately 0.5% yr−1 (2014–2018), then more rapidly again, by 0.7% yr−1 (2018–2019) (see section 2). • A large proportion of the increase in unexpected global CFC-11 emissions during 2014–2017 is attributed to Eastern China. These emissions decreased substantially between the 2014–2017 period and 2019. Regional emissions of trace gases can be derived from observations at sites located immediately downwind of source regions. The distribution and magnitude of sources are derived from concentration enhancements measured in pollution plumes. Relatively few regions of the world currently characterize emissions in this way (see section 4). o Regional CFC-11 emissions estimated in this way show a significant increase in emissions from Eastern China of 7 ± 4 Gg yr−1 between the 2008–2012 and 2014–2017 periods). This increase explains 60 ± 40% of the global increase in CFC-11 emissions between these periods (see section 4). o Emissions of CFC-11 from Eastern China declined by 10 ± 3 Gg yr−1 between the 2014–2017 period and 2019. This decrease accounts for 60 ± 30% of the global decline during the same period (see section 4). o Multiple lines of evidence suggest that the CFC-11 emissions increase from Eastern China was due to new production and use, not from an increase in emissions from pre-existing CFC-11 banks (see sections 3 and 5, TEAP [2019b]). ES.1.2 Banks • Current and future CFC-11 emissions are dependent on bank magnitudes and release rates. Estimates of the CFC-11 bank magnitudes are highly uncertain
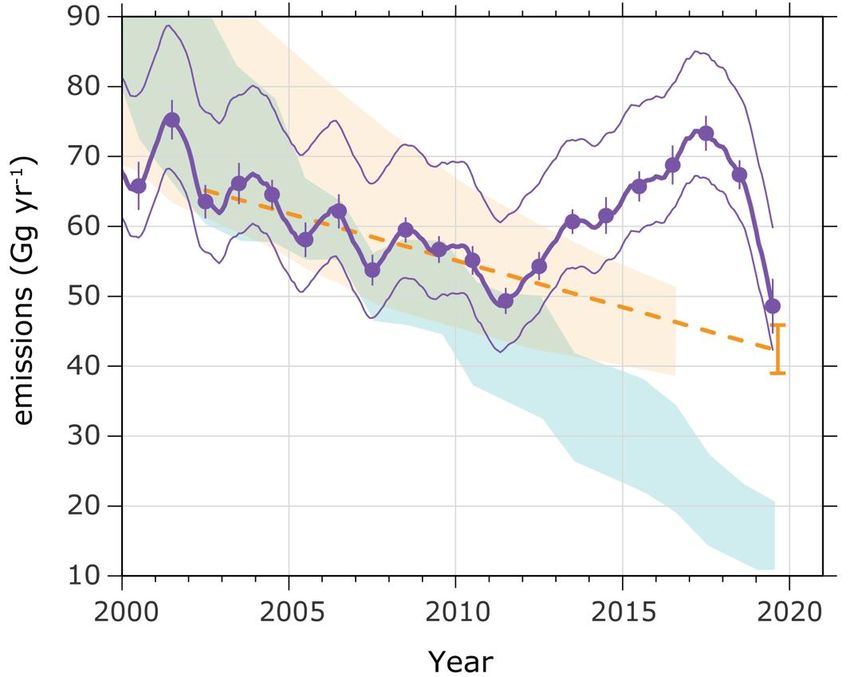
viii REPORT ON UNEXPECTED EMISSIONS OF CFC-11

 and it is difficult to assess the release rates from these banks and how they
 vary with time. Global CFC-11 emissions from the existing bank were expected to
 continually decrease after 2010 thanks to compliance with Montreal Protocol control
 measures. Non-compliance and unreported production since 2010 led to new emissions
 directly into the atmosphere and a likely enhancement of the bank. Although precise
 quantification of the bank enhancement is not possible at present, some estimates have
 been made (see sections 3 and 5).

 o A bottom-up analysis estimates a global CFC-11 bank as high as 1 475 Gg for 2018,
 while an analysis that uses both top-down and bottom-up information shows a bank
 range of 900–2 300 Gg for 2018 (neither analysis considered unreported
 production). Both analyses suggest that the elevated emissions during 2014–2018
 are unlikely to be from enhanced emissive losses from the pre-existing 2010 bank
 (see section 5).

 o Estimates based on top-down regional emissions suggest that the net increase in
 the bank size in 2019 for Eastern China was as large as 112 Gg (upper 95%
 uncertainty interval) due to new production between 2013 and 2018 (see
 section 4).

 • Quantifying unreported CFC-11 production in the last decade and its future
 impact on emissions more precisely requires an improved understanding of
 present-day bank emissions from pre-2010 production and the likely
 enhancement from unreported production since 2010.

 o The extent to which emissions in 2019 (Figure ES.1, orange purple shading) remain
 elevated above projected emissions from the 2010 bank (Figure ES.1, blue shading)
 is highly uncertain (1 to 50 Gg yr−1). This value is poorly constrained because of
 large emission uncertainties associated with pre-2010 production and how banks
 might have changed from 2010 to 2019 (Figure ES.1) (see section 3).

 o Relative to the global emission decline expected from the projected decrease in the
 global CFC-11 bank after 2010, a cumulative global emission enhancement of 120
 to 440 Gg is estimated up to 2019 due to unreported production (see Figure ES.1)
 (see section 3).

ES.1.3 CFC-12 AND CARBON TETRACHLORIDE EMISSIONS

 • Global CFC-12 (CCl2F2) emissions have declined since the mid-1990s, but the
 rate of decline was slower in the 2010–2017 period than in the 2000–2009
 period. There was a significant reduction in emissions after 2017. Unexpected
 CFC-12 emissions were a possibility together with the unexpected CFC-11 emissions
 increase, because CFC-12 is typically (but not necessarily) co-produced during the
 manufacture of CFC-11. Like CFC-11, CFC-12 is a primary ozone-depleting substance
 (ODS) and a powerful greenhouse gas (GHG). Reported CFC-12 production ceased by
 2010 under the Montreal Protocol, except for essential small-quantity exemptions to
 manufacture metered-dose inhalers (which were curtailed in 2015) (see section 3).

 o While global CFC-12 emissions decreased at 12 ± 2% yr−1 during 2000–2009, the
 mean decline slowed to only around 5 ± 2% yr−1 during 2010–2017 (see section 3).

 o Global CFC-12 emissions in 2019 were 21 ± 7 Gg yr−1, which is 38 ± 15% lower
 than estimated for 2018, indicating a significant reduction in global CFC-12
 emissions at a similar time to the decline in global CFC-11 emissions (see
 section 3).
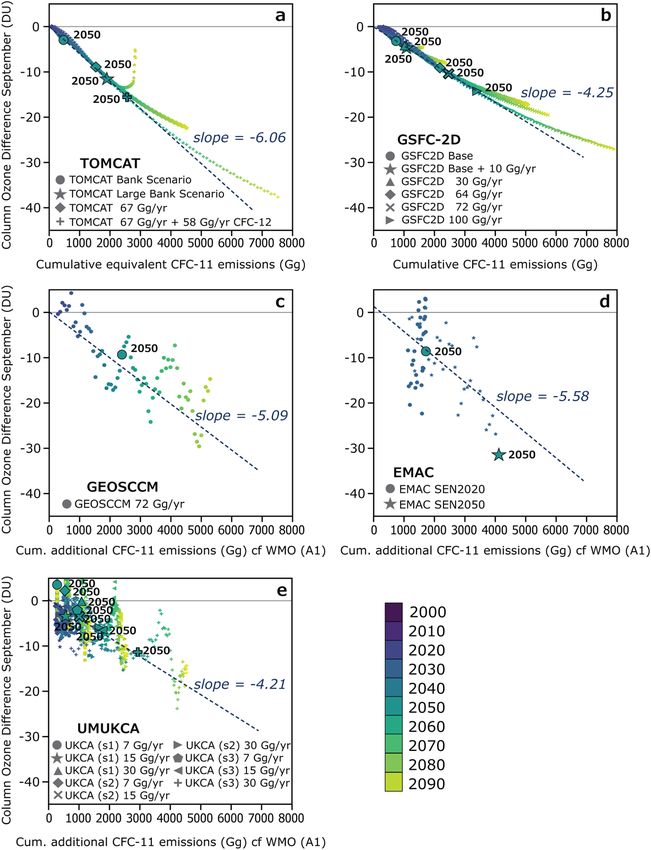
REPORT ON THE UNEXPECTED EMISSIONS OF CFC-11 ix
 o Regional CFC-12 emissions declined suddenly in around 2016 in Eastern China (see
 section 4).

 • Global carbon tetrachloride (CCl4) emissions did not decline in the 2010–2019
 period. Inverse analysis suggests that CCl4 emissions from Eastern China
 increased after 2012 and subsequently decreased in around 2017. CCl4, CFC-11,
 and CFC-12 can be co-emitted during CFC-11 production since CCl4 is a feedstock for
 CFC-11 and CFC-12 (see section 3).

 • Global CCl4 emissions did not significantly decline during the 2010–2019 period
 (0.1 ± 0.2 Gg yr−1), but they declined steadily in the previous 2000–2009 period
 (1.6 ± 0.3 Gg yr−1). Interannual changes in global emissions of CCl4 are not well
 correlated with changes in global emissions of CFC-11 after 2012, although
 year-to-year changes in CCl4 emissions have substantial uncertainties and are
 not consistently determined by the two networks. CCl 4 emissions have remained
 above expectations for many years (see section 3).

 o Regional emissions of CCl4 from Eastern China increased from 6.0 ± 1.4 Gg yr−1 for
 2011–2012 to 10 ± 2 Gg yr−1 for 2014–2017, then declined in 2017–2019 to values
 consistent with the 2011–2012 average (see section 4).

ES.1.4 Impacts of Recent CFC-11 Emissions

 • The anticipated recovery from stratospheric ozone depletion will not be
 substantially delayed by these enhanced CFC-11 emissions, because they were
 significantly elevated only for a brief period (2014–2019). If elevated emissions
 had persisted, they could have significantly delayed the recovery of the Antarctic ozone
 hole and the return of stratospheric chlorine (Cl) abundances to 1980 values. In light of
 the new results for 2019, a substantial ozone impact is no longer expected, assuming
 future compliance with the Montreal Protocol phaseout of CFC-11 production (see
 section 6).

 o The cumulative unexpected emissions of CFC-11 during 2012–2019 were
 120–440 Gg, which will increase stratospheric chlorine loading in future years by
 15–57 parts per trillion Cl and will have only a small impact on stratospheric ozone.
 The maximum future decrease in mean global column ozone is less than 0.3 Dobson
 units (DU) or 0.1% and the additional September Antarctic ozone loss is less than
 2.5 DU (1%). Ozone recovery, measured as a return to 1980 levels, is delayed by
 only 0.4–1.3 years globally and by 0.5–3.1 years for the Antarctic ozone hole (see
 section 6).

 o The additional CFC-12 and CCl4 emissions, possibly associated with the enhanced
 CFC-11 production, will lead to small additional impacts on future ozone depletion,
 delayed ozone recovery, and greater climate forcing (see sections 5 and 6).

 • The anticipated recovery of stratospheric ozone will also be delayed if
 substantial amounts of the unreported CFC-11 production were added to foam
 banks after 2010. TEAP analyses showed that the mostly likely use of the unreported
 CFC-11 production was for insulating foams. If true, this would result in additional
 CFC-11 in foam banks that would continue to augment future CFC-11 emissions above
 expectations (see sections 5 and 6).

 o Uncertainty in bank estimates and future emissions of CFC-11 (and potentially
 CFC-12) from these banks leads to a lack of precision in estimates of future ozone
 depletion associated with the unexpected CFC-11 emissions (see section 5).

 o Sustained CFC-11 emissions at the elevated 2014–2017 levels would have caused
 additional stratospheric ozone loss and led to an ozone recovery delay. The impact
x REPORT ON UNEXPECTED EMISSIONS OF CFC-11

 varies with region and is proportional to the total additional CFC-11 emissions.
 Globally, column ozone is 0.4–0.7 DU lower and 1980 return dates are delayed by
 3 years per 1 000 Gg of cumulative CFC-11 emissions. For the Antarctic, models
 show a near-linear decrease of 5 DU in springtime column ozone and a delay of
 4–7 years for September 1980 return dates per 1 000 Gg of cumulative CFC-11
 emissions (see section 6).

 • CFC-11 atmospheric abundances are projected to continue to decline in
 emission scenarios that assume future compliance with the Montreal Protocol.
 These scenarios also assume decreasing CFC-11 emissions from banks (see section 5).

 o The projected global cumulative CFC-11 emissions for 2020–2060 are 580–780 Gg
 (3–4 cumulative Gt of CO2 equivalent), based upon CFC-11 scenarios from previous
 assessments. The unexpected CFC-11 emissions after 2012 are projected to add an
 additional 60–200 Gg (0.3–1.0 cumulative Gt of CO2 equivalent) of emissions for
 2020–2060, depending on the assumed rate of release from the banks (Gt =
 gigatonne, 1 Gt = 109 tons = 1015 g) (see section 5).

 ____________
1. INTRODUCTION

Trichlorofluoromethane (CFC-11, CCl3F) is an ozone-depleting substance (ODS) controlled
under the 1987 Montreal Protocol, with atmospheric levels that have been declining since the
mid-1990s (WMO, 2018). However, Montzka et al. (2018) showed that the recent observed
CFC-11 decline rate was slower than expected – if developed and developing countries were
fully adhering to Montreal Protocol chlorofluorocarbon (CFC) consumption controls. This is a
summary report on this increase in CFC-11 emissions, which slowed the rate of decline of
atmospheric CFC-11 concentrations. The report further discusses the recent apparent return to
lower emission rates.

CFC-11 is primarily destroyed in the stratosphere by solar ultraviolet (UV) photolysis. The
majority (98%) is photolysed in the 190–230 nm wavelength range in the lower stratosphere
(15–30 km altitude). Approximately 2% is destroyed in a reaction with atomic oxygen (O(1D))
atoms in the troposphere (Burkholder and Mellouki, 2013). These loss processes result in a 52-
year CFC-11 atmospheric lifetime, with an uncertainty range of 43–67 years (SPARC, 2013).
Once CFC-11 emissions become negligible, atmospheric concentrations should decrease at
about 2% yr−1 and decline by 95% in 130–200 years (3 times the lifetime).

A “bottom-up” emissions inventory analysis shows that CFC-11 emissions increased steadily
from close to zero in the 1940s to about 350 Gg (Gg = gigagram, 1 Gg = 1 kiloton = 109 g)
per year (yr−1) in 1974 (see Figure 6.4 in TEAP/UNEP, 2019b). These “bottom-up” emission
models typically include CFC-11 production emissions, usage emissions from products
incorporating CFC-11, and end-of-life emissions. Following the publication of a scientific paper
in 1974 highlighting the ozone-destroying nature of CFCs (Molina and Roland, 1974), there
was a significant decrease in emissions, largely due to a ban in the United States of America
and several European countries on using CFC-11 as an aerosol propellant. Emissions fell below
300 Gg yr−1 in the 1979–1982 period. However, emissions subsequently increased again,
peaking in 1987 at about 350 Gg yr−1 due to growth in foam and refrigerant CFC-11 uses (see
Figure 6.4 in TEAP/UNEP, 2019b). The Montreal Protocol caused a steep decline in emissions,
beginning in 1987. Bottom-up analysis suggests that CFC-11 emissions should have steadily
declined from about 2000 onwards to less than 20 Gg yr−1 in 2019 (see Figure ES.1)
(TEAP/UNEP, 2019b).

The Montreal Protocol controls CFC-11 production and consumption, not emissions. Initially the
Protocol froze consumption and production at 1986 levels. Subsequent amendments led to a
100% phaseout of production by 1 January 1996 for non-Article 5 (“developed”) countries and
by 1 January 2010 for Article 5 (“developing”) countries. Atmospheric CFC-11 concentrations
derived from the NOAA and the AGAGE networks showed that atmospheric concentrations
peaked in 1993–1994 (Montzka et al., 1996; Cunnold et al., 1997) and have declined ever
since (Engel et al., 2018).

Montzka et al. (2018) showed that, after 2012, the rate of decline of the observed CFC-11
concentration became slower than expected, assuming developed and developing countries
were fully adhering to Montreal Protocol controls. This decline slowdown was contrary to
CFC-11 concentration projections by both WMO (2011) and WMO (2014). Using atmospheric
observations from the NOAA global network, the authors showed that the CFC-11 decline rate
slowed by approximately 50% after 2012. Their derived global emissions showed a 13 Gg yr−1
enhancement during 2014–2016 relative to the preceding decade (2002–2012) (see
Figure ES.1). They further showed that the likely source of some portion of this emission
increase was East Asia. This unexpected CFC-11 emission increase was not easily explained by
increased escape from banks1 or changes in atmospheric processes, and was therefore
probably the result of new production.

1 Hereafter, a bank is defined as CFC-11 that has been produced but has not yet been emitted, that is,
 the total amount of CFC-11 existing in products such as foam, equipment, stockpiles and landfills that
 will eventually escape to the atmosphere (most CFC-11 in landfills will not escape to the atmosphere
 (Scheutz et al. 2010; Hodson et al., 2010; Liu et al., 2017)).
2 REPORT ON UNEXPECTED EMISSIONS OF CFC-11

The WMO (2018) assessment concluded that global 2014–2016 CFC-11 emissions were higher
than the relatively constant 2002–2012 emissions by about 10 Gg yr−1, or around 15% (Engel
and Rigby, 2018). This assessment included AGAGE observations of CFC-11 (Prinn et al.,
2018), which confirmed the conclusions in Montzka et al. (2018), but revised the emission
increase downward slightly. Carpenter et al. (2018) also found that if total CFC-11 emissions
continued at 2002–2016 levels (67 Gg yr−1), the recovery of mid-latitude and polar equivalent
effective stratospheric chlorine (EESC) to their 1980 levels would be delayed by about 7 years
and 20 years, respectively.

The Parties to the Montreal Protocol responded to the findings of Montzka et al. (2018) with
Decision XXX/3: Unexpected emissions of trichlorofluoromethane (CFC-11). This decision
requested “the Scientific Assessment Panel to provide to the Parties a summary report on the
unexpected increase of CFC-11 emissions, which would supplement the information in the
quadrennial assessment, including additional information regarding atmospheric monitoring
and modelling, including underlying assumptions, with respect to such emissions; a
preliminary summary report should be provided to the Open-ended Working Group at its forty-
first meeting, a further update to the Thirty-First Meeting of the Parties and a final report to
the Thirty-Second Meeting of the Parties”.

The Montreal Protocol’s Scientific Assessment Panel convened a team of experts to write this
report, which examines current research and adds information on these unexpected CFC-11
emissions. In 2020, two new papers documenting a CFC-11 emission decrease were submitted
for publication (Montzka et al., 2021; Park et al., 2021). In order to include these new results,
the report authors asked the Parties to delay delivery of the final version of this report until
early 2021. The first version of this report was peer-reviewed in early 2020 and a second
review took place in early 2021.

This report is divided into six sections:

1. The introduction, with basic information and the background;

2. Current and past observations of CFC-11 atmospheric abundances along with a description
 of networks and observational techniques;

3. Global emissions derived from the network of observations at remote sites, with discussion
 of the transport process that could modify global emission estimates;

4. Regional emissions derived from observations at sites close to source regions and the
 analysis techniques, most specifically for East Asia;

5. Scenarios of CFC-11 emissions and surface concentrations, including descriptions of
 methodologies for estimating banks and determining future projections;

6. The modelled impacts of these unexpected emissions using state-of-the-art models that
 include chemical, radiative, and dynamical effects.

 ____________
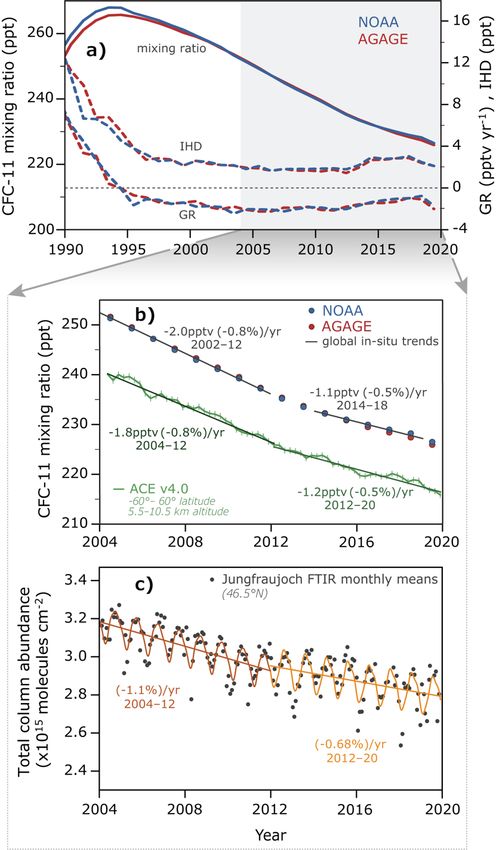
REPORT ON UNEXPECTED EMISSIONS OF CFC-11 3

2. OBSERVATIONS

Main points:

 • Globally representative networks have been essential in showing the benefit of the
 Montreal Protocol and its Amendments, which led to a decrease in tropospheric CFC-11
 mixing ratios from ~265 ppt2 in around 1994 to ~226 ppt in 2019.

 • The annual decline in the global growth rate remained relatively close to 2.0 ppt
 (0.8%) yr−1 between 2002 and 2012 before slowing down to approximately 1.1 ppt
 (0.5%) yr−1 between 2014 and 2018, then accelerating again between 2018 and 2019
 to 1.6 ppt (0.7%) yr−1.

 • The CFC-11 interhemispheric difference (IHD) in concentration increased from 1.8 ppt
 in 2012 to 2.9 ppt during 2014–2017, indicating increased emissions in the northern
 hemisphere during this period. These increases then slowed substantially in 2019 and
 the first part of 2020, when the interhemispheric difference returned more or less to its
 2012 value.

 • Pulses with elevated mixing ratios at regional atmospheric measurement sites indicate
 nearby anthropogenic emissions. The long-term behaviour of these pollution events can
 be used to assess trends of regional emissions on the continental scale. Elevated
 mixing ratios in pollution events measured at European and North American sites
 decreased or remained stable after the CFC-11 ban. At the Gosan station offshore of
 East Asia, measured distributions of elevated CFC-11 mixing ratios also remained
 unchanged from 2008 to 2012, then increased from 2013 to 2017 before decreasing in
 2018 and 2019.

 • Measurements of the oldest firn 3 air collected to date, from periods preceding
 anthropogenic CFC-11 emissions, show mixing ratios that are not significantly different
 from zero. This excludes the possibility of natural sources (e.g., volcanoes) having an
 influence on current CFC-11 mixing ratios.

This section provides an overview of the temporal and spatial evolution of CFC-11 over the
past five decades. The period covered extends from the period of unhindered production and
consumption to the introduction of a total ban on CFC-11 and up to the present day, including
the period of unexpected emissions. After the first, intermittent measurements of long-lived
halocarbons in the early 1970s, NOAA and AGAGE established globally representative
continuous measurement networks. These networks have been essential in establishing that
evolving ODS levels are influenced by stratospheric ozone depletion. Measurements are
ongoing and have been expanded: they no longer take place only at background sites, but also
at locations that are at least periodically under the influence of important source regions.

Measurement networks for ODSs span the globe (see Table 2.1 and Figure 2.1). In addition to
long-term in situ measurements within the surface-based NOAA and AGAGE networks,
aeroplane and balloon campaigns are used and remote sensing measurements are taken from
the ground and from satellites, adding a vertical dimension to measurements and producing a
more complete picture in terms of the breakdown of CFC-11 in the stratosphere (see
Figure 2.2). Additional measurements from Europe, the United States and East Asia are
available for assessing the influence of Montreal Protocol restrictions on emissions from these
regions (see Figure 2.3).

2 The mixing ratio is the dry air mole fraction and the unit ppt refers to parts per trillion (parts in 1012).
3 Ice that is at an intermediate stage between snow and glacial ice. Firn ice contains air in layers that
 can be used to estimate CFC-11 concentrations in the past.
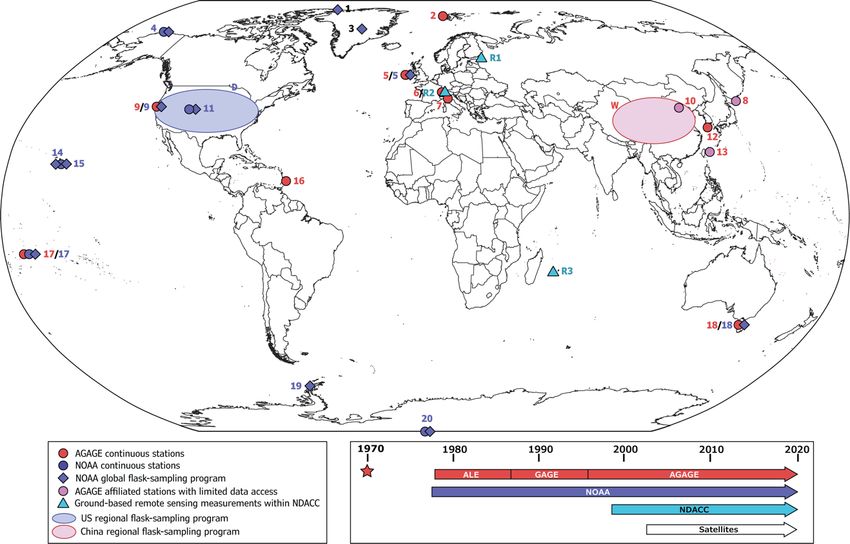
4 REPORT ON UNEXPECTED EMISSIONS OF CFC-11

 Table 2.1. Ground-based atmospheric observations of CFC-11 (see the map in Figure 2.1).
 AGAGE and affiliated stations are in red and NOAA observations in blue. Station instrument
sampling intervals are: C – continuous observation on-site; D – daily sampling using canisters
 and subsequent analysis in a central laboratory; and W – weekly sampling using canisters.

 Global in situ networks (NOAA/AGAGE)
 Sampling
 # Station Position, height a
 interval
 1 Alert, Canada 82.5°N, 62.3°W, 195 m W

 2 Zeppelin, Svalbard, Norway 78.9°N, 11.9°E, 475 m C

 3 Summit, Greenland, Denmark 72.60°N, 38.50°W, 3 217 m W

 4 Barrow, AK, United States 71.3°N, 156.6°W, 27 m C/W

 5 Mace Head, Ireland 53.3°N, 9.9°W, 18 m C/W

 6 Jungfraujoch, Switzerland 46.5°N, 8.0°E, 3 580 m C

 7 Monte Cimone, Italy 44.2°N, 10.7°E, 2 165 m C

 8 Cape Ochiishi, Japan 43.2°N, 145.5°E, 49 m C b

 9 Trinidad Head, CA, United States 41.1°N, 124.2°W, 120 m C/W

 10 Shangdianzi, China 40.7°N, 117.2°E, 393 m C b

 11 Niwot Ridge, United States 40.1°N, 105.6°W, 3 523 m C/W

 12 Gosan, Jeju Island, Republic of 33.3°N, 126.2°E, 71 m C
 Korea

 13 Hateruma Island, Japan 24.1°N, 123.8°E, 10 m C b

 14 Mauna Loa, HI, United States 19.5°N, 155.6°W, 3 433 m C/W

 15 Cape Kumukahi, HI, United 19.5°N, 154.8°W, 39 m W
 States

 16 Ragged Point, Barbados 13.2°N, 59.4°W, 42 m C

 17 Cape Matatula, American Samoa, 14.2°S, 170.6°W, 77 m C/C/W
 United States

 18 Cape Grim, Australia 40.7°S, 144.7°E, 164 m C/W

 19 Palmer Station, Antarctica 64.8°S, 64.1°W, 15 m W

 20 South Pole, Antarctica 90.0°S, 2 866 m C/W
 Regional in situ networks
 USA-based daily sampling 19 sites D

 China-based weekly sampling 7 sites W c

 Global remote sensing network (NDAAC)
 R1 Peterhof, St. Petersburg, Russia 59.9°N, 29.8°E, 20 m

 R2 Jungfraujoch, Switzerland 46.6°N, 8.0°E, 3 580 m

 R3 Maïdo, La Réunion, France 21.1°S, 55.4°E, 2 155 m

a Position information from http://www.gawsis.meteoswiss.ch/ and http://www.ndacc.org/
b AGAGE and AGAGE affiliated stations with data not available on public data centres
c AGAGE technique-based analysis instrumentation
REPORT ON UNEXPECTED EMISSIONS OF CFC-11 5

 Figure 2.1. Map of global ground-based CFC-11 observations: AGAGE and NOAA continuous
 measurements (red and blue filled circles, respectively), NOAA flask measurements (blue
 diamonds). AGAGE and AGAGE affiliated stations with data not available on public data
 centres: magenta circles; NOAA United States regional flask-sampling programme: blue
 shaded area (D: daily samples at 19 sites); China regional flask-sampling programme, pink
 shaded area (W: weekly samples); NDACC (Network for the Detection of Atmospheric
 Composition Change) ground-based remote sensing measurements (triangles).

2.1 OVERVIEW OF GLOBAL MEASUREMENT CAPABILITIES

2.1.1 Ground-based in situ networks

The first CFC-11 measurements were performed in the summers of 1970 and 1971 at Adrigole,
Ireland, using gas chromatography-electron capture detection (GC-ECD) (Lovelock, 1971,
1972). After early campaigns and cruises (see Appendix A), the Commonwealth Scientific and
Industrial Research Organisation (CSIRO) began to perform continuous in situ measurements
(4 times per day) of CFC-11 and other ODSs in late 1976 at Cape Grim, Australia (Fraser et
al., 1983). In 1977, NOAA began analysing weekly flask samples from five sites (Barrow,
Alaska, US; Niwot Ridge, Colorado, US; Mauna Loa, Hawaii, US; Cape Matatula, American
Samoa; South Pole, Antarctica) (Elkins et al., 1993). This was followed in mid-1978 by the
establishment of the ALE (Atmospheric Lifetime Experiment) programme, in which CFC-11 and
other ODSs were continuously analysed 4 times per day at five sites (Adrigole, Ireland; Cape
Meares, United States; Ragged Point, Barbados; Cape Matatula, American Samoa; Cape Grim,
Australia) (Prinn et al., 1983).

The observations used for emission estimates are from the NOAA and AGAGE networks. These
networks have been steadily developed and are currently analysing CFC-11 and other
halogenated compounds using GC-ECD and/or GC-mass spectrometry (GC-MS) at globally and
regionally representative sites (see Table 2.1 and Figure 2.1). These techniques, used for
ambient air analysis, were also used to analyse firn air samples (air trapped in the
intermediate stage between snow and glacial ice), yielding CFC-11 mixing ratios that go back
to the 1930s, prior to industrial-scale CFC-11 production. The earliest measured
concentrations in these samples were not statistically different from zero, which means there
6 REPORT ON UNEXPECTED EMISSIONS OF CFC-11

cannot be any major natural sources of CFC-11 (e.g., volcanoes). This is supported by recent
studies that found there were virtually no natural emissions of CFC-11 (see Appendix A).

The current NOAA global network (used in Montzka et al. (2018)) derives globally
representative averages with results from on-site instrumentation (5 sites, hourly frequency)
and flask sampling (12 sites, weekly frequency). This is further supported by a United States
flask-sampling network, in which samples are collected daily from tall towers (19 sites) and
approximately every 2-4 weeks from aircraft profiles (up to 8 km above sea level, at 15 sites)
(Hu et al., 2017). This flask sampling has enabled emission location mapping and emission
magnitude estimates across regions in the United States using inverse modelling techniques.
While daily flask sampling may reduce the resolution of information derivable around any one
site when compared with what is derivable from continuous in situ observations, multiple flask
collection sites combined with a single analysis instrument can provide broader geographic
coverage.

The ALE programme (1978–1981) evolved into GAGE (Global Atmospheric Gases Experiment,
1982–1992) and then AGAGE (1993–present). The current AGAGE network consists of nine
stations with identical gas chromatograph-mass spectrometers (GC-MS-Medusa; Miller et al.,
2008; Arnold et al., 2012) and three affiliated sites with similar measurement technologies
(Prinn et al., 2018).

Since 2010, CFC-11 has been measured in a regional flask network in China on a weekly basis,
also using the GC-MS-Medusa technology (Zhang et al., 2017). In addition, the University of
California, Irvine (UCI) has flask measurements of CFC-11 mixing ratios and other trace gases
in remote locations in the Pacific Basin dating back to 1979. CFC–11 data from the NOAA,
AGAGE and UCI networks CFC-are reported in Engel et al. (2018).

The NOAA and AGAGE networks perform regular inter-comparison exercises (Hall et al., 2014),
and conversion factors are well established for CFC-11, with minor differences between them,
in the range of 1 ppt (or 0.5%) from 2000 until the present. These data are further discussed
in section 2.2.

Apart from these long-term measurements, many campaigns have been performed in specific
regions of the world and at different altitudes of the atmosphere. A short overview of the
history of these activities is given in Appendix B1. Since a focal point of this report is newly
occurring emissions and their attribution to activities in Asia, Appendix B2 provides a
comprehensive overview of campaigns from this region of the world.

2.1.2 Measurements by remote sensing

In addition to in situ measurements, observations of the CFC-11 abundance within the
atmospheric column are possible using remote-sensing infrared spectroscopy techniques from
the ground and from space (see Figure 2.1).

The first CFC-11 ground-based remote-sensing retrievals were performed using Fourier
transform infrared (FTIR) at Jungfraujoch (Switzerland) (Zander et al., 2005), and these
retrievals are regularly updated (Engel et al., 2018). In addition, data from La Réunion island
(Zhou et al., 2016) and St. Petersburg (Polyakov et al., 2018) have recently been published.
All three sites belong to the global NDACC. Long-term satellite observations of CFC-11 column
abundances are available from the MIPAS (Michelson Interferometer for Passive Atmospheric
Sounding) instrument from 2002 to 2012 (Kellmann et al., 2012; Eckert et al., 2016). The
Atmospheric Chemistry Experiment Fourier Transform Spectrometer (ACE-FTS) satellite
instrument has provided mixing ratio observations of the stratosphere since 2004 (Steffen et
al., 2019). Infrared observations from the Atmospheric Infrared Sounder (AIRS) satellite
instrument also provide mid-troposphere CFC-11 observations (Chen et al., 2020). For a
discussion of both ground-based and space-based remote-sensing measurement data, see
section 2.2.
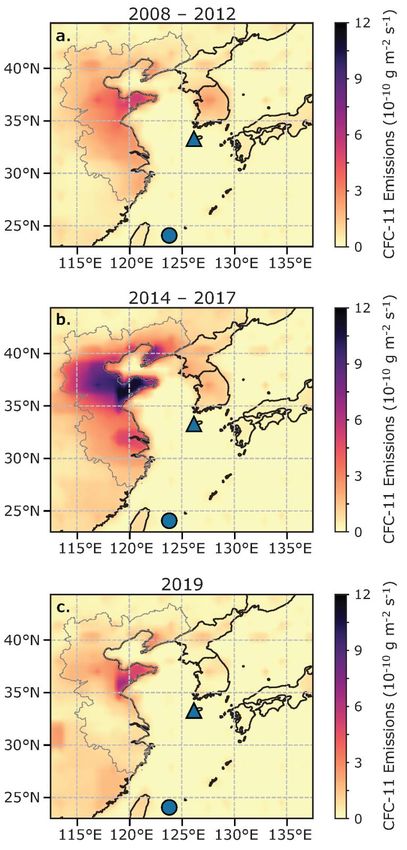
REPORT ON UNEXPECTED EMISSIONS OF CFC-11 7

2.2 RECENT BEHAVIOUR OF CFC-11 IN THE GLOBAL ATMOSPHERE

The CFC-11 globally averaged mixing ratio, its IHD in concentration, and its global
concentration growth rate (GR) were derived using concentration data from the AGAGE and
NOAA networks (see Figure 2.2(a)).

Figure 2.2. (a) CFC-11 mixing ratios, global GRs and the IHD from the NOAA (blue) and AGAGE
 (red) networks, for 1990–2019, adapted from Engel et al. (2018); (b) CFC-11 global volume
 mixing ratios and trends for 2004–2020, as retrieved from the ACE-FTS satellite instrument
 (v4.0, (green, adapted from Bernath et al., 2020)) compared with in situ measurements from
 panel (a), above; (c) northern hemispheric CFC-11 column abundances, based on surface-
 based remote sensing measurements at Jungfraujoch (update of Zander et al., 2005).

Results from both networks indicate that tropospheric CFC-11 mixing ratios peaked at
~265 ppt in around 1994 and have continuously declined since then, reaching ~229 ppt in
2017 (Engel et al., 2018) and ~226 ppt in 2019 (Montzka et al., 2021). The decline in the
CFC-11 annual mixing ratio remained relatively close to 2.0 ppt (0.8%) yr−1 between 2002 and
2012. However, due to new emissions, mainly from East Asia (Montzka et al., 2018; Rigby et
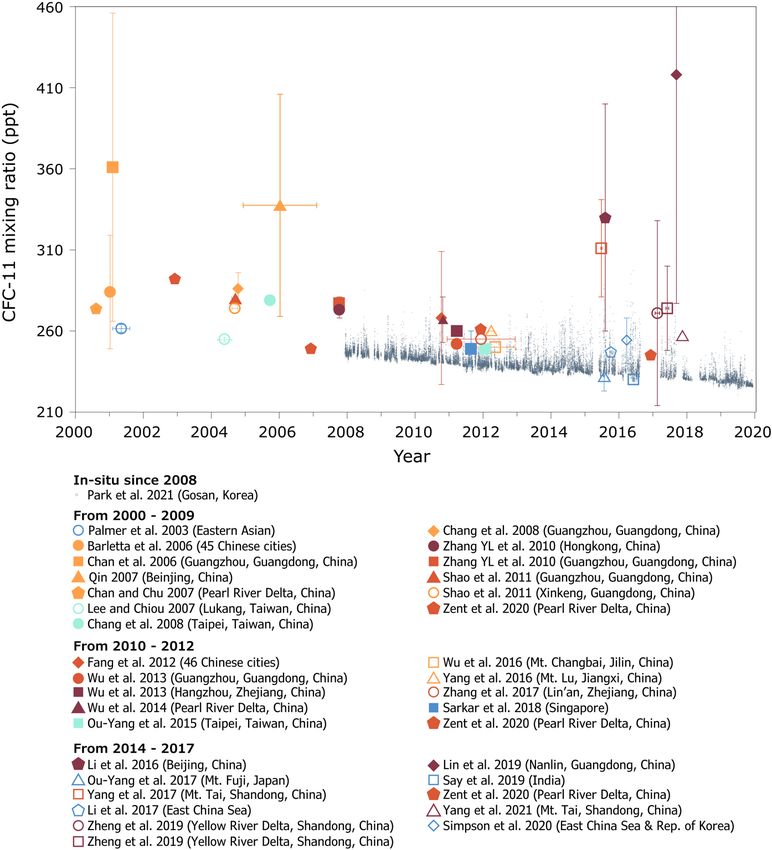
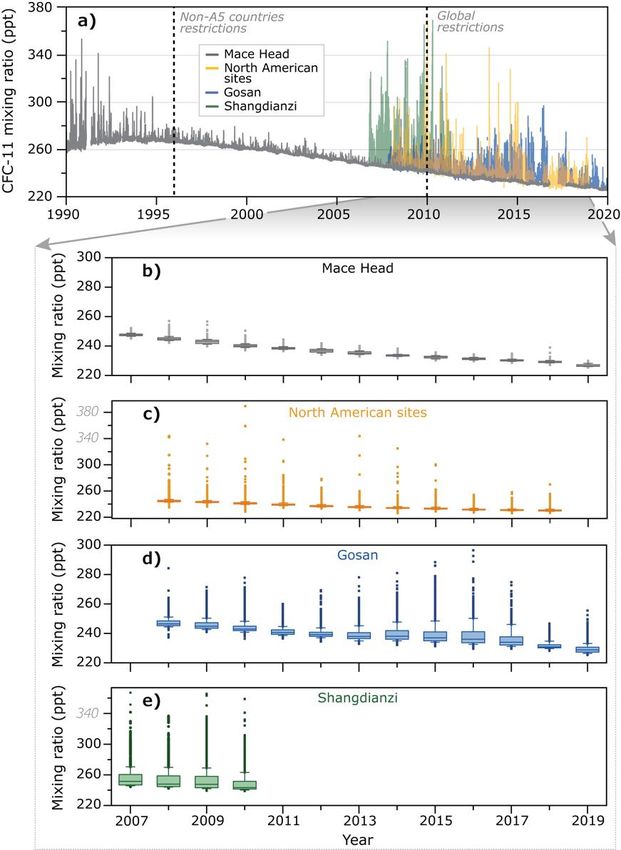
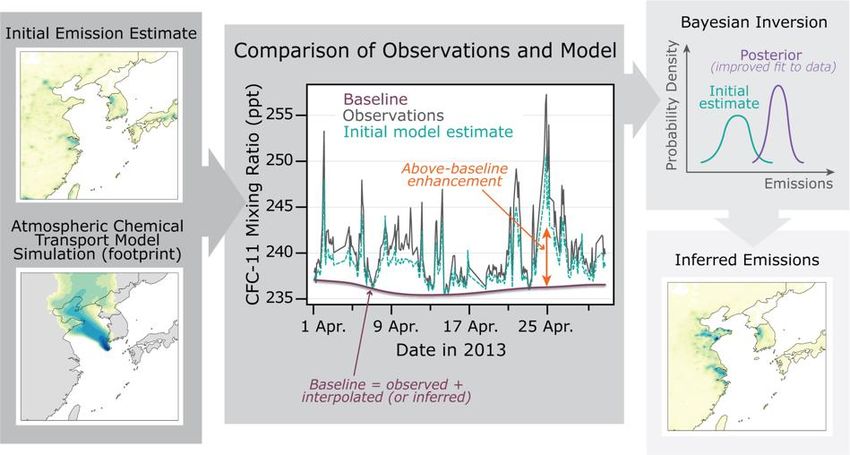
8 REPORT ON UNEXPECTED EMISSIONS OF CFC-11

al., 2019), the decline slowed to approximately 1.1 ppt yr−1 (0.5% yr−1) for 2014–2018. A
recent study by Montzka et al. (2021) shows that the decline accelerated to 1.6 ppt
(0.7%) yr−1 between 2018 and 2019, then to 2.3 ppt (1.0%) yr−1 by late 2019 and early 2020.
This is the lowest annual rate since measurements began in the 1970s, and is therefore a
strong indicator of the decline in emissions since 2018 (see also section 3). During the
2014–2018 emissions increase, the CFC-11 IHD widened from 1.8 ppt in 2012 to 2.9 ppt in
2014–2017, suggesting that new emissions originated from northern-hemisphere sources
during this period (Montzka et al., 2018). In 2019, the IHD shrank back to 2.1 ppt, providing
further evidence of a return to lower emissions in the northern hemisphere.

Since 2004, the ACE-FTS satellite instrument has shown a relative decrease in CFC-11
concentrations of 1.2% yr−1. That decrease has been substantially slower since 2012, at
around 0.5% yr−1 (see Figure 2.2(b)) (Bernath et al., 2020). ACE-FTS uses spectral
information to derive CFC-11 mixing ratios at altitudes of 5.5–10.5 km. Absolute mixing ratios
derived from ACE-FTS are lower than those from global in situ networks, but the relative
changes are very similar.

Northern hemispheric CFC-11 total column abundances measured using ground-based FTIR
spectroscopy (Jungfraujoch, Switzerland) also show a slowdown in the decline of abundances
in recent years, with a trend of −1.1% between 2004 and 2012 and −0.7% in the following
years (see Figure 2.2(c); update from Zander et al., 2005; Engel et al., 2018). These
observations are concurrent with the globally representative data shown in Figures 2.2(a) and
2.2(b). Although these measurements cover the whole atmospheric height in the northern
hemisphere mid-latitudes, the decline rates are similar to those from in situ measurements
and satellites.

2.3 REGIONAL MEASUREMENTS USED TO DETECT SPATIALLY RESOLVED
 EMISSIONS

Measurements close to source regions contain information on the behaviour of emissions from
specific regions before and after the CFC-11 phaseout date (see also section 4.2).
Concentrations measured at a given site are a combination of CFC-11 background
concentrations, the amount and location of emissions in the region, and the transport of those
emissions to the measurement site. CFC-11 emissions can come directly from production sites
(before the phaseout of production), places of usage (i.e. foam-blowing industries) and banks.
Mixing ratios above the background level are indicative of regional emissions within the range
of the monitoring site. These enhanced mixing ratios can be used to quantify emissions by
combining them with atmospheric transport models and statistical “inverse” techniques or
through interspecies correlation with a concurrently measured substance with known regional
emissions.

Time series of CFC-11 mixing ratios at a given site reveal the evolution of background
concentrations as well as spikes in concentrations from regional pollution events. This is shown
in Figure 2.3 for sites in Europe (Mace Head, Ireland), North America (several sites) and East
Asia (Gosan, Jeju Island, Republic of Korea; Shangdianzi, China). To enhance the visibility of
the temporal behaviour of pollution events against background measurements at the different
sites, the data are also shown in annually separated box-and-whisker plots for 2007–2019
(see Figure 2.3).

After the CFC-11 phaseout in non-Article 5 (developed) countries in 1996, mixing ratio
“spikes” above the background measured at the European Mace Head site decreased quickly
from a maximum of around 80 ppt in the early 1990s to around 10 ppt in 1995, one year
before the phaseout (Simmonds et al., 1996). Occasional pollution events are still detected at
Mace Head, although with very low enhancements above the baseline concentration. In North
America, CFC-11 measurements from a flask network programme (see section 2.1) show
occasional concentrations considerably elevated above background levels from 2008 to 2014
and decreasing pollution events afterwards (update of Hu et al., 2017). The difference
REPORT ON UNEXPECTED EMISSIONS OF CFC-11 9

between these two sites is the proximity of the North American sites to urban environments,
which have significant CFC-11 banks and emissions that decrease only slowly.

In East Asia, observed elevated CFC-11 mixing ratios in pollution events did not change at
Gosan from 2008 to 2012 or at Shangdianzi from 2007 to 2010. Shangdianzi measurements
are unavailable from mid-2011 due to local contamination. At Gosan, mixing ratios of CFC-11
during pollution events increased between 2013 and 2017, with episodic enhancements as
large as 50–70 ppt. These elevated concentrations have been attributed to an increase in
CFC-11 emissions from China during this period (Rigby et al., 2019). From 2018 onwards,
elevated CFC-11 mixing ratios decreased and were comparable to those in 2012. This suggests
a decline in emissions from Chinese sources, to which Gosan measurements are sensitive
(Park et al., 2021). Emissions derived from the measurements at these regionally influenced
sites are described in more detail in section 4.3.

 Figure 2.3. CFC-11 mixing ratios observed using in situ measurements at Mace Head, Ireland
(update of Simmonds et al., 1996); Gosan, Republic of Korea (Park et al., 2021); Shangdianzi,
 China (update of F. Zhang et al., 2010); and from flask measurements at multiple stations in
 North America (update of Hu et al., 2017). (a): Mixing ratios for all four regional sites.
(b)–(e): Box-and-whisker plots. Boxes indicate the 25th and 75th percentile of the individual
 measurement data, with the median shown as a horizontal orange line within each box. The
 whiskers above and below the boxes show the 10th and 90th percentiles. The dots indicate
 events outside this range.

 ____________
10 REPORT ON UNEXPECTED EMISSIONS OF CFC-11

3. GLOBAL EMISSIONS

Main points:

Global-scale total emissions are derived from regular measurements of atmospheric mole
fractions of CFC-11 at remote sites around the world, combined with an understanding of
atmospheric removals (lifetime). The resulting derived emissions indicate that:

 • Global emissions of CFC-11 unexpectedly increased by 13 ± 7 Gg yr−1 beginning in
 2013, from a mean value of 56 ± 10 Gg yr−1 during 2008–2012 to a mean of
 69 ± 10 Gg yr−1 during 2014–2017.
 o Estimates of this increase vary depending on the measurement network:
 11 ± 3 Gg yr−1 is derived from AGAGE measurements, and 17 ± 3 Gg yr−1 is
 derived from NOAA measurements.

 • Updated observations show a substantial drop in global emissions by 2019:
 o Global emissions in 2019 were 52 ± 10 Gg yr−1, which is 18 ± 6 Gg yr−1 (26 ± 9%)
 lower than global emissions in 2018.

 o Global emissions in 2019 were comparable to mean emissions during 2008–2012
 (56 ± 10 Gg yr−1), before the observed anomalous emission increase.

 o Global emissions in 2018 (70 ± 10 Gg yr−1) were not different from the mean
 emissions derived for 2014–2017.

In the absence of unreported production, global CFC-11 emissions from banks were expected
to decrease after 2010, so the full impact of unreported production and renewed use of CFC-11
since 2010 on future stratospheric ozone is more accurately estimated from the enhancement
of observed emissions above those expectations.

 • The extent to which 2019 emissions remain elevated above expectations is highly
 uncertain and could be anywhere from 1 to 50 Gg yr−1. This value is poorly constrained
 because of the large uncertainties in how rapidly emissions from banks created from
 pre-2010 production declined between 2010 and 2019.

 o If these bank emissions had continued to decline slowly after 2010 at the same rate
 that global emissions dropped during 2002–2012, the estimated emission
 enhancement remaining in 2019 from unreported production would be
 7 ± 6 Gg yr−1, that is, at the low end of the 1 to 50 Gg yr−1 range.

 o A more rapid decline in these bank emissions after 2010, as suggested by the
 Technology and Economic Assessment Panel inventory model, would suggest
 emissions well above expectations in 2019, at the upper end of the 1 to 50 Gg yr−1
 range.

 o Emissions during 2012–2019 were 70 Gg yr−1 higher than the mean emission rate
 during 2008–2012; relative to the expected emission decline from banks after 2010,
 cumulative emissions were enhanced by 120–440 Gg.

 • Inter-annual variations in atmospheric transport processes add uncertainty to global
 emission estimates, particularly over periods of one year; over longer periods
 (3–5 years), these uncertainties become smaller. An updated accounting of these
 influences suggests that emissions during 2014–2017 were 13 ± 7 Gg yr−1 higher than
 during 2008–2012; this estimate is comparable to the increase reported previously.
REPORT ON UNEXPECTED EMISSIONS OF CFC-11 11

 Furthermore, the 18 ± 6 Gg yr−1 (26 ± 9%) drop in CFC-11 emission between 2018
 and 2019 is estimated taking dynamical influences into account, otherwise the drop
 would be similarly large.

 • Global emissions of CFC-12 (which is typically, but not necessarily, co-produced with
 CFC-11) have declined since the mid-1990s. While global CFC-12 emissions decreased
 at approximately 12 ± 2% yr−1 during 2000–2009, they declined at only around
 5 ± 2% yr−1 during 2010–2017. Emissions in 2019 were 21 ± 7 Gg yr−1, which is
 significantly lower (by 38 ± 15%) than estimated emissions for 2018, suggesting a
 substantial drop in global CFC-12 emissions by 2019, as was observed for global
 CFC-11 emissions.

 • Global CCl4 emissions (a feedstock for CFC-11 production) declined from 2000 to 2009
 at 1.6 ± 0.3 Gg yr−1, but have not declined significantly since 2010 (approximately
 0.1 ± 0.2 Gg yr−1 during 2010–2019). The uncertainties associated with annual
 estimates and year-to-year changes in global CCl4 emissions preclude any robust
 assessment of global emission changes concurrent with those of CFC-11. Global CCl4
 emissions have remained elevated above expectations for many years.

 • The slower decline in global CFC-12 and CCl4 emissions during 2010–2017 may be
 related to the enhanced global production of CFC-11 inferred over this same period.

3.1 GLOBAL CFC-11 EMISSIONS

Ongoing concentration measurements of long-lived trace gases in the remote atmosphere can
be used to derive global emissions when considered together with annual losses (see Box 3.1).
In 2018, measurements at NOAA sites around the globe (see section 2.1.1) indicated that,
beginning in 2013, global CFC-11 emissions had unexpectedly increased and had remained
elevated until 2016, despite a reported phaseout of global production in 2010 (Montzka et al.,
2018). These findings were assessed and confirmed by results from the AGAGE Network (see
section 2.1.1) in Engel et al. (2018).

Updated global results in Rigby et al. (2019) indicated that emissions remained elevated until
2017 (Rigby et al., 2019). Average global emissions averaged from 2014 to 2017 were
80 ± 5 Gg yr−1 (NOAA) or 74 ± 5 Gg yr−1 (AGAGE) when derived with a 52-year lifetime
(Figure 3.1).
You can also read