Global Screen Production - The Impact of Film and Television Production on Economic Recovery from COVID-19 - A Study by Olsberg SPI
←
→
Page content transcription
If your browser does not render page correctly, please read the page content below
Global Screen Production –
The Impact of Film and Television Production
on Economic Recovery from COVID-19

 A Study by Olsberg•SPI

25th June 2020
Screen Production and Global Economic Recovery

CONTENTS
1.     Context and Purpose of the Study ......................................................................................... 3
     1.1.   Capturing the Benefits that Screen Production Delivers .................................................... 3
     1.2.   Evidence in this Study ..................................................................................................... 4
2.     Executive Summary .............................................................................................................. 5
     2.1.   About the Study.............................................................................................................. 5
     2.2.   Key Findings ................................................................................................................... 5
       2.2.1.       Global Screen Production Expenditure .................................................................... 5
       2.2.2.       Employment and Economic Impacts ....................................................................... 6
       2.2.3.       Comparable Sectors ............................................................................................... 6
       2.2.4.       The Speed of Spend ............................................................................................... 6
       2.2.5.       Impact on Business Sectors .................................................................................... 7
       2.2.6.       Strategic Use of the Screen Sector in Economic Rebuilding...................................... 9
3.     The Value and Economic Strength of Screen Production ...................................................... 10
     3.1.   Global Production Expenditure ...................................................................................... 10
       3.1.1.       The Value of Global Screen Production ................................................................. 10
       3.1.2.       Overview of Valuation Methodology ......................................................................11
       3.1.3.       Investment Sources and Global Flow..................................................................... 12
     3.2.   The Global Economic Impact of Screen Expenditure ....................................................... 14
       3.2.1.       Economic Impact ................................................................................................. 14
       3.2.2.       Employment and Job Creation .............................................................................. 15
       3.2.3.       The Value of Screen Sector Jobs ........................................................................... 15
       3.2.4.       Economic Output ................................................................................................. 16
       3.2.5.       Overview of Economic Impact Methodology ..........................................................17
       3.2.6.       The Scale of Comparable Sectors.......................................................................... 18
4.     The Unique Power of Screen Production Expenditure ........................................................... 20
     4.1.   A Rapid and Positive Recovery ....................................................................................... 20
     4.2.   The Magnitude and Speed of Spend .............................................................................. 20
     4.3.   Characteristics of the Sample Productions ..................................................................... 21
       4.3.1.       Major Film ........................................................................................................... 21
       4.3.2.       Mid-Budget Film .................................................................................................. 22
       4.3.3.       Low-Budget Film ................................................................................................. 22
       4.3.4.       High-End Television Series ................................................................................... 23
       4.3.5.       Mid-Budget Television Series ............................................................................... 23
     4.4. Economic Impact of Resuming Production ..................................................................... 24
5.     The Impact of Production Spending Across Economic Sectors .............................................. 25
     5.1.   Economic Impacts ......................................................................................................... 25
     5.2.   Breadth of Impact Across Business Sectors .................................................................... 25

© Olsberg•SPI 2020                                          25th June 2020                                                                  ii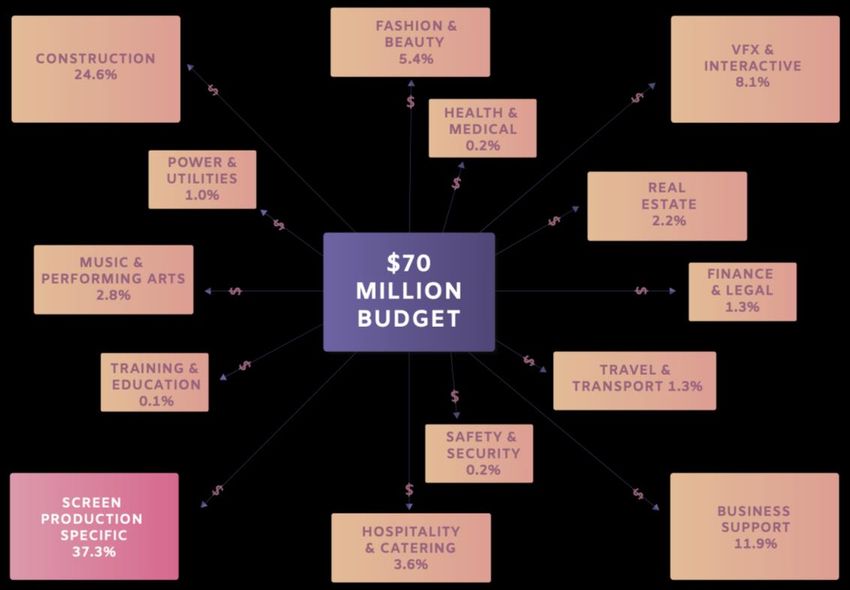
Screen Production and Global Economic Recovery

     5.3.   Analysis of Individual Projects........................................................................................ 27
        5.3.1.      Major Film ........................................................................................................... 28
        5.3.2.      Mid-Budget Film .................................................................................................. 28
        5.3.3.      Low-Budget Film ................................................................................................. 29
        5.3.4.      High-End Television Series ................................................................................... 29
        5.3.5.      Mid-Budget Television Series ............................................................................... 30
     5.4.   Categorisation of Business Sectors ................................................................................ 30
        5.4.1.      Screen Production-specific ................................................................................... 30
        5.4.2.      Business Support ................................................................................................. 30
        5.4.3.      Construction ........................................................................................................ 31
        5.4.4.      VFX & Interactive ................................................................................................. 31
        5.4.5.      Real Estate .......................................................................................................... 31
        5.4.6.      Travel & Transport ............................................................................................... 31
        5.4.7.      Hospitality & Catering .......................................................................................... 31
        5.4.8.      Finance & Legal ................................................................................................... 31
        5.4.9.      Fashion & Beauty ................................................................................................. 31
        5.4.10.     Music & Performing Arts ...................................................................................... 32
        5.4.11.     Power & Utilities .................................................................................................. 32
        5.4.12.     Safety & Security ................................................................................................. 32
        5.4.13.     Training & Education ............................................................................................ 32
        5.4.14.     Health & Medical.................................................................................................. 32
6.      The Impact of COVID-19 on Global Screen Production ......................................................... 33
     6.1.   Overview ...................................................................................................................... 33
     6.2. The Scale of Economic Damage ..................................................................................... 33
     6.3.   The Economic Impact of the Global Production Shutdown .............................................. 34
        6.3.1.      Economic Output ................................................................................................. 35
        6.3.2.      Employment ........................................................................................................ 35
     6.4. Screen Sector Recovery in Previous Recessions .............................................................. 35
        6.4.1.      United States ....................................................................................................... 35
        6.4.2.      Conclusions ..........................................................................................................37
     6.5.   The Strategic Value of Screen Production in Economic Recovery .....................................37
7.      The Global Deluge of Screen Production .............................................................................. 40
     7.1.   The Global Production Market ....................................................................................... 40
     7.2.   Production Growth in Streaming and Online .................................................................. 42
        7.2.1.      Global Subscription Growth .................................................................................. 42
        7.2.2.      Internationally-Financed, Locally-Created Content................................................ 43
     7.3.   The International Market for Portable Productions ......................................................... 43
     7.4.   The Production Location Decision ................................................................................. 43

© Olsberg•SPI 2020                                          25th June 2020                                                                 iii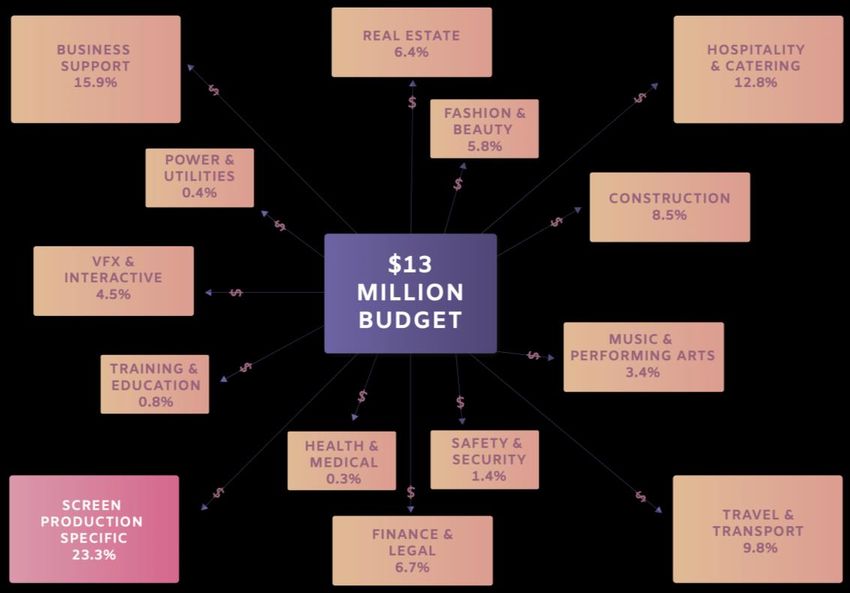
Screen Production and Global Economic Recovery

8.      Summary of Previous SPI Studies ........................................................................................ 45
     8.1.    The Global Production Deluge (February 2020) .............................................................. 45
     8.2.    Best Practice in Screen Sector Development (September 2019) ...................................... 45
     8.3.    Global Film Production Incentives White Paper (June 2019): ........................................... 47
     8.4. Creative Industries Ripple Effect (July 2017).................................................................... 48
     8.5. Screen Business – The Economic Contribution of the UK Tax Relief-supported Screen
     Sectors (October 2018) ........................................................................................................... 49
9.      Appendices ........................................................................................................................ 52
     9.1.    Appendix One: Acknowledgments ................................................................................. 52
        9.1.1.       Study Authors ...................................................................................................... 52
        9.1.2.       About Olsberg•SPI ............................................................................................... 52
     9.2. Appendix Two: Production Expenditure Valuation Methodology..................................... 54
        9.2.1.       Data Sources ....................................................................................................... 54
        9.2.2.       Currency Conversion ............................................................................................ 55
        9.2.3.       Data Years ........................................................................................................... 55
        9.2.4.       US Production Data.............................................................................................. 55
        9.2.5.       Factoring in 2019 Production Uplift ....................................................................... 56
        9.2.6.       Assumptions Regarding Regional Sub-Totals ........................................................ 56
        9.2.7.       Film and Television Spending ............................................................................... 57
        9.2.8.       Licensing and Television Production Costs ............................................................ 57
        9.2.9.       Separating Library Rights from Total Licensing Spend ........................................... 57
        9.2.10.      Amortisation Assumptions ................................................................................... 57
     9.3.    Appendix Three: Economic Impact Methodology ........................................................... 59
        9.3.1.       Data Gathering .................................................................................................... 59
        9.3.2.       Sourcing the Direct Economic Impact Data ........................................................... 59
        9.3.3.       Applying the Multipliers ....................................................................................... 59
     9.4. Appendix Four: Bibliography ......................................................................................... 61

© Olsberg•SPI 2020                                           25th June 2020                                                                iv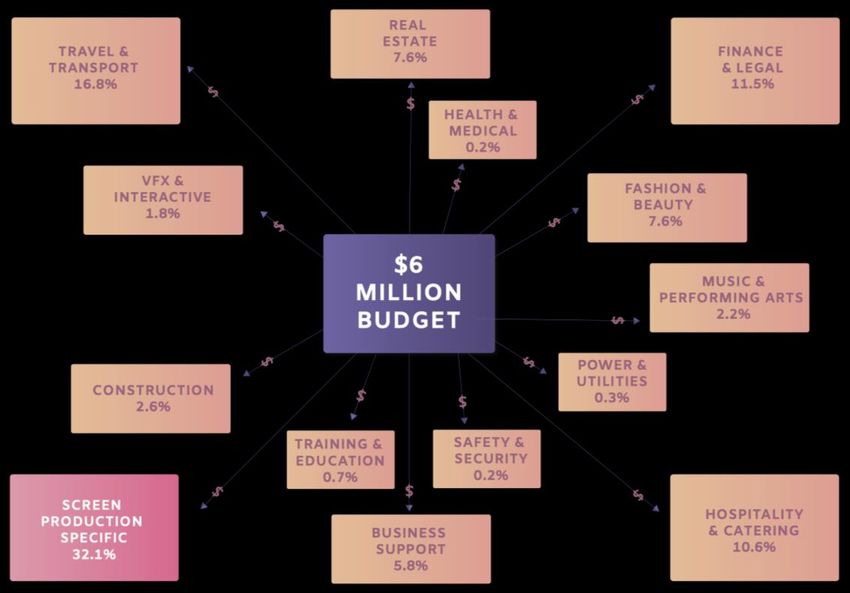
Screen Production and Global Economic Recovery

     This independent study has been researched and written by Olsberg•SPI,
     with the support of Media Business Insight and Netflix.1

     SPI would also like to thank the global film commissions and producers that
     provided survey and other data.

     The study is endorsed by these leading film commission associations and networks,
     representing intergovernmental bodies around the world :

         •    Asian Film Commissions Network (AFCNet);
         •    Association of Film Commissioners International (AFCI);
         •    European Film Commissions Network (EUFCN); and
         •    Latin American Film Commission Network (LAFCN).

     1Media Business Insight is a content, insight and events business for the creative media industry. The company’s
     brands include Screen International and Broadcast. https://www.mb-insight.com/

© Olsberg•SPI 2020                              25th June 2020                                                     1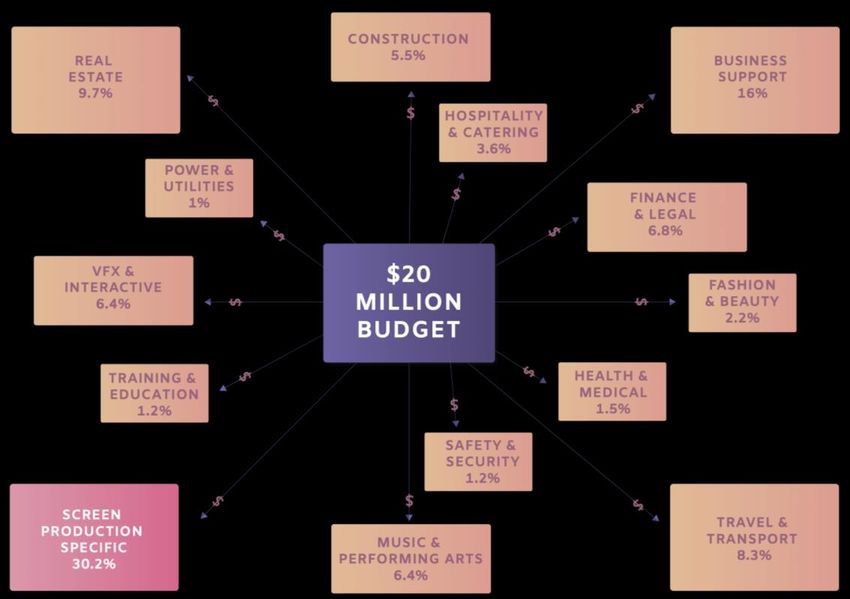
Screen Production and Global Economic Recovery

                          Key Findings
                               •   Driven by voracious consumer appetite and major
                                   investment, the production of feature-length films
                                   and multi-part television series (“Screen Production”)
      $177 billion                 has increased substantially around the world in recent
    Value of global Screen         years. It is now a key economic driver in a large
   Production expenditure          number of countries and jurisdictions.
           in 2019
                               •   In 2019, global expenditure on Screen Production
                                   reached $177 billion. This includes investment in
                                   scripted film and television and documentaries, but
                                   not sport, news or commercials.
        14 million             •   Screen Production has a significant impact and the
   Total number of FTE jobs        sector drives employment in the global screen sector
     created by the global         value chain – creating 14 million full-time equivalent
   screen sector value chain       (FTE) jobs in 2019. Total economic impact of the
            in 2019                Screen Production sector was $414 billion last year.
                               •   The global flow of Screen Production investment is
                                   highly positive for economies around the world. For
                                   regions outside the US, the amount of investment
       $414 billion                that originates regionally is less than the amount
                                   ultimately spent on Screen Production in the region.
   Total economic impact of
   global Screen Production    •   Detailed analysis of production budgets and cost
            in 2019                reports shows that Screen Productions inject huge
                                   amounts of capital very rapidly into an economy.
                                   Analysis of a major film shows that an average of $10
                                   million per week was spent during a 16-week shoot.
                               •   This spend positively impacts other sectors to a
                                   significant degree. On average, 67% of production
       $10 million                 costs are spent in other business sectors outside of
     Weekly spend of an            Screen Production.
  example major film during
      16-week shoot            •   In 2019, Screen Production spending reached a new
                                   high watermark, which would very likely have been
                                   exceeded in 2020 – given that trends in rising
                                   production volume and value were ongoing – had the
                                   COVID-19 pandemic not dramatically impacted
            67%                    production worldwide.
    Average proportion of      •   Overall, the COVID-19 shutdown has led to a loss of
   production costs spent in       10 million global screen sector value chain FTE jobs
    other business sectors         and $145 billion in economic impact over in the first
      outside of Screen            six months of 2020 – though the impact is likely to be
         Production                temporary as production resumes.
                               •   Given the demonstrable power of Screen Production
                                   to deliver substantial spend in a short space of time, it
                                   will be a powerful sector for driving economic
                                   recovery in many territories. A number of
                                   governments are already looking at Screen
                                   Production for this purpose.

© Olsberg•SPI 2020                  25th June 2020                                             2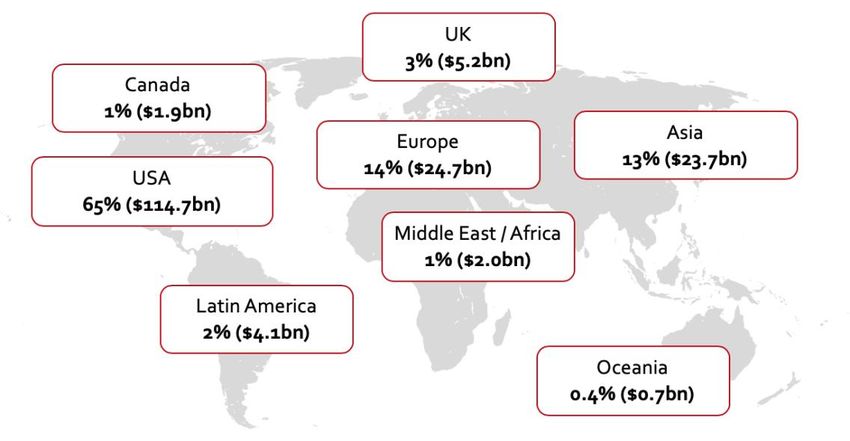
Screen Production and Global Economic Recovery

     1. CONTEXT AND PURPOSE OF THE STUDY
     In recent years, Olsberg•SPI (“SPI”) has observed the phenomenon of the global Screen
     Production “deluge” across the world: the dynamic expansion of content creation for screens
     of all sizes.2 A driving motivation of this has been to stimulate and meet the worldwide growth
     in demand for scripted drama delivered across many streaming services. Until the COVID-19
     pandemic occurred, growth in this economic activity had been ground-breaking.
     Governments of all sizes and descriptions have increasingly recognised and valued the
     considerable economic benefits delivered by such activity. As a type of specialised and fleet-
     footed manufacturing activity, it creates modern, highly skilled, productive and mobile
     employment. It also typically delivers an attractive return on public investment alongside a
     variety of other economic measures. It increases inward investment, stimulates tourism, helps
     national branding, and enhances soft power.
     These economic benefits sit alongside the many cultural impacts – such as enriching a nation’s
     sense of itself – delivered by the screen ecosystem. These benefits have been recognised for
     decades and have often been the starting point for government strategies addressing
     the sector.
     Accordingly, public policies have been implemented around the globe to stimulate greater
     levels of domestic and internationally-sourced productions, most noticeably the extremely
     effective tool of automatic (i.e. non-selective) fiscal incentives such as cash rebates and tax
     credits. These are a cornerstone of the strategy for the sector and their use has grown to the
     point where there are now almost 100 such automatic incentives in operation globally.
     Against this backdrop, governments around the world now face considerable economic
     challenges posed by the need for recovery from the COVID-19 pandemic.
     The intent of this analysis (the “Study”) is therefore to provide a robust demonstration of the
     global economic power of Screen Production and examine its potential to assist economic
     recovery in the wake of COVID-19. This Study shows how maintaining and encouraging Screen
     Production at a national, regional and local level is one of the solutions to rejuvenating
     economies across the world.
     1.1.       Capturing the Benefits that Screen Production Delivers
     The information and evidence in this Study build on a number of reports published by SPI in
     recent years, containing recommended actions for governments to maximise the economic
     benefits of Screen Production. The studies also reflect on and explain different aspects of the
     ecosystem, largely to demystify the economic characteristics of this sector. A selection of
     these are set out below and a summary of the findings of and links to these studies, including
     identification of some successful policy initiatives, is found in Section 8.
            •    The Global Production Deluge (February 2020): An evidence and discussion paper
                 exploring the opportunities and challenges faced by Screen Production at the time of
                 a worldwide content investment boom.3
                 Link: https://www.o-spi.co.uk/wp-content/uploads/2020/03/Global-Production-
                 Production-Deluge-Evidence-and-Discussion-Paper-Final-2020-02-25.pdf
            •    Best Practice in Screen Sector Development (September 2019): A report examining
                 effective strategies and policies used by governments around the world to maximise
                 their share of the high-value Screen Production market. The research provides insight
                 into the methods that established and emerging markets alike use to successfully build

     2 “Screen Production”   refers to the production of feature films, television drama and factual television
     3 Commissioned by Film i Väst in co-operation with Göteberg Film Festival’s Nostradamus project and in association
     with Cine-Regio

© Olsberg•SPI 2020                                  25th June 2020                                                   3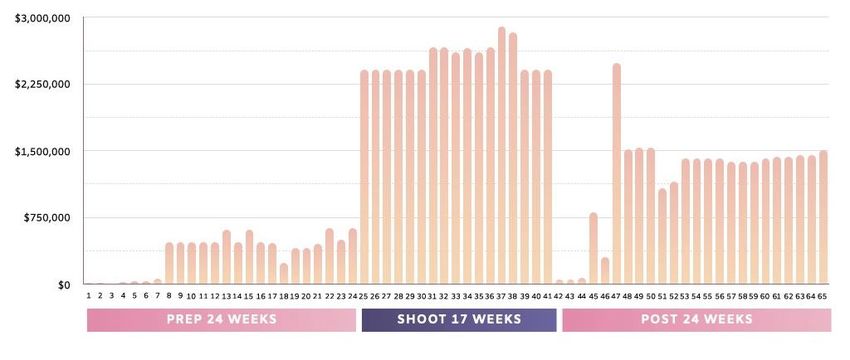
Screen Production and Global Economic Recovery

                 competitive screen sectors, and contains best practice findings for automatic
                 incentives, workforce capacity, capacity building in physical infrastructure and
                 services, and film-friendliness.4
                 Link: https://d2pr6jkptl5mr9.cloudfront.net/afci/media/2019/10/08224749/AFCI-Best-
                 Practice-Study-2019-09-13-Final-Cover.pdf
            •    Global Film Production Incentives White Paper (June 2019): A report providing
                 detailed insight into the growth of Screen Production incentives worldwide. With
                 nearly 100 such systems operational globally, the White Paper outlines their function
                 and impact in select jurisdictions and identifies key trends in their usage and
                 formulation.5
                 Link:       https://www.o-spi.co.uk/wp-content/uploads/2019/06/Olsberg-SPI-Global-
                 Incentives-White-Paper-Final-2019-06-04.pdf
            •    Film and the Creative Economy: How Film and Television Drama Productions Grow
                 the Creative Industries (July 2017): This report quantifies a previously unmeasured
                 economic impact derived from feature film and television drama production
                 expenditure. It demonstrates that Screen Productions drive a significant (and perhaps
                 unexpectedly large) amount of activity in the other creative industries.6
                 Link: https://www.o-spi.co.uk/wp-content/uploads/2017/07/SPI-Creative-Industries-
                 Report-2017-07-31.pdf
     In addition, and alongside many other consultancies, SPI has undertaken a number of
     economic impact studies that identify a range of metrics typically used when governments are
     assessing the comparative value of the sectors that they are keen to support. An example is:
            •    Screen Business – How Screen Sector Tax Reliefs Power Economic Growth Across the
                 UK (October 2018): An analysis of the UK’s Screen Sector Tax Reliefs demonstrating
                 the vital impact which production and development supported by the Screen Sector
                 Tax Reliefs has on the UK’s economy.7
                 Link:      https://www.o-spi.co.uk/wp-content/uploads/2018/10/Screen-Business-Full-
                 Report.pdf
     1.2.       Evidence in this Study
     In reviewing these reports and many others it is clear that there is a lack of evidence in two
     important areas – macro and micro – that this Study seeks to address. These are:
            •    Macro – the global reach and size of the sector: There is no robust measure of how
                 much is invested globally in Screen Production and its economic impact around the
                 world, so far as SPI is aware.
            •    Micro – the breadth and speed of economic effect it delivers: An explanation is
                 lacking concerning exactly how individual productions create rapid and positive
                 impacts across a variety of individual business sectors, particularly those outside the
                 creative industries.
     It is the missing elements of information that this Study is intended to provide.

     4 Commissioned by the Association of Film  Commissioners International
     5 Commissioned by the Motion Picture Association
     6 Sponsored by the Copenhagen Film Fund (Denmark), Film i Väst (Sweden), the Netherlands Film Fund and
     Screenwest (Australia)
     7 Commissioned by the British Film Institute and written by Olsberg•SPI with Nordicity

© Olsberg•SPI 2020                               25th June 2020                                          4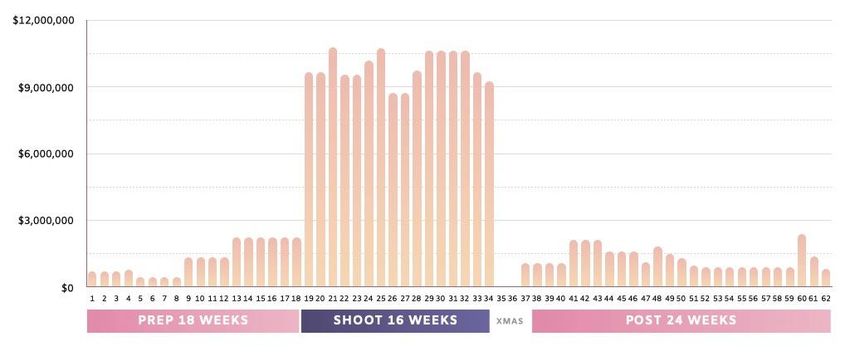
Screen Production and Global Economic Recovery

     2. EXECUTIVE SUMMARY
     2.1.     About the Study
     As noted in the previous section, the value of Screen Production has increased substantially at
     a local and global level in recent years. Driven by voracious consumer appetite and major
     investments from established and new production entities alike, Screen Production is now a
     key economic driver in very many nations and regions.8
     This major new analysis presents a robust demonstration of the global economic power of
     Screen Production and examines its potential to significantly assist economic recovery from
     the COVID-19 pandemic. It includes the following elements:
            1. A forensic analysis of global Screen Production expenditure in 2019. This Study
               represents the first time that spend has been quantified globally to such a detailed
               degree9
            2. An analysis of the economic impacts delivered by Screen Production. Utilising a meta-
               analysis approach, this element focuses on output and employment, and involved
               analysis of impact metrics in 47 studies
            3. Evidence on the speed and efficiency with which production spend is typically
               undertaken across the production cycle, based on budget analysis of actual projects
            4. An assessment of which economic sectors as a whole benefit from this investment,
               particularly those supply chain industries severely hit by the current downturn
            5. A calculation of the economic losses to output and employment caused by the current
               COVID-19 related hiatus during the first six months of 2020.
     2.2.     Key Findings
     2.2.1. Global Screen Production Expenditure
     Global expenditure on Screen Production reached an estimated $177.0 billion in 2019. This is
     a new high watermark that would very likely have been exceeded in 2020 – given that trends
     in rising production volume and value were ongoing – had the COVID-19 pandemic not
     dramatically slowed production worldwide.
     This total incorporates direct production spend by studios, broadcasters, streaming services,
     producers and funding bodies, as well as third-party spending in the form of pre-sales,
     minimum guarantees, advances and co-financing. The figure is for new feature films and first-
     run programming only. It does not include re-runs, rights to library programming and spending
     on sports and news.
     Of the 2019 total, $42.6 billion was spent making feature-length films, representing 24% of
     last year’s global production volume. This aggregated number encompasses theatrical films,
     low-budget independent titles, animated and documentary features. The remaining $134.3
     billion is made up of television films, drama series and youth programming – and also some
     element of light entertainment and current affairs where it was not possible to remove such
     non-scripted content from the aggregated figures found in company reports and territorial
     surveys. The costs of sports rights, news broadcasts and library rights have been completely
     removed, as has double-counting between countries and companies involved in collaborative
     productions.
     The analysis found that as much as 65% of global Screen Production investment originated
     from the US, primarily from studio conglomerates, streaming services and major technology

     8 In the UK, for example, data from the Office of National Statistics shows that film and television helped stop the
     country going into recession for the period June to August 2019. Film and TV boom pushes UK economy into black.
     Broadcast, 11th October 2019
     9 More than 100 sources of information were consulted during this quantitative research process

© Olsberg•SPI 2020                                25th June 2020                                                       5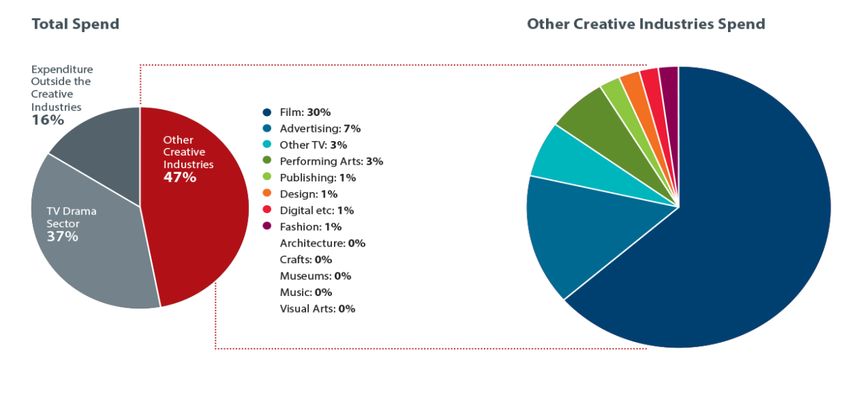
Screen Production and Global Economic Recovery

     companies. Spend from these companies increased by 28% between 2018 and 2019. While the
     majority of spend originates from the US, the impact of US investment is global – with many
     US-backed projects shooting around the world.
     2.2.2. Employment and Economic Impacts
     The employment and economic impacts of this production expenditure are highly significant.
     We estimate that 14.2 million jobs are supported by the global screen sector value chain,
     (encompassing exhibition and distribution of physical and digital media and the various forms
     of video-on-demand, in addition to Screen Production). This comprises 4.4 million direct jobs
     and 9.8 million indirect and induced jobs supported by expenditure by the screen sector and
     by people employed in the screen sector value chain.
     The total economic impact of the global Screen Production sector in 2019 is estimated to be
     $414.0 billion. This comprises $177.0 billion of direct output and $237.0 billion of indirect and
     induced output.
     The analysis of economic impact focuses on three dimensions of economic impact:
         •    Direct – employment and economic output created by Screen Production, i.e. the
              production of film and television.
         •    Indirect – output and employment arising from business purchases which Screen
              Production makes from other sectors in the course of production (e.g. transport,
              hospitality, equipment manufacturers)
         •    Induced – output and employment arising due to spending by people who are
              employed by Screen Production (including freelancers). For example, Screen
              Production sector employees will buy goods and services using earnings they have
              received from the sector.
     In addition, the analysis of employment impacts considers the direct, indirect and induced
     impacts of employment in the wider screen sector value chain.
     Using a meta-analysis approach, nearly 50 studies were assessed and they provided evidence
     for the size of the multipliers for economic output and employment at country and regional
     level, with the multipliers showing total economic impact of Screen Production in each. To
     derive a global multiplier, an average of multipliers for each country was calculated, and
     weighted by the amount of investment in each country.10
     2.2.3. Comparable Sectors
     Comparative research was undertaken to compare the scale of the global Screen Production
     sector with other industrial sectors in direct impact terms. This showed that Screen Production
     is more sizeable than sectors including electric motor vehicles and robotics (industrial and
     service) which have seen considerable investments in recent years.
     Comparison was also undertaken with other creative industries with a similar value base in
     intellectual property and copyright. This analysis found that the global Screen Production
     sector is almost 10 times bigger than the global recorded music sector, and significantly larger
     than the size of the global book publishing sector. Such sectors benefit from the supply chain
     of Screen Production through, for example, the licensing of music and the optioning of novels.
     2.2.4. The Speed of Spend
     Screen Production can deliver substantial and powerful amounts of expenditure in a short
     space of time. By way of illustration, productions can be likened to major, specialist, high-tech

     10 As outlined in Section 3.2.5, the meta-analysis focuses on studies with robust approaches to economic assessment
     and discarded any that utilised multipliers outside of an average range

© Olsberg•SPI 2020                                25th June 2020                                                      6
Screen Production and Global Economic Recovery
manufacturing operations that quickly arise, expend huge sums and employ hundreds of
people, before shrinking to a handful of key operatives as the bulk of those previously
employed move on to new projects.
A number of representative projects were analysed to illustrate how fast and to what extent
the expenditure takes place. These included: a major film with a budget of a $220 million; a
mid-budget film with a budget of $20 million; a low-budget film with a budget of $6 million; a
high-end television series with a budget of $70 million; and a mid-budget television series with
a $13 million budget. Collectively, these productions spent over $228 million during the period
of principal photography.
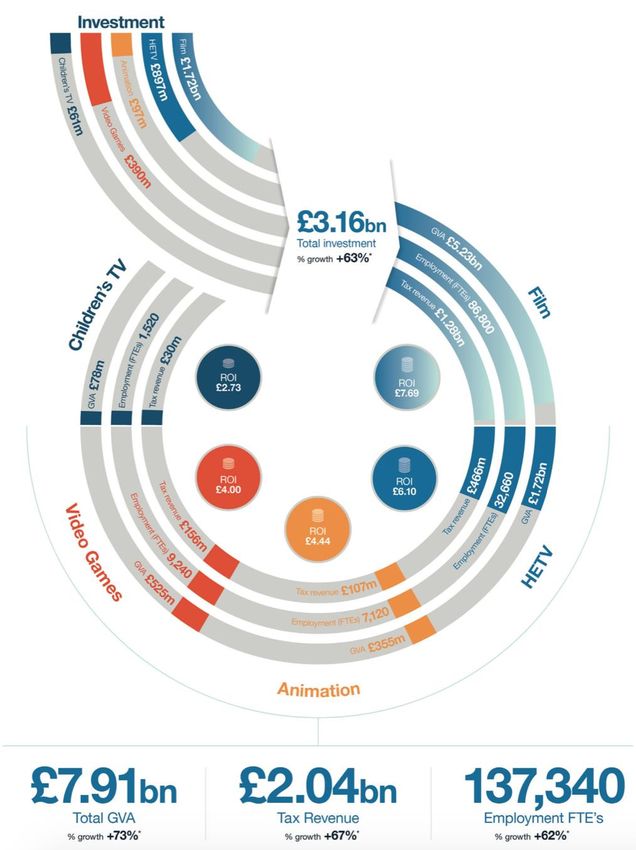
The example of a major film below shows that an average of $9.9 million was spent on a weekly
basis during a 16-week shoot.
Figure 1: Major Film Cashflow ($220 Million Budget)
When the COVID-19 stoppage began there were hundreds of projects, of all sizes, that were
either already in production and had to stop, or close to entering the stage of principal
photography and were put on hiatus. Once infrastructure opens up again, there is a substantial
backlog of production which companies are eager to start, with the ability to deliver very
substantial spend at speed.
2.2.5. Impact on Business Sectors
Screen Production expenditure also delivers benefits to a wide range of business sectors in an
economy – including those that have been particularly harmed during the pandemic, such as
travel and hospitality, as well as freelance workers.
To provide evidence of this phenomenon, a forensic analysis of the cost reports of a number of
actual projects was undertaken.
The analysis found that the proportion of production costs for these projects spent in the
overall economy was an average of 67%, with 33% spent specifically in the Screen Production
sector – as outlined in the following table.
© Olsberg•SPI 2020 25th June 2020 7Screen Production and Global Economic Recovery
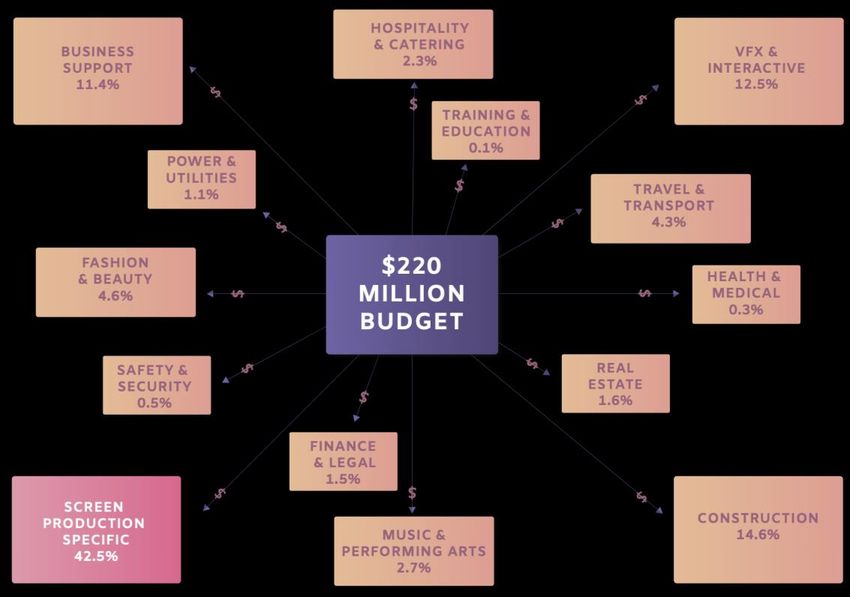
Table 1: Proportion of Production Spend in Other Business Sectors by Project Type
Major Mid- Low- High- Mid- Average
Film Budget Budget End TV Budget
($220m) Film Film Series TV
($20m) ($6m) ($70m) Series
($13m)
% % % % % %
Screen 42.5 30.2 32.1 37.3 23.3 33.1
Production
Specific
Business 11.4 16.0 5.8 11.9 15.9 12.2
Support
Construction 14.6 5.5 2.6 24.6 8.5 11.2
VFX & 12.5 6.4 1.8 8.1 4.5 6.7
Interactive
Travel & 4.3 8.3 16.8 1.3 9.8 8.1
Transport
Hospitality & 2.3 3.6 10.6 3.6 12.8 6.6
Catering
Finance & Legal 1.5 6.8 11.5 1.3 6.7 5.6
Real Estate 1.6 9.7 7.6 2.2 6.4 5.5
Fashion & 4.6 2.2 7.6 5.4 5.8 5.1
Beauty
Music & 2.7 6.4 2.2 2.8 3.4 3.5
Performing Arts
Power & Utilities 1.1 1.0 0.3 1.0 0.4 0.8
Safety & 0.5 1.2 0.2 0.2 1.4 0.7
Security
Training & 0.1 1.2 0.7 0.1 0.8 0.6
Education
Health & Medical 0.3 1.5 0.2 0.2 0.3 0.5
100.0 100.0 100.0 100.0 100.0 100.0
© Olsberg•SPI 2020 25th June 2020 8Screen Production and Global Economic Recovery
2.2.6. Strategic Use of the Screen Sector in Economic Rebuilding
Given Screen Production’s ability to impact an economy significantly and at high speed, a
number of governments are already looking to the sector as a key component of economic
recovery in the wake of the pandemic.
This is being undertaken through a range of measures to encourage production to restart,
including financial and logistical provisions. Such measures reflect the challenges productions
may face in the wake of COVID-19.
A number of funding bodies have reallocated or increased funding to ensure that production
can resume quickly when restrictions on workplaces or public gatherings are removed. In
Australia for example, Screen Australia has doubled the funding to its Premium Development
fund, allocating $3.4 million targeting high-budget productions “with firm market interest that
are close to being production ready”.11 Screen Queensland has reallocated $3.3 million in
funding to support the industry and ensure that as many productions as possible are ready to
resume or start filming as soon as the Queensland Government deems it safe.12
In a statement on 11th May, the Canada Revenue Agency (CRA) stated that “The Canadian film
industry is an important contributor to the economic and cultural well-being of Canada” before
outlining a number of measures implemented by the CRA to streamline the claim processes of
the Film and Media Tax Credits.13
A number of logistical provisions are also being made to expedite a restart of production. For
example, New Zealand has introduced a special entry visa classification of “other essential
worker”, which film professionals may apply for to enter the country.
11 Screen Australia increased Premium Development fund. IF.com.au, 3rd April 2020
12 Screen Queensland unveils $3.3 million industry support package. IF.com.au, 8th April 2020
13 Important information related to the Film and Media Tax Credits Program during the Covid-19 crisis. Canada Revenue
Agency, 11th May 2020
© Olsberg•SPI 2020 25th June 2020 9Screen Production and Global Economic Recovery
3. THE VALUE AND ECONOMIC STRENGTH OF SCREEN PRODUCTION
This section describes the worldwide expenditure on Screen Production ($177 billion
in 2019), identifying the sources of investment and the spread around the globe
where production takes place. It evidences the economic impact of 14.2 million jobs
created in the global screen sector value chain and $414 billion of economic output
from Screen Production. The latter far exceeds many other sectors both within and
outside the creative industries.
•
3.1. Global Production Expenditure
The global Screen Production sector is a major economic driver, delivering substantial amounts
of expenditure and economic impact to countries around the world. The value of the sector has
also been increasing at a rapid rate in recent years – driven by voracious consumer appetite
worldwide, technological changes, and increased content investment from new and
established producers alike.
This section provides a detailed and robust estimate of the scale of global Screen Production
spend in 2019, revealing for the first time the true value of the sector in global terms.
3.1.1. The Value of Global Screen Production
The combined global production spend on feature film and television reached an estimated
$177.0 billion in 2019. This is a new high watermark that would very likely have been exceeded
in 2020 – given that trends in rising production volume and costs were ongoing – had the
COVID-19 pandemic not dramatically slowed Screen Production worldwide.14
This global production expenditure estimate of $177.0 billion is the result of a forensic effort to
put a dollar value on how much studios, networks, streaming services, producers and funding
bodies around the world invest in annual production on a gross cash basis. This total
incorporates both direct production costs last year as well as 2019 third-party spending on new,
non-sports and non-news programming through pre-sales, minimum guarantees, advances
and co-financing. As a global total, it includes production in all markets worldwide in
any language.
Of the 2019 total, $42.6 billion was spent making feature-length films, representing almost a
quarter (24%) of last year’s global production volume. This aggregated number encompasses
theatrical films, low-budget independent titles, animated and documentary features.
The remaining $134.3 billion is made up of television films, drama series and youth
programming – and also some element of light entertainment and current affairs where it was
not possible to remove such non-scripted content from the aggregated figures found in
company reports and territorial surveys. Eliminated entirely from the global calculations are
the costs of sports rights, news broadcasts and library rights. Double-counting was also
removed between countries and companies involved in collaborative productions, between
film and television spending data and between licensing and production figures.15
The analysis found that 65% of Screen Production financing originated in the US, primarily
from studio conglomerates, streaming services and large technology companies. A granular
examination of financial reports across all of those studios and streamers revealed a collective
28% increase in Screen Production spending from 2018 to 2019. Had a pandemic not
intervened, this surge showed every sign of being followed by another annual leap as yet more
14 As outlined in Section 6, shutdowns and restrictions related to COVID-19 resulted in a 70% decline in
production globally
15 See Appendix Two for full details of methodology used
© Olsberg•SPI 2020 25th June 2020 10Screen Production and Global Economic Recovery
subscription video services look to establish themselves with substantial original content
budgets of their own.
After the US, Europe represents the next single largest regional funding bloc (16.5% of the
global total), followed by Asia (13.1%). The remaining 4.5% of the world’s production financing
is divided across Latin America, Africa, the Middle East and Oceania, as well as non-US small
budget independent feature films.
3.1.2. Overview of Valuation Methodology
To estimate the value of global Screen production, a highly-detailed research process was
undertaken. As outlined in the following figure, and in further detail in Appendix Two, this
process involved a number of methodological steps. Firstly, a data model was created, and
populated with the results of company financial reports, national statistics, and other data
sources on film and television production expenditure and licensing. In total, more than 100
data sources were reviewed.
Once all available data were collated, a number of assumptions had to be made to account for
data gaps. This involved both scaling up and scaling down the data to account for a number of
areas of potential under or double counting. For example, since US companies report net
figures in their accounting, amortisation costs for both production and licensing of released
content were also factored in, to establish a gross total that better equates to annual spending
on a cash basis.
Finally, detailed research was undertaken into the issue of licensing to determine how much of
that activity is investment in new programming produced by third parties (as opposed to the
acquisition of rights to library titles). Using broadcaster data from Ofcom (UK), CNC (France)
and CMPA (Canada), we were able to determine that at least 20% of total TV spending comes
in the form of pre-sales, co-production investments and foreign minimum guarantees, activity
that would typically be categorised as licensing activity. We applied that 20% to all licensing
spending across the globe to establish a worldwide production spending number that reflects
the total annual structure of programming investments.
© Olsberg•SPI 2020 25th June 2020 11Screen Production and Global Economic Recovery
Figure 2: Overview of Global Screen Expenditure Valuation Methodology
Data model design
Creation of findings model,
by region and key
territories, and film and
television production and
licensing spend
Desk research
Review of over 100 data
sources, including
published financial
information by company
Scaling up data and country, and other Scaling down data
Key step to account for data industry studies to obtain Key step to account for
gaps or to standardise key metrics double-counting. The data
approach – e.g. factoring in model includes US
US company amortisation Annual adjustments investment undertaken
costs, and the addition of Most data were from 2019; overseas, so US inward
independent productions where the only data investment was removed
not already reflected in sources were 2018 or 2017, from country totals
company data these were amended to
reflect subsequent growth
in investment and
production costs
Licensing revision
20% of global 2019
licensing figure added to
production total.
3.1.3. Investment Sources and Global Flow
As the base of the major content-producing studios and services, the majority of global
production investment of $177 billion originates in the US – i.e. 65% or $135.2 billion. Other
major regions for production investment are Asia (13% or $23.7 billion), Europe excluding the
UK (14% or $24.7bn), and the UK (3% or $5.2 billion).
© Olsberg•SPI 2020 25th June 2020 12Screen Production and Global Economic Recovery
Figure 3: The Origin of Global Screen Production Expenditure
Source: Olsberg•SPI
However, analysis of where investment is spent in the figure below shows that non-US regions
represent a much larger share. While 35% of investment originates outside the US, non-US
regions and countries represent 60% of spend – a difference of $42 billion.
Figure 4: Where Global Screen Production Expenditure is Undertaken
Source: Olsberg•SPI
For non-US regions, the investment which originates in these regions is less than the amount
spent on Screen Production. For example, in Europe the difference is $4.6 billion, while in
Canada $17.5 billion more is spent on production than originates in the country. This highlights
the positive impact of the global flow of Screen Production on economies around the world.
© Olsberg•SPI 2020 25th June 2020 13Screen Production and Global Economic Recovery
Figure 5: Comparison of Investment Origin and Spend ($bn)
114.7
70.9
23.7 25.1 24.729.3 21.0
19.4
2.0 3.1 1.9 4.1 5.7 0.7 2.6 5.2
Canada
Europe
Latin America
UK
Middle East /
USA
Asia
Oceania
Africa
Origin Spend
Source: Olsberg•SPI
3.2. The Global Economic Impact of Screen Expenditure
3.2.1. Economic Impact
As outlined, Screen Production is the source of significant amounts of expenditure on a global
level. This section presents new estimates of the global economic impact of Screen Production
in employment and output terms, utilising a meta-analysis of global impact studies. This is the
first time that such a systematic and rigorous estimate of global production impact has been
undertaken.16
The analysis of economic impact focuses on three dimensions of economic impact:
• Direct – employment and economic output created by Screen Production, i.e. the
production of film and television
• Indirect – output and employment arising from business purchases which Screen
Production makes from other sectors in the course of production (e.g. transport,
hospitality, equipment manufacturers)
• Induced – output and employment arising due to spending by people who are
employed by Screen Production (including freelancers). For example, Screen
Production sector employees will buy goods and services using earnings they have
received from the sector.
This study follows the methodology of recent studies by SPI for the UK (2018) and Australia
(2018), the CMPA for Canada (2020) and Oxford Economics for a range of Asian countries
including China (2019), South Korea (2019) and Thailand (2017) by presenting employment
estimates for the screen sector value chain, which comprises Screen Production plus other
parts of the screen sector such as distribution, exhibition and broadcasting. Screen Production
is the driver of this value chain: without Screen Production there would of course be no new
16 The methodology used to construct the economic impact estimates is presented in Appendix Three
© Olsberg•SPI 2020 25th June 2020 14Screen Production and Global Economic Recovery
content to exhibit or distribute.17 It is therefore relevant to present employment estimates
using a wider definition of the sector.18
3.2.2. Employment and Job Creation
The total number of jobs supported by the global Screen Production sector is estimated to be
14.2 million. This comprises:
• 4.4 million direct jobs in the screen sector value chain
• 9.8 million indirect and induced jobs supported by expenditure by Screen Production
plus the other parts of the screen sector value chain.
As outlined in Appendix Three, employment relates to full-time equivalent (FTE) jobs in the
screen sector. FTEs are a method of measuring employment in industries with non-standard or
freelance employment patterns, including Screen Production. Each FTE job is equivalent to the
average annual work undertaken by an individual employed on a full-time basis.
A regional breakdown of total global employment supported by the screen sector value chain
globally is outlined below, including the split between direct and indirect/induced
employment. Note that Asia contributes a particularly large proportion of global screen sector
employment; this reflects the large size of the screen sector (broadly defined) in China and
India in particular, and the fact that (as shown in the Appendix) the multipliers for indirect and
induced employment are higher in Asia than in Europe or North America, due to lower wage
levels in the industries benefitting from the screen sector’s business purchases and spending
by screen sector employees.
Table 2: Global Screen Sector Value Chain: Number of FTE Jobs by Region (millions)
Region Direct Indirect/Induced Total
North America 0.92 1.52 2.43
Asia 2.37 6.45 8.83
Europe 0.46 0.58 1.04
Latin America 0.56 1.08 1.63
Africa & Middle East 0.07 0.10 0.17
Oceania 0.03 0.07 0.10
Global 4.40 9.80 14.20
3.2.3. The Value of Screen Sector Jobs
While the meta-analysis focused on the volume of employment in the screen sector value
chain, research was also undertaken into the value of jobs in the sector. Evidence points to the
fact that such jobs are very well remunerated – in some cases significantly higher than the
average.
17As SPI (2018) states in the Screen Business report analysing the impact of tax reliefs for the UK screen sector: “A
value chain approach has been undertaken across the sectors in question, which enables the measurement not just
of the economic activity stimulated by the development and production of content, but also its downstream impact
on various distribution platforms. In the film sector, the analysis includes the traditional exhibition sub-sector,
through physical and digital media, and the various forms of video-on-demand (VoD) and subscription video-on-
demand (SVoD).”
18 For the Screen Production sector, narrowly defined, direct employment is around 1.9 million, supporting 3.6
million indirect and induced FTE jobs giving a total economic impact of 5.5 million jobs
© Olsberg•SPI 2020 25th June 2020 15Screen Production and Global Economic Recovery
For example, according to a 2019 report from the Motion Picture Association (MPA), the
Screen industry provided higher than average salaries.19 According to the Bureau of Labor
Statistics, the national average in the USA was $57,266. In comparison, direct jobs in the
industry – those that were engaged in producing, marketing and manufacturing motion
pictures, television shows and video content – reported a 50% increase on the national average,
typically receiving $86,049. This difference increased when focusing specifically on production-
related jobs, where the average salary was $101,999 or 78% higher than the national average.
Screen Australia has also reported on employment trends in the industry in Australia, drawing
on statistics from the 2016 census.20 The census data reported that 13% of people in film and
video production earned between $35,715 and $44,644 (AU$52,000 – AU$64,999) and 48%
earned over $44,648 (AU$65,000). For those employed in film and television post-production,
14% were earning between $35,715 and $44,644 (AU$52,000 - AU$64,999) and 44% earned
over $44,648 (AU$65,000). A report from the Australian Bureau of Statistics identified the
median income in Australia for the 2016/2017 financial year as $33,215 (AU$48,360).21
Therefore, 61% of those involved in film and television production and 58% in film and
television post-production were earning above the median Australian income. This figure was
higher again for those employed in television broadcasting, where 62% earned
over $44,648 (AU$65,000) and 75% earned over the median Australian income in 2016/2017.
Furthermore, the highly skilled and creative jobs in Screen Production are far less vulnerable to
replacement by robotics and Artificial Intelligence (AI) than in many sectors. In these terms,
they are genuinely jobs of the future.
3.2.4. Economic Output
Based on calculated economic output of global Screen Production in Section 0, SPI estimates
that the total economic impact of the global Screen Production sector in 2019 was $414.0
billion. This comprises:
• $177.0 billion of direct output
• $237.0 billion of indirect and induced output.
A regional breakdown of Screen Production by region – after taking account of inward
investment into each country – is outlined below. The table distinguishes between direct
output and indirect/induced output.
These breakdowns do not include the impact of inward production, as this spend was counted
at source in the valuation model outlined in Section 3.1.
19 Creating Jobs, Trading Around the World. MPA, November 2019
20 Proportions of employees earning various annual incomes, by industry, 1996-2016. Screen Australia
21 Personal Income in Australia, 2011-2012 to 2016-17. Australian Bureau of Statistics, 17th December 2019
© Olsberg•SPI 2020 25th June 2020 16Screen Production and Global Economic Recovery
Table 3: Screen Production Sector Output Breakdown by Region (US$bn)
Region Direct Indirect/Induced Total
North America 90.2 120.8 211.1
Asia 25.1 33.6 58.7
Europe 50.3 67.4 117.7
Latin America 5.7 7.6 13.3
Africa & Middle East 3.1 4.2 7.2
Oceania 2.6 3.4 6.0
Global 177.0 237.0 414.0
3.2.5. Overview of Economic Impact Methodology
The methodology used to construct the economic impact estimates is presented in detail in
Appendix Three and outlined in the figure below.
This is based on a meta-analysis of existing Screen Production impact studies, with 47 studies
across six continents used to create a global impact model. While the direct economic output
estimates for global Screen Production are calculated in Section 3.1, it was necessary to
undertake this meta-analysis to calculate indirect and induced impacts, and direct
employment impacts.
Indirect and induced impacts are normally estimated at the national or sub-national level using
detailed input-output (I-O) tables that show the relationship between spending by each
industry in a given jurisdiction and income received by other industries.22
Because I-O tables are not available at the global level, the meta-analysis produced evidence
on the size of the multipliers for economic output and employment at the country and regional
level and show total economic impact of Screen Production in each country. To derive a global
multiplier, an average of multipliers for each country was calculated, weighted by the amount
of Screen Production in each country (taking account of investment flows between countries
as explained above).
The multipliers in this report are “Type 2” multipliers, which are defined as follows:
• (Direct output + Indirect output + Induced output) / Direct output.
They are defined in the same way for employment. Multipliers used for the output analysis are
specific for the Screen Production sector where possible; for the employment analysis,
multipliers for the wider screen sector value chain are used wherever these are available.
The range of the Type 2 multipliers for output and employment in the 47 studies included in
the meta-analysis was between 1.5 and 4 in every case. A few studies with outlandishly high
multipliers (above 4) were discarded on the grounds of being unrealistic.
The global weighted average multiplier for output is estimated to be 2.27, while the multiplier
for employment is estimated to be 2.71. Employment and output multipliers by region are
included in Appendix Three.
22 Of the studies included in the meta-analysis, 46 used I-O tables. One of the studies included in the meta-analysis
used a Computable General Equilibrium (CGE) model to estimate multipliers instead of I-O tables but this approach
is rare in the literature. Any studies that did not include an I-O or other robust, verifiable multiplier approach were
discounted and not used in the meta-analysis
© Olsberg•SPI 2020 25th June 2020 17Screen Production and Global Economic Recovery
Figure 6: Overview of Economic Impact Methodology
Data model design
Based on the model
created to value
production, this enabled
global and regional impact
estimates across output
and employment
Direct impact – Direct impact –
Spend Employment
The results of the research The results of the meta-
into global Screen analysis provided direct
production expenditure employment data, which
provide direct impacts; were checked against
employment expenditure findings
Meta-analysis
Studies with non-robust To analyse indirect and
induced impacts, desk Studies included in meta-
multipliers or multipliers
research into global analysis from 2015 or later
outside of the average
impact studies was where possible
range were not used
undertaken, with 47
studies reviewed and
included in database and
averages calculated
Application of Multipliers
Headline results calculated
used global composite
multiplier – a weighted
average of all multipliers.
Regional level results also
presented
3.2.6. The Scale of Comparable Sectors
Using these results, comparative research was undertaken to compare the scale of the global
Screen Production sector with other industrial sectors. The table below shows some
comparisons with other recent studies of global sectors. It should be noted that all of these
studies relate to direct output from each sector, and do not include indirect and induced
outputs.23
The results show that the global Screen Production sector is almost 10 times bigger than the
global recorded music sector, and larger than the global book publishing sector. In direct
output terms, Screen Production is more sizeable than electric motor vehicles and robotics
23 Regarding other comparisons, according to calculations by the UBS bank reported in the Economist, content
spending by 16 companies in the US last year was roughly equal to the sum invested in America’s oil industry in
2019. The future of entertainment. The Economist, 14th November 2019
© Olsberg•SPI 2020 25th June 2020 18You can also read