Capturing economic and social value from hydrocarbon gas flaring and venting: evaluation of the issues - WIDER Working Paper 2021/5
←
→
Page content transcription
If your browser does not render page correctly, please read the page content below

WIDER Working Paper 2021/5

Capturing economic and social value from
hydrocarbon gas flaring and venting: evaluation
of the issues

Etienne Romsom and Kathryn McPhail*

January 2021
Abstract: Atmospheric emissions urgently need to reduce for natural gas to fulfill its potential role
in the energy transition to achieve the Paris Agreement on climate change. This paper establishes
the magnitude and trends of flaring and venting in oil and gas operations, as well as their emissions
and impact on air quality, health, and climate. While global flaring and venting comprise 7.5 per
cent of natural gas produced, their combined impact on health and climate (in terms of Social Cost
of Atmospheric Release) accounts for 54 per cent. Many low- and middle-income countries are
economically dependent on oil and gas production. Most premature deaths from air pollution in
2016 were in developing countries. Most natural gas losses and emissions are avoidable. If all
natural gas flared and vented globally is captured and brought to market, it could supply annually
more than the total South and Central America gas consumption, plus all of Africa’s power needs.
If 75 per cent of these volumes are captured, it provides an additional natural gas sales value of
US$36 billion per annum (assuming an average gas price of US$4/MMBtu).
Key words: energy transition, gas, health, climate, air quality
JEL classification: Q3, Q4, Q5
Acknowledgements: We would like to thank Tony Addison and Alan Roe for reading and
commenting on an earlier version of this paper.
Notes: This study is complemented by another WIDER Working Paper written by the same
authors (Romsom and McPhail 2021): ‘Capturing Economic and Social Value from Hydrocarbon
Gas Flaring and Venting: Solutions and Actions’. It investigates, evaluates, and proposes solutions
and actions designed to reduce flaring and venting.
Abbreviations and units are at the end of the paper.

* Both authors: EnergyCC, Singapore, info@enerycc.com, www.energycc.com
This study has been prepared within the UNU-WIDER project Extractives for development (E4D)—risks and opportunities,
which is part of the Domestic Revenue Mobilization programme. The programme is financed through specific contributions by
the Norwegian Agency for Development Cooperation (Norad).
Copyright © UNU-WIDER 2021
UNU-WIDER employs a fair use policy for reasonable reproduction of UNU-WIDER copyrighted content—such as the
reproduction of a table or a figure, and/or text not exceeding 400 words—with due acknowledgement of the original source,
without requiring explicit permission from the copyright holder.
Information and requests: publications@wider.unu.edu
ISSN 1798-7237 ISBN 978-92-9256-939-6
https://doi.org/10.35188/UNU-WIDER/2021/939-6
Typescript prepared by Mary Lukkonen.
The United Nations University World Institute for Development Economics Research provides economic analysis and policy
advice with the aim of promoting sustainable and equitable development. The Institute began operations in 1985 in Helsinki,
Finland, as the first research and training centre of the United Nations University. Today it is a unique blend of think tank, research
institute, and UN agency—providing a range of services from policy advice to governments as well as freely available original
research.
The Institute is funded through income from an endowment fund with additional contributions to its work programme from
Finland, Sweden, and the United Kingdom as well as earmarked contributions for specific projects from a variety of donors.
Katajanokanlaituri 6 B, 00160 Helsinki, Finland
The views expressed in this paper are those of the author(s), and do not necessarily reflect the views of the Institute or the United
Nations University, nor the programme/project donors.
1     Introduction

A large number of low- and middle-income countries are dependent on oil and gas production. In
2014, 48 countries had oil and gas exports greater than 30 per cent of their total merchandise
exports (Addison and Roe 2018). Of these, 29 countries were either low- or middle-income
countries. In 2018, 13 low- and lower-middle-income countries received more than 20 per cent of
export revenues from oil and gas. For Angola, Cameroon, Chad, Nigeria, and Yemen, oil and gas
accounts for more than 50 per cent of exports (Ericsson and Löf 2020).

There are opportunities for low- and middle-income countries dependent on oil and gas
production to capture significant benefits from natural gas flaring and venting. Satellite data since
2005 show that 85 per cent of total gas flared is in developing countries. The volume of gas
routinely flared is large, estimated to be circa 145 billion cubic meters (bcm) annually, which is
approximately 4 per cent of global gas production. Capturing and processing the gas associated
with the exploitation of upstream hydrocarbon resources significantly reduces negative social
impact and could provide additional revenues that can be used to support achievement of the
United Nations Sustainable Development Goals (UN SDGs). Our paper will show that the
opportunity revenue value from capturing and utilizing upstream flared and vented natural gas in
2019 was US$48 billion, based on an assumed US$4/MMBtu gas price (see Table 13). However,
this is a fraction of the estimated social cost impact.

There are substantial societal benefits from policies that prevent routine flaring and venting,
reducing emissions such as carbon dioxide (CO2), methane, nitrogen oxides, volatile organic
compounds (VOCs), organic carbon, and black carbon (BC), as noted in the report of the high-
level commission on carbon prices (Carbon Pricing Leadership Coalition 2017):

        Various co-benefits—for instance, lower air pollution, improved health, higher
        energy security, and lower expenditures—increase the value of reducing GHG
        emissions for the society. Some of these co-benefits have a direct financial translation
        (such as savings from reduced fuel use) while others (such as better health or the
        preservation of biodiversity) cannot be directly and consensually assigned a
        monetary value. Moreover, there are second-order impacts, including the freeing
        of public resources for alternative uses, and positive macroeconomic impacts
        (such as growth and higher employment) associated with climate-related
        investments. The co-benefits of mitigation can be substantial and are therefore
        often an important element in analyses by policy makers.

In addition to reducing deliberate emissions, further benefits can be obtained from policies and
actions that reduce other ‘fugitive’ emissions (i.e. leakages) of natural gas. The socio-economic
benefits from reducing natural gas pollutants include the impact of air quality and climate on
health, aerosols-induced impact on regional climate, and global climate impact. Technical solutions
exist for the upstream industry to capture, process, and utilize the wasted natural gas and obtain
financial-economic benefits in addition to the socio-economic benefits.

This study aims to provide an overview of the causes of natural gas flaring and venting in oil and
gas operations and the impediments to reducing these. Gas flaring and venting is a highly
significant issue in the exploitation of hydrocarbon resources because of its impact in terms of
energy wastage, air quality, BC emissions, and climate change. Solutions exist to capture, process,
and utilize natural gas in oil and gas processes. Nevertheless, across the world, significant volumes
of unprocessed natural gas continue to be flared or vented for commercial reasons.

                                                   1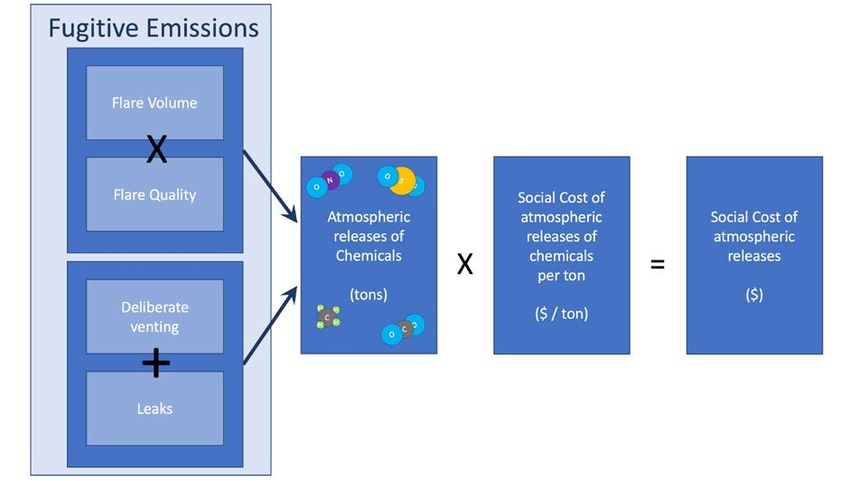
Most of the global gas flaring occurs when associated gas, a by-product of upstream oil exploration
and production, has insufficient economic value to be processed and transported to market.
Pipeline infrastructure may be lacking to transport the gas, gas markets may be locally absent, or
the economic value of the gas may be less than its processing and transportation costs. Even in
cases where no viable proposition can be made for economic exploitation of the associated gas,
proven solutions exist to avoid these unnecessary emissions into the environment. In such
situations, it is often possible to process the associated gas and reinject this into the oil-producing
reservoir to optimize oil recovery. Although gas reinjection is not always possible, it is a quite
common, if underutilized, technique, as according to the US Energy Information Administration
(EIA), of the 4,306 bcm of gas produced in 2014, 455 bcm (10.6 per cent) were reinjected and 144
bcm (3.3 per cent) flared (World Bank 2020).
 Limitations in the application of gas reinjection as a standard methodology to avoid natural gas flaring
 and venting
 The benefits of gas reinjection into oil reservoirs are multiple:
     •    Gas reinjection as voidage replacement in oil reservoirs provides reservoir pressure maintenance. The
          arrest of reservoir pressure decline is needed to maintain well flow rates and to overcome the back
          pressure caused by the weight of the fluids in producing wellbores.
     •    Gas reinjection can provide an improved macroscopic sweep of the reservoir, whereby oil is swept
          towards the producing wells and a higher oil recovery factor is obtained.
     •    Recycled natural gas is partially absorbed by the oil in the reservoir, improving its fluid characteristics
          (e.g., lower viscosity) to flow in the reservoirs towards the producing wells, leaving less residual oil trapped,
          i.e. an improvement of microscopic reservoir sweep.
     •    Gas reinjection can counterbalance aquifer ingress into the oil reservoir, particularly when this would lead
          to lower oil recovery and well-lift problems.
     •    Gas reinjection can contribute to a well offtake strategy, whereby excess gas is produced above the
          reservoir gas-oil ratio, thereby providing additional lift in the wellbore, avoiding the cost for deploying
          artificial lift to keep the oil wells flowing.
 Consequently, gas reinjection not only can provide a mechanism for gas disposal, it can also result in higher oil
 recovery efficiency. However, not all oil reservoirs are suitable for gas reinjection, and in some situations a short
 circuit can occur between gas-injection wells and oil-producing wells, impairing oil recovery. In other oil reservoirs,
 a strong aquifer may counteract the beneficial impact of gas reinjection and cause lower oil recovery efficiency. In
 these cases, a more prudent approach than flaring or venting of the associated gas is to dispose the produced gas
 into a designated disposal reservoir that has been assessed and confirmed to be able to hold the gas volumes without
 leaking or spilling over into other reservoir structures or potable aquifers. Significant technical understanding exists
 on how to select and manage gas disposal reservoirs. This same approach is also a key methodology for carbon
 capture and storage. Produced gas can also be reinjected into commercial gas storage reservoirs, often depleted gas
 reservoirs, to manage seasonal swings in demand and to conserve gas for operational and strategic reasons.
 Furthermore, there are additional opportunities for gas utilization within upstream oil field operations, such as gas
 lift, engine fuel, and local power generation.

Another important source of upstream natural gas flaring occurs in remote gas exploration well
testing. Before investments can be made to develop new gas reservoirs, it is essential to get early
information on the size and deliverability (flow rates) of the reservoir. It is for this reason that
exploration wells are being drilled and brought on stream for long-term production testing. For
large and remote gas reservoirs, exploration well tests can last for many months while flaring the
gas under high flow rates. Although these exploration gas flaring durations are typically less than
continuous flaring of associated gas during the field life of oil production, the amount of gas flared
per time unit for a gas well test can be a factor of one thousand or more than for a producing oil
well. Although it is theoretically possible to reinject the produced gas in the gas reservoir, this
would interfere with the objectives of the deliverability test. In offshore or coastal situations, an

                                                            2
alternative solution to exploration well test gas flaring is the use of floating liquefied natural gas
(floating LNG or FLNG) to capture the gas and its economic value.

In 2010, International Monetary Fund (IMF) published a comprehensive analysis (Daniel et al.
2010) on the tax treatment of oil, gas, and minerals to ensure that resource endowments set
countries on a path of sustained and robust prosperity. It stated that gas flaring is ‘universally
discouraged and should be dealt with via regulation’. This emphasis was reiterated in a 2019 World
Bank publication (Huurdeman and Rozhkova 2019): ‘natural gas flaring international best practice
is to ban and fine gas flaring, except in specific circumstances. Angola, Ghana, Mozambique,
Nigeria, Tanzania, Uganda have adopted this approach’. Despite this recognition of international
good practice and the existence of technical solutions to avoid wasteful emissions from unwanted
natural gas into the atmosphere, about 8 per cent of global gas production is estimated to be flared,
vented, or leaked. The considerations to flare are often based on commercial criteria rather than
technical arguments. An example that illustrates this point is a recent case where the Texas
regulator approved the application from oil company Exco Resources to flare gas, despite its oil
field already being connected to a gas-gathering system. The owner of the gas gathering, Williams,
was willing to take the gas and raised the objection against gas flaring, considering ‘flaring is waste’
if a company has pipeline access. The ruling by the Texas Railroad Commission (Rassenfoss 2019)
made clear its view that:

              •   ‘Flaring is a critical part of the well construction process and it is important
                  companies be able to continue to use this tool’;
              •   ‘anytime there is a negative cost—you do not get as much (money) as you get
                  otherwise—you can flare’;
              •   If the commission blocked production of oil it would prevent burning of gas worth
                  a fraction as much as the oil production lost.

The essence in this case is the definition of ‘waste’. The Texas Railroad Commission opted for
defining ‘waste’ as anything that does not optimize economic value, rather than the broader view
that ‘waste’ 1 is an avoidable negative impact on the environment. In a subsequent section, we will
review the status of gas flaring and venting in the United States and in other countries in more
detail. It is worth noting that the perception that associated natural gas is ‘waste’ when the means
for economic development are not readily available is shared by many producers and regulators
globally.

When externalities are not priced in, a distorted view of ‘waste’ results. The consequence, as can
be readily observed globally, is that valuable energy resources go up in smoke rather than being
preserved because there is momentarily no financial economic return to utilize it. With gas providing
23.6 per cent of global primary energy demand, versus 32.7 per cent to oil, it is no longer viable to
hold the point of view that gas is a waste product. It is long overdue that industry and regulators
adopt policies and regulations that state:

To vent or flare routinely to produce is an unacceptable oil and gas industry practice.

There are certain situations that may necessitate emergency flaring or venting. For example, to
protect human life and equipment, a process upset may trigger a gas blowdown scenario to avoid
a fire or explosion. Such cases of emergency flaring are infrequent and of short duration. They

1
 According to Lexico.com, ‘waste’ is: ‘1) an act or instance of using or expending something carelessly, extravagantly,
or to no purpose; 2) material that is not wanted; the unusable remains or by-products of something’. Herein lies part
of the problem, when associated natural gas in oil production is seen as a waste stream to be disposed of.

                                                          3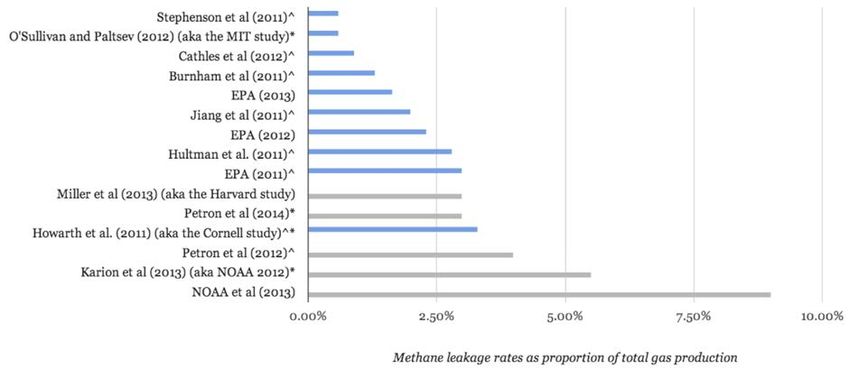
contribute, therefore, less to global emissions than routine flaring in upstream and downstream
operations. Initiatives are underway to stop routine flaring. One of these is the Global Gas Flaring
Reduction (GGFR) Partnership, led by World Bank Group. We will investigate and evaluate such
programmes in more detail in the second WIDER paper that complements this paper.

Section 2 provides a definition of ‘flaring’ and identifies the different types and causes of this.
Section 3 provides a similar definition and analysis of ‘venting’. Section 4 discusses the different
definitions of ‘fugitive emissions’ and the uncertainty in assessment and measurement. Section 5
sets out the scale and trends over time of global flaring and venting. Section 6 combines different
data sets and establishes an integrated assessment of natural gas flared and vented that includes
the amounts and damages of chemicals released in the atmosphere. Section 7 delivers a consistent
representation of the social impact of these atmospheric releases because different emissions affect
climate, air quality, health, and the environment differently. Section 8 introduces solutions to
overcome impediments that hinder utilization of associated gas. Section 9 concludes.

2        What is flaring?

 The importance of well-operated flares
     •     Natural gas flaring in the oil and natural gas industry is defined as the controlled combustion of natural
           gas for operational, safety, or economic reasons.
     •     A well-operated flare can achieve a 98 per cent destruction efficiency of natural gas by thermal oxidization
           (i.e. 98 per cent of hydrocarbons destroyed).
     •     Many natural gas flares fail to meet this operational target and produce a range of chemicals, such as
           nitrogen oxides (NOX), sulphur oxides (SOX), VOCs, and BC, that are toxic and affect air quality, as well
           as have a negative impact on the climate.
     •     There is increasing concern that flare systems are inadequately monitored and that flare combustion
           processes cause chemical emissions much higher than estimated by regulators.

Natural gas flaring in the oil and natural gas industry is defined as the controlled combustion of
natural gas for operational, safety, or economic reasons. Natural gas flaring occurs for operational
reasons; for example (US Department of Energy 2019):

    •     during drilling to dispose of gas influx into the wellbore;
    •     during exploration well testing to determine well deliverability and minimum connected
          reservoir volumes;
    •     during production well testing to stabilize flow and clean up the well before fluids are
          routed through production facilities;
    •     during flow diversion from regular process equipment in situations of production upsets,
          maintenance operations, and/or emergency pressure relief;
    •     during regular operations to dispose of small volumes of waste gas, such as from gas
          evaporation from oil storage tanks;
    •     during regular operations as pilot flame for instantaneous ignition of any diverted gas
          flows.

In addition, flaring also occurs for economic reasons:

    •     during operations, in situations when oil production facilities are available, but where gas
          processing infrastructure is under construction or not yet operable;

                                                           4
•    during production to avoid impairment of hydrocarbon recovery from shutting in wells
            while processing facilities are temporarily unavailable;
       •    during operations, in situations where oil can be produced but there is no opportunity to
            bring the associated gas to market;
       •    during operations, when technical solutions exist to process and capture the gas and bring
            it to market, but when this is less economic, then flaring and the associated gas is seen as
            a waste product.

Flares are cost-effective and useful safety devices in operations as they can dispose of sudden
releases of large amounts of gas, even if gas flows are intermittent or highly variable. Flare systems
(EPA 2016a) typically cost US$10,000 to US$3 million, depending on size and degree of
sophistication (EPA 2019).
    The importance of operating flares well
    This paper details the significant pollution and social costs that result from flares that do not fully combust their
    feed gas. Flare volumes can vary from almost zero to 1.4 Bcf/d of gas, and commercially available flare burner tips
    range from 2.5-cm to 2.3-m diameter. A well-operated flare can achieve a VOC destruction efficiency of 98 per
    cent (equating to a combustion efficiency, i.e. full conversion into CO2, of 96.5 per cent) (EPA 2012). However,
    flares are not suitable for halogenated compounds. 2
    If the heat content of the gas exceeds 300 Btu/scf, flares can sustain combustion without auxiliary fuel. Flares
    create combustion at high temperatures in the range 500–1,100 oC and are very concentrated. These characteristics
    of concentration and temperature profile allow remote-sensing technologies to identify gas flares and differentiate
    these from other heat sources, such as wildfires. This enables remote monitoring of individual gas flares by satellite.
    Flares do not pose a safety concern for high concentration of organics in the feed because they use an open
    combustion process, significantly reducing the risk for an explosive environment. Flares are generally elevated to
    create distance between the open flame and to disperse products from the combustion.
    Flare combustion quality depends on flame temperature, combustion residence time, turbulent mixing of gases and
    air flow, and presence of any heavy elements (e.g., liquids) in the feed. If the airflow is insufficient or irregular,
    smoking, flickering, and soot forming (BC) can occur and the combustion process will be incomplete, creating
    other organic compounds such as aldehydes and acids. Primary air is added to the gas before the mixture enters
    the flame. The volume of oxygen needed to ensure a clean burn depends on gas composition and increases from a
    factor of 9.6 for methane to 38.3 for pentane (EPA 2018). In addition to insufficient oxygen, smoking occurs when
    crosswinds reduce the effective flare height and therefore the temperature of the flare combustion zone.
    The presence of liquids in the gas stream also will deteriorate the combustion process. Most flare systems have a
    knock-out vessel to remove liquid content. If liquids enter the flare, they can cause sprays of burning chemicals,
    smoking, and/or extinguishing of the flame.

Concern is growing that flare systems are inadequately monitored and that flare combustion
processes cause chemical emissions orders of magnitude higher than estimated by regulators.
Instead of process measurements and emissions monitoring, industry and regulators often rely on
decades-old formulas for estimating pollution from flaring (Hasemyer 2016) that do not cover
super-emitter flares.

2
 A halogenated compound is a VOC onto which a halogen (e.g., fluorine, chlorine, bromine, or iodine) is attached.
Streams containing high concentrations of halogens or sulphur containing compounds are not usually flared because
of corrosion of the flare tip and formation of secondary pollutants (e.g., sulphur dioxide [SO2]). If these vent types
are to be controlled by combustion, thermal incineration followed by scrubbing to remove the acid gases is the
preferred method (Stone et al. 1992).

                                                              5
3 What is venting?
Venting is harder to detect and has larger impact on the climate than flaring
• Natural gas venting in the oil and natural gas industry is defined as the direct release of natural gas into
the atmosphere, creating emissions of methane as well as other components in the gas.
• Venting happens regularly in oil and gas operations to avoid pressure build-ups and when vapour recovery
technologies are uneconomic.
• Methane emissions have a much larger radiative forcing impact on climate than CO2. Therefore, well-
operated gas flaring is preferred over venting.
• Emissions from venting are harder to detect than gas flaring.
Venting is the direct release of natural gas into the atmosphere. Venting of natural gas not only
releases methane but also any other chemical components that are in the gas. Natural gas venting
occurs for operational reasons, for example (US Department of Energy 2019):
• during routing liquid unloading of low-pressure gas wells;
• during flow diversion from regular process equipment in situations of production upsets
and/or emergency pressure relief;
• during blowdown of process equipment in situations of production upsets and/or
emergency pressure relief;
• during maintenance operations, to bleed off gas pressure from devices and control
equipment;
• during regular operations to avoid pressure build-up from evaporation of liquid
hydrocarbons in processing and storage facilities without vapour recovery systems;
• during regular operations as routine emissions from flash tanks, dehydration columns,
amine units, etc.;
• during regular operations as routine emissions from loading and unloading of liquid
hydrocarbons for transport;
• during boil off during LNG transportation and LNG storage, as part of the cooling
process.
Venting should only occur for small volumes where it is not possible or reasonable to install vapour
recovery or flare systems. Venting of hydrocarbons in large volumes could cause gas explosion
risks. Furthermore, the climate impact from venting a certain volume of hydrocarbons is
significantly higher than from flaring that same volume, as described in the following section.
There is no valid reason to routinely vent associated gas as a waste product stream in oil production
operations. The points raised above why routine flaring can occur for commercial reasons are
invalid for venting. If flaring to produce is bad, venting to produce is worse. Nevertheless,
operators that wish to dodge emission regulations may resort to venting as a waste disposal
mechanism because gas flares are easy to spot and gas vents are harder to trace. However, (satellite)
technology to identify sources of methane venting has improved significantly in recent years.
64 What are fugitive emissions?
Fugitive emissions from oil and gas operations include strong pollutants to health and climate
• Definitions of fugitive emissions are evolving as to whether these include all emissions, i.e. also deliberate
flaring and venting, or only uncontrolled streams such as leakages of natural gas.
• Methane is a large contributor of fugitive emissions from leaked or vented natural gas. However, other
components, such as C2+ alkanes, VOCs, and contaminants (e.g., CO2, hydrogen sulfide [H2S)), also
contribute.
• Even more than gas flaring, fugitive emissions are difficult to measure. Estimated leakage rates for
methane as a proportion of natural gas production range from 1 per cent to 9 per cent, with consensus at
~3 per cent.
• Compared to CO2, methane releases have a stronger negative impact on global warming in the short term,
but methane also has a shorter half-life, and therefore, the degree of negative impact versus CO2 reduces
faster with time.
• Intergovernmental Panel on Climate Change (IPCC) assessments show a global warming potential (GWP)
for methane, relative to CO2, of 72 and 25 for a 20-year and 100-year time horizon, respectively.
• A ‘well-to-burner-tip’ methane leakage rate of 3.2–4.5 per cent is identified as the tipping point where
climate benefits of gas-fired power plants over coal-fired power plants are fully eroded.
In addition to deliberate flaring and venting in oil and gas operations, there are fugitive emissions
of methane and other greenhouse gases (GHGs) along the hydrocarbon supply chain. IPCC uses
a definition for fugitive emissions from oil and gas systems that includes all GHG emissions
(Boettcher 2019) except contributions from fuel combustion for the production of useful heat or
energy. Therefore, the fugitive emissions definition by IPCC specifically includes flaring and
venting of natural gas, even though these latter emissions are not ‘fugitive’ in the strict sense of
the word. On the contrary, the US Environmental Protection Agency (EPA) uses an alternative
definition for fugitive emissions as those emissions (of GHGs) that could not reasonably pass
through a stack, chimney, vent, or other functionally equivalent opening. EPA’s definition of
fugitive emissions therefore excludes flaring and venting (EPA 1999). For the purpose of this
work, we are focusing on flaring and venting as deliberate emissions of collected GHGs as the
area of focus and as targets for solutions to increase the usefulness of these sources and reduce
their negative impact. However, as data sources often do not distinguish between deliberate
venting and inadvertent leaks, we have adopted the IPCC definition of fugitive emissions for
this paper.
Particularly when assessing the environmental and climate impact from the exploration,
production, transportation, storage, distribution, and use of energy carriers (fuels), all emissions
should be considered. Inadvertent methane leaks contribute to carbon emissions, just as venting
and flaring do. Some of the techniques to identify and measure fugitive emissions are the same as
for venting. However, a systematic approach for consistent quantification of fugitive emissions is
lacking. Bottom-up approaches can give a detailed snapshot for the emissions for a given asset or
piece of equipment but do not ‘follow the molecules’ across the full supply chain, creating an
incomplete record of emissions related to the use of an energy source. This makes it difficult to
compare total emissions (e.g., for the full supply chain of a gas-fired versus coal-fired power
solution). Top-down approaches to assess, for example, methane emissions over a larger area lack
specificity on the emission sources of methane within a given area and may result in a high estimate
when allocating these measurements to a specific asset (Hope 2014).
7Figure 1: Broad range for methane leakage rate estimates from upstream oil and gas operations
Source: reproduced from CarbonBrief (2017), under the CC license Attribution-NonCommercial-NoDerivatives
4.0 International.
The top-down estimates for methane leakage rates (the grey bars in Figure 1) are generally higher
than the bottom-up data (blue bars), with some overlap across both data sets and around 3 per
cent leakage rates. The estimates in Figure 1 may also contain methane contributions from
deliberate venting and/or incomplete carbon combustion in flares. Further methane losses in
addition to the upstream oil and gas leakages could occur and require a comprehensive well-to-
burner-tip assessment. For natural gas to be considered a ‘lighter carbon fuel’, i.e. with less impact
on climate change than coal, it is imperative that losses of GHGs caused by the industry are kept
as low as practically possible. Compared to CO2, methane releases have a stronger negative impact
on global warming in the short term, but methane also has a shorter half-life, and therefore, the
degree of negative impact versus CO2 reduces faster with time. 3 Depending on the time horizon,
methane has a GWP of 72 and 25 for a 20-year and 100-year time horizon, respectively (Forster
et al. 2007). 4 There are various studies that compare the relative climate impact of gas-fired power
versus coal-fired power as a function of methane emissions. One study concludes that natural gas
is only better for the climate if total methane emissions along the gas supply chain are less than
10–11 per cent and 4.0–4.5 per cent for a 100-year and 20-year time horizon, respectively (Law
2018). Another study assesses this tipping point for methane emissions at 3.2 per cent (at all time
horizons) (Alvarez et al. 2012). This latter study also compares the climate impact as a function of
methane emissions for using compressed natural gas (CNG) as an alternative fuel in automotive
transport.
3
Methane is oxidized to CO2 with a half-life of seven years. In comparison, CO2 is chemically inert and is removed
from the atmosphere by dissolving into oceans and conversion through biological photosynthesis.
4
The GWP of 1 kg of a chemical element such as methane is normalized relative to 1 kg of CO2 (GWP=1).
8Figure 2: ‘Well-to-wheel’ and ‘well-to-burner-tip’ natural gas emissions as a function of the number of years
before net climate benefits are obtained from the use of natural gas instead of alternative fuels.
Note: The dotted lines represent the impact under incidental use, the dashed line represents the impact for the
full-service life of the asset (15 years for automotive, 50 years for power plant), and the solid line represents
permanent use with identical asset replacement after its service life.
Source: reproduced from Alvarez et al. (2012), with permission.
Although we recognize the importance of considering all emissions (gas flaring, gas venting, leaks,
and emissions from energy use, i.e. energy efficiency) across the supply chain when assessing the
impact of using certain fuels, this paper focuses primarily on deliberate emissions from gas flaring
and venting during the oil and gas production process. These considerations on flaring and venting
emissions will also have some relevance for possible approaches for other fugitive emissions, such
as leaks, particularly once measurements of methane emissions along the supply chain (e.g.,
through remote-sensing techniques) obtain sufficient volumetric and spatial accuracy to detect
large numbers of smaller leaks.
5 Global scale of hydrocarbon flaring and venting
Global fugitive emissions (in MtCO2e) increased by 35 per cent between 1994 and 2014
• Natural gas flared and vented worldwide is estimated at circa 150 bcm and 155 bcm per annum,
respectively, and 3.7 per cent and 3.8 per cent (total 305 bcm or 7.5 per cent) of global gas production.
• If gas flared and vented globally is captured and brought to market, it could supply more than all of South
and Central America gas consumption, plus all of Africa’s power.
• Flaring volumes decreased from 1996–2010 but thereafter started slowly trending up; venting volumes
have increased gradually as global gas production increased.
• In 2019, five countries (Russia, Iraq, Iran, US, and Venezuela) contributed 54 per cent of global flaring;
developing countries account for more than 85 per cent of total gas flared.
• The total contribution of energy losses from flaring, venting, and other fugitive emissions comprises 5.2
per cent of global GHG emissions, or 7.2 per cent of global energy GHG emissions.
• Global flaring and venting volumes are highly significant as an opportunity cost but even more so from a
social cost perspective, i.e. because of their impact on air quality, health, and climate.
• Of the 16 largest fugitive emission countries in 2014, 11 were in the global top 15 oil-producing countries.
However, when assessing individual countries, we observe that large oil production with zero or low levels
of routine flaring is possible.
Natural gas flared and vented worldwide is estimated at circa 300 bcm annually—3.7 per cent and
3.9 per cent of global natural production, respectively. These volumes wasted are emitted into the
9atmosphere, affecting air quality and climate. Most of the gas flared and vented is associated gas,
a by-product from producing oil. Global associated gas is estimated at 20 per cent of total gas
produced (World Bank 2020), and therefore, the fraction of associated gas flared and vented in
upstream oil operations could be as high as one-third.
According to World Bank (2020), the volume of global gas flared was equivalent to the total gas
consumption of South and Central America in 2018 (or 30 per cent of the European Union’s total
gas consumption that year). This flare volume also releases annually the equivalent of 360 million
tons of CO2 into the atmosphere, which is equivalent to the yearly CO2 emissions of 77 million
cars.
Developing countries account for more than 85 per cent of total gas flared and vented. Africa
flares 32 bcm and vents 24 bcm of natural gas annually, about 19 per cent of the global volume,
and this is equivalent to 40 per cent of its yearly power consumption (or 290 terawatt-hours of
electricity).
If gas flared and vented globally is captured and brought to market, it could supply more
than all of South and Central America gas consumption, plus all of Africa’s power.
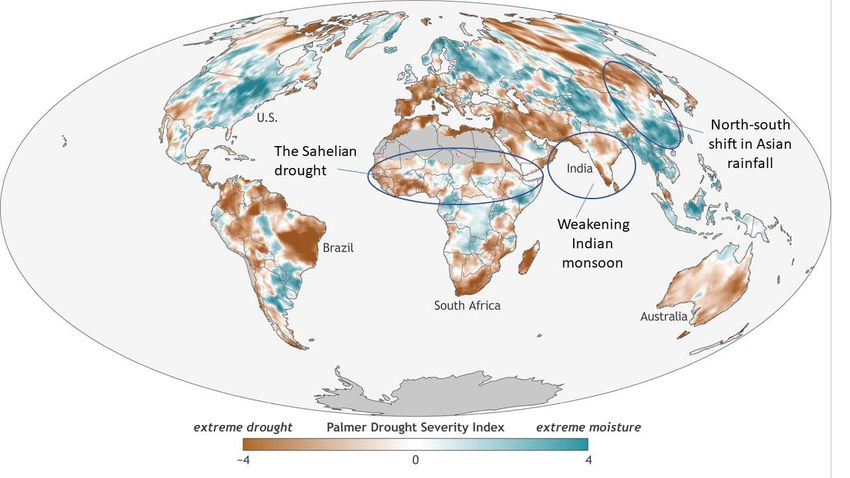
If flared and vented natural gas is added to other fugitive emissions, the total contribution of these
energy losses comprises 5.2 per cent of global GHG emissions, or 7.2 per cent of global energy
GHG emissions (see Figure 3) (Center for Climate and Energy Solutions 2020). This degree of
loss in the global energy system is highly significant, particularly because most of these are
avoidable losses. As discussed in the sections before, natural gas flaring and venting in particular
should be easier to avoid as these are deliberate and concentrated emissions as opposed to (other)
fugitive emissions that are mostly dispersed and caused by leaks.
Figure 3: Global manmade GHG emissions by sector (2013)
Source: reproduced from Center for Climate and Energy Solutions (2020), with permission.
10Table 1: Fugitive emission trends per country from 1994–2014
Source: authors’ calculations based on data from World Resources Institute CAIT Climate Data Explorer (2017).
Figure 4: Fugitive GHG emissions by country in 2014, 2004, and 1994
11Source: authors’ illustrations based on data from World Resources Institute CAIT Climate Data Explorer (2017).
In the period 1994–2014, the global fugitive emissions (in MtCO2e) increased by 35 per cent. What
is remarkable from the representations in Figure 4 and Table 1 is that over the course of 20 years,
the top 16 global emitters have barely changed. In 2004, Oman dropped out of the list being
replaced by the growing volumes in Angola. In 2014, India replaced Mexico, which had seen a
significant reduction in fugitive emissions from 47 MtCO2e in 2004 to 36 MtCO2e. These are the
only two changes in the world rankings of top fugitive emitters in 20 years.
A further key observation is that almost all large emitters are growing their emissions, with the
exception of the European Union (EU) (-44 per cent), Nigeria (-28 per cent), and Ukraine (-11 per
cent), which have reduced their emissions since 1994.
The top five emitters (Russia, US, China, Iraq, and Kuwait) were responsible for 50 per cent of
the global fugitive emissions in 2014. This was consistent over the years, with 50 per cent also in
2004 and 53 per cent in 1994. The only difference during these years was the displacement of the
EU by Iraq in the top five.
12The top three emitters, unchanged in their standing since 1994, have grown their fugitive emissions
much faster the rest of the world combined, i.e. twice as much since 2004 and one-and-a-half times
as much since 1994 (in terms of MtCO2e), representing 40 per cent and 37 per cent of global
fugitive emissions growth, respectively.
Figure 5: Comparison of countries with large fugitive emissions and those with large oil production
Top 16 fugitive emission country
Lower fugitive emission country
Note: countries listed in order of declining crude oil production volumes.
Source: authors’ illustration based on data from World Resources Institute CAIT Climate Data Explorer (2017)
and IEA (2020a).
Of the 16 largest fugitive emissions countries in 2014, 11 were also in the global top 15 oil-
producing countries 5 (see Figure 5). The other five largest emitting countries (and their rankings
in global oil production) were: Uzbekistan (ranked 53rd), Libya (30th), Ukraine (55th), Indonesia
(25th), and India (ranked 22nd). However, there are also large oil-producing countries with relatively
low fugitive emissions, such as those shown in Table 2. This demonstrates that it is possible to
have large oil production without having large fugitive emissions. The argument that fugitive
emissions are necessary and inevitable to produce oil is therefore flawed.
5
In Table 1 and in Figure 5, we have shown the 28 countries of the European Union as a single entity.
13Table 2: Large oil-producing countries with relatively low fugitive emissions and flaring volumes
2014 oil 2014 global 2014 2014 global 2014 flaring 2014 global
production oil producer fugitive fugitive volume flaring
(Mtoe) ranking emissions emissions (bcm) ranking
Country (MtCO2e) ranking
Saudi Arabia 553 1 8 44 1.9 19
United Arab Emirates 171 6 23 24 0.9 29
Mexico 145 11 36 20 4.9 8
Brazil 121 12 10 39 1.5 22
Norway 85 15 1 74 - -
Kazakhstan 84 16 36 21 3.9 9
Qatar 78 17 3 50 1.3 26
Note: Mtoe=million tonnes of oil equivalent.
Source: authors’ calculations based on data from World Resources Institute CAIT Climate Data Explorer (2017)
and IEA (2020a).
When we look at flaring as a subset of fugitive emissions, we see again a very consistent picture:
of the 16 countries with the largest fugitive emissions in 2014, 10 were also in the global top 16
oil-flaring countries (see Figure 6).
Between 2013 and 2019, the global annual volume flared increased by 7.5 per cent, from 139.6
bcm to 150 bcm. The top five flaring countries in 2019 were responsible for 50 per cent of the
globally flared volumes during 2013–19 (54 per cent in 2019). During the years, there has been
very little variability in the ranking order of the top flaring countries: 1) Russia, 2) Iraq, 3) US, 4)
Iran, and 5) Venezuela. 6 Since 2016, the United States has doubled its flaring under its growing
shale developments. Under economic sanctions, Iran significantly reduced flaring (20 per cent) in
2019 (see Table 3 for details).
6
In 2019, the United States displaced Iran for third place. Algeria is a close contender for fifth place (and had fifth
position in 2018).
14Figure 6: Comparison of countries with large fugitive emissions and those with large flaring
Top 16 fugitive emission country
Lower fugitive emission country
Note: countries listed in order of declining flaring volumes.
Source: authors’ illustration based on data from World Resources Institute CAIT Climate Data Explorer (2017)
and IEA (2020a).
As shown in Figure 7, the five largest flaring countries grew their annual flare volumes fastest, with
a total increase in volumes from 62.8 bcm to 81.7 bcm, an increase of 30 per cent between 2013
and 2019. Remarkably, the ‘rest of the world’ countries outside the flaring top 30 have been able
to reduce their flaring volumes by 35 per cent in the same period, from 13.1 bcm to 8.5 bcm. This
is especially noteworthy as the flaring top five have some of the most developed and mature oil
and gas infrastructure. The argument that routine flaring occurs mainly in the early production
phase to allow gas infrastructure development to catch up is not substantiated by the data.
Consistent with our views on fugitive emissions, we can similarly conclude that large oil production
can occur with relatively low flaring, as illustrated in Table 2 and Figure 8. Flaring is therefore not
a necessary evil associated with the production of oil. Countries such as Saudi Arabia, Norway,
Kuwait, Qatar, and UAE have relatively low flaring in view of the size of their oil production.
157
Table 3: Top 30 countries with largest flaring volumes in 2019
Note: increases from 2018 to 2019 in red; GGFR countries plus Saudi Arabia (Saudi Aramco) in green. The
amount of gas flared in 2019 was the largest since 2009 (GGFR 2020).
Source: authors’ calculations based on data from GGFR (2020).
7
Each cubic meter of natural gas produces circa 2.3 kg of CO2e emissions under full combustion (see Appendix A).
The 2016 global flaring volume of 147.6 Bcm is equivalent to 340 MtCO2e. Hence, the 2017 reduction in gas flaring
of nearly 5 per cent equates to an emissions reduction of 16 MtCO2e. However, in 2018 and 2019, flaring volumes
increased again, increasing emissions to 345 MtCO2e in 2019 (assuming full combustion).
16Figure 7: Large natural gas flaring countries appear to have disproportionally grown their flare emissions, while
small flaring countries have reduced their flaring
Source: authors’ illustration based on data from GGFR (2020).
Figure 8: Comparison of countries with large oil production and those with large flaring volumes
Note: countries listed in order of declining flaring volumes.
Source: authors’ illustration based on data from World Resources Institute CAIT Climate Data Explorer (2017)
and IEA (2020a).
17In 2002, at the World Summit on Sustainable Development, the Global Gas Flare Reduction
(GGFR) partnership was launched by Norway and the World Bank. The first priority was to work
with the National Oceanic and Atmospheric Administration (NOAA) in the U.S. Department of
Commerce to fill measurement gaps by producing the first flaring estimates based on satellite
observations for 60 countries. In 2015, a further initiative was launched by the World Bank,
Norway, and other parties to stop routine flaring by 2030. An increasing number of countries,
companies, and organizations have pledged their support since then. Despite urgency for material
progress on this initiative, efforts to date have made insufficient impact on global flare reduction.
However, in the period 1996–2010, the industry was able to reduce global flaring volumes by
almost 17 per cent; Russia and Nigeria are noteworthy in their reduction of gas flaring. An
explanation for this is the development of gas markets and the growth of LNG in these years
(Romsom and McPhail 2020). LNG has been a key technology in bringing remote stranded gas to
markets and in growing new markets for gas. Although the global use of gas (and LNG in
particular) has continued to grow rapidly since, this has not resulted in a further decline in gas
flaring (Figure 9).
The assumption that flaring is necessary to grow oil production to meet demand is not borne from
the evidence. From 1996 to 2010, global oil production grew from 69.5 mbopd to 83.4 mbopd
(+20 per cent), whilst global flaring reduced in the same period by 16.7 per cent. Consequently,
flaring intensity decreased from 6.52 m3/bbl in 1996 to 4.15 m3/bbl in 2017, a reduction of 36.4
per cent. Since 2017, this rose again to 4.32 m3/bbl in 2019 (see Figure 10). Flaring intensity is
often hailed as a success in flare-reduction efforts. However, this measure is only relevant when
comparing the relative flaring performance of assets, companies, and countries. Regarding the
impact of flaring, only absolute measures, such as cumulative volumes flared and/or vented, are
relevant. This is because our resource base and our environment have absolute, instead of relative,
limits and constraints.
Figure 9: The gas flaring reduction trend during 2005–10
Source: authors’ illustration based on data from GGFR (2020).
18Figure 10: Flaring intensity during 1996–2019
Source: authors’ illustration based on data from GGFR (2020) and BP (2020).
When evaluating flaring and crude oil production trends from individual countries during 2005–
17, we observe a marked variation in individual country trends (see Figure 11 and Table 4). This
further illustrates that oil production growth does not have to imply an increase in gas flaring.
Table 4: Individual country trends in oil production and flaring (in bold countries in Figure 11)
Top 21 Flaring Countries Oil Decrease Oil Stable Oil Increase
During 2005–17
Flaring Decrease Nigeria Angola Russia
Uzbekistan China Kazakhstan
Kuwait Qatar
Flaring Stable Libya Malaysia Saudi Arabia
Indonesia Oman Canada
Flaring Increase Venezuela Iran USA
Algeria Egypt Iraq
Mexico
Source: authors’ calculations based on data from GGFR (2020) and IEA (2020a).
19Figure 11: Individual country trends in oil production and flaring during 2005–19
Source: authors’ illustration based on data from GGFR (2020) and IEA (2020a).
206 Impact of hydrocarbon flaring and venting
Flaring and venting each have their own specific emissions impacts and affect climate, health, and the
environment differently
• There is considerable uncertainty in the assessment of fugitive emissions. Emissions data are sparse, and
uncertainty ranges are large. This has consequences on the transparency in polluting sources, pollutants
emitted, and the impacts thereof.
• Progress in remote-sensing technologies using satellite data, as well as in modelling of transport and
impact assessments, are important developments to reduce these uncertainties.
• Flaring and venting each have their specific emissions impacts and affect climate and the environment
differently.
• Different data resources use different variables for emissions (e.g., natural gas, CO2, methane, CO2-
equivalent), different quantities (e.g., volume, mass, energy), and different units (e.g., ton, tonne, kg, lb).
This makes data comparison and data integration difficult.
• Most impact assessments for natural gas flaring and venting focus on CO2 and methane emissions and
their impacts on climate in terms of US$/tonne CO2e.
• In addition to CO2 and methane, large amounts of strong pollutants on health and climate, such as VOCs,
organic carbon, NOX and SOX, carbon monoxide (CO), ammonia (NH3), hydrogen sulphide (H2S), and
BC, are emitted when natural gas flares are not designed or operated properly.
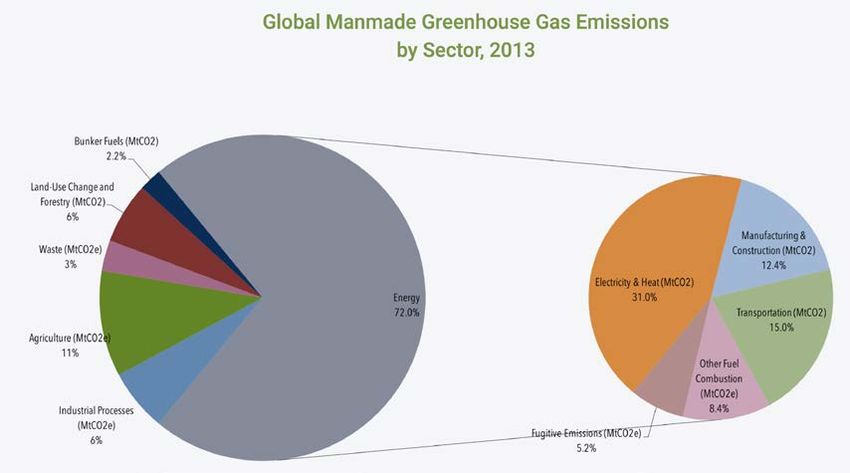
• In absence of published integrated impact assessments that combine climate, air quality, and health
impacts for the wide range of pollutants emitted during flaring and venting, the authors adopted Shindell’s
SCAR methodology, presented in this paper.
Having evaluated the scale and trends in global flaring and venting in the previous section of this
paper, we will now discuss the impact of these oil and gas activities in terms of emissions. As
described earlier, there is considerable uncertainty in the determination of fugitive emissions. The
data are sparse, and there is a widespread between individual estimates, as illustrated in Figure 1.
Progress in remote-sensing technologies using satellite data, as well as in modelling of transport
and impact assessments, are important developments to reduce these uncertainties in terms of
completeness, accuracy, and consistency of emission measurements. Flaring and venting each have
their specific emissions impacts and affect climate and the environment differently. While all
flaring is deliberate, methane and other emissions have the additional complexity that these can be
deliberate or accidental (e.g., leaks). Emissions that are part of process streams are easier to
eliminate by diverting these to other uses. Methane emitted from oil and gas operations in 2019
comprised 81.5 million tonnes (138 million tonnes of natural gas), and this contributed some 60 per
cent of the total methane emitted from the energy sector and 6 per cent of GHG emissions from
the global energy sector (IEA 2020c). 8
The combined amount of natural gas flared and vented has stayed relatively constant during 2000–
19. 9 However, the contribution of gas flared decreased from 58 per cent in 2000 to 49 per cent in
2019. In this period, natural gas flaring reduced in absolute amounts by 13 mtpa, while natural gas
venting emissions increased by 32 mtpa (19 mtpa of which is methane) (see Figure 12).
8
However, since 2017, both flaring and methane emissions are on the rise.
9
The IEA 2019 estimate for global methane emissions is 81.5 mtpa, an increase of 2.5 Mt since 2019 (+3.2 per cent).
Upstream oil emits 46.5 per cent, upstream gas 34.5 per cent, and downstream gas 19 per cent (IEA 2020b).
21Figure 12: Flaring and venting from oil and gas operations during 2000–19
Note: methane mtpa emissions as per IEA have been converted to natural gas mtpa using methane density and
raw gas properties described in Appendix A.
Source: authors’ illustration based on data from GGFR (2020) and IEA (2020c).
Figure 13: CO2-equivalent emissions from flaring and venting in oil and gas operations during 2000–19
Note: for flaring, a 100 per cent combustion efficiency has been assumed; for venting, only methane emissions
(as per IEA) have been counted, split into a 100-year time horizon and the incremental impact from assuming a
20-year time horizon.
Source: authors’ illustration based on data from GGFR (2020) and IEA (2020c).
22Although flaring contributes 48–58 per cent of the global natural gas flared and vented in oil and
gas operations under the assumption of perfect combustion, its climate impact in terms of CO2-
equivalent emissions seems significantly less, i.e. 14–20 per cent based on a 100-year time horizon
and 5–8 per cent based on a 20-year period (see Figure 13). Methane emission avoidance is a major
opportunity in reducing the short-term emissions impact on global warming.
However, this does not mean that flaring emissions can be ignored. Other than CO2, significant
pollutant emissions result from poor flare combustion processes. Flaring was not considered to
be an important source of air pollution for a long time, and hence, non-CO2 emissions from flaring
were not inventoried nor included in IPCC assessments. More recent climate models now include
emissions such as particulate matter (PM), aerosols, and other agents causing climate change.
In 2015, the eight member states of the Arctic Council (four of which are major oil and gas
producers—Canada, Norway, Russia, and the United States) adopted the ‘Enhanced Black Carbon
and Methane Emissions Reductions: An Arctic Council Framework for Action’ (Arctic Council
2019) given the impact on human health and the environment. The following year, and for the
first time, the IEA’s (2016) World Energy Outlook analysed the links between energy, air pollution,
and health. It focuses on how the energy sector can contribute to improved air quality as the
fourth-largest threat to human health. The IEA finds that ‘energy production and use—mostly
from unregulated, poorly regulated or inefficient fuel combustion—are the most important man-
made sources of key air pollutant emissions: 85 per cent of particulate matter and almost all of the
sulfur oxides and nitrogen oxides’.
6.1 Hydrocarbon flaring often does not meet performance standards
A flare is prone to fail to ignite or to be blown out, particularly if the heating value of its feed gas
is too low. Instead of the natural gas being flared, these volumes are then vented with increased
climate impact in terms of MtCO2e. To avoid the occurrence of these situations, EPA prescribes
a minimum heating value of the gas to be flared of 300 Btu/scf (EPA 2012).
Flare gas emissions are seldom measured but estimated based on assumptions for flow rates, gas
composition, and quality of the combustion process. Without measurements, it is very difficult to
assess if these assumptions are correct, and hence, large deviations between assumed and actual
flare emissions can occur. EPA prescribes a 98 per cent destruction efficiency for a well-operated
flare system, equating to a 96.5 per cent combustion efficiency (EPA 2016b). The flare emission
factors are defined based on this assumption, although many flare systems may not achieve this
destruction efficiency.
In the United States, emission factors for flares were developed in 1991 based on pilot-test data
from the 1980s. Under the Clean Air Act, the emission factors were supposed to be reviewed and
updated every three years. However, these reviews were never carried out, and the assumed factors
remained unchanged until 2014 when they were amended after a lawsuit forced EPA to carry out
the review based on actual refinery data. The review demonstrated that the flare emission of VOCs
was four times the amount previously assumed (Environmental Integrity Project 2015).
6.2 VOCs
VOCs are organic chemicals that have a high vapour pressure, i.e. they evaporate easily from a
liquid (or solid) into a gaseous state in the surrounding air or as a natural gas. VOCs have short
atmospheric lifetimes (fractions of a day to months) and limited direct effect on radiative forcing.
However, VOCs influence the climate through their production of organic aerosols and their
involvement in the production of ozone (O3) in the presence of NOX and light. VOCs are the
23precursors to smog and can be hazardous (i.e. toxic) air pollutants (HAPs). The EPA assessment
of the public health costs of VOCs range from US$900 to US$4,000 per ton (2015).
Significant VOC emissions occur from natural gas venting, leakages of oil and gas installations,
and poorly operated flares. EPA’s 2015 accepted emission factor for VOCs is 0.66 lb/MMBtu
(EPA 2018). With a typical heating value of unconditioned flare gas of 1,242 Btu/scf (see
Appendix A), the VOC emission factor equates to 0.0131 kg/m3. Based on GGFR natural gas
flaring estimates for the United States, the resulting amount of VOCs emitted based on the EPA
emission factor was estimated at 124,730 tonnes in 2017 and 185,120 tonnes in 2018. As
mentioned above, the emission factor may overestimate the destruction efficiency of flare
combustion, resulting in higher actual VOC emissions from flaring. Nevertheless, flaring will
combust a large fraction of VOCs, while vented emissions will emit VOCs directly into the
environment. Total VOC emissions in the United States from the oil and gas industry in 2017 was
estimated at 2.54 million tons (EPA 2017) (see Table 5).
Table 5: VOC emissions in the US oil and gas industry split by source
2017 VOC Emissions from US Oil Amount of VOCs Share of total VOC emissions
and Gas Industry 10
(in tons)
Gas Flaring 137,491 5.4%
Gas Venting 2,354,588 92.6%
Subtotal Oil & Gas Production 2,492,079 98%
Refineries 51,718 2%
Total Oil and Gas 2,543,797 100%
Source: authors’ calculations based on data from EPA (2017).
The United States follows the global average trend that flaring and venting each contribute about
half to natural gas volume emissions. 11 This implies that of the VOCs entering natural gas flares
(~2.35 million tons), only 0.137 million tons remain after combustion. This equates to a
destruction efficiency of 94.22 per cent instead of 98 per cent.
Based on above-mentioned EPA assessments of public health costs, VOC emissions from US oil
and gas operations are therefore estimated to be in the range of US$2.23 billion to US$10.18 billion
per year (in 2015 US$). The most commonly emitted VOC compounds (other than alkanes) and
their emissions in the United States are presented in Table 6.
10
The conversion of tonne (metric ton) to US short ton is based on 1 ton = 0.90718 tonne.
11
For 2019, IEA estimated US methane emissions from upstream oil and gas operations at 9.117 Mt (excluding
downstream gas contribution of 2.225 Mt). Based on a methane density of 0.668 kg/m3 and the unprocessed natural
gas composition in Appendix A, this equates to 17.43 Bcm of natural gas vented. For 2019, the latest figures from
Groom and Hiller (2020) indicate a further increase in US flaring from 14.1 Bcm in 2018 to 16.16 Bcm in 2019. The
relative contribution from venting and flaring in the United States in Bcm of natural gas is therefore 52 per cent versus
48 per cent, respectively.
24You can also read