How Can Climate Resilience Be Measured and Visualized? Assessing a Vague Concept Using GIS-Based Fuzzy Logic - Eldorado
←
→
Page content transcription
If your browser does not render page correctly, please read the page content below
sustainability

Article
How Can Climate Resilience Be Measured and
Visualized? Assessing a Vague Concept Using
GIS-Based Fuzzy Logic
Mathias Schaefer 1, * , Nguyen Xuan Thinh 1 and Stefan Greiving 2
 1    Department of Spatial Information Management and Modelling (RIM), TU Dortmund University,
      44227 Dortmund, Germany; nguyen.thinh@tu-dortmund.de
 2    Institute of Spatial Planning (IRPUD), TU Dortmund University, 44227 Dortmund, Germany;
      stefan.greiving@tu-dortmund.de
 *    Correspondence: mathias.schaefer@tu-dortmund.de

 Received: 9 December 2019; Accepted: 11 January 2020; Published: 15 January 2020

 Abstract: As negative impacts of climate change tend to increase in the future, densely-populated
 cities especially need to take action on being robust against natural hazards. Consequently, there is a
 growing interest from scientists in measuring the climate resilience of cities and regions. However,
 current measurements are usually assessed on administrative levels, not covering potential hotspots
 of hazardous or sensitive areas. The main aim of this paper focusses on the measurement of climate
 resilience in the City of Dortmund, Germany, using Geographic Information Systems (GIS). Based on
 a literature review, we identified five essential components of climate resilience and initially designed
 a theoretical framework of 18 indicators. Since climate resilience is still a vague concept in scientific
 discourses, we implemented local expert knowledge and fuzzy logic modelling into our analysis.
 The benefit of this study not only lies in the fine-scale application, but also in the relevance for multiple
 disciplines by integrating social and ecological factors. We conclude that climate resilience varies
 within the city pattern, with the urban core tending to be less resilient than its surrounding districts.
 As almost the entire geodata set used is freely available, the presented indicators and methods are to
 a certain degree applicable to comparable cities.

 Keywords: climate resilience; sustainable development; urban planning; remote sensing; fuzzy logic;
 compromise programming

1. Introduction
     The worldwide issue of climate change, population growth and environmental pollution is
becoming increasingly apparent to the general public—including the youth—and is discussed
controversial via social media [1,2]. However, it is empirically documented that urban agglomerations
with high population densities are particularly confronted with air and noise pollution, urban heat
islands’ effects due to a lack of green spaces, or flash floods enforced by ongoing surface sealing
processes. Despite these circumstances, it is also expected that 68% of the world’s population by the
year 2050 will live in cities, which probably reinforces the above issues [3]. It is plausible that in the
case of an extreme event many people and infrastructures in large cities are affected at once, as they
are cumulated in a relatively small space, which also triggers cascading effects such as disruptions
of supply chains which leads to negative economic impacts. With economic losses of over 96 billion
euros due to climate-related extremes between 1980–2017, Germany is ranked on the first place in the
Europe Economic Area (EEA) [4]. In addition, in 2003 and 2018, Germany had its two hottest and
driest meteorological summers since the beginning of systematic weather records in 1881 [5,6].

Sustainability 2020, 12, 635; doi:10.3390/su12020635                        www.mdpi.com/journal/sustainability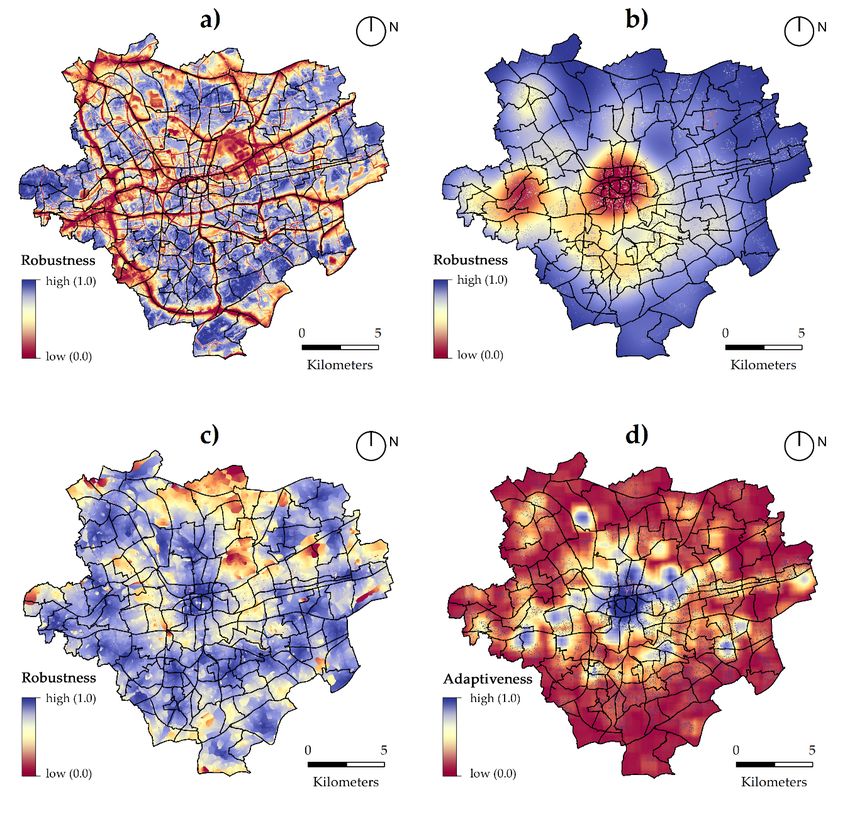
Sustainability 2020, 12, 635                                                                         2 of 30

      Whenever current debates on climate change and extreme weather events are discussed in the
context of urban planning, the concept of climate resilience is often echoed by politicians and scientists.
In brief, a climate resilient city has the ability to adapt proactively to changing environmental conditions
and recover quickly from the negative consequences of external shocks triggered by extreme weather
events. This indicates that climate resilient thinking goes beyond but not exclude climate protection
or reactive climate adaptation, as described through Walker and Salt’s metaphor of a ball in a basin:
The ball (i.e., urban system) maintains its general features and functions in a basin (the ability to change
or respond to a shock), but after external extreme events, the ball can be pushed into a new basin
with different structures and conditions, by maintaining its self-organizing capacity [7]. Responding
to an external shock enables a city to recover after extreme events and to keep its basic essential
functions, which is also highly depending on the public wellbeing, the build environment and natural
capital [8]. As the vulnerability of the exposed people plays a major role in such events, social inequity
in health and environmental infrastructure access can even reinforce potential harms through extreme
events [9,10]. Environmental justice or social-ecological equity is a social aim to provide adequate
access to spatial and environmental goods (including human protection against environmental burdens
or security of climate extreme events), which is also affecting the quality of life at a place of residence.
Especially subgroups like the elderly, infants, homeless, poor, or disabled tempt to be more vulnerable
to environmental burdens, often driven by residential segregation processes over time [11]. To establish
a connection, a current issue of social-ecological inequalities and extreme weather events is that “there
have been relatively few attempts to integrate environmental justice into resilience thinking”, although
both domains are inextricably intertwined [12,13]. For urban planners, this demands designing
settlements and infrastructures to meet the challenges of today’s and tomorrow’s climate, while also
capturing connections between vulnerabilities and social-environmental challenges [14]. In a sense
of a “just climate resilience”, risks to the urban system and its subsystems must be examined in a
holistic way [8,15]. This requires also a parallel modelling approach which means that demographic
and socioeconomic changes are projected in parallel to the changes of the climatic system consideration
of socio-economic changes [16]. Over the last 10 years, the number of international publications
on resilience in general has increased exponentially, underlining the attraction of the topic [17,18].
This enormous popularity leads to the stimulation of many interdisciplinary dialogues in academic and
policy circles [18]. On the contrary, due to the wide-ranging forms of interpretation, this “fuzziness”
often causes ambiguities in the scientific operationalization process and therefore impedes convergent
decision making for new strategies and policies [19–21]. Fuzzy logic provides a suitable tool for
modelling vague, imprecise, incomplete and subjective data, combining linguistic variables with
IF-THEN rules in order to emulate human reasoning. Therefore, fuzzy logic is an effective candidate
for measuring and assessing resilience, e.g., in Multi Criteria Decision Analyses (MCDA) [22].
      Since 2015, there is also a considerable interest of the German Federal Ministry of Education
and Research (BMBF) in funding research projects that are dealing with adaptation to climate change
and elaborating solutions for cities and regions to strengthen their resilience [23]. The work is part
of the BMBF project “Zukunft-Stadt-Region-Ruhr” (ZUKUR), which focuses on a cross-disciplinary
approach to contribute to the reduction of social-ecological inequalities and the increase of climate
resilience at the scale of regions, cities and neighborhoods. One key research aim of ZUKUR is to find
out, whether environmental disadvantaged and sensitive societal groups are extra affected by multiple
environmental threads in the Ruhr-Area, Germany. This article demonstrates an interdisciplinary GIS-
based fuzzy logic approach on the City of Dortmund to examine spatial distribution patterns in the
light of climate resilience and social-ecological disparities. On the basis of a comprehensible framework
and via cartographical visualizations, potential (non-)climate resilient locations can be identified.
Following this line of thought, the debate on climate resilience indicators and open geodata—especially
in Germany—should be enriched. The results should provide a point of departure to launch an
evaluation process in order to inform urban planning and decision makers early about climate impacts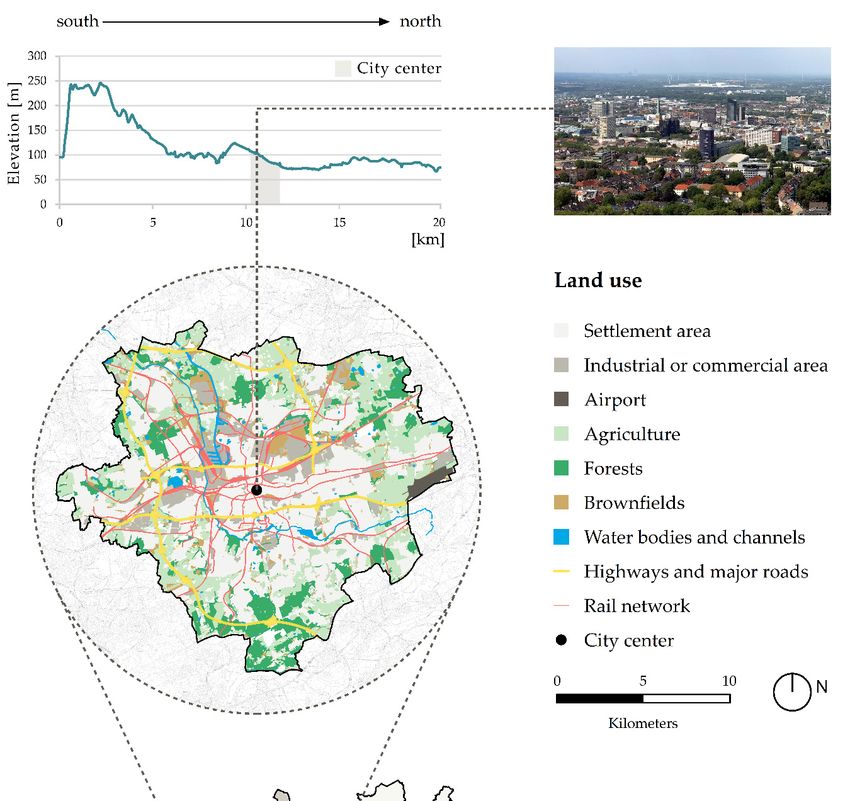
Sustainability 2020, 12, 635                                                                                   3 of 30

and spatial disparities. Doing so, also allows monitoring the progress and effectiveness of devised
climate resilience strategies over time.

2. A Brief Review of Understanding and Measuring Climate Resilience
      The resilience term initially got popular by the psychologist E. Werner after documenting the
individual development of 698 Hawaiian children over 40 years. The major finding was that some
children recovered more from similar perinatal traumata and adverse conditions (e.g., poverty) than
others. Those children were “resilient” [24]. In 1973, C. S. Holling introduced the resilience concept to
the social-ecological sector, describing it as the capacity of an ecosystem to retain its basic organization
while undergoing necessary change in the face of ecological disturbances (e.g., by human) [25]. Here,
the bounce forward behavior of an ecosystem after a disturbance joined the scientific discourse and
replaced previous perspectives on a bounce back effect into equilibrium, [26]. While the global debate
around climate change got more serious at the late 1990s, resilience also gained prominence in the field
of climate adaptation in cities and regions [27]. Today, the opportunity to innovation and reorganization
after disturbances for a city as a normative agenda is raising a multitude of urban planning topics,
often following the dynamic credo that “we hardly ever return to where we were” [21]. First influences
on European spatial planning can be identified by the fact that climate and disaster risks should be
important elements in the decision making process of the environmental impact assessment (EIA) [28].
Climate resilience is also widely understood as a complement to a sustainable development, because
the transition towards a state that meets the needs of the present without compromising the ability
to meet the future generations is prevented, if climate threats interrupt planning processes [29–31].
As a consequence, policies that promote climate resilience can also contribute to more sustainable
structures, not least because resilience is addressed by Sustainable Development Goal 11 (SDG) of the
United Nations (UN) 2030 Agenda [32–34].
      It is not intended to further expand the theoretical debate of the resilience concept, as this
has been conducted thoroughly in previous studies [17,35,36]. Nevertheless, for a comprehensible
operationalization and measuring procedure in GIS, a pragmatic definition has to be chosen which
shows the key aspects of climate resilience of a city with respect to its social-ecological systems [37].
Drawing on the great amount of existing research articles and reviews, the essential components of
climate resilience respected in this study are summarized in Table 1. In theory, the more pronounced
these components are, the more resilient a city is to weather related stresses and shocks.

       Table 1. Persistent key components of climate resilience definitions respecting different researches.

                                                Explanation                                     Source
           R          Robustness and adaptiveness to climate related stresses and shocks          [35,38]
           E                  Evaluation and Monitoring: resilience as a process                  [39,40]
           S            Scale (Countries, Regions, Cities, Neighborhoods, Individual)             [39–42]
           I            Interdisciplinarity: resilience as umbrella for different sectors         [18,40]
           L                               Learning and innovation                              [37,43,44]
           I            Information and transparency: resilience as participation tool            [40,45]
           E                          Environment (natural and built up)                          [17,35]
           N               Networked systems and actors (multilevel governance)                     [35]
           C        Capacity to transform after disturbance but maintain self-organization       [7,21,46]
           E         Equity and Justice: resilience measurements must not exclude others      [42,44,47,48]

      When it comes to the measurement of climate resilience, robustness (Robustness describes the
ability of a city (and its subsystems) to withstand external shocks, to absorb them or to limit the adverse
effects and consequences) as well as adaptiveness (Adaptiveness enables a city to cope with adverse
effects and to respond to changed climatic conditions in the long term, which requires in particular
financial resources as well as planning and design decisions [49]) are regarded as the two prerequisites
that can be further operationalized, embracing the other aspects mentioned in Table 1 [50,51]. While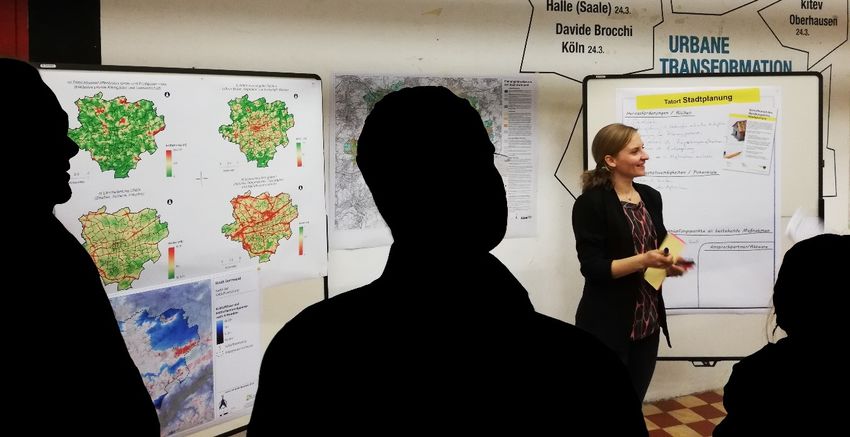
Sustainability 2020, 12, 635                                                                             4 of 30

robustness can be covered quite well with secondary (geo-)data, the adaptiveness concept is mostly
seen through a more qualitative lens and therefore challenging to manage in GIS-based analysis.
Currently, this primary data can be assessed by volunteered geographic information (VGI), household
surveys or interviews on topics like active climate adaptation strategies and masterplans [45,52]. On the
other hand, if not integrated into existing surveys, such primary data collection may be very time and
cost consuming. In addition, it is difficult to guarantee a full coverage of an entire city while only
catching a brief impression of the interviewees.
      From a global point of view, the GIS-based measurement of resilience with indices or scorecards
is nothing new [53–57]. Unfortunately, a concrete application in Germany, especially within the
community scale, is still missing. For example, a first interdisciplinary proposal could be perceived in
2010 by comparing the vulnerability of German autonomous cities and regions using 18 indicators [58].
As a first step onto resilience measurement, Brunetta and Salata conceived a GIS-approach to map the
impact of shocks and linear pressures on sensitivities in the city of Moncalieri, Italy [59]. Moghadas et al.
introduced a multi criteria approach using weighting factors for assessing urban flood resilience in
the 22 urban districts of Tehran, Iran [60]. Based on several workshops and literature review, in 2019
Feldmeyer et al. provided a theoretical framework of 24 indicators to assess urban climate resilience at
city scale in Germany [40]. To our knowledge, these indicators have not been applied or tested on a
practical example.
      To summarize, predefined metrics on climate resilience in Germany are too abstract for urban
planning decisions, as the results would not show distributional effects, but one resilience score for the
whole urban fabric or its districts, corresponding to the Modifiable Arial Unit Problem (MAUP) [61].
Often, these limitations are influenced by data restrictions. Furthermore, because of the different
situations cities are facing, it is difficult to identify if one city is more resilient than the other using the
same indicator set. Every municipality is shaped by its own demographic and institutional structures.
External shocks may occur in different places, which accordingly implies that “a single prescriptive
scorecard does not suit cities of different sizes and contexts” [39].

3. Study Area
      The City of Dortmund, which belongs to the federal state of North Rhine-Westphalia (NRW),
is located in the Ruhr-Area, the largest urbanized agglomeration in Germany, where the three
administrative districts Münster, Düsseldorf, and Arnsberg come together (Figure 1). With about
600,000 inhabitants (2018) and a size of 280 km2 , Dortmund is the largest city in the Ruhr-Area
and one of the main economic hubs in NRW [62]. During the phase of industrialization in the
19th century, Dortmund quickly developed into a center of coal and steel industry, which led to an
increased immigration of workers from Eastern Europe and the establishment of new workers’ housing
estates. In the late 20th century, deindustrialization processes resulted in enormous brown fields and a
fundamental transition from a heavy-industry based economy to a service sector based model in the
whole Ruhr-Area, which was accompanied by high unemployment rates caused by a loss of 90,000 jobs
between 1960 and 1994 just in the City of Dortmund [63]. While retaining the image of an industrial
city, new jobs were created, mainly in the tertiary and finally quaternary sector. Especially the southern
districts of Dortmund now offer attractive housing and employment locations, whereas the northern
districts are marked by dense building structures with a high degree of unemployment and migration
background, finally resulting in a socioeconomic north-south polarization [64].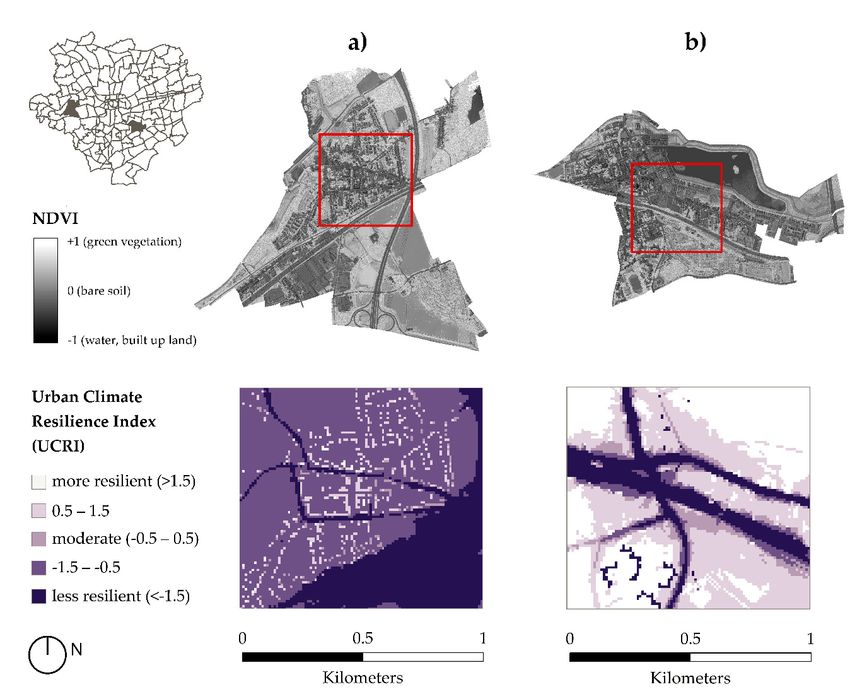
Sustainability 2020,
    Sustainability   12, 12,
                   2020, 635x FOR PEER REVIEW                                                   5 of5 of
                                                                                                      30 30

                                                Figure 1. Study area.
                                                 Figure 1. Study area.
      Today, as another result of former coal mining activities, large parts of the city’s territory are
        The drought and hot summer of 2018 enforced many urban heat islands and crop losses, while
subsided up to 20 m, which are mostly equipped with artificial drainage facilities [65]. The land use
        storms in 2014, 2018 and 2019 caused damage and harm to people and the built environment.
of the central city is characterized by a high degree of settlement. Approximately one third of the
        As a reaction to the increasing number of extreme weather events, on 15 November 2018 the
settlement areas are sealed to more than 60% and often characterized by urban heat islands. On the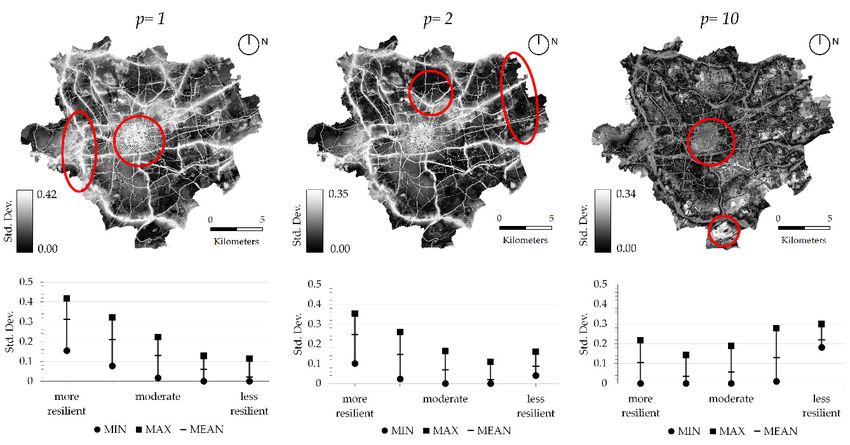
Sustainability 2020, 12, 635                                                                                         6 of 30

contrary, radial surroundings of open and green spaces as well as agricultural uses are providing
nightly fresh and cold air.
    The two main reasons for choosing the City of Dortmund as study area are as follows:

1.      During the last decade, the effects of climate change like urban flooding, storms, heat waves and
        droughts have been particularly noticeable for local residents. Significantly urban flooding due
        to a heavy rainfall event in July 2008 caused damage to infrastructures and residential properties:
        Within two and a half hours, 203 mm of precipitation fell over the western part of Dortmund,
        especially the sub-districts Marten and Dorstfeld [66].
      The drought and hot summer of 2018 enforced many urban heat islands and crop losses,
     Sustainability 2020, 12, x FOR PEER REVIEW                                                                   6 of 30
      while storms in 2014, 2018 and 2019 caused damage and harm to people and the built environment.
      As a reaction to the increasing number of extreme weather events, on 15 November 2018 the
        council decided to develop an integrated climate adaptation masterplan to strengthen resilience
      council
        for the decided    to The
                 entire city.  develop   an integrated
                                    analysis results couldclimate adaptation
                                                             support             masterplan to
                                                                      the conceptualization         strengthen
                                                                                                  procedure.     resilience
                                                                                                              Previous
      for
        GIS-based studies have also shown that—to a certain degree—Dortmund is confrontedPrevious
           the entire  city.  The  analysis  results  could   support   the conceptualization       procedure.      with
      GIS-based     studiesinequalities
        social-ecological       have also [67,68].
                                           shown that—to a certain degree—Dortmund is confronted with
      social-ecological inequalities [67,68].
2. 2. Since
        SinceJanuary
                January     2017,
                        2017,       the availability
                                the availability        of geodata
                                                  of open    open geodata       of the and
                                                                    of the surveying      surveying     and
                                                                                                cadastral     cadastral
                                                                                                          administration
        administration      in   NRW   has   been   considerably   improved       [69].  As
      in NRW has been considerably improved [69]. As a consequence, digital elevation models  a  consequence,    digital
                                                                                                                    (DEM),
        elevation
      digital       modelsmodels
               landscape       (DEM),(DLM),
                                       digital noise
                                                landscape    models
                                                       pollution     (DLM), noise
                                                                 mappings,      climate pollution
                                                                                          analysesmappings,     climate
                                                                                                     and high-resolution
        analyses
      Digital      and high-resolution
                Orthophotos       (DOP) areDigital  Orthophotos
                                               freely             (DOP)the
                                                       available under     areGerman
                                                                                freely available    under»dl-de/by-2-0«.
                                                                                           data license    the German
        data  license  »dl-de/by-2-0«.    In  this sense,  there are  fewer   formal    and  financial
      In this sense, there are fewer formal and financial barriers to the outlined research purpose     barriers  to theand
        outlined   research   purpose   and  more    precise analyses  up  to  parcel  level are
      more precise analyses up to parcel level are feasible. The City of Dortmund should serve as feasible. The City   of an
        Dortmund      should    serve as  an illustrative  example   to  present   the  potential   application
      illustrative example to present the potential application of this free geodata and to connect those        of  this
        free geodata and to connect those individual data sets thematically.
      individual data sets thematically.

4. 4.Materials
      MaterialsandandMethods
                       Methods
        In general, the workflow of our methodology can be divided into four analytical steps (Figure
      In general, the workflow of our methodology can be divided into four analytical steps (Figure 2).
   2). The initial preparation phase was important to create an overview of current resilience
The initial preparation phase was important to create an overview of current resilience measurements
   measurements and the landscape of possible indicators. Based on these findings, dimensions, criteria
and the landscape of possible indicators. Based on these findings, dimensions, criteria and indicators
   and indicators representing climate resilience of a city were carried out as a hierarchical framework,
representing climate resilience of a city were carried out as a hierarchical framework, integrating
   integrating practical knowledge for adequate indicator selection and data acquisition that fit the
practical
   prioritiesknowledge    for The
               of Dortmund.    adequate  indicator
                                   preparation   and selection
                                                      indicator and
                                                                grid data   acquisition
                                                                      calculation         that on
                                                                                  was based    fit ArcGIS
                                                                                                   the priorities
                                                                                                           for
ofDesktop
     Dortmund.      The  preparation  and  indicator   grid calculation   was   based  on  ArcGIS   for
              Advanced 10.4.1 (Environmental Systems Research Institute, ESRI) as well as its Spatial   Desktop
Advanced
   Analyst and10.4.1Network
                     (Environmental
                              Analyst Systems   Research
                                       extensions.         Institute,
                                                    In addition,  theESRI)
                                                                       freelyasavailable
                                                                                well as its Spatial Analyst
                                                                                          landscape   analysisand
Network     Analyst   extensions. In addition, the freely available landscape   analysis  program
   program FRAGSTATS 4.27 [70,71] and remote sensing software ENVI 5.4 (Exelis Visual Information   FRAGSTATS
4.27  [70,71] and
   Solutions)   wereremote  sensing software ENVI 5.4 (Exelis Visual Information Solutions) were applied.
                      applied.

                                        Figure 2.
                                        Figure 2. Schematic
                                                  Schematicworkflow
                                                            workflowofofthe
                                                                         thestudy.
                                                                              study.

          After operationalization and calculation, all raster grids with crisp values were imported into
     the freely available Spatial Analysis and Modelling Tool SAMT2 [72,73], followed by fuzzification
     with corresponding linguistic variables, rule-based inference process and defuzzification to
     standardized crisp variables. This step was iterated on every hierarchical level (indicators, criteria
     and dimensions) of the framework. The final procedure was the aggregation of the defuzzificated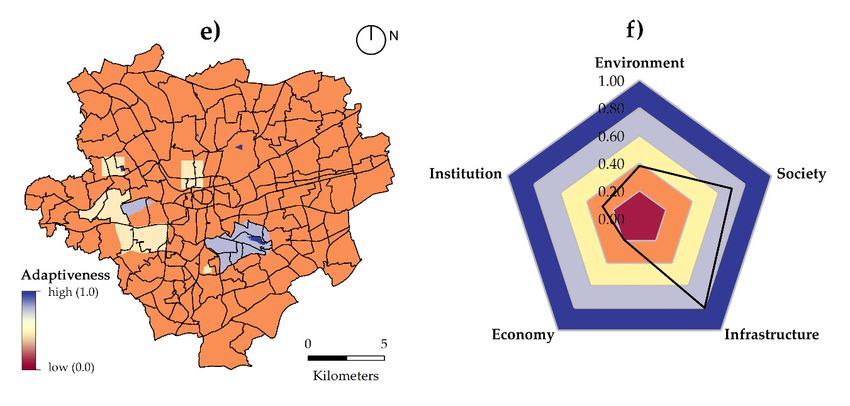
Sustainability 2020, 12, 635 7 of 30
After operationalization and calculation, all raster grids with crisp values were imported into the
freely available Spatial Analysis and Modelling Tool SAMT2 [72,73], followed by fuzzification with
corresponding linguistic variables, rule-based inference process and defuzzification to standardized
crisp variables. This step was iterated on every hierarchical level (indicators, criteria and dimensions)
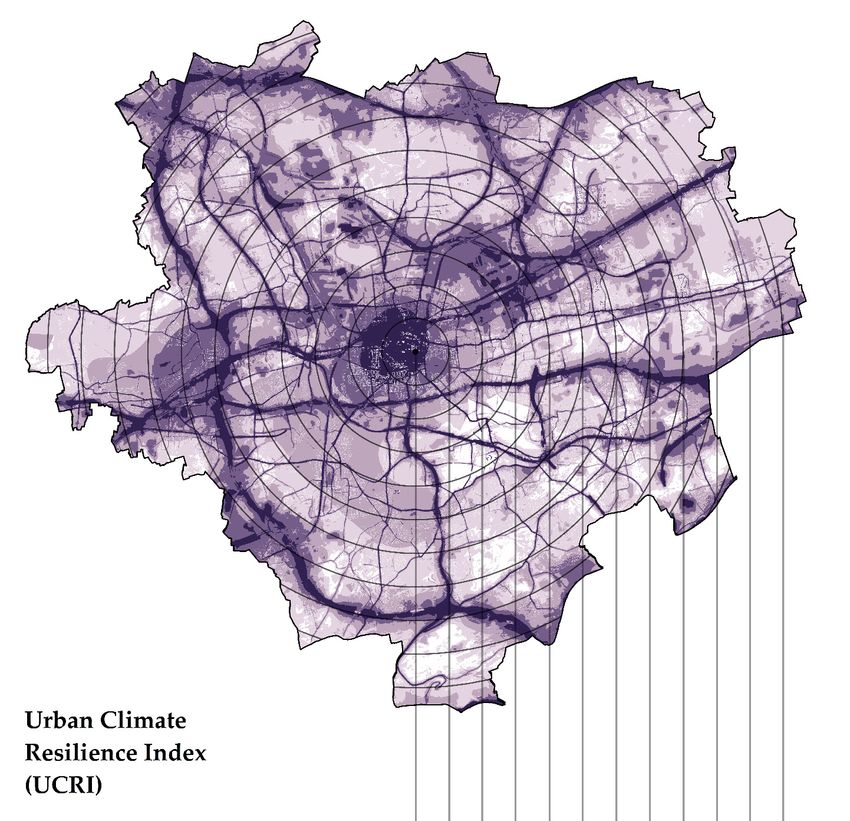
of the framework. The final procedure was the aggregation of the defuzzificated raster grids to a
general Urban Climate Resilience Index (UCRI), visualizing more and less climate resilient locations
within the community scale.
4.1. Data Collection and Preparation
To properly address the situated problem statement, the use of consistent data is essential. As
described earlier, secondary open data that is routinely refreshed and published by statistical agencies
is important for a city to compare its own state over time. For this study, a broad dataset was collected,
mainly composed of raster, vector and socio-economic data (Table 2). With the use of the freely
available road vectors as linear features from OpenStreetMap (OSM), two network datasets both for
car driving as well as walking routes were created using Network Analyst. This procedure allowed us
to quantify the access of different locations within a certain catchment area (i.e., the access of open
and green spaces) in a more realistic way than other tools like simple buffering or Euclidean distance,
because it orientates on the real road network like a navigation system [74]. For car driving, missing
information on maxspeed limitations (km/h) were subsequently added, using standard values for
each road type (Table A1) [75]. Fire brigade operations due to extreme weather events (storms, heavy
rainfalls and heat stress) between 2008 and 2018 were provided as table-based long–lat-coordinates,
which initially were converted to multipoint data in GIS. Raster data on noise pollution was previously
modelled by the Environmental Office Dortmund. Other noise pollutants like construction noise or
sports and recreational noise are not included.
Yet important questions about social-ecological phenomena and data on air pollution were not
included in this work, as the finest available spatial resolution here is 1 × 1 km of different pollutant
emissions in NRW for 2013 and thus too coarse and outdated for the research purpose. However,
because noise pollution is likely to spatially correlate on air pollution (especially next to streets and
industrial sites), the noise pollution mapping appears to give an insight, where potential air pollution
could occur within the city [76]. The provided heavy rain hazard mapping was previously modelled
by the engineering office Beck GmbH & Co. KG (City of Wuppertal) using a DSM of 2012 for a return
period of 100 years on a spatial resolution of 1 × 1 m. The mapping consists of three raster images,
including flow directions, water depths in m and flow velocity in m/s. Unfortunately, a modelling of a
return period of more than 200 years, which happened in Dortmund Marten in 2008, was not available.
Cold air volume flows in m3 /s have been calculated in 2012 by GEO-NET Umweltconsulting GmbH
in cooperation with Prof. Dr. G. Groß (University Hannover) for entire NRW with the application
of the mesoscale FITNAH climate simulation model, respecting the development of various climatic
parameters such as wind and temperature over a daily cycle on a grid of 100 × 100 m. For spatial
modelling, an air temperature of 20 ◦ C at 21 o’clock, a cloudless sky and no supra-regional wind
currents for modelling was assumed. In order to generate a digital surface and digital terrain model,
Airborne Laserscanning 3D- point data with a 0.5 m interval was interpolated to a 1 × 1 m raster using
natural neighbor algorithm in GIS. By subtracting the DTM of the DSM, a normalized Digital Surface
Model (nDSM) could be calculated, highlighting off-terrain objects (e.g., buildings, trees etc.). Building
parcels of the city with actual land use could be examined and extracted out of the Authoritative real
estate cadastre information system (ALKIS). The Land Use classification of the ATKIS Basic DLM meets
the requirements for high thematic and spatial resolution (±3 m), while being available for complete
NRW with a nationwide thematically consistency and a cyclically update every 3–5 years.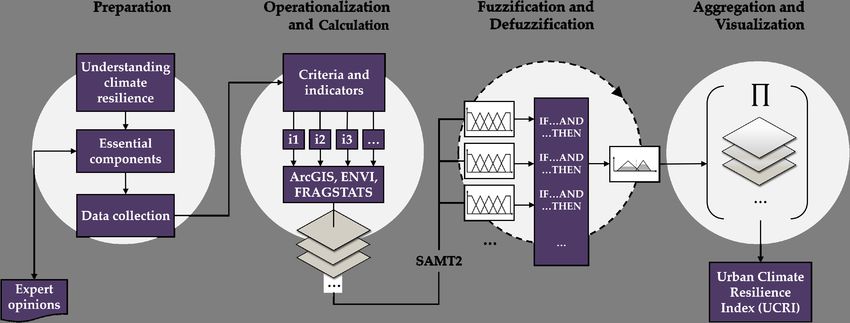
Sustainability 2020, 12, 635                                                                                                        8 of 30

                                                            Table 2. Data used.

         Format                     Description                    Resolution/Scale                        Source                 Year
                             Landsat 8 Satellite Image                30 × 30 m               United States Geological Survey
                                                                                                                                  2018
                                  (path 197/row 24)              (Cloud Cover: 5.22%)                     (USGS)
                                Digital Orthophotos                                                   Geobasis NRW
                                                                      0.01 × 0.01 m                                               2018
                                       (n = 332)                                                       (dl-de/by-2-0)
         Raster            Heavy rain hazard mapping                                            Municipal Drainage Office
                                                                         1×1m                                                     2019
                              (return period 1%/year)                                                    Dortmund
                          Noise mapping from different                                             Environmental Office
                           sources (trains, trams, roads,               10 × 10 m              Dortmund; Federal Office for       2018
                                      industry)                                                       Railways Bonn
                           Digital terrain model (DTM)
                                                                                                      Geobasis NRW
                             and digital surface model        Point data with 0.5 m spacing                                       2018
                                                                                                      (dl-de/by-2-0)
                                        (DSM)
                          Land Use, Digital Landscape
                                Model of the Federal                                                  Geobasis NRW
                                                                         1:10.000                                                 2019
                             topographic information                                                  (dl-de/by-2-0)
                            system (ATKIS Basis-DLM)
                          Building parcels with land use
                            information, Authoritative                                                GeobasisNRW
                                                                      Parcel Level                                                2019
                                 real estate cadastre                                                 (dl-de/by-2-0)
                           information system (ALKIS)
         Vector               Points of Interest (POI)                Parcel Level               City of Dortmund Website         2019
                                                                                                OpenStreetMap (Geofabrik
                                    Road Network                      Parcel Level                         GmbH,                  2019
                                                                                              www.download.geofabrik.de)
                                                                                                Institute of Fire Service and
                          Fire brigade operations due to
                                                                 Long/Lat Coordinates             Rescue Technology (IFR)        2008–2018
                             extreme weather events
                                                                                                         Dortmund
                                                                                              NRW Office for the Protection of
                               Volume of cold-air flow in
                                                                      100 × 100 m              Nature, the Environment and        2019
                                         m3 /s
                                                                                                   Consumers (LANUV)
                           Proportion of infants (0–11
                                       years)
                            Proportion of elderly +65
  Socio-demo-graphic                   years
                                                                 Statistical sub-districts      Statistics Office Dortmund        2017
  and -Economic data      Proportion of SGBII and SGB
                                                                         (n = 170)
                                   XII recipients
                               Proportion of single
                                    households
                          Official preparatory Land Use
                                                                         1:20.000                                                 2004
    Digital Land Use                    Plan
          Plans                                                                                                                   2014,
                                Land Use plans Ev148,
                                                                      Parcel Level              City of Dortmund Website          2012,
                                   InN222, Hu144
                                                                                                                                  1985
                          Climate mitigation measures                     1:500                                                   Unk.
                                                                                                                                   On
                                                                                                      Freely available
                                                                                                                                 demand

     Descriptive statistics on unemployment benefit recipients according to the second and twelfth
book of the Code of Social Law (SGBII and SGBXII) as well as demographic structure were also involved
to this study. They represent potential vulnerable groups which are likely to be particularly exposed
to extreme weather events and its consequences, including injuries, heat stress or premature death.
Additional information of land use plans and measurements have been manually digitalized in order
to capture areas where climate resilience related projects are located in Dortmund.
     During the pre-processing of the single Landsat satellite image, Dark Object Subtraction (DOS)
algorithm was used to remove atmospheric scattering effects like dust and haze [77]. The transformation
to reflectance values is an automated process in ENVI 5.4 by using the sourced Landsat metadata.
Cloudless and georectified DOPs, recorded on 29 June 2018, are distributed in a 1 × 1 km square-grid,
which had to be mosaicked for the entire study area in order to enable further remote sensing analysis.
     Finally, all geodata was projected into the Universal Transverse Mercator coordinate system (UTM)
zone 32 north and clipped to the study area, except the two network datasets, which additionally
extended 5 km around the city border in order to integrate connections from adjacent municipalities.
We chose a consistent 10 × 10 m raster analysis unit, as it provides a high level of detail and compromises
between computing time and feasibility. Each cell is finally representing an area which will be tested
amongst criteria and indicators for a climate resilient city.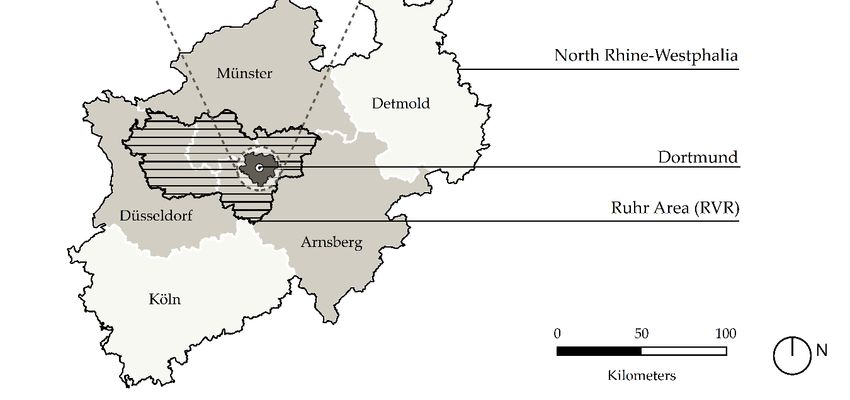
Sustainability 2020, 12, 635                                                                         9 of 30

4.2. Indicator Selection and Calculation
     In order to coordinate and specify which external stressors and social sensitivities are prioritized
for Dortmund, preliminary expert interviews with two staff members of Dortmund’s urban planning
and environmental office were assessed. Based on the findings of Meerow et al., the following three
questions have been asked [12,35]:

1.     Whose resilience is prioritized?
2.     What climate related extreme events should Dortmund be resilient to?
3.     Is the resilience of some areas prioritized over others?

      To summarize the experts’ answers, major sensitive groups are inhabitants with lower income,
as they are living in more densely populated neighborhoods and self-protection as well as personal
provision are limited in monetary terms. Heavy rainfall events, air pollution of industrial sites
and urban heat island effects are important stressors for Dortmund, while green and open spaces
are important as resilience strengthening areas. These findings were taken into account for further
indicator selection.
      The indicator selection depended on the possibility to be calculated in GIS with the gathered
data and therefore matching the fine scale up to neighborhood level. Furthermore, a clear relevance
to climate resilience based on the essentials presented in Section 2 had to be ensured. For a better
understanding about the framework, criteria and indicators can be structured to an overarching
objective in a hierarchical fashion, also referred to as “granulation” in fuzzy logic analyses [78]. In our
case, climate resilience of a certain areal (here: 10 × 10 m pixel) within the city corresponds to a
normatively overall objective. The maximum number of three raster-grids is allowed as input in
SAMT2, so that not more than three factors can be considered on each hierarchical step. Due to the
chosen analysis scale and corresponding data restrictions, many indicators which previously were set
up for cities do not fit to our purpose, e.g., percent population with a vehicle or percent population
with health insurance coverage [20]. On the other hand, the creation and calculation of new indicators
on a much finer scale may allow to unmask interdependencies between empirical data that is recorded
on broader scales.
      As climate resilience is widely seen as a holistic approach, the urban system as a whole firstly
had to be operationalized into its major subsystems. Following the general classification of Feldmeyer
et al. [40] and Cutter et al. [37], initially five dimensions of an urban system (Environment, Society,
Infrastructure, Economy, and Institution) were set up as starting point for operationalization (Table 3).
An important precondition was to include social-ecological factors into the indicator set, as the
public wellbeing and health of the society plays a major role in terms of the robustness of the
system. As a consequence, these factors are particularly present in the Environment (resources and
burdens) and Society dimensions. As pointed out in Section 2, the dimensions Environment, Society,
and Infrastructure refer to the robustness of the system, while Economy and Institution correspond to
its adaptiveness. Of course, this assignment is arguable, but if a city has no prospering economy and
political willingness for adaptation measurements—including the repairs of local damages by weather
extremes—the adaptiveness may be less pronounced. To describe climate resilience phenomena for all
five dimensions, 18 indicators belonging to 12 criteria were determined which will be explained in the
following sections.
Sustainability 2020, 12, 635 10 of 30
Table 3. Final indicator set for measuring climate resilience in Dortmund.
Dimension Criterion Indicator (GIS-Acronym) Source
Robustness
Degree of unsealed ground (DUG) [40]
Retention sites
Slope (SL) [79]
Environment Accessibility of public open and green spaces
[42,67,80]
Resources (AccG)
Ventilation status (VS) [40,81]
Heat stress (PET) [82]
Burdens
Noise pollution (NP) [67]
Hazard to housing Potentially flooded housing parcels (HFld) [59]
History of extreme Number of fire brigade operations due to
Society [40]
events extreme weather events (2008–2018) (NFO)
Number of 0–11 years olds (INF) [68,83]
Demographic structure Number of +65 years olds (ELD) [67,83]
Number of single-households (SHH) [83,84]
Potentially flooded technical and social
Hazard to Critical [59,83]
infrastructures (TSFld)
Infrastructures
Infrastructure Potentially flooded transport and traffic
[59,83]
infrastructures (TTFld)
Civil Protection Accessibility by fire brigade (AccF) [85]
Health access Drive time to hospitals (AccH) [86]
Adaptiveness
Diversity of business Shannon Diversity Index (SHDI) [40]
Economy
Unemployment Number of SGBII and SGBXII recipients (SGB) [20]
Implementation status of climate resilience
Institution Strategies and plans related measurements, research projects and [37,40,87]
land use plans (IN)
4.2.1. Environment
Unsealed surfaces play a major role as natural infiltration site in case of heavy rainfalls.
The Normalized Difference Vegetation Index (NDVI) is a multidisciplinary remote sensing index for
i.e., determining and analyzing healthy green vegetation, vegetation recovery after a fire occurrence,
or urban flooding [88]. As one of the most popular indices in remote sensing, it is simply and quickly
to assess with almost every multispectral imagery in GIS, as long as a nearinfrared (NIR) and red (R)
band is included:
NIR − R
NDVI = (1)
NIR + R
The DOP-mosaic with NIR band was used to calculate the NDVI, whereby the resulting values
ranged between −1 (water), 0 (bare soil) and +1 (trees, healthy vegetation). After visual inspection,
a threshold of 0 was set for unsealed surface extraction, including agricultural uses and bare soils.
As water is also representing an unsealed surface, an extraction threshold was set on −0.95. The degree
of unsealed ground was derived by utilizing moving window technique in FRAGSTATS with a window
size of 100 m, because at this stage first variations in land use were visually pointed out in the study
area. As slopes are increasing, surface water run-off tends to cause erosion on land cover, so it was also
important to respect terrain characteristics for heavy rainfall events. Therefore, the generation of slopes
as degree levels in GIS with the high resolution DTM finally quantified the second complementary
indicator for retention sites. A detailed analysis of the local sewer system may be an important factorSustainability 2020, 12, 635 11 of 30
too, but would go beyond the scope of this paper. The classification corresponds to (0◦ –2◦ , flat), (3◦ –6◦ ,
slowly), (7◦ –15◦ , oblique), (16◦ –25◦ , steep), and (>25◦ , very steep) conditions.
The influence on public health of urban green spaces has become an increasingly important topic
for many municipalities, as urban green spaces tend to have direct and indirect positive contributions
to the psychological, mental and social wellbeing. Furthermore, they also have a compensatory
function with regard to noise pollution or climatic extremes, offer opportunities for social contacts and
an incentive for physical activities. Open and green spaces like forests, urban parks and cemeteries
with a size of ≥1 ha were extracted from the ATKIS dataset, respecting the accessibility to the general
public which led to the exclusion of land containing private allotments. For a proper network analysis,
entrances as point data have been assessed by intersecting the perimeters of open and green spaces
with the footway line network created out of the OSM dataset [89]. With the performance of an
Origin/Destination (OD) Cost-Matrix in Network Analyst, minimum distances from every point
(Origins) in Dortmund to the closest entrances (Destinations) were modelled. Meters were chosen
as impedance, because walking speed strongly depends on individual conditions. The thresholds
are (0–250 m, very close), (250–500 m, close), (500–750 m, moderate), (750–1000 m, far), (>1000 m,
very far) [80]. In addition, to create a transitional raster grid for air status in the city, the point
data of cold-air flow in m3 /s was interpolated using Inverse Distance Weighting (IDW) method and
classified according to the LANUV categorization (>300–1500 m3 /s, moderate), (>1500–2700 m3 /s,
high), (>2700 m3 /s, very high).
By confronting the status quo with reference cases that already took place in the real world,
a more realistic picture of climate resilience can be drawn. Correspondingly, in order to detect regions
with heat stress potential, land surface temperatures (LST) have been derived with band 10 (Thermal
Infrared) of the Landsat 8 satellite image on a hot summer day in 2018. After image calibration for
band 10, at-satellite brightness temperature (TB ) in ◦ C was calculated:
K2
TB = K − 273.15 (2)
ln L 1 + 1
λ
K1 (774.8853) and K2 (1321.0789) are channel-specific coefficients which can be retrieved from the
supplied metadata, while Lλ is at-sensor spectral radiance of band 10. TB illustrates a theoretical value
which has to be further adjusted by spectral emissivity (ε) [90]. The value of ε can be derived from
existing literature:
ε = εv ∗ Pv + εs ∗ (1 − Pv ) (3)
whereby εv is the in situ emissivity of vegetation, εs is the emissivity of bare soils and Pv is the ratio of
vegetation and bare soils [91]. The value for εv corresponds to 0.973 and for εs 0.966 when using Band
10 of a Landsat 8 scene [92]. Pv can be calculated with the NDVI, which is to be retrieved from Landsat
8 NIR and R bands: !2
NDVI − NDVIMIN
Pv = (4)
NDVIMAX − NDVIMIN
NDVIMIN represents the threshold for bare soil and NDVIMAX the threshold where green vegetation
occurs. A value of 0.2 was set for NDVIMIN and 0.5 for NDVIMAX [93]. After retrieving ε and Pv , the
calculation of LST, represented by Ts , according to Boltzmann’s law was retrieved as follows:
1
Ts = ∗ TB (5)
ε1/4
Krüger et al. conceived a linear correlation (r = 0.735) between LST of Landsat imagery and the
measured physiological equivalent temperature (PET) in the German City of Dresden [82]. As a result,
the formula for transforming LST into estimated PET values is as follows:
PET = 17.077 + 0.465 ∗ LST (6)Sustainability 2020, 12, 635 12 of 30
We applied this formula to our calculated LST values, totally aware of the fact that Dortmund may
be confronted with other environmental conditions as Dresden, but both cities are located in Germany,
share a similar size in population as well as administrative area and lie on almost the same latitude.
The final PET-thresholds were set as (18–23 ◦ C, no thermal stress), (23–29 ◦ C, slight heat stress), (29–35
◦ C, moderate heat stress), (35–41 ◦ C, strong heat stress) and (>41 ◦ C, extreme heat stress). The same
thresholds have been used in a previous study [94]. As another environmental stressor, noise pollution
was considered in our analysis, because high noise level exposures have adversely effects on the public
wellbeing [95]. For the noise pollution indicator, the three input raster datasets on different noise
pollutants have undergone a logarithmic aggregation in GIS, resulting in a 10 × 10 m raster image on a
day-evening-night level (LDEN ) in decibels (dB). High noise levels are defined as noise levels above 55
dB on LDEN , so the final classification was set as (10–25 dB, very quiet), (25–40 dB, quiet), (40–55 dB,
moderate), (55–70 dB, loud), (>70 dB, very loud) [96].
4.2.2. Society
As heavy rainfall events are a crucial issue for the City of Dortmund, flood hazard rating (HR)
was carried out with the heavy rainfall raster images in GIS, using the following formula of DEFRA,
which was also applied for a flood risk assessment in Spain [97]:
HR = h (v + 0.5) + d f (7)
Whereby h represents flood depth in m, v velocity in m/s and d f the debris factor, ranging between
0 and 1 depending on flood depths, velocities and dominant land uses. There is a low hazard if
HR < 0.75, danger for some if 0.75 < HR < 1.5, danger for most if 1.5 < HR < 2.5 and danger for all if
HR > 2.5 [98].
We chose infants and small children (0 to 11 years), the elderly (+65 years) and single households
as sensitive population groups who are particularly prone to extreme weather events, because they
tend to have less physical or personal abilities to flee from water or to cope with heat stress, while also
being unable to reach safety for themselves [83]. Assuming an average storey height of 3.35 m
in Dortmund [99], with the use of the building footprints of the ALKIS dataset and the nDSM,
average heights of each building with residential or mixed land use could be automatically extracted
and rescaled to story numbers. Concerning the resulted story numbers and the demographic data on
sub-district level, we applied a dasymetric mapping method to disaggregate population subgroups
onto a pixel size of 10 × 10 m:
(Rn An ) ∗ N
P= (8)
E
where P is the number of people within a pixel, Rn is the relative density of the mapping unit population
with land-cover type A. An is the area of mapping unit. N is the actual population of each statistical
sub-district. E is the expected population of enumeration unit calculated using relative densities.
E equals the sum of the products of relative density and the proportion of each land-cover type in
each enumeration unit [100,101]. Drawing on a previous study on Dortmund which contained expert
knowledge about relative density values for four land cover classes, we assigned the same weightings
for apportioning the sub-district related data [67]:
1. residential use, up to two storeys: 15%,
2. residential use, three to five storeys: 30%,
3. residential use, more than five storeys: 40%, and
4. residential mixed use: 15%.
Consequently, all uninhabited areas (agriculture, forests, water etc.) were reclassified to a value
of 0. After the disaggregating process for each subgroup, the synthetic population estimations were
standardized to equal intervalled z-scores as standard deviations from mean to point out hotspotSustainability 2020, 12, 635 13 of 30
locations. Besides the spatial population sensitivity identification, it was also important to map chains
of effects, where climate related extreme events occurred in the past and led to physical damages
or helplessness for local residents. In order to calculate the density of fire brigade events of the last
decade, we initially used the incremental Moran’s I tool in ArcGIS to evaluate an appropriate search
radius for density mapping. This procedure allows to inform the user whether the spatial pattern of a
set of points is grouped or random by gradually increasing the search radius. If the results show a
statistical significance at a certain search distance, a positive Moran’s I index value indicates a tendency
to clustering. Setting a search distance of 2400 m as clustering threshold, the final kernel raster grid was
created. Five equal intervals concerning standard deviation from mean were created for classification.
4.2.3. Infrastructure
Critical infrastructures are organizations or institutions of special importance to society (i.e.,
transportation, energy and water supply, emergency services etc.). In the event of a failure or functional
impairments, it would lead to significant disturbances of social life and public safety as well as to
negative cascade effects [102]. Following the categorization of the German Federal Ministry of the
Interior (BMI), technical and social infrastructure as well as traffic and road infrastructure (Table A2)
have been extracted by the corresponding codes from the ALKIS dataset and masked out of the
HR-raster image. This procedure allowed us to identify hazard related infrastructures.
Enhancing the spatial and time-based accessibility of fire services is important to improve
emergency response, minimize property loss as well as to reduce injuries and deaths [85]. Fire brigades
(including volunteers) were extracted from the POI dataset. Drive time in minutes outgoing from
fire brigade locations to every point in Dortmund was calculated with an OD Cost Matrix for vehicle
driving network dataset. In the event of an emergency call, fire brigades have free access on roads, so
that no barriers or restrictions (e.g., traffic lights or one way roads) in the network dataset were taken
into account. The fire brigade should arrive at the place of hazard within 8 min after emergency call in
order to be able to carry out human rescues still in time [103]. Therefore, the final classification of drive
time was set as (≤4 min, very quick), (>4–8 min, quick), (8–12 min, moderate), (12–16 min rather late),
(>16 min, late).
By using the same network dataset, hospital locations in Dortmund were extracted by the POI
dataset, followed by the calculation of drive time in minutes from every location in Dortmund with the
max speed and the length of each line segment as variables. We classified the results into five equal
intervals, ranging from (0–3 min, very fast), (3–6 min, fast), (6–9 min, moderate), (9–12 min, far), and
(>12 min, very far).
4.2.4. Economy
The economic attractiveness of a city is a crucial factor for new companies. Cities with a high
diversity of businesses across multiple sectors tend to ensure a more pronounced adaptability and
faster recovery from external shocks, since there are more opportunities to provide social services and
cultural programs. Furthermore, diversity enhances flexibility for different working fields and helps to
diminish segregation processes (functional and social), which also corresponds to the equity component
in resilience debates [104]. To assess business diversity, Shannon Diversity Index (SHDI) with 1 km
square-width (A search radius of 1 km indicated clustering effects of the dataset after incremental
Moran’s I calculation.) moving window technique was calculated for each pixel in FRAGSTATS by
using ALKIS building footprints excluding residential areas and uninhabited objects like transformer
stations or garages as potential workplaces:
m
X
SHDI = − (Pi ∗ ln Pi ) (9)
i=1Sustainability 2020, 12, 635 14 of 30
Pi is the proportion of the landscape occupied by patch class i. SHDI assumes values above 0,
without upper limit, while SHDI = 0 (no diversity) when the regarded sample only contains one land
use [70]. If the amount of different patch types (richness) increases and/or the proportional distribution
of area among patch types becomes more even (evenness), SHDI increases simultaneously. Because
there is no reference value to compare with, we standardized the SHDI values to standard deviations
from mean and created five equal intervals for classification.
As pointed out in the expert interviews, unemployed people tend to have less monetary resources to
adapt to climate risks. Therefore, the number SGBII and SGBXII recipients as indicator of unemployment
was undergone the same dasymetric mapping procedure and z-standardization as the three indicators
for sociodemographic structure in the society dimension.
4.2.5. Institution
In order to create a better understanding about climate mitigation and resilience strengthening
strategies, it is important to establish an overview about where and what measurements have been
decided so far. The institutional aspect is only represented by one indicator, since it is difficult to
capture qualitative adaptation targets in a quantitative manner. However, it is possible to map and rank
decisions and measurements on climate resilience and adaptation to visualize their current allocation
in an administrative area [105]. Considering theoretical questionnaires on a previous resilience study
in Germany [50], official land use plans, research projects and climate adaptation measurements
were assessed for the entire city and classified ordinal from 1 (worst) to 5 (best) with regard to their
implementation status as follows:
1. No climate adaptation measurements are planned
2. Climate adaptation measurements will be planned
3. Climate adaptation measurements are planned, but not started yet to implement
4. Climate adaptation measurements are currently being tested or implemented
5. Climate adaptation measurements have been implemented (e.g., official land use plan is in force
or plan approval procedure is finished)
4.3. Fuzzy Logic Analysis
Although many researches have been undergone in the last decade, climate resilience still contains
a lot of vagueness and complexity in its definition. Between the derived thresholds presented in
Section 4.2, there are smooth transitions which calls for adequate spatial modelling techniques that
respect uncertainties in a multi criteria decision making process [49]. In this work, SAMT2 was
used for fuzzy modelling, which is completely programmed in python, so it is applicable on most
computer systems.
4.3.1. Fuzzification
Fuzzy logic results are ranging between 0 and 1 as intermediate values between concrete
evaluations [106]. In order to convert raw crisp indicator values into fuzzy sets, it is to be determined, to
which degree each indicator value belongs to a certain property (degree of membership) using linguistic
variables, e.g., in case of PET values, “slight heat stress”, “moderate heat stress”, and “strong heat
stress”. Trapezoidal and triangular membership functions are the most commonly used linear types in
the fuzzification process and easy to apply in SAMT2. The peak points of triangular or trapezoidal
functions are representing a definite membership (thresholds) and vice versa. An overlap between the
membership functions is desirable in order to allow smooth transitions between the ranges of indicator
values. If information about indicator thresholds are limited, e.g., triangular membership function
should be used [107]. A graphical illustration of the used membership functions and thresholds for
each indicator grid can be obtained in Figure A1.Sustainability 2020, 12, 635 15 of 30
4.3.2. Indicator Combination and Inference Method
For each crisp value of a variable, the degree of membership of the associated fuzzy set is checked
with IF-THEN-rules. In the THEN-part of the rule, an assignment is made to the output variable as a
fuzzy set. The default rule for conclusion finding (fuzzy singleton) in SAMT2 is based on IF X AND Y
THEN Z. The AND operator is widely used as premise in a fuzzy rule-based evaluation. Five linguistic
terms correspond to 125 (53 ) inference rules to set up for with three indicator grids, which explains
why not more than three indicators should be concerned per criterion [108]. After defining rules with
membership functions and linguistic variables, singletons were created, where truth membership
values are transformed into fuzzy sets with values ranging between 0 and 1. For instance, one rule in
SAMT2 was defined as follows:
IF (raster value of indicator PET is {no thermal stress ∨ slight heat stress ∨ moderate heat stress ∨
strong heat stress ∨ extreme heat stress} regarding climate resilience) AND
IF (raster value of indicator NP is {very quiet ∨ quiet ∨ moderate ∨ loud ∨ very loud} regarding
climate resilience) THEN
(raster value of environmental burdens is {more robust ∨ rather more robust ∨ moderate robust ∨
rather less robust ∨ less robust}.
All fuzzy sets were transformed using MAX-PROD inference method. We chose an equally
weighting for all indicators, because methods for determining weights like the Analytic Hierarchy
Process (AHP) by Thomas L. Saaty are always somewhat subjective and do not necessarily reflect
real priorities [109]. Furthermore, the use of 18 indicators makes it difficult and time-consuming for
experts to significantly allocate different weights, as the more indicators are concerned, no well-defined
priorities can be figured out. Finally, relative importance on indicators vary between sectors and over
time as local foci are permanently changing [110].
4.3.3. Defuzzification
The last step in fuzzy logic analysis is to transform the cumulated fuzzy inference results back into
a crisp set in order to perform further analyses in GIS. In other words, a single-valued output had to be
calculated as the best representative within the aggregated fuzzy sets. In SAMT2, the center of gravity
(COG) technique is automatically modelled, which can be stated as the weighted sum of the results:
x µ(x)x
P
∗
x = P (10)
x µ(x)
whereby x∗ indicates the defuzzified crisp value ranging between 0 and 1, and µ(x) the output
membership function of the output variable x (fuzzy singleton).
4.4. Compromise Programming and Sensitivity Analysis
The use of fuzzy membership functions inhibits a high sensitivity on the resulting maps. Therefore,
the reliability and usability of the method had to be examined by comparing fuzzy logic results with a
traditional crisp value-based MCDA method. Compromise Programming (CP), a multi-attributive
decision method proposed by M. Zeleny [111], is based on the assumption that the achievement of an
overall objective (e.g., climate resilience) lays in the nature of human and that the best compromise
solution is considered to be given when it is as close as possible to the ideal state. To put it in a
mathematical way, an alternative (here: pixel value) measured by several indicators is suitable as a
compromise solution, if:
1/p
Z∗j − Z j (x) p
Xn
p
Lp (W ) = Wj → min (11)
Z∗ − Z
j=0 j ∗j
whereby Wj (Wj > 0, W1 + W2 + . . . + Wn = 1) is the individual weight of each indicator (in this work all
weightings are equal). Therefore, Lp (W ) reflects the weighted distance of each alternative to the idealYou can also read