US CLIVAR ARCTIC CHANGE AND POSSIBLE INFLUENCE ON MID-LATITUDE CLIMATE AND WEATHER - A US CLIVAR White Paper - MIT
←
→
Page content transcription
If your browser does not render page correctly, please read the page content below
ARCTIC CHANGE AND POSSIBLE INFLUENCE ON
                                                               MID-LATITUDE CLIMATE AND WEATHER
US
i
   CLIVARt                                                                 A US CLIVAR White Paper
 ma                                                 li
Cl

                                                  y

      te V
             a r i a b ili t y & Pre d i c t   a bi
                                                                                        March 2018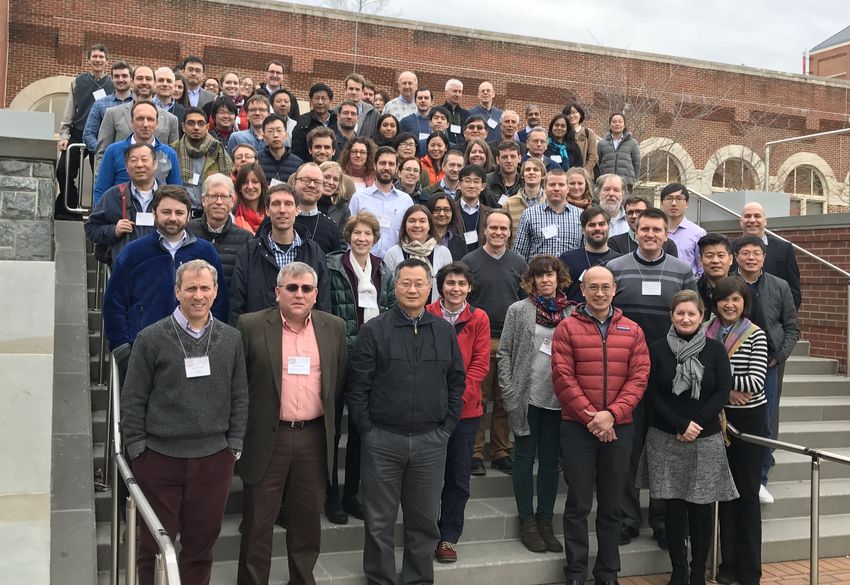
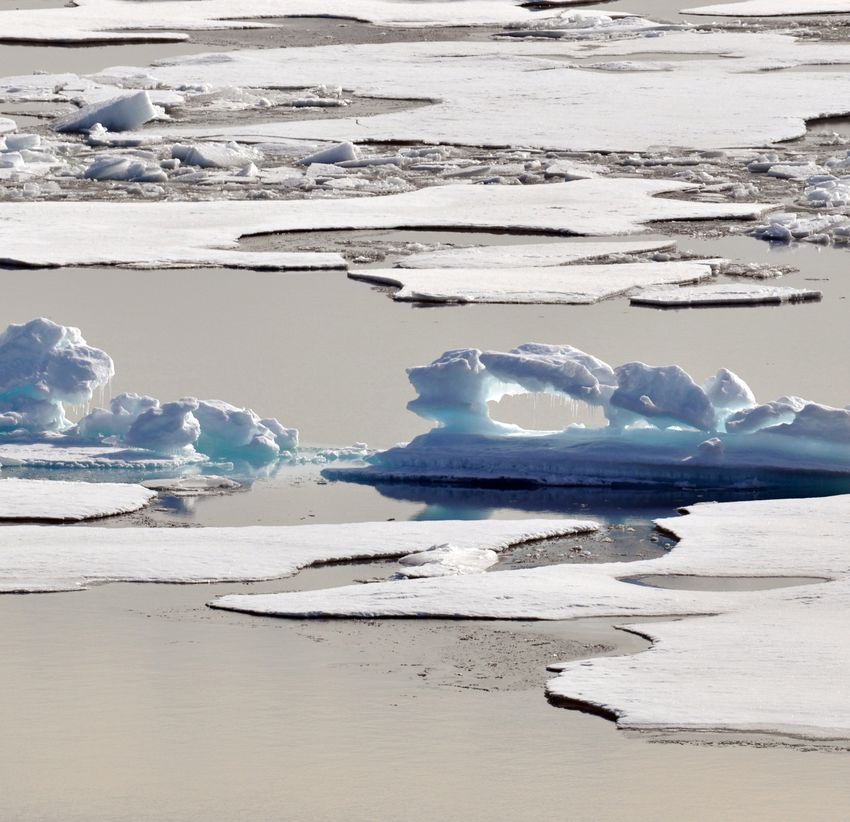
BIBLIOGRAPHIC CITATION
Cohen, J., X. Zhang, J. Francis, T. Jung, R. Kwok, J. Overland, P. C. Tayler, S. Lee, F. Laliberte, S. Feldstein, W. Maslowski, G.
Henderson, J. Stroeve, D. Coumou, D. Handorf, T. Semmler, T. Ballinger, M. Hell, M. Kretschmer, S.Vavrus, M. Wang, S. Wang,Y.
Wu, T.Vihma, U. Bhatt, M. Ionita, H. Linderholm, I. Rigor, C. Routson, D. Singh, M. Wendisch, D. Smith, J. Screen, J.Yoon,Y. Peings,
H. Chen, and R. Blackport, 2018: Arctic change and possible influence on mid-latitude climate and weather. US CLIVAR
Report 2018-1, 41pp, doi:10.5065/D6TH8KGW.

CONTRIBUTORS
Executive Summary
Workshop Scientific Organizing Committee: Judah Cohen and Xiangdong Zhang (co-chairs), Jennifer Francis, Thomas Jung,
Ronald Kwok, and James Overland
Section I:The character and mechanisms of Arctic Amplification
Co-Leads: Patrick C. Taylor, Sukyoung Lee; Contributors: Frederic Laliberte, Steven Feldstein, Wieslaw Maslowski, Gina
Henderson, Julienne Stroeve
Section II: Arctic and mid-latitude linkage physics
Co-leads: Jim Overland, Dim Coumou, Doerthe Handorf, Tido Semmler; Contributors: Thomas Ballinger, Momme Hell, Marlene
Kretschmer, Steve Vavrus, Muyin Wang, Simon Wang,Yutian Wu
Section III: Next steps – Recommendations
III.1 Observations and reanalyses
Lead: Timo Vihma; Contributors: Uma Bhatt, Monica Ionita, Ron Kwok, Hans Linderholm, Ignatius Rigor, Cody Routson, Deepti
Singh, Manfred Wendisch
III.2 Modeling recommendations
Co-Leads: Doug Smith, Thomas Jung; Contributors: James Screen, Jin-Ho Yoon,Yannick Peings, Hans Chen, Russell Blackport

EDITOR
Kristan Uhlenbrock, US CLIVAR Project Office

FRONT COVER IMAGE
Arctic sea ice. Credit: US Geological Survey.

BACK COVER IMAGES
2017 workshop participants in Washington, DC. Credit: Kristan Uhlenbrock.

Arctic Mid-Latitude Linkages White Paper
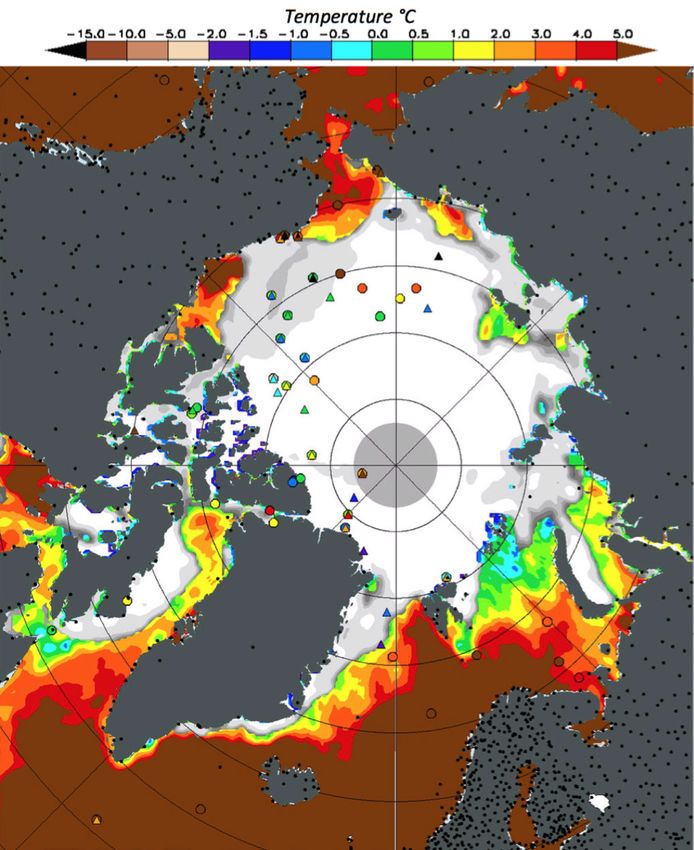
Table of Contents

EXEXUTIVE SUMMARY.................................................................................................1
1. THE CHARACTER AND MECHANISMS OF ARCTIC AMPLIFICATION........4
      Oberved Arctic Changes.................................................................................................................4
      Arctic amplification mechanisms..................................................................................................5
      Inter-model spread in AA..............................................................................................................8
      Improving our understanding of AA..............................................................................................9

2. ARCTIC AND MID-LATITUDE LINKAGE PHYSICS...........................................12
      Possible links between how AA manifests and mid-latitude weather..................................13
      Hemispheric-wide response of AA..............................................................................................15
      Regional analyses............................................................................................................................16
      Tropical influences.........................................................................................................................20
      Attribution of extreme weather events......................................................................................21
      Potential linkage pathways and confidence................................................................................21

3. NEXT STEPS AND RECOMMENDATIONS.............................................................23
      Observations and reanalyses recommendations......................................................................24
      Modeling recommendations........................................................................................................29

4. REFERENCES.............................................................................................................35

Arctic Mid-Latitude Linkages White Paper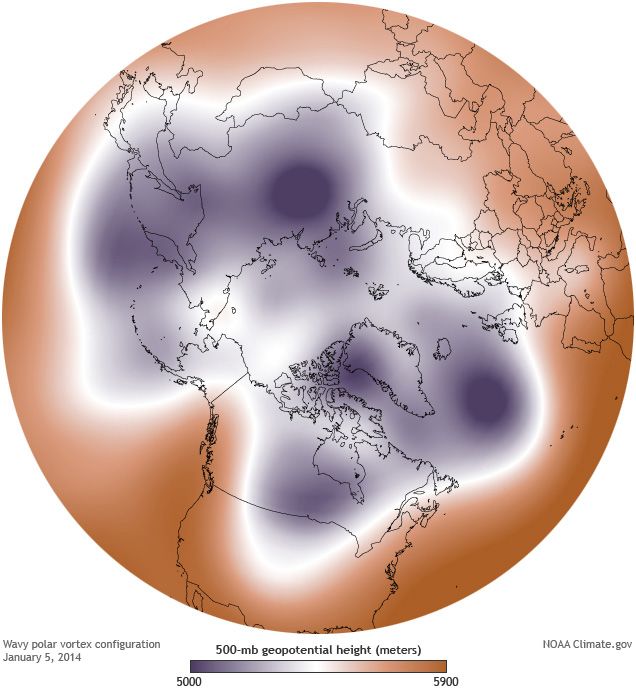
EXECUTIVE SUMMARY

T   he Arctic has warmed more than twice as fast as the global average since the mid 20th century,
    a phenomenon known as Arctic amplification (AA). These profound changes to the Arctic system
have coincided with a period of ostensibly more frequent events of extreme weather across the
Northern Hemisphere (NH) mid-latitudes, including extreme heat and rainfall events and recent
severe winters. Though winter temperatures have generally warmed since 1960 over mid-to-high
latitudes, the acceleration in the rate of warming at high-latitudes, relative to the rest of the NH,
started approximately in 1990. Trends since 1990 show cooling over the NH continents, especially
in Northern Eurasia.

The possible link between Arctic change and mid-latitude climate and weather has spurred a rush
of new observational and modeling studies. A number of workshops held during 2013-2014 have
helped frame the problem and have called for continuing and enhancing efforts for improving
our understanding of Arctic-mid-latitude linkages and its attribution to the occurrence of extreme
climate and weather events. Although these workshops have outlined some of the major challenges
and provided broad recommendations, further efforts are needed to synthesize the diversified
research results to identify where community consensus and gaps exist.

Building upon findings and recommendations of the previous workshops, the US CLIVAR Working
Group on Arctic Change and Possible Influence on Mid-latitude Climate and Weather convened an
international workshop at Georgetown University in Washington, DC, on February 1-3, 2017. Experts
in the fields of atmosphere, ocean, and cryosphere sciences assembled to assess the rapidly evolving
state of understanding, identify consensus on knowledge and gaps in research, and develop specific
actions to accelerate progress within the research community. With more than 100 participants,
the workshop was the largest and most comprehensive gathering of climate scientists to address
the topic to date. In this white paper, we synthesize and discuss outcomes from this workshop and
activities involving many of the working group members.

Workshop findings
Rapid Arctic change – Emergence of new forcing (external and internal) of atmospheric circulation
Rapid Arctic change is evident in the observations and is simulated and projected by global climate
models. AA has been attributed to sea ice and snow decline (regionally and seasonally varying).
However this cannot explain why AA is greatest in winter and weakest in summer. It was argued at
the workshop that other factors can also greatly contribute to AA including: increased downwelling
longwave radiation from greenhouse gases (including greater water vapor concentrations from local
and remote sources); increasing ocean heat content, due to local and remote processes; regional
and hemispheric atmospheric circulation changes; increased poleward heat transport in the
atmosphere and ocean; and cloud radiative forcing. In particular, there is emerging observational

Arctic Mid-Latitude Linkages White Paper                                                            1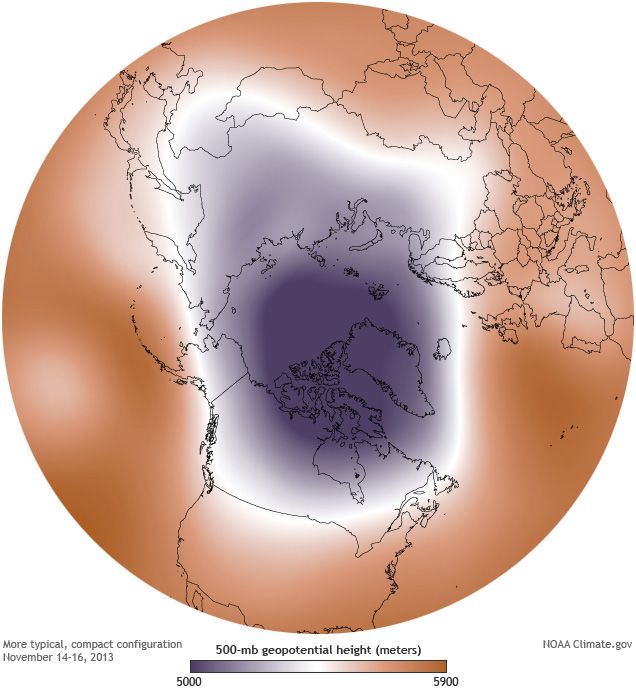
evidence that an enhanced poleward transport of sensible and latent heat plays a very important
role in the AA of the recent decades, and that this enhancement is mostly fueled by changes in the
atmospheric circulation. We concluded that our understanding of AA is incomplete, especially the
relative contributions from the different radiative, thermodynamic, and dynamic processes.

Arctic mid-latitude linkages – Focusing on seasonal and regional linkages and addressing sources
of inconsistency and uncertainty among studies
The topic of Arctic mid-latitude linkages is controversial and was vigorously debated at the workshop.
However, we concluded that rapid Arctic change is contributing to changes in mid-latitude climate
and weather, as well as the occurrence of extreme events. But how significant the contribution is
and what mechanisms are responsible are less well understood. Based on the synthesis efforts
of observational and modeling studies, we identified a list of proposed physical processes or
mechanisms that may play important roles in linking Arctic change to mid-latitude climate and
weather. The list, ordered from high to low confidence, includes: increasing geopotential thickness
over the polar cap; weakening of the thermal wind; modulating stratosphere-troposphere coupling;
exciting anomalous planetary waves or stationary Rossby wave trains in winter and modulating
transient synoptic waves in summer; altering storm tracks and behavior of blockings; and increasing
frequency of occurrence of summer wave resonance. The pathway considered most robust is the
propagation of planetary/Rossby waves excited by the diminished Barents-Kara sea ice, contributing
to a northwestward expansion and intensification of the Siberian high leading to cold Eurasian
winters.

Opportunities and recommendations
An important goal of the workshop was achieved: to hasten progress towards consensus
understanding and identification of knowledge gaps. Based on the workshop findings, we identify
specific opportunities to utilize observations and models, particularly a combination of them, to
enable and accelerate progress in determining the mechanisms of rapid Arctic change and its mid-
latitude linkages.

Observations
Due to the remoteness and harsh environmental conditions of the Arctic, in situ observational time
series are highly limited spatially and temporally in the region.

Six recommendations to expand approaches using observational datasets and analyses of Arctic
change and mid-latitude linkages include:

   1. Synthesize new Arctic observations;
   2. Create physically-based sea ice–ocean surface forcing datasets;
   3. Systematically employ proven and new metrics;
   4. Analyze paleoclimate data and new longer observational datasets;
   5. Utilize new observational analysis methods that extend beyond correlative relationships;
      and
   6. Consider both established and new theories of atmospheric and oceanic dynamics to
      interpret and guide observational and modeling studies.

Arctic Mid-Latitude Linkages White Paper                                                             2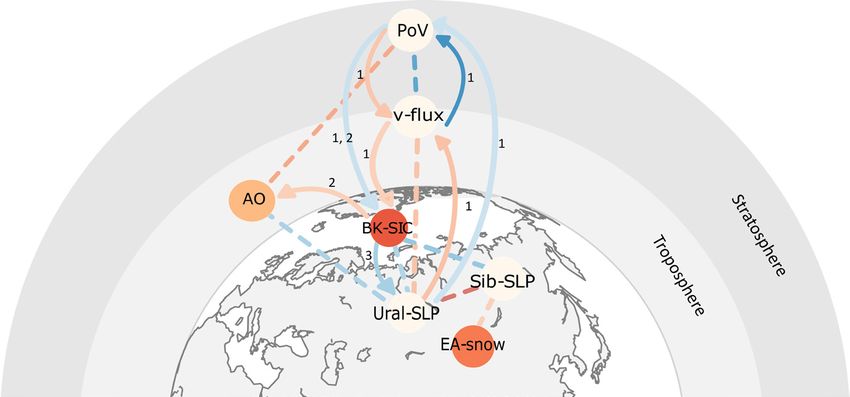
Model experiments
We acknowledge that models provide the primary tool for gaining a mechanistic understanding
of variability and change in the Arctic and at mid-latitudes. Coordinated modeling studies should
include approaches using a hierarchy of models from conceptual, simple component, or coupled
models to complex atmospheric climate models or fully coupled Earth system models. We further
recommend to force dynamical models with consistent boundary forcings.

Three recommendations to advance modeling and synthesis understanding of Arctic change and
midlatitude linkages include:

   1. Establish a Modeling Task Force to plan protocols, forcing, and output parameters for
      coordinated modeling experiments (Polar Amplification Model Intercomparison Project;
      PAMIP);
   2. Furnish experiment datasets to the community through open access (via Earth System
      Grid); and
   3. Promote analysis within the community of the coordinated modeling experiments to
      understand mechanisms for AA and to further understand pathways for Arctic-midlatitude
      linkages.

Arctic Mid-Latitude Linkages White Paper                                                        3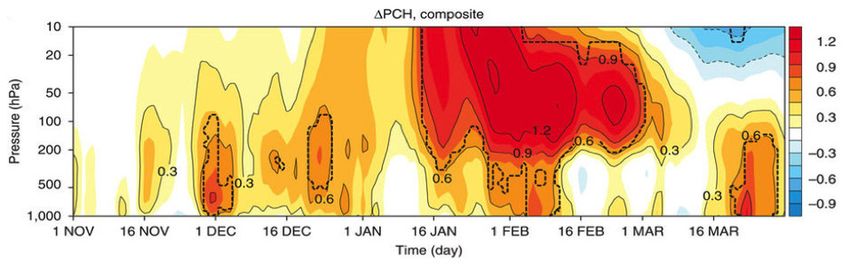
1       The character and mechanisms of Arctic
            Amplification

In light of recent scientific advances, the community should quantify the relative importance of
 processes that give rise to rapid Arctic warming and determine in what measure each process
modulates how Arctic warming influences mid-latitude weather and climate variability.

The Arctic has warmed more than twice as fast as the global average since the mid 20th century
(e.g., Blunden and Arndt 2012), a phenomenon referred to as Arctic Amplification (AA). In particular,
AA was further enhanced during 1998-2012, showing a warming rate more than six times the global
average (Huang et al. 2017). The high sensitivity of the Arctic climate change has been known for
some time (Manabe and Wetherald 1975). Beginning with this early paper and reiterated recently, the
high sensitivity of the Arctic climate to external forcing has been largely attributed to the reduction
in the Arctic surface albedo. Our understanding of the mechanisms contributing to the enhanced
Arctic warming, however, has significantly evolved in the last couple of decades, finding that other
mechanisms may be more important, thus altering the currently accepted chain of causality.

Observed Arctic changes
For brevity, we limit the discussion of recent Arctic climate changes to surface temperature and
sea ice, even though there are other notable changes (e.g., Greenland Ice Sheet and permafrost
degradation). Figure 1a shows Arctic averaged surface air temperature (SAT) trends between
1981–2014. Arctic warming is evident in these datasets, with strongest warming during fall and
weakest during summer. The vertical distribution of Arctic temperature trends, as reconstructed
by reanalyses, shows warming that extends throughout the troposphere but strongest near the
surface (Figure 1b-e).

Arctic climate change manifests visibly in the declining perennial sea ice cover (Kwok et al. 2009;
Lang et al. 2017), which has intensified over the last few decades, resulting in a record minimum sea
ice extent in September 2007 and a new record in 2012 (Figure 2; e.g., Comiso et al. 2008; Zhang et
al. 2008). Seasonally, sea ice decline is most prominent over the western Arctic Ocean in summer
and over the Nordic/Barents/Kara seas in winter (Figure 2). Additionally, the time between the spring
melt and the fall freeze-up increased by roughly 5-11 days per decade. This lengthening of the sea
ice-free season has been shown to influence the interactions between the Arctic atmosphere and
surface (Stroeve et al. 2014).

Despite robust observed signals of AA, our knowledge of the mechanisms contributing to AA and
their seasonal dependence remains incomplete. At the workshop, we agreed that the nature of AA,
including its magnitude and mechanisms, likely influences the temporal and spatial character of
Arctic and mid-latitude climate and weather linkages.

Arctic Mid-Latitude Linkages White Paper                                                              4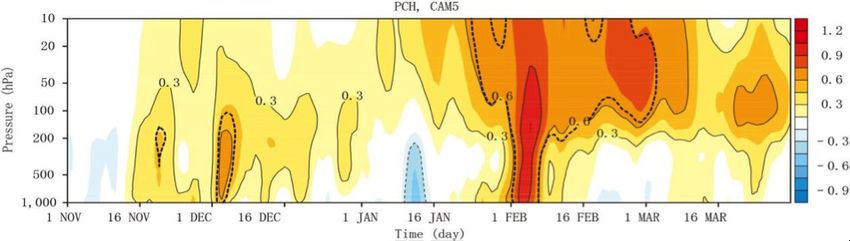
a                      Global+Arctic Temperature Trends
       Trend [K/decade]              1981-2014

   Figure 1. (a) Annual (ANN) and seasonal (DJF, MAM, JJA, SON) surface air temperature (SAT) trends from 1981 to 2014 in the
   Arctic (black squares, north of 60°N) and for the whole globe (gray squares) using the average of four observational products
   (CRU, NOAA, GISS, and BEST) masked in such a way that all four products share a uniform missing data mask over the ocean.
   The vertical lines show trends for the average of CRU and BEST without applying this uniform mask. This line therefore indicates,
   in large part, the uncertainty coming from the limited observational temperature record over the Arctic ocean. (b-e) Seasonal
   and zonal-mean air temperature trends from 1981-2015 for the average of the MERRA, MERRA-2, ERA-Interim, JRA-55, and CFSR
   reanalysis products. Stippling indicates trends significant with a p < 0.05 after the false discovery rate was applied (Wilks 2006).

Arctic amplification mechanisms
The mechanisms of AA can be divided into two groups: local forcing and remote forcing. The local
forcing group includes radiative forcing (from both greenhouse gases and cloudiness), sea ice-
albedo feedback, lapse rate feedback, and surface turbulent heat fluxes from the Arctic Ocean. The
conventional viewpoint places local forcing mechanisms as the trigger in the causal chain leading
to AA (Manabe and Wetherald 1975). Mechanisms in the remote forcing group represent newer
research, including forcing from the mid-latitudes and tropics, which are subsequently amplified by
various feedback processes.

It can often be challenging to distinguish between the local and remote forcing. For example, an
increase in Arctic clouds and atmospheric water vapor could result from a local forcing if cloud
properties change in response to reduced sea ice cover. Alternatively, remote forcing can alter
clouds through a change in moisture transport from lower latitudes. In either case, any increase
in Arctic heating will be magnified owing to a variety of positive feedbacks involving ice, snow, and
particular characteristics of the Arctic atmosphere.

Perhaps the best-known sensitivity in the Arctic is the sea ice albedo feedback (Perovich et al. 2008),
owing its existence to the stark difference in albedo between open water and snow-covered sea
ice surfaces (cf. ~7% with ~80% reflectance, respectively). The sea ice albedo feedback links the
disappearance of sea ice to Arctic lower tropospheric warming and the subsequent melting of sea ice,

Arctic Mid-Latitude Linkages White Paper                                                                                                  5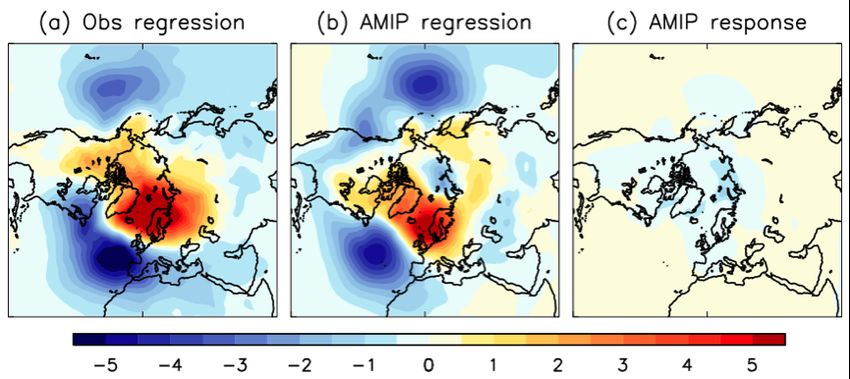
and it has become common practice to
                                                                             conflate the two on climatological time
                                                                             scales (Screen and Simmonds 2010).
                                                                             However, modeling studies indicate
                                                                             that AA can occur in the absence of
                                                                             the sea ice albedo feedback (Alexeev
                                                                             et al. 2005), even though changes in
                                                                             sea ice have certainly altered the Arctic
                                                                             surface energy budget (Pistone et al.
                                                                             2014). Recent research has forced us
                                                                             to question the role of sea ice albedo
                                                                             feedback in the causal chain driving AA.
                                                                             One outcome of the workshop was the
                                                                             need to disentangle the contributions of
                                                                             local and remote forcing on AA as a way
                                                                             to better guide scientific efforts on the
                                                                             issue of Arctic and mid-latitude linkages.

                                                                             Surface turbulent fluxes of sensible
                                                                             and latent heat represent an important
                                                                             medium of transferring local forcing
                                                                             due to increasingly exposed warm
                                                                             ocean water into a mechanism for
                                                                             AA. Declining sea ice cover and extent
Figure 2. Satellite-era Arctic sea ice trends from 1979-2016 are shown for
(top) September areal extent (courtesy Patrick Taylor, NASA) and (bottom)
                                                                             (Figure 2) have enabled enhanced air-
March and September regional ice concentration trends (units: % per          sea energy exchanges in recent years
decade; courtesy of Julienne Stroeve, NSIDC).
                                                                             (Figure 3; Boisvert et al. 2015; Taylor et
                                                                             al. 2018).

Regional and seasonal variations in surface turbulent flux trends (Figure 3, top panels) may be
important characteristics of AA and potential Arctic and mid-latitude linkages (Honda 2009; Peings
and Magnusdottir 2014; Feldstein and Lee 2014; Cohen et al. 2014; Kim et al. 2014). The largest
increases in surface turbulent heat fluxes from the ocean to the atmosphere are found in the Chukchi
and Kara seas. It is important to note that not all trends are positive. For instance, over the Bering
Sea, Barents Sea, and the waters surrounding Greenland, both sensible (not shown) and latent heat
flux trends are from the atmosphere into the ocean (negative in Figure 3 top left panel). However,
over most of the Arctic, sensible and latent heat flux trends are small. An additional mechanism is
that anomalous warmth in the lower atmosphere and surface are maintained longer into the early
winter season, which supports larger geopotential thickness values (Figure 1, right) that, in turn,
reduce poleward gradients and ultimately feed back into wind fields.

An equal, or possibly more important, sensitivity relates to the role of clouds in the surface energy
budget. Arctic clouds warm the surface via enhanced downwelling longwave radiation for much of
the year, except during June and July when the shortwave cloud radiative effect dominates, cooling
the surface (Kay and L’Ecuyer 2013). The shortwave cloud effect is further complicated by the
seasonal evolution of surface albedo. During summer, for instance, the surface albedo decreases

Arctic Mid-Latitude Linkages White Paper                                                                              6
MAM Trends             JJA Trends

                   SON Trends            DJF Trends

   Figure 3. Trends in selected components of the Arctic surface
   energy budget: (top left) Atmospheric Infrared Sounder
   (AIRS)-based observational surface latent heat flux trends
   constrained from 2002-2016 (W m-2 yr-1; adapted by Linette
   Boisvert, U. Maryland, from Boisvert and Stroeve 2015); (top
   right) ERA-I surface latent heat flux trends for 1979-2016 (W
   m-2 yr-1; courtesy of Tingting Gong, Qingdao National Lab. for
   Marine Science and Technology); and (bottom) ERA-I surface
   downwelling longwave radiation from 1979-2016 (courtesy
   Tingting Gong). Positive latent heat fluxes are defined
   as surface to atmosphere, whereas positive surface downwelling
   longwave trends are from atmosphere to surface.

owing to increased open ocean areas and melt pond fraction (Intrieri et al. 2002). The surface energy
budget in climate models is also very sensitive to clouds. For example, small errors in simulating
cloud amount and the cloud liquid/ice water optical path may be sufficient to perturb the surface
energy balance and greatly influence sea ice concentrations simulated by climate models. Results
presented at the workshop indicate that the Fifth Coupled Model Intercomparison Project (CMIP5)
climate models disagree about whether Arctic cloud changes dampen or amplify AA (Taylor et al.
2017). This lack of consensus among models could be due to a number of factors discussed later.

The importance of downward longwave radiation on AA and sea ice has been identified by a number
of studies (Uttal et al. 2002; Francis et al. 2005; Screen 2017). With respect to sea ice cover, emerging
evidence suggests that anomalous cloud cover and downward longwave radiation during winter
can hinder sea ice growth, thus impacting Arctic sea ice cover the following summer (Liu and Key
2014; Lee 2014; H.-S. Park et al. 2015b). As presented at the workshop, the CMIP5 climate models
indicate that changes in the downwelling clear-sky longwave flux from the atmosphere, rather than
the surface albedo feedback, are the largest contributing factor to simulated AA (Taylor et al. 2017),
depending on partitioning of downward longwave and shortwave radiation due to cloud effects.
The downward longwave radiation trend is positive almost everywhere over the Arctic Ocean for

Arctic Mid-Latitude Linkages White Paper                                                                7
all seasons (Figure 3, bottom panel). The spatial trend patterns are substantially different from the corresponding surface heat flux, which exhibits both positive and negative signs (Figure 3, top panels). This dissonance in their trend patterns is consistent with the importance of the remote driving of the downward longwave radiation trends. During the period when AA has occurred and Arctic sea ice decrease has accelerated, it has been found that poleward atmospheric heat and moisture transport has been enhanced (Zhang et al. 2008; 2013), which acts as a remote driving of formation of clouds and increase in downward longwave radiation. Based on in situ measurements over Eureka, Canada (80°N, 86°W), Doyle et al. (2011) also report that warm, moist air intrusion events and attendant cloud radiative forcing regularly occur in Arctic winter (Kapsch et al. 2016). It was found that extreme warm and moist air intrusion from the North Atlantic into the Arctic can cause extreme warming event (Kim et al. 2017). This extreme intrusion occurs associated with poleward propagation of intense storms, which could be a manifestation of a long-term poleward shift of storm tracks (e.g., Zhang, et al. 2004; Serreze and Barrett 2008; Sepp and Jaagus 2011). Other recent studies have also highlighted the importance of spring extreme moisture transport into the Arctic in controlling the minimum sea-ice extent in the following September (Kapsch et al. 2013, Yang and Magnusdottir 2017, Yang and Magnusdottir 2018). Moisture transport is most pronounced through the N. Atlantic pathway and is favored during the Atlantic blocking weather regime (Yang and Magnusdottir 2017). A comprehensive mechanistic understanding of AA requires knowledge of the source of increased Arctic heat and water vapor, as local sensible heat flux and evaporation versus remote transport have different implications to the causal chain of events leading to AA. The primary source of the Arctic atmospheric water is currently unclear. From the local process perspective, fluxes from the Arctic Ocean are obvious candidates. But with a global reanalysis dataset, it has been shown that over the past several decades horizontal moisture transport from lower latitudes has been a predominant source (Zhang et al. 2013), which could be a significant contributor to AA in the western Arctic during both winter (D.-S. Park et al. 2015a; Gong et al. 2017) and summer (Laliberté and Kushner 2014; Ding et al. 2017). Tropical convection may also play an important role in forcing AA via heat and moisture transports during the cold season when the strong subtropical jet provides fertile grounds for a convection- driven Rossby wave source. Tropical convection can excite moisture intrusion events and Arctic warming on inter-decadal timescales (Lee et al. 2011; Cvijanovic et al. 2017) and in association with ENSO (Lee 2012). Furthermore, intraseasonal tropical convection also appears to influence daily Arctic surface temperature and sea ice concentration via the Madden Julian Oscillation (MJO) phase 5 in both summer and winter (Yoo et al. 2012a,b; Henderson et al. 2014). These heat and moisture transports are enhanced by poleward propagating Rossby waves, excited by the tropical convection, that constructively interfere with the climatological stationary eddies (Lee 2014; Goss et al. 2016; Cvijanovic et al 2017). Energetically, the convectively generated Rossby waves can warm the Arctic by releasing the mostly untapped zonal available potential energy, a process very effective at driving AA (Lee 2014). Inter-model spread in AA Despite unanimous agreement for the existence of AA, current-generation models strongly disagree on the overall strength and individual process contributions to rapid Arctic warming (Figure 4). The Arctic Mid-Latitude Linkages White Paper 8
causes of this large inter-model spread in Arctic                                      4.0

warming relate to many possible limitations                                            3.5
                                                                                                      ACCESS1_0
                                                                                                      ACCESS1_3
                                                                                                                              MRI_CGCM3
                                                                                                                              GFDL_CM3

in our modeling capabilities. In particular,
                                                                                                      MIROC5                  MPI_ESM_MR
                                                                                                      BNU_ESM                 NorESM1_M

                                                       Normalized Temperature Change
                                                                                       3.0
uncertainties in model parameterizations
                                                                                                      bcc_csm1_1              GISS_E2_R
                                                                                                      CCSM4                   CESM1_CAM5
                                                                                       2.5            bcc_csm1_1_m

hinder our ability to predict/project future Arctic
                                                                                                                              IPSL_CM5A_MR
                                                                                                      CNRM_CM5
                                                                                                                              MPI_ESM_LR
                                                                                                      CSIRO_Mk3_6_0

sea ice extent and its potential interaction with                                      2.0                                    inmcm4

mid-latitudes. Cloud microphysics, convection,                                         1.5

boundary layer processes, and surface turbulent                                        1.0

flux parameterizations primarily developed to                                          0.5

ensure accurate forecasts in the tropics and the                                       0.0
                                                                                          −90   −75   −60      −45    −30   −15      0     15   30   45   60   75   90
mid-latitudes are inadequate at high-latitudes                                                                                    Latitude

(Bourassa et al. 2013). In fact, because tropical
convective heating also triggers Arctic warming
through Rossby wave propagation, inaccuracies
outside of the Arctic, such as tropical convective
parameterizations, could contribute to the
uncertainty in the large-scale circulation (Stevens
and Bony 2013; Sohn et al. 2016), hence Arctic
warming. Deficiencies have also been identified
in how models approximate the surface mass
and momentum budget, including: surface
albedo parameterizations (Dorn et al. 2009);
sea ice rheology (Girard et al. 2009); fluxes
across the atmosphere-ice-ocean boundary
layer (Dorn et al. 2009; Hunke 2010); cloud
radiative properties and simulation (Bromwich
et al. 2009), and numerical techniques (Losch et
al. 2010). This wide range of relevant processes
speaks to the need for coupled models to
realistically represent Arctic sea ice (Deser et al.
2015). Given these limitations, perhaps it is not                  Figure 4. CMIP5 models simulations of (a) zonal-mean
surprising that the current generation of models                   temperature changes normalized by the global mean change
                                                                   (2080-2100 minus 2005-2025) and (b-e) same as Figure 1b-e
disagree on the strength of the AA (Figure 4).
                                                                   but for the CMIP5 multi-model mean historical + RCP8.5 for
                                                                   1981-2015. Stippling indicates trends significant with a p <
Improving our understanding of AA                                  0.05 after the false discovery rate was applied (Wilks 2006).

Improving our understanding of AA requires
increased accuracy of climate models
and,    therefore,     improved     process-level
understanding. One major barrier to the development of the parameterizations specific to high-
latitudes is the sparsity of observations, especially during the polar night. The logistics of cold and
remote places demand that in situ data collection occur in short-lived and/or spatially concentrated
field campaigns (Perovich et al. 1999; Wullschleger et al. 2011). Processes on scales of 1-10 km
and 10 minutes to 6 hours are seldom resolved in the observational record, yet observational and
modeling evidence indicates the importance of fine-scale features, especially in understanding

Arctic Mid-Latitude Linkages White Paper                                                                                                                                 9
Arctic interactions with the larger scales (Overland et al. 1995; Weiss and Marsan 2004). Moisture intrusions into the Arctic are often realized through atmospheric rivers (Liu and Barnes 2015; Baggett et al. 2016), yet they are not well represented by the current conventional climate models (Shields and Kiehl 2016). To address model deficiencies, we need ongoing and future field campaigns in all seasons that resolve key Arctic processes, including cloud-aerosol interactions, surface energy fluxes, sea ice processes, and snow on sea ice. We expect that progress on the polar atmospheric physics will be made possible through the assimilation of observations obtained during the Year of Polar Prediction and through other targeted field campaigns (e.g., MOSAiC and airborne Arctic cloud-aerosol measurements). It has been well investigated that changes in the atmospheric circulation and resulting enhancement of poleward heat and moist air transport into the Arctic Ocean play an important role in causing Arctic warming and sea ice decrease (Rigor et al. 2002; Zhang et al. 2003). Recently studies further examined the observed structure of atmospheric warming. Although sea ice decline is found to be responsible for the recent Arctic warming (Screen and Simmonds 2010), it has recently been shown that remotely forced warming can also generate a bottom-heavy warming structure (Zhang et al. 2008; Yoo et al. 2013; Woods and Caballero 2016; Kim et al. 2017). Therefore, at least one symptom that had been perceived as key evidence of sea ice melting influencing AA could also be a consequence of warm, moist air intrusions. Whether the frequency and amplitude of moisture intrusions into the Arctic are changing remains an open question. Wood and Caballero (2016) find an increased frequency of moisture intrusions in the Barents and Kara seas, which would be attributed to changes in transient storm track dynamics (e.g. Zhang et al. 2004; Yin 2005; Villamil-Otero et al. 2018). Further research on this question is recommended. A more realistic simulation of time-dependent conditions of the Arctic sea ice cover and its effect on air-sea interactions is needed and requires coupled models. In addition, seasonal space-time variability in the extent of snow cover over Arctic land areas, land surface water, and energy budgets of seasonal permafrost melt are not well represented in most coupled land-atmosphere-sea ice models (Vaganov et al. 2000). Disentangling the relative importance of these and other sources of uncertainty in modeling Arctic sea ice and climate presents a major challenge. Part of the solution rests in improving the representation of processes within models through increased resolution and improved parameterizations. Another part lies in increasing the number of Arctic processes included in models. There is growing interest in the combined use of global Earth system models with regional models to better characterize uncertainty and improve probabilistic projections (Giorgi 2005). We argue that it is critical to advance hierarchical climate modeling (Maslowski et al. 2012) coordinated with the future Arctic observing system. Beyond model improvements, we recommend analyses of the chain of events leading to AA in the current generation of models. Such analyses would identify dynamical and process differences between models and observations, helping to pinpoint processes that require further observational constraint. Dynamical differences, associated with too much or too little Arctic warming, could also help the community understand the large inter-model spread. These dynamical analyses require the use of high-frequency data (daily or less; Laliberté and Kushner 2014; D.-S. Park et al. 2015; Gong et al. 2017) and/or a careful analysis of monthly changes (Krikken and Hazeleger 2015). Due to the large data volume associated with high-frequency data, the working group is aware that such an Arctic Mid-Latitude Linkages White Paper 10
approach would likely require a sustained focus on the development of shared diagnostic tools that
could easily be ported from models to reanalyses and vice versa. We support continued efforts to
archive model output at daily and subdaily scales — enabling process-level model evaluation — and
recommend a focused MIP) aimed at resolving the process contributions to AA in climate models.
It would be further be beneficial to the community to make the model data publicly available and
preferably allow users to create web-based plotting of the archived data.

Arctic Mid-Latitude Linkages White Paper                                                        11
2        Arctic and mid-latitude linkage physics

U   nderstanding Arctic and mid-latitude linkages is a societally important topic but difficult given its
     complexity. Arctic impacts on mid-latitudes are increasing, but they are mediated by chaotic jet
stream dynamics. As noted in Section I, Arctic temperatures have experienced dramatic increases
with new record highs in the winters of 2015–16 and 2016–17, with a potential to modify tropospheric
and stratospheric jet streams. Such impacts will play a role in future subseasonal-to-seasonal
(S2S) forecasts across the mid-latitudes. The issue is difficult as mid-latitude S2S conditions are
also affected by large internal variability and mid-latitude and equatorial sea surface temperature
anomalies. It appears that Arctic impacts will be regional and intermittent, clouding the identification
of cause-and-effect and raising the issue of how to effectively communicate potential Arctic impacts.

Figure 5 illustrates the pathways of potential linkages from global change, through AA, to large-
scale atmospheric wind patterns and finally to regional weather and extreme events. Tropospheric
and stratospheric jet stream responses largely characterized by internal variability, which injects
intermittency into linkage pathways, are particularly uncertain.

A well-predicted response of global climate change is the amplified Arctic warming, or AA, for the
reasons noted in Section I. There is a greater thermodynamic connection of the surface with the
overlying atmosphere due to extensive new sea ice-free areas in autumn and thinner sea ice in
early winter months. This first
link is through the thermal/
geostrophic wind relationship
that      relates       horizontal
temperature gradients to vertical
shear of the wind. A recent study
using a regional reanalysis with
the highest spatial resolution to
date has revealed the complex,
fine-scale relationships between
winds, sea ice, and sea surface
temperature,      indicating   an
increase in surface wind towards
the ice edge from both open
water and thick sea ice areas
(Zhang et al. 2018).

More complexity is introduced
at the next stage where
thermodynamic forcing and               Figure 5. Complexity of linkage pathways. (Figure from Cohen et al. 2014).
thermal wind modification in the

Arctic Mid-Latitude Linkages White Paper                                                                             12
Figure 6. Sample geopotential height fields for 500 hPa with lower values in purple and the jet stream in white.
(a) Contrasts a single, more zonal path encircling the tropospheric polar vortex versus a wavier configuration (b)
with multiple low centers. (Figure from NOAA Climate.gov).
Arctic interact with the internal variability of the tropospheric jet stream (white band in Figure 6) in the
sub-Arctic, given by the gradient in the geopotential height field (Shepherd 2016). The tropospheric
polar vortex structure is quasi-stable but can, chaotically to some degrees, shift between pattern
shapes (such as in Figure 6a,b).
The physics driving changes in geopotential heights are described by the geopotential tendency
equation (Holton 1979). Geopotential heights can change and, thus, modify wind fields by i)
horizontal propagation of existing jet stream features that can be considered primarily a random
part of atmospheric dynamics, ii) transport of low-level, warm air into a region, or iii) warming a
region locally. Part of the difficulty with linkage research is quantifying the influence of thermal
heating from Arctic sources relative to the other two contributions to geopotential height changes.
A final difficulty in the linkage chain (Figure 5) is the relationship of the large-scale atmospheric
circulation patterns (Figure 6), which can last for weeks or can quickly break down, affecting local
weather that can lead to extreme events. For example, the low geopotential height regions in Figure
6b can spawn local weather events regimes that travel eastward slowly, on timescales of days.
Possible links between how AA manifests and mid-latitude weather
A host of mechanisms and processes influence the surface and atmospheric temperatures in the
Arctic and potentially contribute to AA as discussed in Section I. In recent years, significant attention
has been given to the potential influence of AA on mid-latitude weather through its influence on the
background temperature gradient and possible effects on the polar jet stream and storm track. For
instance, enhanced surface turbulent fluxes from the surface to the atmosphere due to reduced
sea ice cover represents a possible mechanism linking AA to mid-latitude weather. However, a
probability distribution of Arctic sensible and latent heat fluxes reveals that at most times the fluxes
Arctic Mid-Latitude Linkages White Paper 13are near zero, punctuated by significant episodic heat exchange events where surface turbulent fluxes exceed 100 W m-2 (Taylor et al. 2018). Therefore, the spatial variability and episodic nature of surface turbulent fluxes must be considered. This has two very important implications for AA and its linkages to mid-latitude weather. The first, and the most important, is that the exchange of sensible and latent heat fluxes from the surface is not constant in time but state-dependent. As indicated in previous studies (e.g., Rigor et al. 2002; Zhang et al. 2003; Zhang et al. 2008), there are strong heat and moisture transport from lower latitudes into the Arctic associated with the positive phase of the Arctic Oscillation (AO) or negative phase of the Arctic rapid change pattern. Under these conditions, very little exchange of heat and moisture occurs between the surface and the atmosphere owing to the associated weak vertical gradients in temperature and moisture. The lateral influx of heat and moisture due to changes in the atmospheric circulation, however, restricts sea ice growth and in some cases melts sea ice during winter (e.g., Rigor et al. 2002; Zhang et al. 2003; Zhang et al. 2008; Park et al. 2015a). However, when there is a flow of colder, drier air from the continent or solid ice pack associated with a particular atmospheric circulation pattern, such as the negative AO, an intense flux of heat and moisture occurs from the surface to the atmosphere. These conditions favor a strong forcing of the atmosphere by an ocean with no or thin ice cover, representing a state-dependent forcing. The second implication is that there is also a strong spatial variability in this forcing such that it is most prevalent in the marginal sea ice areas, such as the Barents and Kara seas. We can also argue that hypothesized pathways linking the Arctic to mid-latitudes rely on a warming over the Arctic and not necessarily the disappearance of the sea ice. As described above, previous studies have indicated that changes in the atmospheric circulation, and their resultant poleward heat and moisture transport, play important driving role in Arctic warming and sea ice retreat (e.g., Rigor et al. 2002; Zhang et al. 2003; Zhang et al. 2008). Recent studies further suggest that a warming of the atmosphere over the Arctic through warm, moist air intrusions is an important contributor to sea ice loss (D.-S. Park et al. 2015; Woods and Caballero 2016), and these intrusions are caused by changes in the hemispheric atmospheric circulation in lower latitudes, rather than changes in the specific humidity (Lee et al. 2011; Zhang et al. 2013; Gong et al. 2017). Intruding mid-latitude warm, moist air leads to increased infrared radiation both upward and downward, the latter hindering sea ice growth (H.-S. Park et al. 2015a). This increase in downward infrared radiation arises from multiple factors, including the presence of warmer air due to both warm advection and latent heat release that results during cloud formation, as well as the increase in all three phases of water (Gong et al. 2017). This effect on sea ice is noticeable within several days of the intrusion (H.-S. Park et al. 2015a; Kapsch et al. 2016). Furthermore, studies such as D.-S. Park et al. (2015) and Gong et al. (2017) find that upward turbulent heat fluxes at the surface arise after the intrusions of warm, moist air. Therefore, even if this mechanism only partially accounts for the warming, it could have important implications for understanding linkages between the Arctic and mid-latitudes. For example, in climate model experiments that specify sea ice concentration and/or sea surface temperature anomalies, it is the upward turbulent heat fluxes from the surface that drive the Arctic and mid-latitude circulation (Deser et al. 2007). However, the aforementioned observational evidence suggests that the imposed negative sea ice concentration and positive sea surface temperature anomalies could in fact be caused by warm, moist intrusions from lower latitudes, which would result in a downward heat flux. If this is indeed correct, the causal chain of events is misrepresented in the model experiment, likely misrepresenting turbulent heat fluxes. Arctic Mid-Latitude Linkages White Paper 14
Hemispheric-wide response of AA A key area of research for Arctic and mid-latitude linkages is to understand the two-way interactions between the tropospheric and stratospheric polar vortex. The jet stream from autumn to early winter is largely characterized by i) non-linear interactions between enhanced atmospheric planetary waves, such as in Figure 6, ii) irregular transitions between predominantly zonal and meridional flows, and iii) the maintenance of atmospheric blocking (near-stationary large- amplitude atmospheric waves)— all of which are not well understood or predicted by operational forecast models. The surface warming over the Arctic Ocean during the delayed re-freezing in autumn — along with increased heat fluxes and reduced vertical stability — may fuel strong storm systems to develop over the Arctic (Jaiser et al. 2012; Semmler et al. 2016; Basu et al. 2018). The non-linear interaction between storm systems and planetary-scale waves contributes to changes in atmospheric circulation, which allows enhanced upward propagation of energy in early- to mid-winter to weaken the stratospheric polar vortex. The conditions that trigger this interaction (e.g., wave structure and number: how many wavelengths there are around a latitude circle) are hard to predict, as they have a large chaotic component. Arctic and mid-latitude linkages may also be state-dependent, i.e., linkages may be more favorable in one atmospheric wave pattern than another, creating intermittency (Overland et al. 2016). The impact of anomalous transient storm systems on the growth and phasing of planetary waves, the onset and maintenance of blocks, and the strength and location of the Siberian high may be preconditioned by the state of the hemispheric atmospheric background flow. While linkages in early winter have received the most attention by researchers owing to their influence on extreme winter weather, progress has also been made in understanding summer linkages. Here, there is an interaction of newly open water areas, atmospheric and oceanic frontal features, and phasing with high-amplitude/high-wavenumber atmospheric circulation features (Overland et al. 2012; Coumou et al. 2014). The summer season has seen an overall weakening of storm tracks over the last decades (Coumou et al. 2015), and this is also projected by future model projections (Lehmann et al, 2014). How a weakened flow might affect weather systems and especially their frequency is not fully understood (Coumou et al. 2017). Though one might think that the concept of wavy versus zonal circulation patterns is straightforward, we have found challenges in quantifying these states. Approaches can be roughly separated into geometric and dynamic methods. The former focuses on the geometry of the circulation to characterize the departure of the flow from zonality in terms of wave amplitude, sinuosity, or circularity (Francis and Vavrus 2012; Cattiaux et al. 2016; Rohli et al. 2005; Di Capua and Coumou 2016). These metrics have the advantage of being intuitive and readily visualized from geopotential height contours, but they have been criticized for lacking a firm physical basis. By contrast, dynamically based waviness metrics, such as effective diffusivity of potential vorticity and finite-amplitude wave activity (Nakamura and Solomon 2010), are derived from first-order energy conservation principles. These measures provide a theoretical basis for relating changes in zonal wind speed to accompanying changes in wave amplitude, at least under idealized conditions. Such approaches are being applied in climatological studies of circulation trends and extreme weather events related to amplified flow patterns (Chen et al. 2015), but their derivation is more technical and their application more involved than recent geometric methods. An example of the results from sinuosity is shown in Figure 7. The time series for the North Atlantic (top) shows a Arctic Mid-Latitude Linkages White Paper 15
weak trend and highlights year-to-year internal
variability in such indices. The bottom diagram
highlights the regional and seasonal nature of
long-term positive trends.

At this point, there is no scientific consensus
on which waviness metric or even category of
methods is preferable. Our field may benefit
from the variety of approaches to sort the most
useful measures of waviness. In the meantime,
the diversity of employed metrics complicates
direct comparisons and conclusions drawn
among studies. For example, Francis and Vavrus
(2012) reported increasing wave amplitudes
over the North American-Atlantic region during
recent decades, whereas Barnes and Polvani
(2015) applied a different wave-amplitude
definition over the same domain and generally
did not find increases observed in the past or
projected into the future. More recent studies
suggest complex circulation behavior, consisting
of opposing trends in waviness depending on
season, longitude, and latitude. For instance,
future climate projections exhibit a trend
towards increased sinuosity over the North
American sector only, while other sectors exhibit
unchanged or decreased waviness/blockings
(Cattiaux et al. 2016, Di Capua and Coumou 2016;
                                                       Figure 7. ERA-Interim recent trends in sinuosity. a) Time
Peings et al. 2017; Vavrus et al. 2017). However,      series of Atlantic JFM sinuosity, with a 5-year spline
these changes are subject to high uncertainties        smoothing, and b) longest significant trends in sinuosity
                                                       for all geographic domains (rows) and seasons (columns).
due to internal variability and competing effect
                                                       Colors represent trends in standard deviation (SD) per
of low-latitude versus high-latitude warming on        decade. (Figure from Cattiaux et al. 2016).
the response of the mid-latitude atmospheric
dynamics (Peings et al. 2017, Deser et al. 2015,
Blackport and Kushner 2017).

Regional Analyses
Asia
It has been well understood that AO modulates Asia surface air temperatures through altering
warm and moist air transport (e.g., Thompson and Wallace 1998). Associated with positive
(negative) AO, warm (cold) winter occurs in Eurasia and the Arctic and sea ice extent decreases
(increases) (e.g., Rigor et al. 2002; Zhang et al. 2003). Honda et al. (2009) specifically examined a
tropospheric dynamical pathway in which negative sea ice and positive air temperature anomalies

Arctic Mid-Latitude Linkages White Paper                                                                           16
Figure 8. Observed (top) and modeled (bottom) ensemble-mean responses to reduced sea ice over Barents-Kara seas for
the subseasonal evolution of the polar cap height anomaly (PCH; shading is standard deviation) as a function of pressure
(hPa; Figure from Kim et al. 2014).
over the Barents-Kara seas during autumn cause cold Eurasia-Far East temperatures in mid-to-
late winter. In the troposphere, persistent constructive interference of lower-atmospheric warming
with atmospheric Rossby waves into December/January may induce a negative AO-like pattern,
which may continue into February/March. Kim et al. (2014) investigated the stratosphere pathway
from both observational analysis and modeling experiments and found that sea ice loss can induce
vertical propagation of planetary wave energy, which weakens the stratospheric polar vortex and
then propagates wave energy downward into the troposphere, maintaining an amplified jet-stream
pattern into mid-to-late winter (Figure 8).
In December and January, the additional oceanic heat and moisture release to the Arctic atmosphere
can increase Siberian snow cover (Wegmann et al. 2015). The increased snow cover may enhance
continental cooling and troughing over East Asia while strengthening the Siberian high upstream
over northwest Eurasia. A ridge over northwestern Eurasia with a trough over northeastern Eurasia
is favorable for the direct forcing of planetary waves with enhanced vertical propagation of wave
energy into the stratosphere (Cohen et al. 2007; Nakamura et al. 2015). This can lead to wave
breaking and disruption of the stratospheric polar vortex (Jaiser et al. 2016).
Such a negative AO-like circulation tends to produce atmospheric blocking over the Ural regions with
an enhanced Siberian high (Hopsch et al. 2012; Mori et al. 2014). Such dynamically forced links can
be extracted from observational data using causal discovery algorithms (Figure 9; from Kretschmer
Arctic Mid-Latitude Linkages White Paper 17et al. 2016), indicating that
these are real pathways and
not spurious correlations.
Figure 9 illustrates that low
sea ice concentrations over
the Barents-Kara seas lead
to high pressure over Ural
mountains, which leads to
upward wave propagation
(“v-flux”) and weakening
of the stratospheric polar
vortex. The anticyclonic
anomaly first occurs over Figure 9. Causal pathways between different Arctic actors extracted from observations.
the Barents-Kara seas Blue arrows indicate a negative causal influence, red arrows a positive causal influence,
and the number next to the arrows indicates the lag in months. The regional actors,
and Ural regions, bringing Barents-Kara sea ice concentration (BK-SIC), Ural region sea level pressure (Ural-SLP),
cold air from the Arctic to Siberian sea level pressure (Sib-SLP), and East Asia snow cover (EA-snow), are presented
according to their approximate geographical location. The hemispheric actors (Arctic
central Asia, which extends Oscillation (AO), upward wave propagation (v-flux), and polar vortex (PoV)), are presented
southeastward owing to a according to their approximate latitude and pressure levels. (Figure from Kretschmer et
al. 2016).
strengthened Siberian high.
This southward flow of Arctic
air has been implicated in
more frequent or intensified cold surges over East Asia (Overland et al. 2015; Zuo et al. 2016). These
processes are complicated by Arctic sea ice feedbacks (Li and Wang 2014; Luo et al. 2016; McCusker
et al. 2016). While model simulations exhibit uncertainties in the Siberian high response, there is
increasing evidence for the aforementioned processes taking place in recent decades.
North America
Potential connections between the North American Arctic and mid-latitudes depend on the
constructive or destructive interactions with locations of existing large-scale waves in the jet stream.
Climatological waves during winter usually consist of a ridge of higher geopotential heights over
the northeastern Pacific and/or Greenland along with a trough of lower heights over central and
eastern North America (Figure 6b), although a great deal of interannual variability is common. Of
particular interest is the winter cooling trend in eastern North America since 1990 (Cohen et al.
2014). Although this trend coincides with Arctic warming (Kug et al. 2015; Lee et al. 2015; Cohen
2016), studies have also pointed to internal variability (Baxter and Nigam 2015) and influences from
the tropical Pacific (Basu et al. 2013; Sun et al. 2016). Very recent work suggests a tropical response
to Arctic warming that feeds back to the Arctic (Cvanovic et al 2017). Furthermore, Ayarzagüena and
Screen (2016) and Trenary et al. (2016) do not see an increase in the number of cold events in data
or future model projections.
The potential for the Arctic to influence eastern North America involves a modification and added
persistence to the existing long-wave pattern. Figure 10 (left) shows the pattern of near-surface
air temperatures that occurs during eastern North America cold events (note the warm Arctic/
cold continent type pattern with positive temperature anomalies near southern Baffin Bay and in
Arctic Mid-Latitude Linkages White Paper 18Figure 10. (left) Surface temperature anomalies (K) and (right) 250 hPa geopotential height anomalies (m, shading) during North
American cold spells as determined in the red box region. Only anomalies exceeding the 95% confidence level derived from a
random Monte Carlo sampling procedure are shown. The data covers ERA-20C DJFs over the period 1900–2010. (Figure from
Messori et al. 2016).
Alaska/East Siberia). Figure 10 (right) is the corresponding 250 hPa geopotential height anomaly
field for cold events in eastern North America. Higher anomalies are collocated with the two regions
of positive temperature anomalies, suggesting a surface/geopotential thickness connection. Higher
regional Arctic geopotential heights increase the likelihood of Alaskan and/or Greenland blocks;
further analyses suggest that these regional blocks are independent features. The geopotential
height ridge along the US West Coast and the low heights over eastern North America are an
amplification of the climatological late-autumn/early-winter wave pattern. The anomaly pattern
over the North Atlantic Ocean exhibits a strong downstream storm track coincident with eastern
North America cold events. While these historical teleconnections in Figure 10 do not necessarily
involve Arctic change, Kug et al. (2015) suggest a recent (1980-2014) winter connection between
warm temperatures in the Chukchi Sea and cold spells in eastern North America. Further, extreme
sea ice loss and warm temperatures in the Chukchi region during November 2016 were consistent
with this pattern, including a northward extension of the western ridge into the central Arctic along
with an eastern cold event in early December 2016. Likewise, Ballinger et al. (2017) and Chen and
Luo (2017) found variations in sea ice freeze onset in Baffin Bay and regional positive sea surface
temperature anomalies were linked to 500-hPa blocking patterns and years of extreme late freeze
conditions since 2006. Thus, it is overly simplistic to say that the Arctic could cause eastern North
American cold spells, but near-future Arctic change has the potential to reinforce such cold events
through tendencies to trigger the formation of Alaskan and Greenland blocks.
Europe
As is the case everywhere, potential linkages between Arctic warming and weather in Europe are
complex in the sense that severe weather involves multiple causes. Greenland blocking tends to
be associated with an abnormally southerly latitude of the storm track across the eastern Atlantic,
which favors cold winters in northwestern Europe (Woollings et al. 2010). Evidence of connectivity
between Barents-Kara sea ice loss and winter weather in northern Europe has been reported
(Petoukhov and Semenov 2010; Orsolini et al. 2012; Liptak and Strong 2014), although variability
in Europe’s weather is principally associated with the North Atlantic Oscillation (NAO) and high-
Arctic Mid-Latitude Linkages White Paper 19You can also read