CARD-FISH in the Sequencing Era: Opening a New Universe of Protistan Ecology - Frontiers
←
→
Page content transcription
If your browser does not render page correctly, please read the page content below
REVIEW
                                                                                                                                             published: 04 March 2021
                                                                                                                                      doi: 10.3389/fmicb.2021.640066

                                             CARD-FISH in the Sequencing Era:
                                             Opening a New Universe of Protistan
                                             Ecology
                                             Kasia Piwosz 1,2* , Indranil Mukherjee 3 , Michaela M. Salcher 3 , Vesna Grujčić 4 and
                                             Karel Šimek 3*
                                             1
                                               Department of Fisheries Oceanography and Marine Ecology, National Marine Fisheries Research Institute, Gdynia, Poland,
                                             2
                                               Centre ALGATECH, Institute of Microbiology of the Czech Academy of Sciences, Třeboň, Czechia, 3 Biology Centre of the
                                             Czech Academy of Sciences, Institute of Hydrobiology, České Budějovice, Czechia, 4 Science for Life Laboratory,
                                             Department of Gene Technology, School of Engineering Sciences in Chemistry, Biotechnology and Health, KTH Royal
                                             Institute of Technology, Stockholm, Sweden

                                             Phagotrophic protists are key players in aquatic food webs. Although sequencing-
                          Edited by:
           Télesphore Sime-Ngando,
                                             based studies have revealed their enormous diversity, ecological information on in situ
     Centre National de la Recherche         abundance, feeding modes, grazing preferences, and growth rates of specific lineages
         Scientifique (CNRS), France
                                             can be reliably obtained only using microscopy-based molecular methods, such
                         Reviewed by:
                                             as Catalyzed Reporter Deposition-Fluorescence in situ Hybridization (CARD-FISH).
                         Klaus Jürgens,
         Leibniz Institute for Baltic Sea    CARD-FISH is commonly applied to study prokaryotes, but less so to microbial
             Research (LG), Germany          eukaryotes. Application of this technique revealed that Paraphysomonas or Spumella-
                        Ludwig Jardillier,
          Université Paris-Sud, France
                                             like chrysophytes, considered to be among the most prominent members of protistan
                  *Correspondence:
                                             communities in pelagic environments, are omnipresent but actually less abundant than
                         Kasia Piwosz        expected, in contrast to little known groups such as heterotrophic cryptophyte lineages
                kpiwosz@mir.gdynia.pl
                                             (e.g., CRY1), cercozoans, katablepharids, or the MAST lineages. Combination of CARD-
                          Karel Šimek
                   ksimek@hbu.cas.cz         FISH with tracer techniques and application of double CARD-FISH allow visualization
                                             of food vacuole contents of specific flagellate groups, thus considerably challenging
                   Specialty section:
                                             our current, simplistic view that they are predominantly bacterivores. Experimental
         This article was submitted to
                 Aquatic Microbiology,       manipulations with natural communities revealed that larger flagellates are actually
               a section of the journal      omnivores ingesting both prokaryotes and other protists. These new findings justify
             Frontiers in Microbiology
                                             our proposition of an updated model of microbial food webs in pelagic environments,
       Received: 10 December 2020
        Accepted: 09 February 2021
                                             reflecting more authentically the complex trophic interactions and specific roles of
         Published: 04 March 2021            flagellated protists, with inclusion of at least two additional trophic levels in the
                             Citation:       nanoplankton size fraction. Moreover, we provide a detailed CARD-FISH protocol for
               Piwosz K, Mukherjee I,
                                             protists, exemplified on mixo- and heterotrophic nanoplanktonic flagellates, together
  Salcher MM, Grujčić V and Šimek K
(2021) CARD-FISH in the Sequencing           with tips on probe design, a troubleshooting guide addressing most frequent obstacles,
        Era: Opening a New Universe          and an exhaustive list of published probes targeting protists.
                 of Protistan Ecology.
         Front. Microbiol. 12:640066.        Keywords: aquatic microbial food webs, CARD-FISH, grazing by protists, protists, unicellular eukaryotes,
    doi: 10.3389/fmicb.2021.640066           bacterivorous, omnivorous and predatory flagellates, heterotrophic and mixotrophic flagellates

Frontiers in Microbiology | www.frontiersin.org                                    1                                          March 2021 | Volume 12 | Article 640066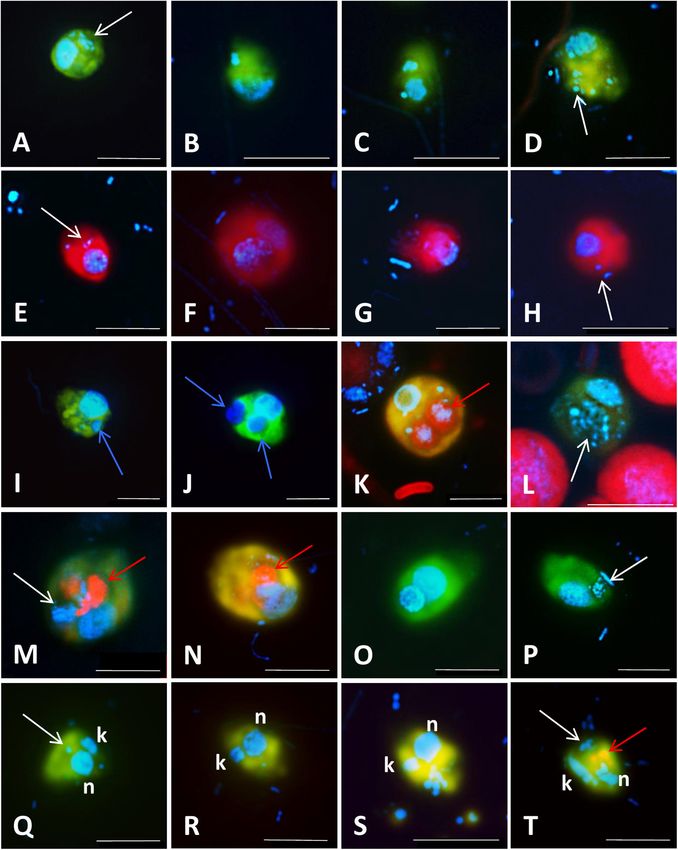
Piwosz et al.                                                                                                              CARD-FISH for Protists

INTRODUCTION                                                              INFUSORIA: ‘BLACK BOX’ OF PROTISTS
Protists (unicellular eukaryotes) play a central role in carbon and       The existence of protists was discovered in the 17th century
energy flow and nutrient recycling in aquatic food webs (Azam             by Antonie van Leeuwenhoek, who was the inventor of a
et al., 1983; Sherr and Sherr, 1988). Small heterotrophic and             light microscope, the main tool used in ecological studies
mixotrophic flagellated (HF and MF, respectively) protists                of these captivating organisms until the late 20th century.
with cell size < 8 µm are the key predators of pelagic                    This technique provided basic information on the morphology
prokaryotes (Porter et al., 1985; Šimek and Straškrabová,                 and gave preliminary hints on feeding modes of the most
1992; Rychert, 2006; Zubkov and Tarran, 2008). They control               commonly observed and cultured microplanktonic protists (cell
size distribution and composition of prokaryotic communities              size > 20 µm) that possess diverse cell structures and shapes
by selectively grazing on specific morpho- and phylotypes                 allowing for tentative discrimination of species. Thus, ciliates
(Šimek and Chrzanowski, 1992; Šimek et al., 1997b; Jürgens                or dinoflagellates can be microscopically classified, and a large
and Matz, 2002; Jezbera et al., 2005, 2006). The trophic role             number of planktonic taxa have been described (Foissner and
of larger protists (8–20 µm) is far less understood (Arndt                Berger, 1996; Steidinger and Jangen, 1997; Foissner et al., 1999;
and Mathes, 1991; Arndt et al., 2000; Šimek et al., 2020).                Hoppenrath et al., 2009, 2014; Madoni, 2011). Consequently,
These apparently omnivorous predators appear ahead of the                 in ecological studies of ciliates, feeding modes of the major
ciliates in the energy transfer and are the main consumers                bacterivorous and omnivorous taxa can be identified to the level
of bacterivorous protists and pico-sized algae (Piwosz and                of genus, species or of a genus-like morphotype in environmental
Pernthaler, 2011; Mukherjee et al., 2017, 2019; Grujčić et al.,         samples (e.g., Montagnes and Lynn, 1987; Šimek et al., 2000,
2018). These considerably understudied but ecologically                   2019; Posch et al., 2015; Šimek and Sirova, 2019).
highly relevant trophic interactions significantly modulate                   In contrast, it is far harder to differentiate NF to a species,
carbon flow efficiency, nutrient regeneration, and overall                genus, or even phylum level. The research on their community
trophic cascading within the grazer food chain (Goldman                   composition and ecological traits has been largely hindered
and Caron, 1985; Goldman et al., 1985; Andersen et al., 1986;             by virtual lack of distinguishable morphological features of
Arndt et al., 2000; Šimek et al., 2019, 2020). Our review                 these mostly uncultivated protists (Arndt et al., 2000; Bass
focuses on phagotrophic nanoplanktonic HF and MF (with                    and Cavalier-Smith, 2004; Adl et al., 2019). Their enormous
cell size 3–20 µm; Jürgens and Matz, 2002; Massana, 2011),                phylogenetic diversity is largely hidden behind simple, oval
whose grazing impacts modulate their prey communities,                    cells usually containing a single nucleus and 1–2 flagella. Only
and vice versa, shifts in prokaryotic prey communities                    a few NF groups, e.g., cryptophytes, pedinellids, haptophytes,
rapidly cascade to the predator communities (Šimek et al.,                kinetoplastids and choanoflagellates, can be identified by
2013, 2020; Grujčić et al., 2018), while our knowledge on               experts via phase contrast, fluorescence microscopy, electron
these key predator-prey interactions at an individual level               microscopy, or live sample observations (Swale, 1969; Patterson
is quite limited.                                                         and Larsen, 1991; Boenigk and Arndt, 2002; Sekiguchi et al.,
    Here, we review how the application of the CARD-                      2003; Wasmund et al., 2011; Majaneva et al., 2012; Jeuck and
FISH technique helped to advance our understanding                        Arndt, 2013; Weber et al., 2017). Consequently, in classical
of microbial trophic interactions and energy fluxes                       grazing research on heterotrophic prokaryotes, bacterivorous
through microbial food webs, with the focus on aquatic                    NF were treated as one functional unit, which reacts more
nanoplanktonic flagellates (NF). First, we shortly discuss                or less uniformly to certain environmental factors (Berninger
the currently used CARD-FISH protocols for protists                       et al., 1991; Sanders et al., 1992; Gasol and Vagué, 1993).
and their combinations with other fluorescence-labeling                   Although such microscopy-based studies reported, for example,
techniques that allow determination of feeding modes and                  similar looking small HF with two unequally long flagella as
preferred prey at a single cell level in natural environments             “Spumella-like,” “(Pseudo)Bodo ssp.,” or “Paraphysomonas spp.”
without any sample manipulation. Subsequently, we                         functional guilds of key bacterivores in marine and freshwaters,
demonstrate how these approaches revealed hidden                          they failed to uncover their phylogenetic affiliation and diversity
ecological and ecophysiological traits of so far unknown                  (Fenchel, 1982; Andersen and Fenchel, 1985; Jürgens and Güde,
and morphologically almost indistinguishable protistan                    1994; Hansen, 1996; Šimek et al., 1997a; Matz et al., 2002).
lineages in marine and freshwater habitats. Based on this                 Nevertheless, epifluorescence microscopy, combined with the
novel knowledge that considerably modifies the current                    use of fluorescent food tracers or radiolabeled prey, allowed
views on the carbon fluxes in pelagic environments, we                    to recognize smaller flagellated protists (ca. 2–8 µm in size)
propose an updated model of microbial food webs that                      as the most prominent pelagic bacterivorous protistan groups,
more realistically reflects the complex trophic interactions              omnipresent in both marine and freshwater habitats (Sherr and
and specific roles of NF. Our overarching aim is to attract               Sherr, 1988; Chrzanowski and Šimek, 1990; González et al.,
more attention of microbial ecologists to the intriguing                  1990b; Nygaard and Hessen, 1990; Berninger et al., 1991;
aspects of protistan ecology that these single-cell resolution            Šimek et al., 1997b; Zubkov et al., 1998; Jezbera et al., 2005;
approaches enabled to discover, thus considerably advancing               Weisse et al., 2016). Moreover, even this simplifying “black box
our understanding of microbial food web structure                         approach,” ranking HF and prokaryotes only as large functional
and functioning.                                                          guilds, has brought many indications that bacterioplankton

Frontiers in Microbiology | www.frontiersin.org                       2                                    March 2021 | Volume 12 | Article 640066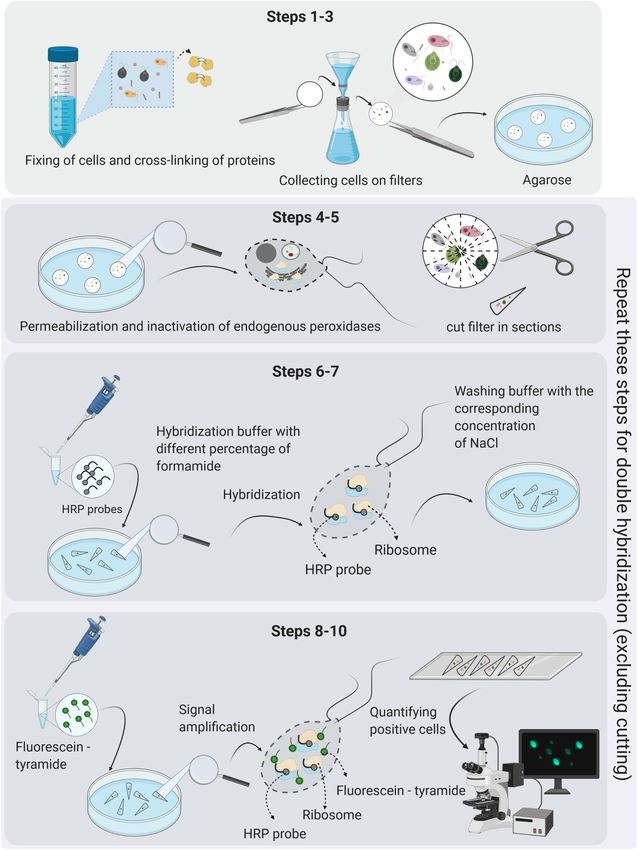
Piwosz et al.                                                                                                               CARD-FISH for Protists

responds to strong HF grazing pressure by multitude of adaptive           2001; Moon-van der Staay et al., 2001). A wide range of studies
mechanisms. For instance, selective grazing of HF predators               followed in various ecosystems such as marine, freshwaters,
shape morphological and compositional structure of prokaryotes            sediments, soils, and insect guts, to name a few (Edgcomb et al.,
(Chrzanowski and Šimek, 1990; González et al., 1990a; Šimek and           2002; López-García et al., 2003; Romari and Vaulot, 2004; Lovejoy
Chrzanowski, 1992; del Giorgio et al., 1996; Corno and Jürgens,           et al., 2006; Moon-van der Staay et al., 2006; Stoeck et al.,
2006; Zubkov and Tarran, 2008), resulting in a broad variety              2006; Ohkuma and Brune, 2010; Piwosz and Pernthaler, 2010;
of grazing-resistant strategies of prokaryotes (see e.g., reviews         Sauvadet et al., 2010; Scheckenbach et al., 2010; Stock et al., 2012;
by Hahn and Höfle, 2001; Jürgens and Matz, 2002; Pernthaler,              Medlin et al., 2017; Mukherjee et al., 2017). With the advent
2005) that lead to complete avoidance or a considerable decrease          of sequencing technologies, Sanger sequencing of clone libraries
of their grazing-induced mortality rates (Jürgens and Güde,               has been replaced by high-throughput sequencing (HTS, also
1994; Šimek et al., 1999, 2001; Langenheder and Jürgens, 2001).           known as NGS – Next generation sequencing) techniques, such
However, only the application of FISH techniques to target                as already obsolete Ion torrent and 454 pyrosequencing (Behnke
specific lineages of prokaryotes brought detailed insights to             et al., 2011; Bachy et al., 2013; Egge et al., 2013, 2015; Georges
diverse impacts of protistan grazing on prokaryotic morphology            et al., 2014; Balzano et al., 2015; Piwosz et al., 2018), currently
and community composition (Šimek et al., 1997b, 2001, 2007;               the most often used Illumina MiSeq/HiSeq platforms (Logares
Langenheder and Jürgens, 2001; Jürgens and Matz, 2002;                    et al., 2014; de Vargas et al., 2015; Hu et al., 2016), and the
Pernthaler, 2005).                                                        most recent PacBio and Oxford Nanopore MinION platforms
    Cultivation approaches and live sample observations (e.g.,            (Orr et al., 2018; Davidov et al., 2020; Hatfield et al., 2020).
Arndt et al., 2000; Boenigk and Arndt, 2002; Jeuck and Arndt,             HTS enables to process large number of samples at once at
2013; Weber et al., 2017) provided additional details for protists        low cost, providing qualitative information on composition of
determination and thus also facilitated progress in the field, but        protistan communities even up to the species level (Amaral-
have been limited to a restricted number of easily cultivable             Zettler et al., 2009; Stoeck et al., 2010; Logares et al., 2014). The
flagellates and ciliates. Unfortunately, the vast majority of free-       Malaspina (Duarte, 2015) and TARA Oceans (Bork et al., 2015)
living protists cannot be easily isolated and cultivated under            oceanographic circumnavigation campaigns made it evident that
close to in situ conditions (Weber et al., 2017), and thus, in            the majority of marine protistan lineages remain morphologically
fact this bottleneck effect recalls the well-known bacterial story        unknown, even if they belong to the recognized groups, such as
of “great plate count anomaly” (Staley and Konopka, 1985;                 Stramenopiles, Alveolata, Rhizaria, and “Excavata” (Figure 1B,
Lim et al., 1999).                                                        de Vargas et al., 2015; Pernice et al., 2016). Similar pictures also
                                                                          emerged from localized sampling campaigns (Parris et al., 2014;
                                                                          Massana et al., 2015). Highly diverse communities of Dinophyta,
SEQUENCING ERA: OPENING THE                                               Cercozoa, Stramenopiles, and Kinetoplastida were reported from
“BLACK BOX” OF PROTISTS                                                   extreme environments like abyssal depths and hydrothermal
                                                                          vents (Sauvadet et al., 2010; Scheckenbach et al., 2010). A novel
The vast diversity of protists that encompass all the branches of         picture on protistan diversity also emerged from the studies of
eukaryotic phylogenetic tree (Figure 1A) has been recognized              freshwater and brackish habitats (Figure 1B), which discovered
only since the last two decades (Pawlowski et al., 2012; Adl              an unexpected diversity of the well-known groups: Cryptophyta,
et al., 2019; Burki et al., 2020). The progress in describing             Stramenopiles, and Choanozoa (del Campo and Massana, 2011;
the diversity of nanoplanktonic protists has been possible                Simon et al., 2015a,b; Grossmann et al., 2016; Hu et al., 2016;
thanks to the development of molecular techniques and their               Grujčić et al., 2018; Piwosz et al., 2018). One of the biggest
increased application in microbial ecology. The increasing                surprises from these studies was the discovery of highly diverse
amount of information about their phylogenetic diversity,                 marine lineages of diplonemids (Flegontova et al., 2016), with
discoveries of cryptic species and of novel lineages made it              a recently discovered lineage also in freshwaters (Mukherjee
evident that the knowledge on their diversity had been superficial        et al., 2020). Similarly, another member of the excavate protists,
(Šlapeta et al., 2006; Caron et al., 2012). These unexpected              kinetoplastids, were reported to be highly diverse and abundant
results have changed not only our perception of protistan                 in the deep waters of both oceans and freshwater lakes (von
diversity, but also of their role in ecosystem functioning and            der Heyden and Cavalier-Smith, 2005; Scheckenbach et al., 2010;
evolution of eukaryotes (Worden et al., 2015; Adl et al., 2019;           Salani et al., 2011; Flegontova et al., 2018; Mukherjee et al.,
Burki et al., 2020).                                                      2019). Novel lineages were discovered within well-known groups,
    As in the case of prokaryotes, a gene encoding the small              such as the freshwater CRY1 lineage of cryptophytes (Shalchian-
subunit (SSU) ribosomal RNA (18S rRNA) became widely used                 Tabrizi et al., 2008). Finally, Perkinsozoa (Mangot et al., 2012;
as a marker gene in community analyses of protists (Figure 1A).           Taib et al., 2013) and Telonemia were also found to be widely
Due to its patchy nature of conserved and non-conserved regions,          distributed in both marine and freshwaters (Shalchian-Tabrizi
it enables both discrimination between closely related organisms          et al., 2007; Brate et al., 2010; Triado-Margarit and Casamayor,
and primer design for specific groups at various taxonomical              2012; Simon et al., 2015b). However, the ecological role of most
levels. The first studies by Sanger sequencing of 18S rRNA clone          of these novel groups is not yet well understood.
libraries revealed an unexpected diversity and presence of novel              To circumvent this lack of ecophysiological information,
lineages of protists from marine ecosystems (Lopez-Garcia et al.,         HTS sequencing studies have been combined with advanced

Frontiers in Microbiology | www.frontiersin.org                       3                                     March 2021 | Volume 12 | Article 640066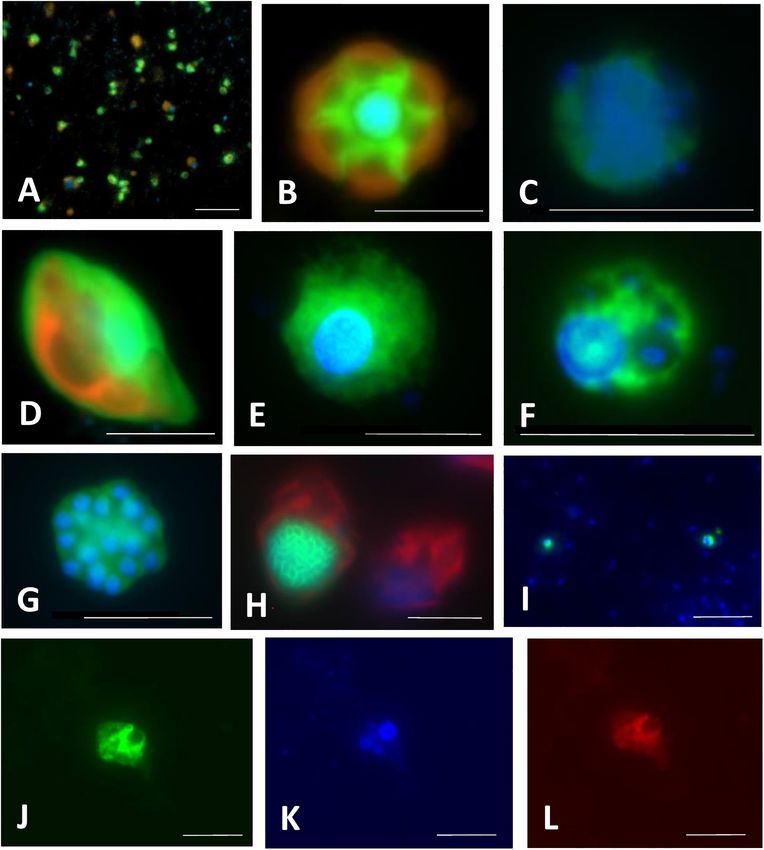
Piwosz et al.                                                                                                                                    CARD-FISH for Protists

  FIGURE 1 | A general phylogenetic tree of protistan groups known to be important in pelagic environments. (A) 18S rRNA phylogenetic guide tree provided by SILVA
  release 138.1 SSU_Ref_NR99. Only branches containing sequences recovered either from freshwater and marine habitats were included by parsing the
  isolation_source field for respective entries, higher organisms (plants, animals) have been removed. (B) Taxonomic classification of eukaryotic 18S rRNA gene
  sequences recovered either from freshwater or marine habitats. The names of the groups follow notation by Adl et al. (2019) and Burki et al. (2020). TSAR –
  telonemids, stramenopiles, alveolates, and Rhizaria; CRuMs – collodictyonids (syn. diphylleids), Rigifilida and Mantamonas. The asterisk in TSAR, Alveolata indicates
  a lineage of non-TSAR protists (Archaeplastida, Rhodophyceae, Galdieria).

statistical analyses, e.g., multivariate or co-occurrence networks                     In addition, much more efforts have been put on prokaryotes
(Steele et al., 2011; Cram et al., 2013; Guidi et al., 2016). Such                     than on protists, although the latter play key roles as primary
correlative approaches provide only indirect hints about the                           producers, predators or parasites. This evident imbalance in the
biotic and abiotic interactions that may be crucial for structuring                    research progress represents likely one of the largest knowledge
microbial communities over time and space (Posch et al., 2015;                         gaps in the field, which justifies also the timing of this review.
Qu et al., 2021), but may enable informed decision on the                                 Moreover, the quantitative accuracy of HTS data is
microbial groups to be targeted by CARD-FISH. However, the                             compromised by the uneven effectiveness of DNA extraction
relative ease of obtaining sequencing data from large amounts                          protocols (Martin-Laurent et al., 2001), biased efficiency of
of samples at once compared to analyzing individual samples                            PCR amplification (Hansen et al., 1998), incomplete coverage
by laborious microscopic methods resulted in a disproportional                         of primers across phylogenetic groups (Klindworth et al., 2013;
boom in diversity research. Unfortunately, the rapid progress in                       Mukherjee et al., 2015), and a highly variable number of 18S
sequence-based investigation has not been accompanied by an                            rDNA gene copies in protists ranging from 1 in picoplanktonic
increase in studies on other aspects of protistan ecology, such as                     Nannochloropsis salina (Eustigmatophyceae) to 315,000 in the
morphology, abundances, feeding modes, or trophic roles of new                         peritrich ciliate Vorticella sp. (Zhu et al., 2005; Gong et al.,
lineages (Stern et al., 2018). Most strikingly, for most recovered                     2013). Moreover, high intra-genomic diversity of 18S rRNA gene
sequences, neither the organisms themselves have been visualized                       sequences (i.e., the same cell can harbor multiple variants of
yet nor their abundance and distribution have been quantified.                         18S rRNA genes beyond the species level) can artificially inflate

Frontiers in Microbiology | www.frontiersin.org                                    4                                           March 2021 | Volume 12 | Article 640066
Piwosz et al.                                                                                                                                CARD-FISH for Protists

  FIGURE 2 | Relationships between relative abundance of selected protistan lineages from high throughput sequencing (HTS) and CARD-FISH. Black line indicates a
  perfect 1:1 correspondence between the two methods. Points above this line indicate overrepresentation, and below the line underrepresentation of a phylotype by
  HTS. Chlo2, chlorophytes hybridizable with Chl02 probe; CryptB, cryptophytes hybridizable with CryptB; CryptP1_680, CRY1 cryptophytes hybridizable with
  CryptP1_680 probe; Diplo516, diplonemids hybridizable with Diplo516 probe; Kin516, kinetoplastids hybridizable with Kin516 probe; Ped675, pedinellids
  hybridizable with Ped675 probe. Detail on the probes can be found in Supplementary Table 1. Data on Chlo02, CryptB, CryptP1_680 and Ped675 are from
  Piwosz et al. (2020), on Diplo516 from Mukherjee et al. (2020), and on Kin516 from Mukherjee et al. (2019).

the diversity of some protistan groups (Caron and Hu, 2019;                          such as fluorescence in situ hybridization (FISH) (Amann
Mukherjee et al., 2020). The relative abundances of specific                         et al., 1995). FISH and its improved version with enzymatic
protistan phylotypes obtained by HTS poorly correspond to                            signal amplification (catalyzed reporter deposition “CARD-
their relative abundances in the original samples (Figure 2), and                    FISH,” known also as tyramide signal amplification “TSA-FISH”),
provide only a limited possibility to conduct hypothesis-driven                      provide estimates of relative abundance (a percent contribution
research on the ecology of particular protistan taxa (Pitsch et al.,                 to total eukaryotic numbers) of individual microbial lineages
2019; Piwosz et al., 2020). In results, little is known about the                    defined by their rRNA gene phylogeny (Not et al., 2002;
ecology of majority of the newly discovered protistan lineages.                      Pernthaler et al., 2004). The key steps in the CARD-FISH protocol
Even the latest single cell sequencing or metagenomic techniques                     are depicted in Figure 3. CARD-FISH provides up to 200-fold
cannot yet provide ecological data on uncultured protistan                           brighter signals than FISH with monolabeled probes, enabling
lineages due to technological obstacles and the knowledge gaps                       detection of almost inactive cells with a low number of ribosomes
in eukaryotic genomics (Seeleuthner et al., 2018).                                   (Lim et al., 1993). It has become a verified quantitative tool in
                                                                                     numerous studies on prokaryotic communities, providing hints
                                                                                     on their ecological niche, functions, and interactions (Amann
                                                                                     and Fuchs, 2008). However, its use for eukaryotes has been less
CATALYZED REPORTER                                                                   common (e.g., Not et al., 2005, 2008; Massana et al., 2006a;
DEPOSITION—FLUORESCENCE IN SITU                                                      Piwosz and Pernthaler, 2010; Unrein et al., 2014; Mukherjee
HYBRIDIZATION: OPENING A NEW                                                         et al., 2015). The main advantage of CARD-FISH over the
UNIVERSE OF PROTISTAN ECOLOGY                                                        HTS methods is that the relative abundance of a particular
                                                                                     lineage can be evaluated independently from all other taxa
The hindrances caused due to the sole use of sequencing                              in the samples. Moreover, the CARD-FISH procedure can be
techniques to address ecological questions can be solved by                          separately optimized for each target group (probe), which is
complementary use of microscopy-based molecular methods,                             not possible for PCR with primers that target many different

Frontiers in Microbiology | www.frontiersin.org                                  5                                          March 2021 | Volume 12 | Article 640066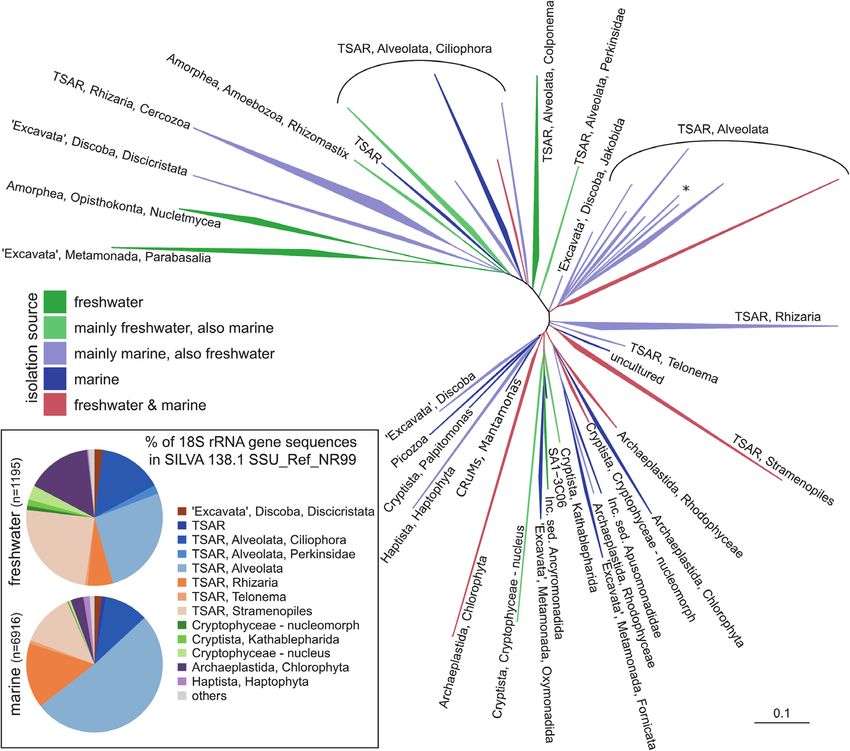
Piwosz et al.                                                                                                                          CARD-FISH for Protists

  FIGURE 3 | The key steps in the CARD-FISH and double CARD-FISH procedures. The detailed protocol is given in Supplementary File 2, and a single page
  printable version in Supplementary File 3. Figure created with BioRender.

templates. It can be also combined with results from direct                       content observations provides information on grazing rates,
enumeration methods, such as microscopy or flow cytometry,                        prey-selectivity, taxonomic information on bacterial, archaeal
providing absolute abundance estimates of microbial lineages                      and eukaryotic prey, and ultimately trophic roles of specific
in the samples. Finally, simultaneous use of CARD-FISH and                        protistan lineages (Jezbera et al., 2005; Chambouvet et al., 2008;
double CARD-FISH with fluorescent tracers and food vacuole                        Piwosz and Pernthaler, 2010, 2011; Ballen-Segura et al., 2017;

Frontiers in Microbiology | www.frontiersin.org                               6                                        March 2021 | Volume 12 | Article 640066
Piwosz et al.                                                                                                                  CARD-FISH for Protists

Grujčić et al., 2018; Šimek et al., 2020). Double CARD-FISH               on a phylogenetic tree. Although most probes have been so far
is a powerful tool for examining bacterivory and omnivory                   designed for bacteria and archaea, protists can be targeted as well,
by combining two probes at different trophic levels, targeting              requiring only slight modifications in the general probe-design
protistan predators as well as their prey in food vacuoles (both            process described in great detail by Hugenholtz et al. (2001) and
prokaryotes or other protists). This combination gives new                  in Supplementary File 1. Table 1 provides basic information
insights into predator–prey interactions, directly demonstrating            about general probes targeting main protistan lineages, while
which bacteria or small protists are preferentially consumed and            Supplementary Table 1 gives a comprehensive list of published
which groups of flagellates are their grazers in aquatic ecosystems         probes targeting diverse protistan lineages and an evaluation
(Piwosz and Pernthaler, 2010, 2011; Grujčić et al., 2018). Further,       of their specificity and coverage. The probes are labeled with
this method can be applied to identify symbiotic relationships              a fluorescent dye, such as CY3 and FITC, or with horseradish
between pro- and eukaryotic microbes (Chambouvet et al., 2008;              peroxidase (HRP) that amplifies the signal from fluorescently
Dirren et al., 2014; Lepère et al., 2016).                                  labeled tyramides via catalyzed reporter deposition (CARD).
   The main strength of the FISH technique is that it is                    The signal from the hybridized probes can be subsequently
based on SSU rRNA gene phylogeny, and thus, it allows for                   visualized via epifluorescence microscopy or less frequently by
the direct detection of phylotypes, the presence of which was               flow cytometry (Amann and Fuchs, 2008). The CARD-FISH
identified in the samples by sequencing. Probes for novel lineages          protocol itself consists of 10 steps (Figure 3), discussed in detail
discovered with the HTS methods can be designed using full-                 in Supplementary Files 2–5.
length sequences of the 18S rRNA genes that are identical or have               Sample fixation is the key step for the preservation of protistan
high similarities to short reads obtained via HTS (Piwosz, 2019),           cells for the CARD-FISH procedure (Figure 3, step 1). It increases
obtaining full-length sequence with amplicon-based specific and             cell permeability, which can be a critical factor for protists with
general eukaryotic primers combined with Sanger sequencing                  thick and/or complex cellular structures (Ku and Sebé-Pedrós,
(Gimmler and Stoeck, 2015), or with Nanopore or PacBio                      2019). Insufficiently fixed cells will degrade and rupture during
long-read sequencing of amplicons (Orr et al., 2018; Davidov                filtration, while harsh and highly concentrated fixatives can
et al., 2020; Hatfield et al., 2020). Regions of 18S rRNA                   shrink and deform cells (Fried et al., 2002), eventually resulting
unique to the selected, monophyletic group of interest can be               in the ejection of particles ingested in their food vacuoles (Sherr
then identified in an alignment and a robust phylogeny, at                  et al., 1989). More information on different fixatives is available in
best a phylogenetic inference using the maximum likelihood                  Supplementary File 2. However, we recommend fixing samples
(ML) criterion (Felsenstein, 1981). Such approach makes it                  with the neutral Lugol’s solution (final concentration 0.5%) for
possible to visualize the morphology of novel phylogenetic                  max. 1 min, followed by an immediate addition of particle-
lineages (Figures 4–6), estimate their abundance and biomass,
                                                                            free formalin or PFA (final concentration 1–2%), and complete
determine their role in food webs by inspecting food vacuole
                                                                            decolorization with a few drops of 3% sodium thiosulphate
contents (Figures 4–7), and also reveal symbiotic interaction
                                                                            solution. Samples preserved this way must not be stored longer
between different protist species (Figures 4I–L,O), and protists
                                                                            than 1 h at room temperature or 24 h at 4◦ C before filtration.
and prokaryotes (Figures 5A–H,P–T, 6A–F,M–Q) (Chambouvet
                                                                                Samples for CARD-FISH should be filtered with low vacuum
et al., 2008; Dirren et al., 2014; Schulz et al., 2014; Lepère
                                                                            underpressure onto white polycarbonate filters that retain
et al., 2016; Piwosz, 2019; Šimek et al., 2020). This powerful
                                                                            microbial cells on their surface (Figure 3, step 2). The filtered
approach has completely changed our views on abundance,
                                                                            sample volume needs to be carefully adjusted to avoid multiple
functions, and dynamics of microbial populations in different
                                                                            layers of cells, which would hamper microscopic analysis and may
environments. We strongly encourage researchers interested in
                                                                            cause detachment of cells during embedding in agarose (Figure 3,
protistan ecology to explore CARD-FISH in combination with
                                                                            step 3). The latter step minimizes cell loss during the follow up
other ecological approaches (see examples in Figures 4–7),
                                                                            sample handling steps and incubations in buffers required for the
as they provide taxonomic resolution of trophic interactions
                                                                            CARD-FISH procedure. So prepared filters can be piled up in
between different microbes and address the question “who eats
                                                                            a Petri dish and stored at –20◦ C or at –80◦ C at least for a few
whom” in microbial food webs at a single cell level. Below,
                                                                            months to years.
we provide a brief discussion of CARD-FISH protocols and an                     In contrast to prokaryotic cells (Pernthaler et al., 2002),
overview of new insights into protistan ecology facilitated by this         enzymatic permeabilization is not required for hybridization of
technique, a detailed description of all steps can be found in              some protists (Bochdansky and Huang, 2010), and it is enough
Supplementary Files 1–5.                                                    to simply dip the filters into 0.01 M HCl solution, which at the
                                                                            same time inactivates endogenous peroxidase (Figure 3, steps
CARD-FISH BASICS                                                            4–5). We obtained strong signals without additional enzymatic
                                                                            pretreatment for protists with thick cellulose cell walls like
In general, fluorescence in situ hybridization employs                      chlorophytes (Figure 4A), scales-bearing flagellates such as
oligonucleotide probes that target short regions (usually                   pedinellids (Figures 4B,C) or those having periplasmic scales
15–25 nucleotides in length) of rRNA genes and bind to a specific           such as cryptophytes (Figure 4D). However, obtaining good
sequence of rRNA molecules in intact ribosomes. The first step              signals from both the predatory NF and prey (prokaryotes or
of the CARD-FISH approach is selecting an already published                 other protists) in their food vacuoles using double CARD-FISH
probe or designing a novel probe for the lineage of interest based          method depends largely on the permeabilization of the cells so

Frontiers in Microbiology | www.frontiersin.org                         7                                      March 2021 | Volume 12 | Article 640066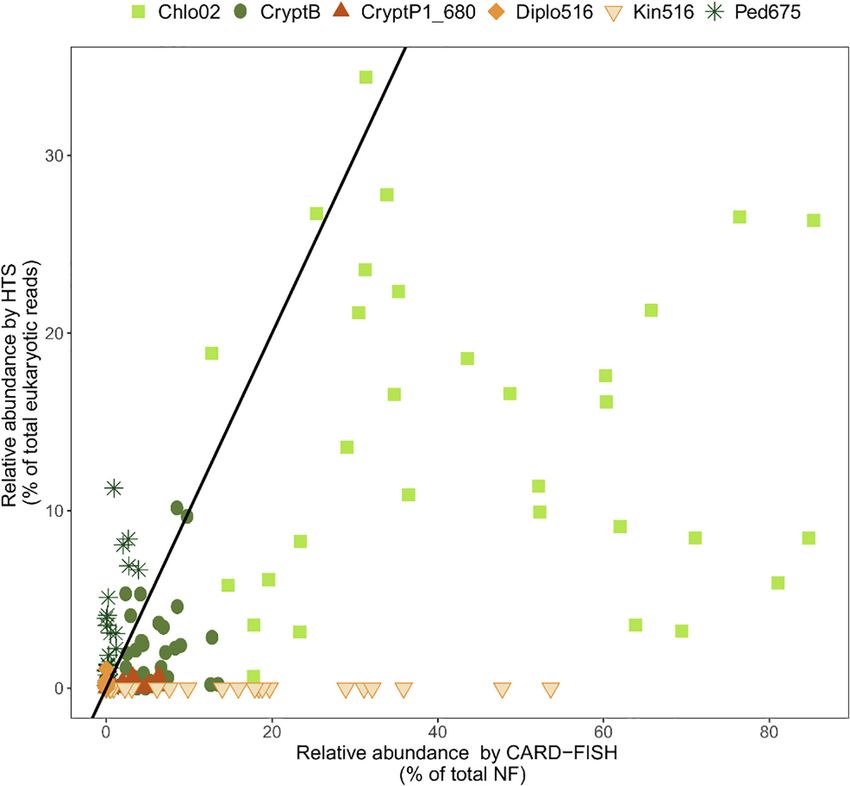
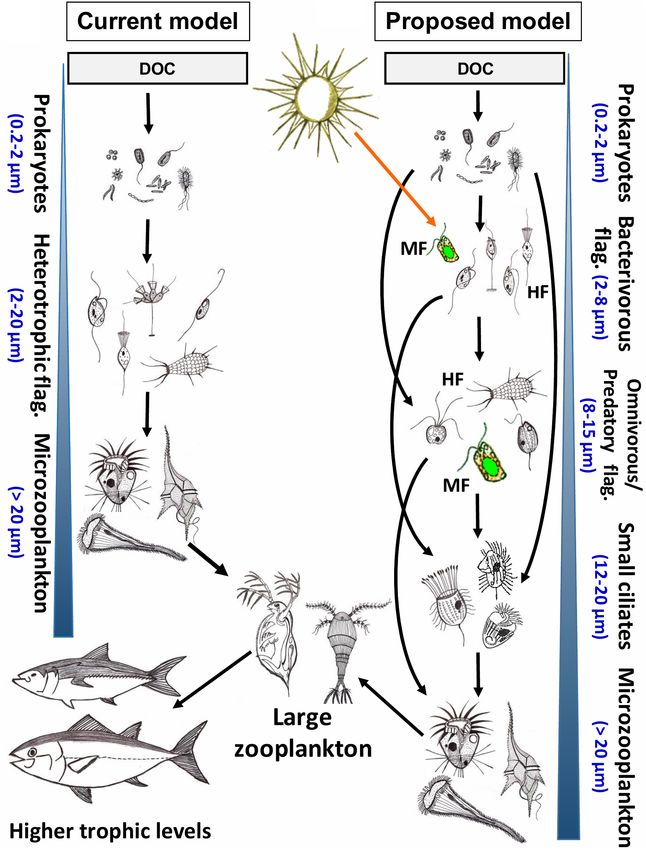
Piwosz et al.                                                                                                                                   CARD-FISH for Protists

  FIGURE 4 | Microphotographs showing typical flagellate size and morphology of cells targeted by CARD-FISH probes from brackish waters of the Baltic Sea (A–H)
  and freshwater lakes (I–L). Shown are overlay images of DAPI-stained flagellate nuclei (blue), FITC or Alexa488 stained flagellates targeted by probes (green) and
  chlorophyll autofluorescence (orange/red), except for (J–L), where individual pictures of different channels are shown. (A) Picoplanktonic chlorophytes (probe
  Chlo02) and other unhybridized algae; (B) plastidic pedinellid (probe Ped675); (C) aplastidic pedinellid (probe Ped675); (D) plastidic cryptophyte (probe Crypto B);
  (E,F) large and small morphotypes of MAST-6 stramenopiles, respectively (probe MAST-6); (G) parasitic Syndiniales (probe Alv_Bal02): a trophont outside a host, (H)
  parasitic Syndiniales (probe Alv_Bal02): a trophont inside a host cell (the dinoflagellate Heterocapsa triquetra); (I) tiny perkinsozoans (probe PERKIN_01); (J–L) a
  diplonemid cell hybridized with probe DiploR1792 (green) (J); corresponding DAPI staining (blue) (K) and double CARD-FISH with general eukaryotic probe
  [Euk1209, Alexa546 (red), L]. Scale bar = 10 µm.

that probes can enter, and this can sometimes be quite tricky                          of the hybridization at a certain temperature is determined
(Keeling, 2019; Ku and Sebé-Pedrós, 2019).                                             by the concentration of formamide in the hybridization buffer
   Stringent hybridization and washing conditions are of crucial                       and an appropriate concentration of NaCl in the washing
importance for obtaining the specific binding of probes. They                          buffer (Pernthaler et al., 2004). The standard duration of the
need to be experimentally optimized for each probe. Stringency                         hybridization step (Figure 3, step 6) is 3 h (Not et al., 2002;

Frontiers in Microbiology | www.frontiersin.org                                    8                                           March 2021 | Volume 12 | Article 640066
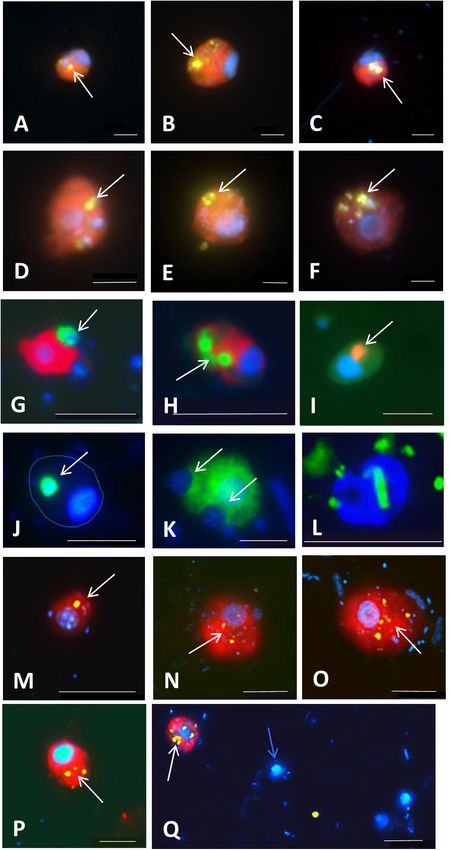
Piwosz et al.                                                                                                                                      CARD-FISH for Protists

  FIGURE 5 | Microphotographs showing food preferences, i.e., bacterivory (A–H,M,P–T), predatory (I,J), or omnivory (M,N,P) of freshwater flagellates from different
  eutrophic ponds (A–D,I–T) and from mesotrophic Římov reservoir (E–H) in Czech Republic. Shown are overlay Z-stack images (following the methods described in
  Šimek et al., 2019) of flagellates targeted by probes [A–D,I–T: FITC-stained flagellates (yellow); E–H: Alexa546-stained flagellates (red)], DAPI-stained bacteria and
  flagellate nuclei (blue) and autofluorescence of algae and cyanobacteria (red). (A–D) Heterotrophic lineage of Cryptophyta (probe Cry1-652) with ingested bacteria;
  (E–H) other Cryptophyta (general probe Crypto B) with ingested bacteria; (I,J) Cercozoans of Novel Clade 7 (probe Cerc-193) with ingested flagellate prey or their
  cell remains; (K,L) other Cercozoa (general probe Cerc-02) with ingested cyanobacterial cells of Microcystis (K) or bacteria (L); (M–P) Katablepharidacea (probe
  Kat-1452) with ingested algal (M,N) or bacterial prey (P); (Q–T) kinetoplastids (probe Kin516) with visible DAPI-stained nucleus (n), kinetoplast (k), and ingested
  bacteria. White, blue, and red arrows highlight examples of ingested bacteria (A–H,L,M,P,Q,T), flagellate prey (I,J) and algae and cyanobacteria (K,M,N,T),
  respectively, visible in the grazer food vacuoles. Two arrows (images M,N,T) point to parallel appearance of algae and bacteria in food vacuoles of the same flagellate
  cells, thus indicating omnivory of the grazer. The scale bar shows length of 5 µm in all images except for (F,I,J,M), with the scale bar showing 10 µm.

Frontiers in Microbiology | www.frontiersin.org                                     9                                            March 2021 | Volume 12 | Article 640066
Piwosz et al.                                                                                                                                 CARD-FISH for Protists

                                                                                            Piwosz and Pernthaler, 2010), but its prolongation (even up to
                                                                                            4 days) may improve the signal intensity from less active cells
                                                                                            (Lim et al., 1993; Amann and Fuchs, 2008; Morgan-Smith et al.,
                                                                                            2013; Mukherjee et al., 2015). The washing step (Figure 3, step
                                                                                            7) is done at temperature 2◦ C higher than the hybridization. It
                                                                                            removes probes weakly hybridized to non-target cells and also
                                                                                            non-hybridized probes, so they do not produce false positive
                                                                                            signals during the CARD step.
                                                                                                Catalyzed reporter deposition or tyramide signal amplification
                                                                                            (TSA; Figure 3, step 8) enhances the fluorescent signals by
                                                                                            deposition of a large number of fluorescently labeled tyramines
                                                                                            (Bobrow et al., 1991). There is a wide array of available dyes,
                                                                                            but those emitting green light (emission maximum at 520 nm),
                                                                                            such as Fluorescein isothiocyanate (FITC) or Alexa488, are the
                                                                                            most commonly used (see Figures 4–6). In double CARD-
                                                                                            FISH, two probes targeting two different microbial populations
                                                                                            are used subsequently in the same filter section on the same
                                                                                            microscopic slide. The choice of fluorescent colors is quite critical
                                                                                            for visualization and differentiation of targeted cells with this
                                                                                            approach. We advise, based on our experience, to use brighter
                                                                                            green or yellow colors for detection of prey in the food vacuoles,
                                                                                            and darker blue, orange, or red colors for HF or blue or far
                                                                                            red for MF that show chlorophyll autofluorescence in orange
                                                                                            and red. The available dyes are discussed in Supplementary
                                                                                            File 2. Examples of the well distinguishable color combinations
                                                                                            are shown in Figures 6A–H.
                                                                                                Hybridized and dried filter pieces need to be counterstained
                                                                                            with a DNA dye, such as commonly used DAPI stain (Coleman,
                                                                                            1980; Porter and Feig, 1980), which can be added to a
                                                                                            glycerol containing anti-fading mixture like Vectashield (Vector
                                                                                            laboratories), used to mount the samples on microscopic slides
                                                                                            and to reduce the signal fading (Figure 3, step 9). Hybridized
                                                                                            protistan cells are counted as percent of all protists detected with
                                                                                            a general nucleic acid stain. Independent total NF counts are
                                                                                            required to estimate absolute numbers of the targeted HF and
  FIGURE 6 | Examples of application of double CARD-FISH (A–H), food                        MF lineages. However, the absolute number of protists should
  vacuole content observations (I–K), or a combination of CARD-FISH and
  uptake of fluorescently labeled bacteria (FLB; L–Q) to examine food
                                                                                            be assessed from counts obtained with general eukaryotic probes,
  preferences or bacterial uptake rates in freshwater and brackish                          because nuclei of small protists can be mistaken for prokaryote
  environments. Double CARD-FISH of (A–C) aplastidic CRY1 lineage of                        cells (Beardsley et al., 2005; Pernice et al., 2014). Moreover,
  Cryptophyta [probe Cry1-652, (red)]; and (D–F) aplastidic Cryptophyta [probe              the contribution of specific lineages to higher taxonomic levels
  Crypto B, (red)] feeding on various Betaproteobacteria (yellow) (Grujčić et al.,
                                                                                            can be estimated as well. Counting precision (expressed as
  2018); (G) Cercozoa [probe Bal_02, (red)] feeding on other Cercozoa [probe
  Bal_01, (green)]; (H) Cercozoa [probe Bal_02, (red)] feeding on
                                                                                            95% confidence limits) depends on the number of counted
  prymnesiophytes [probe Prym02, (green)]; (I) Cercozoa [probe Bal_02, (red)]               hybridized cells and the number of counted fields of view. It
  grazed by an unidentified protist; (J) MAST-6 stramenopile [probe MAST-6,                 is ±20% for 100 counted cells, 10% for 400 cells, and 6%
  (green)] grazed by an unidentified protist (cell shape indicated with blue line);         for thousand cells (Edler and Elbrächter, 2010). However, such
  (K) MAST-6 stramenopile [probe MAST-6, (green)] engulfing algae. Each
                                                                                            numbers may be impossible to reach for rare taxa, and thus, we
  image is an overlay of three pictures of the same flagellate cell observed under
  ultraviolet excitation (showing the blue nucleus after DAPI-staining), green light        recommend counting 500–1000 cells counterstained with a DNA
  excitation (red color corresponding to different flagellate groups labeled with           dye. Alternatively, percent proportion of counted cells hybridized
  Alexa546 using CARD-FISH) and blue light excitation (yellow-green color                   with a specific probe can be plotted against the number of
  corresponding to ingested Betaproteobacteria labeled with FITC using                      counted DNA-stained cells until the plateau is reached, indicating
  CARD-FISH and green color corresponding to ingested protists labeled with
                                                                                            the sufficient counting effort. Flow cytometry or automatic
  Alexa488 using CARD-FISH). Grazing on FLB [yellow] by (L) Cercozoa [probe
  Bal_01, labeled with Alexa350 (blue)]; and aplastidic cryptophytes [probe                 image acquisition microscopy may allow for statistically robust
  Crypto B, (red)] (N–Q) and CRY1 lineage of Cryptophyta [probe Cry1-652,                   abundance estimates of rare lineages (Simon et al., 1995; Biegala
  (red)] (M)]. White arrows indicate ingested prokaryotes and eukaryotes                    et al., 2003; Mangot et al., 2018).
  targeted by CARD-FISH probes or FLB in food vacuoles of grazer cells. A blue                  Unsuccessful CARD-FISH procedure can be identified by
  arrow indicates a non-target flagellate cell close to a Cry1-positive cell with
  ingested FLB (Q). Scale bar = 2 µm (A–F), 10 µm (G–L), and 5 µm (M–Q).
                                                                                            weak or lack of signals, high background fluorescence, and
                                                                                            unspecific probe binding that can be recognized by diverse shape

Frontiers in Microbiology | www.frontiersin.org                                        10                                     March 2021 | Volume 12 | Article 640066
Piwosz et al. CARD-FISH for Protists
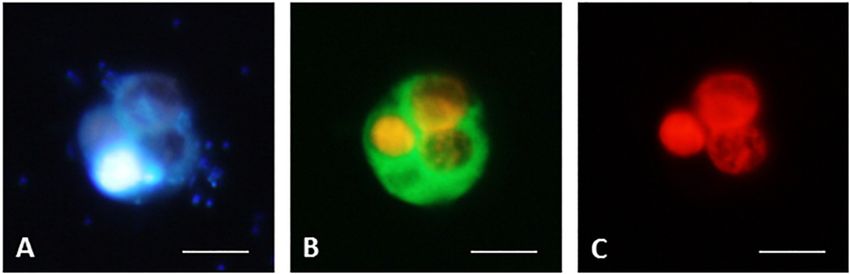
FIGURE 7 | CARD-FISH preparations of ciliate B. planctonicum with the probe Bal-651 (Bühler, 2020). Pictures taken with an epifluorescence microscope using
appropriate filter setting. (A) Cells stained with DAPI; (B) Cells at blue light excitation to visualize the green hybridization signal. Orange color comes from
autofluorescence of ingested Cryptomonas sp.; (C) Cells excited with green light to show autofluorescence of ingested Cryptomonas sp. Scale bars = 10 µm.
and size variability of hybridized cells, especially in case of very by CARD-FISH and double CARD-FISH is laborious, these
specific probes. For detailed troubleshooting guide, please refer single-cell approaches have revealed exciting discoveries on the
to the Supplementary File 5. importance of various flagellate taxa in marine and freshwater
pelagic food webs. They have provided completely new insights
Limitations of the Method into the life strategies of so far unknown or morphologically
As we show below, CARD-FISH is a powerful tool to unveil indistinguishable protists and will help to elucidate yet unknown
ecological traits of poorly studied and uncultured protists in their trophic interactions of uncultured protists (Figures 4–6) that
natural environments at a single cell level. However, as every form highly complex microbial food webs. Below, we shortly
method, it has its limitations. First, sample fixation might results summarize some key discoveries enabled by these techniques.
in a certain cell loss, and fixatives do not have uniform efficiency
for all protists (Jeuck et al., 2017). Moreover, CARD-FISH Novel HF and MF in Marine Environments
accuracy may be compromised by imperfect probe coverage and One of the first surprises upon applying FISH to marine samples
specificity, differences in the amount and activity of endogenous was that the described species of bacterivorous HF were not
peroxidases between phylogenetic groups and environmental abundant in natural environments. For instance, the genus
samples, and poor detection of low abundance or inactive Paraphysomonas was found to contribute below 1% to the total
community members, and difficulties in counting aggregated abundance of HF (Lim et al., 1999). In contrast, novel lineages
cells (Pernthaler et al., 2004; Amann and Fuchs, 2008). Moreover, of marine Stramenopiles (MAST), especially nanoplanktonic
tyramides sometimes bind unspecifically to cell walls of some MAST-1 (cell size: 4–7 µm) and picoplanktonic MAST-4 (cell
protists, such as dinoflagellates or diatoms, making microscopic size: 2–3 µm), turned out to be ubiquitous in open oceans,
evaluation more challenging. Autofluorescence of chloroplasts contributing together to about 20% of all HF (Massana et al.,
might also interfere with probe signals depending on used 2006b; Mangot et al., 2018), and exhibiting growth rates between
fluorochromes and filter sets of the epifluorescence microscope 0.4 and 0.8 per day (Massana et al., 2006a). Two morphotypes
used for quantification (Figure 7, Bühler, 2020). However, of the MAST-6 lineage were observed in the brackish Baltic
appropriate fluorochrome combinations considerably improve Sea: larger (approximately 15 µm, Figure 4E) that formed a
distinction of such objects as exemplified in Figures 4B,D, 5K,L. conspicuous peak when the salinity dropped to 6.2, and smaller
Other parameters may reduce the fluorescence of target cells, in (around 6 µm, Figure 6F) that dominated at salinities > 7
particular a low rRNA content linked to low growth rate (Lim (Piwosz and Pernthaler, 2010). The MAST-2 lineage (cell size
et al., 1993; Amann et al., 1995; Simon et al., 1995; Head et al., 4–5 µm) was found to be more abundant in first-year sea-ice (2–
1998). Nevertheless, most of these issues can be addressed as 10%, Piwosz et al., 2013) than in pelagial (0.3%, Massana et al.,
described in Supplementary Files 1, 5. 2006b). In contrast, cercozoans of the genus Cryothecomonas
(cell size 2.5–29 µm) were also found in the sea-ice, but in
NEW INSIGHTS INTO MORPHOLOGY, rather low abundances (Thaler and Lovejoy, 2012). Another
lineages of Cercozoa from Novel Clade 2 (Bass and Cavalier-
PHYSIOLOGY, AND ECOLOGY OF Smith, 2004) turned out to be rare in the brackish Baltic Sea
UNCULTURED AND LITTLE KNOWN (Figures 6G–L), but they exhibited rapid growth rates of >1 per
PROTISTS FROM CARD-FISH AND day in experimental incubations (Piwosz and Pernthaler, 2011).
DOUBLE CARD-FISH APPLICATIONS Another unexpected discovery was that parasitic HF may
appear in high concentrations in pelagic environments. Members
Understanding the in situ distribution and seasonal dynamics of the order Syndiniales have been shown to control blooms of
of individual protistan groups is important for obtaining a toxic dinoflagellates that form red-tides (Chambouvet et al., 2008,
clear picture of the microbial processes in any ecosystem (Sherr 2011). Free-living dinospores or multicellular trophonts were also
et al., 2007; Kim et al., 2014). Although analyses of samples found in the Baltic Sea (Piwosz and Pernthaler, 2010), where they
Frontiers in Microbiology | www.frontiersin.org 11 March 2021 | Volume 12 | Article 640066Piwosz et al. CARD-FISH for Protists
TABLE 1 | List of oligonucleotide probes developed for protistan lineages, hybridization conditions, and overall recommendation for usage based in their current
coverage and specificity (see Supplementary Table 1 for details and additional almost 100 probes for more specific protistan lineages).
Probe name References Target group Sequence (50 -30 ) % form. Temp. (◦ C) Rating
EUK1209R (EUK1195) Giovannoni et al., Eukaryota GGGCATCACAGACCTG 30–40 35 Very good
1988
EUK516 Amann et al., 1990 Eukaryota ACCAGACTTGCCCTCC 20 35 Very good
EUK309 Sogin and Eukaryota TCAGGCTCCCTCTCCGG 0 40 Good
Gunderson, 1987
Non-_Bal Piwosz and No Eukaryota CAAGGTATTAACCCGTGGGATT 25 35 Very good
Pernthaler, 2010
CON1 Rice et al., 1997a No Eukaryota GAGCCTGAGAAACGGC 0 45 Very good
CON2 Rice et al., 1997a No Eukaryota GTAATTCCAGCTCCAAT 0 45 Very good
CON3 Rice et al., 1997b No Eukaryota CTGCCCTTTGTACACAC 0 45 Very good
KIN 516 Bochdansky and Kinetoplastea ACCAGACTTGTCCTCC 40/55 35 Good
Huang, 2010
EUK516 Comp. Bochdansky and Competitor for ACCAGACTTGCCCTCC 40/55 35 Very good
Huang, 2010 KIN516
14F Edgcomb et al., Kinetoplastea CUGCCAGUAGUCAUAUAUGCUUGUUUCAAGGA 20 46 Bad
2011
Rev 14F Edgcomb et al., Competitor for 14F UCCUUGAAACAAGCAUAUAUGACUACUGGCAG 20 46 Bad
2011
Diplo516 Bochdansky et al., Diplonemea ACCAGACTTGTCCACC 40 35 Very good
2017
DiploR1792 Morgan-Smith Diplonemea GCATTCCTCATTCAAGGA 30 35 Good
et al., 2013
PRYM01 Lange et al., 1996 Haptophyta TCGTAAACGGTCCCTACA 10 46 Bad
PRYM02 Simon et al., 2000 Haptophyta GGAATACGAGTGCCCCTGAC 40 35 Very good
S-C-DINO-1404 John et al., 2003 Dinoflagellata and CCTCAAACTTCCTTGCRTTA 20 55 Bad
related lineages
SYN-I-1161 Thiele et al., 2014 Syndiniales Group I TCCTCGCGTTAGACACGC 20 46 Bad
SYN-II-675 Thiele et al., 2014 Syndiniales Group II CACCTCTGACGCGTTAAT 20 46 Good
Alv01 Chambouvet et al., Syndiniales Group II GCCTGCCGTGAACACTCT 40 42 Good
2008
CERC_02 Mangot et al., 2009 Cercozoa AATACGAGCACCCCCAAC 40 35 Bad
LabY1336 Stokes et al., 2002 Labyrinthulomycetes AACCCGAAATGTCCCTCTAAGAAG 40 35 Bad
CHLO01 Simon et al., 1995 Chlorophyta GCTCCACGCCTGGTGGTG 25 46 Bad
NCHLO01 Simon et al., 1995 Competitor for GCTCCACTCCTGGTGGTG 25 46 Bad
CHLO01
CHLO02 Simon et al., 2000 Chlorophyta CTTCGAGCCCCCAACTTT 40 35 Bad
CRYPT 13 Lepère et al., 2008 Cryptophyceae CGAAATATAAACGGCCCCAAC 40 35 Bad
(nuclear)
Crypto B Metfies and Medlin, Cryptophyceae ACGGCCCCAACTGTCCCT 50 46 Good
2007 (nuclear) and
SA1-3C06
CHRYSO_01 Mangot et al., 2009 Chrysophyceae TTTCGGACAAGGAAGACTCG 40 35 Bad
The overall rating of probes is based on coverage of the target group and number of non-target hits in the guide tree of SILVA database RefNR 138.1 (very good: > 80%
coverage, no/almost no non-target hits; good: > 50% coverage, almost no non-target hits; bad: < 50% coverage and/or high number of non-target hits). Taxonomy and
nomenclature is based on SILVA classification 138.1. % form – percentage of formamide in the hybridization buffer at the specified temperature (Temp.).
may infect a bloom forming dinoflagellate Heterocapsa triquetra where seven groups contributed to 50–70% of all eukaryotes:
(Figures 4G,H), and in the first-year sea-ice (Piwosz et al., 2013). kinetoplastids (7–20%), labyrinthulomycetes (2–25%), fungi (2–
Syndiniales are more abundant in coastal waters, where they can 25%), diplonemids (1–3%), Syndiniales group II (2–8%), MAST-4
contribute up to 40% of all eukaryotes and infect up to 25% of lineage (1–6%), and an unidentified HF with a peculiar nuclear
the target dinoflagellate species (Siano et al., 2011). In contrast, morphology (Edgcomb et al., 2011; Morgan-Smith et al., 2011,
parasitic fungi were shown to be important nanophytoplankton 2013). Fungi and labyrinthulomycetes seem to be more abundant
parasites in the open ocean, where they can contribute up to 14% on marine snow particles (Bochdansky et al., 2017) and in oxygen
of abundance of all eukaryotes and infect up to 12% of haptophyte minimum zones (Morgan-Smith et al., 2013). In contrast to HF
and 6% of chrysophyte algae (Lepère et al., 2016). from the sun lit ocean, deep sea HF, especially those living on
Completely different eukaryotic communities were found marine snow, might be saprotrophic rather than bacterivorous
using CARD-FISH in the deep sea below 1000 m depth, (Bochdansky et al., 2017).
Frontiers in Microbiology | www.frontiersin.org 12 March 2021 | Volume 12 | Article 640066Piwosz et al. CARD-FISH for Protists
The signal amplification was of crucial importance for et al., 1997a; Boenigk and Arndt, 2002; Matz et al., 2002;
detection of algae and MF showing strong autofluorescence from Grossmann et al., 2016), but tiny aplastidic cryptophytes and
chlorophylls that may mask weak signals of monolabeled probes especially the cryptophyte CRY1 lineage therein (Piwosz et al.,
(Medlin and Strieben, 2010) (Figures 4A,B,D). Chlorophytes 2016; Shiratori and Ishida, 2016; Grujčić et al., 2018; Šimek
(Figure 4A), predominantly genus Micromonas, turned out to et al., 2020). Concerning their typical cell size between 3 and
dominate the abundance of picophytoplankton in coastal oceans 6 µm (Figures 5A–D), CRY1 were initially suggested to be
and seas, with contributions exceeding 80% (Not et al., 2005, bacterivores (Piwosz et al., 2016), which was later confirmed with
2008; Thiele et al., 2014; Unrein et al., 2014; Piwosz et al., 2015; observations of visibly ingested bacteria (Figures 5A–D, 6A–
Cabello et al., 2016; Piwosz, 2019). Their contribution was below C) in their food vacuoles (Grujčić et al., 2018; Šimek et al.,
40% in other marine habitats, such as surface waters or deep 2020). In different seasonal aspects of a freshwater reservoir, the
chlorophyll maxima in the open oceans, Arctic fjords or the first- aplastidic cryptophytes and cryptophyte CRY1 lineage accounted
year sea-ice (Not et al., 2008; Piwosz et al., 2013, 2015). Larger for, on average, ca. 50% and 20–25% of total HF numbers,
haptophytes (cell sizes between 2–6 µm, Cabello et al., 2016; respectively (Grujčić et al., 2018; Šimek et al., 2020). Moreover,
Piwosz, 2019) are the second most abundant group in the marine the application of FLBs in combination with CARD-FISH
waters, with contributions to nanophytoplankton abundance of clearly demonstrated their high bacterial consumption rates
about 15% in the open sea, up to 30% in the brackish Baltic Sea, (Figures 6M–Q). In contrast, plastidic cryptophytes (Figure 4D)
and above 35% in the polar regions (Not et al., 2005, 2008; Piwosz, are important members of spring phytoplankton blooms, where
2019). Genus Pheocystis and family Pavlovales substantially they can account for up to 15% of all eukaryotes (Mangot et al.,
contribute to haptophyte numbers in the open ocean (Thiele 2009), but they mostly do not show any uptake of prokaryotes.
et al., 2014; Piwosz et al., 2015) and sea ice (Piwosz et al., 2013), Kinetoplastids are another surprisingly common and
while genera of Haptolina and Chrysochromulina were abundant abundant lineage of HF in freshwaters. These flagellates are
in the brackish Baltic Sea (Piwosz, 2019). Pelagophyceae were known as poor swimmers, being associated with detritus (Caron
found to be typically cells < 3 µm and contributing more to the et al., 1982; Zubkov and Sleigh, 2000), where they glide around
deep chlorophyll maximum (about 24%) than in surface waters the particles to feed on surface-associated bacteria (Boenigk
(below 10%, Cabello et al., 2016), but were of little importance and Arndt, 2000). They were known to be ubiquitous in aquatic
in the brackish waters (Piwosz, 2019). In contrast, cryptophytes ecosystems (von der Heyden and Cavalier-Smith, 2005; Simpson
(Figure 4D) seem to be more important in coastal brackish waters et al., 2006), and they were even detected using light microscopy
(Piwosz et al., 2016; Piwosz, 2019) or in sea-ice (Piwosz et al., (Brandt and Sleigh, 2000; Weitere and Arndt, 2003). However,
2013) than in open ocean (Piwosz et al., 2015). A set of probes only upon application of CARD-FISH and kinetoplastid-specific
targeting photosynthetic cryptophyte clades has been developed probes (Table 1 and Supplementary Table 1), these flagellates
and optimized for CARD-FISH (Table 1 and Supplementary were found to be widely distributed in freshwater lakes and,
Table 1, Metfies and Medlin, 2007; Medlin and Schmidt, 2010). similarly to their deep ocean counterparts, to dominate in
However, the most abundant cryptophytes are members of the deep oxygenated hypolimnion waters, especially in summer
heterotrophic CRY1 lineage (Figures 5A–D), at least in the when their contribution to total abundance of protists can
coastal waters of the Baltic Sea and freshwater habitats (Piwosz reach up to 54% (Mukherjee et al., 2015, 2019). The timing of
et al., 2016; Shiratori and Ishida, 2016; Grujčić et al., 2018; Piwosz, kinetoplastids maxima in the hypolimnetic waters was linked to
2019; Šimek et al., 2020). Finally, bolidophytes and pedinellids the termination of phytoplankton blooms and high numbers of
seem to be rare (Piwosz et al. CARD-FISH for Protists
among the most dominant group of protists in the world oceans be important bacterivores, with ingestion rates > 2.8 bacteria
(Biard et al., 2016), but the abundance and distribution patterns MF−1 h−1 and contributing even more than 25% to total
of small cercozoans are less understood (Bass and Cavalier-Smith, protistan bacterivory (Unrein et al., 2014).
2004). Application of CARD-FISH revealed that cercozoans are Furthermore, CARD-FISH enabled to reveal how bacterial
consistently present in freshwater lakes, contributing around food characteristics modulate growth and community dynamics
11–12% of total protists (Mangot et al., 2009; Lepère et al., of major bacterivores and consequently carbon flow rates to
2010), and they can ingest even cyanobacterial Microcystis cells higher trophic levels. Monitoring abundance of specific HF
(Figure 5K). Cercozoans of Novel Clade 7 (Bass and Cavalier- lineages using CARD-FISH has evidenced that their growth
Smith, 2004) can account for up to 28% of the total community response differs depending on a bacterioplankton species
in food-web manipulation experiments amended with bacterial available as a main food source (Grujčić et al., 2018; Šimek et al.,
prey, which induced rapid growth of small HF and in turn also the 2018, 2020). For instance, compositional shifts in bacterivorous
growth of the predatory cercozoans with well visible small prey HF communities tracked by CARD-FISH (Grujčić et al., 2018)
protists in their food vacuoles (Šimek et al., 2020) (Figures 5I,J). cascaded through the food chain even to the level of predatory
Chlorophytes, cryptophytes, and haptophytes have also been and omnivorous HF and small ciliates (Šimek et al., 2020).
reported to be consistently present throughout the year in The double CARD-FISH technique provides even higher
freshwater lakes, mainly in the epilimnion waters, where their resolution by allowing simultaneous phylogenetic identification
contribution to total eukaryotes can be > 50% (Mangot of both predator and prey (Massana et al., 2009; Piwosz and
et al., 2009; Lepère et al., 2010). Autotrophic chlorophytes and Pernthaler, 2011; Grujčić et al., 2018; Šimek et al., 2020), thus
haptophytes are considered as typical components of summer ultimately opening the “black box” of microbial food webs
phytoplankton blooms in various lakes (Sommer et al., 1986, and addressing the intriguing questions “who eats whom” (see
2012). Chrysophytes are another dominant group of freshwater examples in Figure 6). Ingested bacteria can be identified
protists (del Campo and Massana, 2011) and are consistently directly in food vacuoles (Figures 5, 6), providing information
present year round in freshwater lakes contributing up to 35% on positive or negative selections for particular bacterial and
of total CARD-FISH positive eukaryotes (Mangot et al., 2009). archaeal phylotypes (Jezbera et al., 2005, 2006; Massana et al.,
Parasitic perkinsozoans are regularly reported from freshwater 2009; Anderson et al., 2012; Gerea et al., 2013; Šimek et al., 2014,
lakes (Lepère et al., 2008, 2010; Mangot et al., 2011; Mukherjee 2020; Ballen-Segura et al., 2017).
et al., 2017). Their abundance peaks during summer, where they Finally, newly designed CARD-FISH probes also shed light
can account for up to 31% of the total eukaryotic community on the feeding modes of medium sized (5–20 µm) HF. Trophic
(Mangot et al., 2009). Perkinsea have been recently shown to relationships between bacterivorous cercozoans of the Novel
infect green algae of the genus Sphaerocystis, and cells attached Clade 2 (Bass and Cavalier-Smith, 2004) targeted by probe
to filamentous cyanobacteria were also observed (Jobard et al., Cerc_Bal01 (Figure 6L), larger, omnivorous predator also of
2019). These parasites made up to 24% of all protists in the the Novel Clade 2 targeted by probe Cerc_Bal02 (Figure 6G),
hypolimnion of a reservoir, where they were found attached to and heterotrophic dinoflagellates (Figure 6I) were deduced from
unidentified protistan cells and lake snow (Figure 4I). experimental manipulations of a natural plankton community
from coastal waters of the brackish Baltic Sea (Piwosz and
Pernthaler, 2011). Similarly, experiments with a freshwater
Grazing Preferences and Grazing Rates plankton community led to enrichments of 7–12 µm large
of Protistan Lineages HF affiliated with cercozoan Novel Clade 7 (Figures 5I,J)
Newly designed probes, targeting in situ morphologically (Bass and Cavalier-Smith, 2004) and uncultured kathablepharids
indistinguishable HF and MF, have brought invaluable new (Figures 5M–P) that grazed on small aplastidic bacterivorous
information on absolute numbers of particular protistan lineages cryptophytes or small algae rather than bacteria (Šimek et al.,
with the possibility to inspect also their food vacuole contents, 2020). Time-course data of different HF lineages also allow
thus unveiling their feeding modes (see examples in Figures 4–7) for calculating lineage-specific growth rates, typically ranging
and examining grazing and growth rates of specific bacterivorous from 1 to 1.8 d−1 for bacterivorous cryptophytes (Figures 5E–
HF and MF. The method to estimate bacterivory based on FLB H), their CRY1 lineage (Figures 5A–D), and kinetoplastids
uptake rate during short-term incubations (Sherr et al., 1987) (Figures 5Q–T), but also for larger omnivorous and predatory
can be combined with identification of the grazers via CARD- kathablepharids (Figures 5M–P) and Cercozoa (Figures 5I,J)
FISH using the protocol described in Supplementary Files 2– (Šimek et al., 2020). Similarly, consumption rates on bacteria or
4. This approach has unveiled that heterotrophic members of probe-targeted lineages of prey protists can be estimated (Šimek
Cryptophyceae and its CRY1 lineage are important freshwater et al., 2020). For instance, a comparison of cell biovolumes of
pelagic bacterivores (Grujčić et al., 2018; Šimek et al., 2020) prey cells from the CRY1 lineage (Figures 5A–D) with their
(Figures 5A–H, 6A–F,M–Q). In marine waters, FISH combined cercozoan predator from the Novel Clade 7 (Figures 5I,J),
with FLBs enabled detecting that HF of the MAST-1C lineage and also taking into account the growth rate of the predatory
have higher grazing rates (∼4 bacteria HF−1 h−1 ) than members cercozoans (doubling time of 10–20 h) indicated that these
of the MAST-4 lineage (You can also read