Linking marine phytoplankton emissions, meteorological processes, and downwind particle properties with FLEXPART - ACP
←
→
Page content transcription
If your browser does not render page correctly, please read the page content below
Atmos. Chem. Phys., 21, 831–851, 2021
https://doi.org/10.5194/acp-21-831-2021
© Author(s) 2021. This work is distributed under
the Creative Commons Attribution 4.0 License.

Linking marine phytoplankton emissions, meteorological processes,
and downwind particle properties with FLEXPART
Kevin J. Sanchez1,2 , Bo Zhang3 , Hongyu Liu3 , Georges Saliba4 , Chia-Li Chen4 , Savannah L. Lewis4 ,
Lynn M. Russell4 , Michael A. Shook2 , Ewan C. Crosbie2,5 , Luke D. Ziemba2 , Matthew D. Brown2,5 ,
Taylor J. Shingler2 , Claire E. Robinson2,5 , Elizabeth B. Wiggins1,2 , Kenneth L. Thornhill2,5 , Edward L. Winstead2,5 ,
Carolyn Jordan2,3 , Patricia K. Quinn6 , Timothy S. Bates6,7 , Jack Porter9 , Thomas G. Bell8,9 , Eric S. Saltzman9 ,
Michael J. Behrenfeld10 , and Richard H. Moore2
1 NASA    Postdoctoral Program, Universities Space Research Association, Columbia, MD, USA
2 NASA    Langley Research Center, Hampton, VA, USA
3 National Institute of Aerospace, Hampton, VA, USA
4 Scripps Institution of Oceanography, University of California San Diego, La Jolla, CA, USA
5 Science Systems and Applications, Inc., Hampton, VA, USA
6 Pacific Marine Environmental Laboratory, NOAA, Seattle, WA, USA
7 Joint Institute for the Study of the Atmosphere and Ocean (JISAO), University of Washington, Seattle, WA, USA
8 Plymouth Marine Laboratory, Prospect Place, Plymouth, United Kingdom
9 The Department of Earth System Science, University of California, Irvine, CA, USA
10 Department of Botany and Plant Pathology, Oregon State University, Corvallis, OR, USA

Correspondence: Kevin J. Sanchez (kevin.j.sanchez@nasa.gov) and Richard H. Moore (richard.h.moore@nasa.gov)

Received: 11 July 2020 – Discussion started: 17 September 2020
Revised: 13 November 2020 – Accepted: 15 November 2020 – Published: 20 January 2021

Abstract. Marine biogenic particle contributions to at-         lagged in time. In particular, the marine non-refractory or-
mospheric aerosol concentrations are not well understood        ganic aerosol mass correlates with modeled marine net pri-
though they are important for determining cloud optical         mary production when weighted by 5 d air mass trajectory
and cloud-nucleating properties. Here we examine the rela-      residence time (r = 0.62). This result indicates that non-
tionship between marine aerosol measurements (with satel-       refractory organic aerosol mass is influenced by biogenic
lites and model fields of ocean biology) and meteorologi-       volatile organic compound (VOC) emissions that are typ-
cal variables during the North Atlantic Aerosols and Marine     ically produced through bacterial degradation of dissolved
Ecosystems Study (NAAMES). NAAMES consisted of four             organic matter, zooplankton grazing on marine phytoplank-
field campaigns between November 2015 and April 2018            ton, and as a by-product of photosynthesis by phytoplank-
that aligned with the four major phases of the annual phy-      ton stocks during advection into the region. This is further
toplankton bloom cycle. The FLEXible PARTicle (FLEX-            supported by the correlation of non-refractory organic mass
PART) Lagrangian particle dispersion model is used to spa-      with 2 d residence-time-weighted chlorophyll a (r = 0.39),
tiotemporally connect these variables to ship-based aerosol     a proxy for phytoplankton abundance, and 5 d residence-
and dimethyl sulfide (DMS) observations. We find that cor-      time-weighted downward shortwave forcing (r = 0.58), a
relations between some aerosol measurements with satellite-     requirement for photosynthesis. In contrast, DMS (formed
measured and modeled variables increase with increasing         through biological processes in the seawater) and primary
trajectory length, indicating that biological and meteorolog-   marine aerosol (PMA) concentrations showed better corre-
ical processes over the air mass history are influential for    lations with explanatory biological and meteorological vari-
measured particle properties and that using only spatially      ables weighted with shorter air mass residence times, which
coincident data would miss correlative connections that are     reflects their localized origin as primary emissions. Aerosol

Published by Copernicus Publications on behalf of the European Geosciences Union.
832                                        K. J. Sanchez et al.: Linking marine phytoplankton emissions with FLEXPART

submicron number and mass negatively correlate with sea           in the winter months, increasing nutrients at the surface and
surface wind speed. The negative correlation is attributed to     decoupling phytoplankton from predators, followed by in-
enhanced PMA concentrations under higher wind speed con-          creased sunlight in the spring, enhancing photosynthetic pri-
ditions. We hypothesized that the elevated total particle sur-    mary productivity; together they produce the annually occur-
face area associated with high PMA concentrations leads to        ring North Atlantic phytoplankton bloom (Behrenfeld, 2010;
enhanced rates of condensation of VOC oxidation products          Behrenfeld and Boss, 2018; Boss and Behrenfeld, 2010). The
onto PMA. Given the high deposition velocity of PMA rel-          bloom ends when phytoplankton division rates stop increas-
ative to submicron aerosol, PMA can limit the accumulation        ing (due to depletion of nutrients or an annual maximum in
of secondary aerosol mass. This study provides observational      mixed layer light intensity) and are matched by loss rates
evidence for connections between marine aerosols and un-          (Behrenfeld and Boss, 2018). When bloom termination is as-
derlying ocean biology through complex secondary forma-           sociated with nutrient exhaustion, mixed later depths may
tion processes, emphasizing the need to consider air mass         continue to shoal into summer (i.e., mixed layer light lev-
history in future analyses.                                       els are still increasing), but phytoplankton biomass may de-
                                                                  crease due to slowing division rates and excessive grazing
                                                                  (Behrenfeld and Boss, 2018).
                                                                     Analysis of phytoplankton taxonomy and its seasonal vari-
1   Introduction                                                  ability in the NAAMES region is presented by Bolaños et
                                                                  al. (2020). Bolaños et al. (2020) show that cyanobacteria
Marine environments are sensitive to aerosol particle loading     dominated subpolar waters during the winter and were a sig-
because particles can act as cloud condensation nuclei (CCN)      nificant fraction in the subtropics, with taxa varying by lat-
on which cloud droplets form. The number concentration            itude. In addition, prasinophyta accounted for a significant
of cloud droplets can influence cloud optical properties and      contribution of subtropical species, with stramenopiles rep-
therefore affect the impact of clouds on climate (Leahy et al.,   resenting less than 30 % of subtropical communities. Spring
2012; Platnick and Twomey, 1994; Turner et al., 2007; War-        communities had significantly more diverse communities
ren et al., 1988). Measurements over the ocean are scarce and     and significantly less cyanobacteria (< 10 %) relative to the
have historically been concentrated over relatively few areas     winter, with the exception of one station. Prasinophyta dom-
for short time periods aligning with episodic intensive ship or   inated the spring phytoplankton composition, though taxo-
aircraft campaigns. Satellite measurements are crucial to fill-   nomic compositions differed from the winter period and be-
ing this void in marine boundary layer (MBL) measurements,        tween the subpolar and subtropical regions. Typically, di-
but satellite optical measurements of particles are dispropor-    atoms are assumed to be the dominant phytoplankton species
tionally weighted by the largest optically active (> 300 nm       in blooms. However, diatoms only represent 10 %–40 % of
diameter) particles (Hasekamp et al., 2019). An unresolved        phytoplankton biomass in the spring bloom surveyed dur-
challenge is to relate these remote sensing measurements to       ing NAAMES. The phytoplankton functional groups present
the particle number, size distribution, and chemical compo-       influence the overall isoprene production rate and therefore
sition that are known to drive variability in cloud properties.   the marine atmospheric aerosol and VOC concentrations.
Since ocean-emitted volatile compounds and particles can          Booge et al. (2016) compiled chlorophyll-normalized iso-
control the number, size, and composition of marine aerosols      prene production rates from the literature to identify dif-
(Brooks and Thornton, 2018), here we use satellite measure-       ferences between phytoplankton species. The chlorophyll-
ments of ocean biomass as a proxy for marine particle prop-       normalized isoprene production rates varied from 4.56–27.6,
erties.                                                           1.4–32.16, and 1.12–28.48 (µmol (g chlorophyll a)−1 d−1 )
   In the absence of advected continental or anthropogenic        for cyanobacteria, prasinophyta, and diatoms, respectively,
pollution, the main source of MBL particles is sea salt           indicating that emissions for isoprene vary significantly with
from primary marine aerosol (PMA), dissolved organic mat-         taxonomy. To further complicate the emission strength of
ter, and marine biogenic volatile organic compound (VOC)          VOCs, emissions can vary by production pathways, such
emissions that can oxidize and condense to form secondary         as photosynthetic by-products, bacterial degradation of dis-
aerosol mass (Bates et al., 1998a; Covert et al., 1992;           solved organic matter, and zooplankton grazing on marine
Frossard et al., 2014b; Murphy et al., 1998; Quinn et al.,        phytoplankton (Gantt et al., 2009; Shaw et al., 2003; Sinha
2000, 2014; Rinaldi et al., 2010; Sievering et al., 1992, 1999;   et al., 2007). One of the most studied biogenically produced
Warren and Seinfeld, 1985). Clear seasonal trends have been       marine aerosol components is non-sea-salt sulfate (nssSO2− 4 )
identified between ocean chlorophyll a, a frequently used         because of its role as a proposed link to a biological ther-
proxy for marine biomass, and marine biogenic particle pro-       mostat on clouds (Charlson et al., 1987; Shaw, 1983), a no-
duction (O’Dowd et al., 1997; Ovadnevaite et al., 2014; Van       tion that has been called into question (Quinn and Bates,
Pinxteren et al., 2017; Saliba et al., 2020; Shaw, 1983). This    2011). Marine nssSO2−   4 is formed from the oxidation prod-
observed seasonal trend results from the marine phytoplank-       ucts of dimethyl sulfide (DMS), a VOC derived from marine
ton cycle, which is driven by ocean mixed layer deepening         ecosystem processes (Yoch, 2002). The phytoplankton cycle

Atmos. Chem. Phys., 21, 831–851, 2021                                               https://doi.org/10.5194/acp-21-831-2021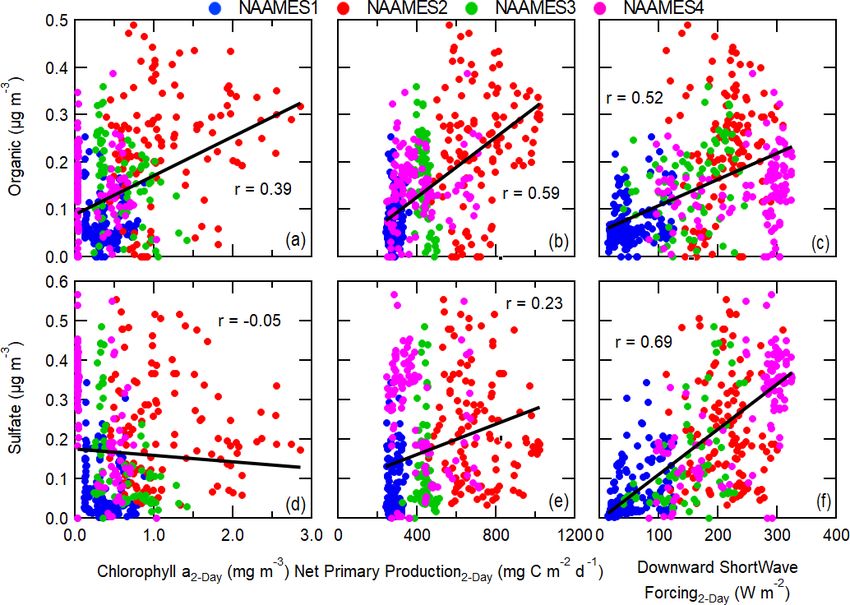
K. J. Sanchez et al.: Linking marine phytoplankton emissions with FLEXPART                                                   833

leads to a seasonal variation in DMS-derived sulfate aerosol       sible source is secondary organic precursors derived from
mass, with higher sulfate concentrations during bloom pe-          photosensitized reactions of dissolved organic matter present
riods (Bates et al., 1998a; Bell et al., 2021; Frossard et al.,    in the sea surface microlayer (Cui et al., 2019). In addi-
2014b; Park et al., 2017; Quinn et al., 2019; Sanchez et al.,      tion, organic aerosol mass has been shown to correlate with
2018). DMS-derived sulfuric acid can either increase the size      black carbon (BC) and other continental tracers indicating
of pre-existing MBL particles by adding to the aerosol sul-        that a large portion of the mass is not of marine origin
fate mass through condensation or nucleate new particles in        (Saliba et al., 2020; Shank et al., 2012). Despite the pres-
regions where the existing particle surface area is deficient.     ence of continental organic mass from long-range transport
While a seasonal relationship between DMS and marine               and primary OM, marine biogenically emitted VOCs are
nssSO2− 4 mass exists, a direct temporal link is often not clear   estimated to account for more than 60 % of organic com-
due to the range of chemical pathways affecting the yields of      pounds over remote oceans (Brüggemann et al., 2018). Sim-
secondary aerosol formation and influence of entrainment on        ilarly, dual carbon isotope analysis of marine aerosol indi-
the formation of new particles (Andreae and Crutzen, 1997;         cates that 80 % of all primary and secondary organic mat-
Ayers et al., 1997; Bates et al., 1998a; Chen and Jang, 2012;      ter is from biogenic origin during non-polluted conditions
Clarke et al., 1999, 2013; O’Connor et al., 2008; Reus et al.,     (Ceburnis et al., 2011). For the North Atlantic Aerosols and
2000; Sanchez et al., 2018; Veres et al., 2020). The formation     Marine Ecosystems Study (NAAMES) campaigns, Saliba et
rate of the DMS oxidation products methane sulfonic acid           al. (2020) noted that measured submicron non-refractory ni-
(MSA), sulfuric acid, and hydroperoxymethyl thioformate is         trate mass (a product of secondary processes) strongly cor-
a function of temperature and availability of atmospheric ox-      related with the non-refractory organic mass, suggesting that
idants (Seinfeld and Pandis, 2006; Veres et al., 2020). Mix-       much of the non-refractory organic mass is secondary. Even
ing of DMS across the MBL inversion, typically driven by           so, there is still a variable portion of marine organic mass
convective or buoyancy-driven transport, can lead to subse-        that is emitted as PMA. PMA is composed mainly of sea
quent entrainment of newly formed particles back into the          salt and organic aerosol mass, and it accounts for a small
MBL. New particle formation is thought to be favored in            number of marine particles but a significant fraction of the
the free troposphere due to the colder temperatures and low        total aerosol mass due to large sizes (0.05–10 µm) (Grythe
pre-existing particle surface area (Clarke, 1993; Clarke et al.,   et al., 2014). PMA formation is driven by wave breaking
2013; Raes et al., 1997; Russell et al., 1998; Sanchez et al.,     and bubble bursting, which are primarily controlled by the
2018; Seinfeld and Pandis, 2006; Thornton et al., 1997; Yue        surface wind speed (de Leeuw et al., 2011; Modini et al.,
and Deepak, 1982). Furthermore, sulfate mass can rapidly           2015; Thorpe, 1992). While PMA typically accounts for a
form onto existing particles through cloud processing, which       low fraction of the marine particle CCN concentration (Fos-
enhances rates of sulfur dioxide (a DMS oxidation prod-            sum et al., 2018; Quinn et al., 2017, 2019), a recent modeling
uct and precursor to sulfuric acid) condensation onto cloud        study validated with observations suggests that PMA parti-
droplets due to the enhanced surface area provided by the          cles regulate secondary particle contributions to CCN over
addition of water. Aqueous-phase oxidation of sulfur dioxide       the remote MBL (Fossum et al., 2020). Enhanced condensa-
results in the formation of low-volatility sulfuric acid, which    tion of water vapor onto these coarse-mode PMA particles
remains in the particle phase when the cloud dissipates. This      can reduce in-cloud supersaturations, preventing the activa-
shifts some particles from the Aitken to accumulation mode         tion of smaller Aitken-mode particles. PMA is short-lived,
and gives rise to the distinctive “Hoppel minimum” (a min-         with the largest PMA having deposition velocities several
imum in the particle size distribution concentration between       orders of magnitude greater than accumulation-mode parti-
the two modes), commonly observed in cloud-processed ma-           cles (Petroff and Zhang, 2010; Pryor and Barthelmie, 2000;
rine aerosol size distributions (Hoppel et al., 1986).             Williams et al., 2002), indicating that aerosol mass gained
   Secondary organic aerosol mass is formed through the ox-        through gas-to-particle conversion onto PMA is quickly re-
idation of biogenic VOCs such as isoprene and monoter-             moved from the atmosphere. During the NAAMES cam-
penes (Altieri et al., 2016; Hallquist et al., 2009). At Cape      paigns, PMA contributions to CCN concentrations at 0.1 %
Grim, chlorophyll a, an indicator for marine phytoplankton         supersaturation were found to be low for the North Atlantic
biomass, is shown to strongly correlate with organic mass          (averaging 14 %–31 % for all but the late autumn NAAMES
(r = 0.85) on a seasonal timescale (Cui et al., 2019). While       campaign) (Quinn et al., 2019). Similarly, in global models,
isoprene and monoterpenes are known precursors for sec-            PMA was shown to account for about 20 %–40 % of CCN in
ondary organic particle mass, models indicate that previously      the North Atlantic (Pierce and Adams, 2006; Yu and Luo,
observed particle yields and estimated air–sea fluxes of iso-      2009). These observations indicate that a substantial frac-
prene (2 %, 13–38 µg m−2 d−1 ) and monoterpenes (∼ 32 %,           tion is likely from secondary biogenic sources or from conti-
0.27–0.78 µg m−2 d−1 ) (Hu et al., 2013; Lee et al., 2006) are     nental sources. Meskhidze and Nenes (2006) reported that
too low to account for the observed MBL organic mass, sug-         cloud droplet number concentrations were doubled over a
gesting that there may be large undiscovered sources (Arnold       phytoplankton bloom relative to the surrounding area. Sev-
et al., 2009; Myriokefalitakis et al., 2010). One proposed pos-    eral other studies have also shown that ocean productivity

https://doi.org/10.5194/acp-21-831-2021                                               Atmos. Chem. Phys., 21, 831–851, 2021
834                                        K. J. Sanchez et al.: Linking marine phytoplankton emissions with FLEXPART

and biomass abundance relate to the spatial and temporal          (FLEXPART) trajectory model to identify the contribution of
variability in MBL particle and cloud droplet concentrations      continental transport and to evaluate the connection between
(McCoy et al., 2015; Meskhidze and Nenes, 2010; Vallina           North Atlantic aerosols and potential explanatory variables
et al., 2006). While sulfate is more hygroscopic than organic     weighted by air mass history and boundary layer residence
aerosol mass, the latter still contributes to the particle size   time.
(which lowers the Kelvin effect) and may decrease the sur-
face tension (Frossard et al., 2018; Ovadnevaite et al., 2017).
Organics are likely to contribute to CCN concentrations con-      2     Methods
sidering that organics often account for a significant fraction
of marine Aitken- and accumulation-mode particle mass.            Here, we describe the measurements made onboard the R/V
   Linking aerosol and cloud properties to marine emis-           Atlantis during NAAMES as well as the satellite and model
sions is complicated by the influence of ship emissions and       data products that we explore as explanatory variables. Anal-
aerosols transported from the continents, including biomass-      ysis details, including filtering criteria, are also discussed.
burning smoke (Coggon et al., 2012; Shank et al., 2012; Yang
et al., 2016). Continental pollution and DMS-derived sul-         2.1    R/V Atlantis measurements during NAAMES
fate lofted into the free troposphere can lead to long-range
transport of particles and subsequent re-entrainment of these     The NAAMES campaigns were conducted on the R/V
particles back into the MBL in a different location (Clarke       Atlantis over the four major periods of the North At-
et al., 2013; Dzepina et al., 2015; Korhonen et al., 2008;        lantic marine phytoplankton cycle, aligning with the phyto-
Quinn et al., 2019; Saliba et al., 2020; Shank et al., 2012).     plankton biomass minimum (November 2015, NAAMES1),
It is also known that DMS can persist over significant trans-     maximum (May–June 2016, NAAMES2), and the transi-
port distances and contribute to secondary aerosol produc-        tions marked by the decay of biomass (September 2017,
tion in locations that are spatiotemporally removed from the      NAAMES3) and accumulation of biomass (March 2018,
source region (Mungall et al., 2016). Similarly, Zavarsky et      NAAMES4). Gray lines in Fig. 1a–d show the ship track
al. (2018) show that measured and calculated isoprene and         for each campaign. A detailed description of each NAAMES
PMA fluxes positively correlate with upwind satellite aerosol     campaign can be found in Behrenfeld et al. (2019).
measurements. Marine particle concentrations have also been          Aerosols were sampled on the forward O2 deck of the
shown to negatively correlate with precipitation along the air    R/V Atlantis with a temperature-controlled isokinetic inlet
mass history given the role of precipitation scavenging as        approximately 18 m above sea level. Particles were dried in
a prominent aerosol loss process (Andronache, 2004; Prup-         diffusion driers before being measured by instruments. Su-
pacher and Klett, 1997; Sanchez et al., 2021; Vallina et al.,     permicron particles were sized with an aerodynamic parti-
2006). Observations of new particle formation events corre-       cle sizer (APS 3321, TSI Inc., St. Paul, MN; size range 0.5–
spond with precipitation over the air mass history, likely due    20 µm). Additional aerosol instrumentation was downstream
to a decrease in coarse-mode aerosol concentrations and to-       of a 1.0 µm sharp cut cyclone (SCC 2.229, BGI Inc. US) to
tal particle surface area with precipitation scavenging (An-      measure only the submicron aerosol fraction. A condensation
dronache, 2004; Ueda et al., 2016).                               particle counter (CPC 3010, TSI Inc., St. Paul, MN) was used
   Previous literature hints that phytoplankton activity is re-   to measure particle number concentrations. A scanning elec-
lated to emissions of organic and sulfate aerosol mass pre-       trical mobility sizer (SEMS, model 138, 2002, BMI, Hay-
cursors (Altieri et al., 2016; Arnold et al., 2010; Ayers et      ward, CA) measured particle size distributions (0.02–0.9 µm
al., 1997; Bates et al., 1998b; Brüggemann et al., 2018; Ce-      diameter) at 5 min intervals utilizing a CPC (CPC 3025, TSI
burnis et al., 2011; Facchini et al., 2008; Hallquist et al.,     Inc., St. Paul, MN) to count the number of particles in each
2009; Hu et al., 2013; Huang et al., 2018a; Mansour et al.,       size bin of the aerosol size distribution. Because the SEMS
2020; Ovadnevaite et al., 2014; Park et al., 2017; Quinn et       CPC uses liquid to grow the particles large enough to be
al., 2019; Sanchez et al., 2018). These precursors are emit-      optically counted, the particle number concentrations mea-
ted over a large area at varying rates due to the spatial and     sured by the CPC are commonly referred to as condensation
temporal variation of marine biological activity (Behrenfeld,     nuclei or CN. Particle concentrations for diameters greater
2010; Behrenfeld and Boss, 2018). The MBL residence time          than and less than 100 nm (N>100 nm , N
K. J. Sanchez et al.: Linking marine phytoplankton emissions with FLEXPART 835
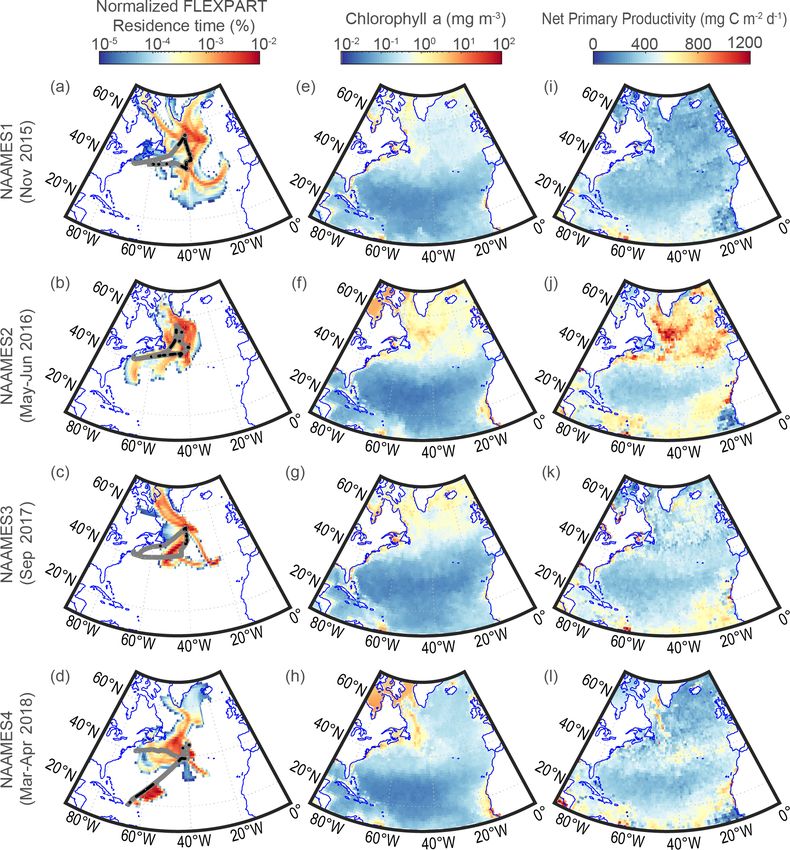
Figure 1. (a–d) The residence time fraction of all marine 5 d FLEXPART back trajectories column-integrated and normalized by the total
residence time, (e–h) average satellite chlorophyll a, and (i–l) average CAFE-modeled net primary production for each NAAMES campaign.
The gray line in (a)–(d) shows the R/V Atlantis cruise track, while the black points are initialization points for the back-trajectory model
runs that satisfy the clean marine filter criteria (Sect. 2.6).
ficiently measure refractory particles (i.e., particles that do al., 2013). In-line particulate organic carbon is derived from
not efficiently vaporize at 600 ◦ C), such as sea salt parti- beam attenuation data with the AC-S spectrometer (Boss
cles. The PMA particle number concentration is determined et al., 2013). A time series of key aerosol and DMS mea-
by integrating the fitted coarse mode of the SEMS and APS surements is shown in Fig. S1 in the Supplement for each
merged particle size distribution (Modini et al., 2015; Sal- NAAMES campaign.
iba et al., 2019). Radon was measured with a dual-flow-loop
two-filter 103 radon detector (Whittlestone and Zahorowski, 2.2 Satellite data products
1998). Continuous DMS measurements were made by at-
mospheric pressure chemical ionization mass spectrometers Several biological parameters are obtained from merged
(Bell et al., 2013, 2015). One instrument collected air mea- satellite ocean color products derived by the GlobColour
surements, while the other analyzed gas exiting the seawa- project (Maritorena et al., 2010). In this paper, four Glob-
ter equilibrator. In-line chlorophyll a measurements are cal- Colour level-3 satellite products, related to phytoplankton
culated from AC-S hyper-spectral spectrophotometer mea- biomass, represent biological processes at 1◦ horizontal res-
surements (WET Labs, Inc., Philomath, OR) using the “line olution. The first is chlorophyll a, a primary photosynthetic
height” method, which relates the phytoplankton absorption pigment in phytoplankton. Chlorophyll a is commonly used
at 676 nm to chlorophyll a from high-pressure liquid chro- as a proxy for the biomass of phytoplankton (Behrenfeld et
matography samples collected during NAAMES (Boss et al., 2016; Lyngsgaard et al., 2017; Meskhidze and Nenes,
2010; Pastor et al., 2013). The GlobColour project has sev-
https://doi.org/10.5194/acp-21-831-2021 Atmos. Chem. Phys., 21, 831–851, 2021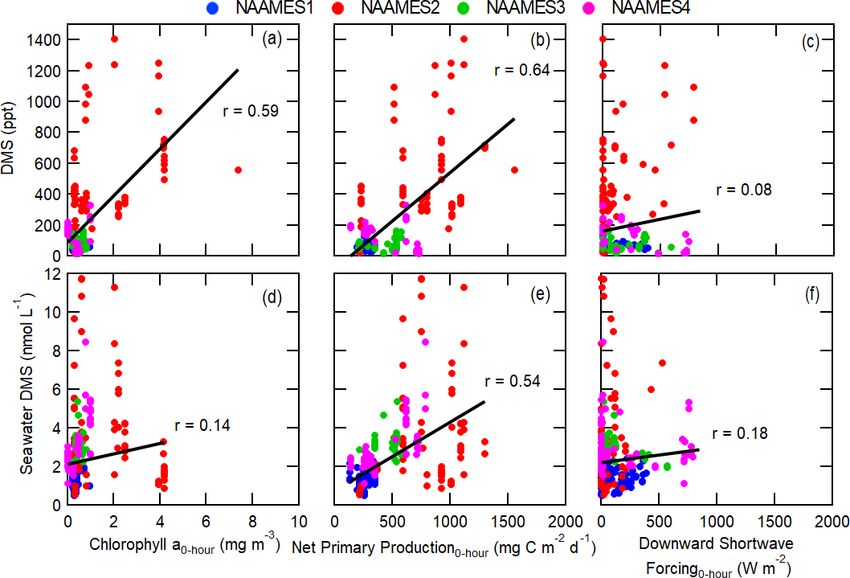
836                                        K. J. Sanchez et al.: Linking marine phytoplankton emissions with FLEXPART

eral different chlorophyll a products that are derived from        phytoplankton concentration, and the efficiency with which
different methods. In this study we use the chlorophyll a          carbon biomass is formed (Silsbe et al., 2016). A number
product derived from the Garver–Siegel–Maritonena ocean            of different models calculate net primary production, but
color model (Maritorena and Siegel, 2005). This specific           in this study we focus on net primary production derived
chlorophyll a product is chosen because the daily average          from the Carbon, Absorption, and Fluorescence Euphotic-
product best correlates with in-line chlorophyll a measure-        resolving (CAFE) model, which has been shown to be the
ments (r = 0.87; Table S7, Fig. S2). Figure 1e–h show the          most accurate in a recent study (Silsbe et al., 2016). The
merged satellite-derived chlorophyll a concentration over          model products are derived from merged satellite data from
the North Atlantic averaged for each NAAMES campaign.              the Making Earth Science Data Records for Use in Research
For this study chlorophyll-normalized VOC production rates         Environments (MEaSUREs) NASA initiative (Vollmer et al.,
were not considered because of the large variability in ob-        2011). Figure 1i–l show CAFE-modeled net primary produc-
served values (Booge et al., 2016) and the overall unknown         tion over the North Atlantic averaged for each NAAMES
contributions from various VOC species to marine particle          campaign.
mass concentrations. The next biological parameter studied
is marine particulate organic carbon, which is an important        2.4   GDAS model reanalysis data products
component in the carbon cycle that forms through photosyn-
thesis and subsequent ecosystem processes. In-line particu-        The Global Data Assimilation System (GDAS, ftp://arlftp.
late organic carbon also correlates with the satellite product     arlhq.noaa.gov/pub/archives/gdas1/, last access: 10 February
(r = 0.70; Table S7, Fig. S2). The absorption coefficient of       2019) gridded output is used to initialize the Global Fore-
colored detrital organic material (CDM) is also used as a pa-      cast System (GFS) model with observations obtained from
rameter. This absorption coefficient is largely associated with    surface observations, radiosondes, wind profilers, aircraft,
chromophoric dissolved organic matter (CDOM), which is             buoys, radar, and satellites. Here, we use the 3 h GDAS 1◦
the fraction of dissolved organic matter that interacts with       resolution horizontal sea surface wind speed, low-level cloud
solar radiation (Nelson and Siegel, 2013). CDOM is also a          cover, 3 h downward shortwave forcing (DSWF), and 6 h ac-
photosensitizer in the photolysis of DMS, meaning CDOM             cumulated precipitation over the North Atlantic to identify
generates reactive species upon the absorption of solar radia-     the state of the MBL upwind of the R/V Atlantis.
tion that remove seawater DMS through oxidation (Bouillon
and Miller, 2004; Brimblecombe and Shooter, 1986; Toole            2.5   FLEXPART back trajectories
et al., 2003, 2008). The final parameter, the depth of the eu-
photic zone, represents the depth at which downwelling irra-       The FLEXible PARTicle (FLEXPART) dispersion model is a
diance is 1 % of the value at the surface. This depth roughly      Lagrangian particle dispersion model used to estimate trans-
characterizes the layer of the ocean that can support net phy-     port pathways of observed air samples (Owen and Honrath,
toplankton photosynthesis but is also a function of chloro-        2009; Stohl et al., 2005; Zhang et al., 2014). Here, we use
phyll a (Morel et al., 2007).                                      the FLEXPART model to connect the R/V Atlantis obser-
   Even though in-line measurements correlate better with          vations (Sect. 2.1) to the explanatory variables discussed in
1 d average products (Fig. S2), we used 8 d average prod-          Sect. 2.2–2.4 by weighting the explanatory variables by the
ucts for all analyses because of the improved spatial cov-         FLEXPART air mass residence time. For the NAAMES cam-
erage (reduced interference from clouds). The 8 d averages         paigns, 10 d FLEXPART backward simulations are initial-
have about ∼ 45 % more spatial coverage than 1 d averages          ized along the path of the R/V Atlantis every hour. The GFS
and approximately 15 % less coverage than monthly averages         and its “final analysis” drive all the simulations with 3 h tem-
(Maritorena et al., 2010). If a grid cell is missing data for      poral resolution, 1◦ horizontal resolution, and 26 vertical lev-
satellite-derived biological parameters, it is filled by averag-   els that cover the depth of the troposphere and extend into the
ing the surrounding eight grid cells. If all surrounding grid      stratosphere. In each simulation, 10 000 passive particle trac-
cells have missing data, then the next and previous 8 d aver-      ers are released at the ship location. The advection and dis-
ages are averaged together to fill the grid cell. This method      persion of the particles are simulated backwards in time. The
sufficiently filled all missing data points.                       product is an upwind spatial distribution of the particle resi-
                                                                   dence times (average time an air parcel stays within a model
2.3   Modeled net primary production                               grid cell). Figure 1a–d show the residence time integrated
                                                                   over all 26 vertical levels for the first 5 d of all the FLEX-
Net primary production is the formation of organic material        PART trajectories during clean marine periods (Sect. 2.6).
through photosynthesis by phytoplankton. This process and          The residence time in Fig. 1a–d is normalized by the to-
correlated changes in other ecosystem rates lead to the emis-      tal residence time of all clean marine trajectories to show
sion of biogenic VOCs at the sea surface (Li et al., 2018).        the residence time fraction over each grid cell during each
In general, net primary production is a function of the photo-     NAAMES campaign. For the remaining analysis in this pa-
synthetically available radiation, the euphotic zone depth, the    per, the vertical structure of the residence time is column-

Atmos. Chem. Phys., 21, 831–851, 2021                                                 https://doi.org/10.5194/acp-21-831-2021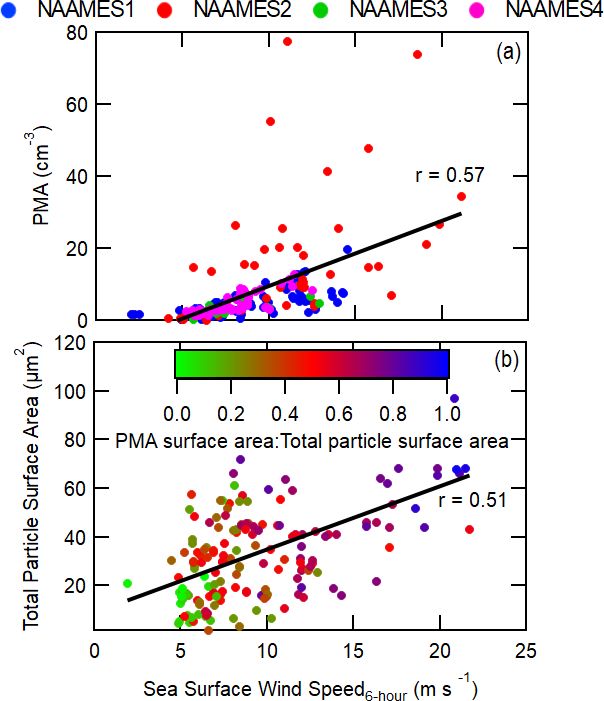
K. J. Sanchez et al.: Linking marine phytoplankton emissions with FLEXPART 837
integrated over only the vertical levels that are completely
or partially within the MBL based on GDAS MBL heights.
Remaining vertical levels were excluded from analysis.
2.6 Criteria for clean marine conditions
In order to constrain the impact of meteorological and bi-
ological parameters on marine particle chemical composi-
tion and concentration, air masses that are influenced by
continental and anthropogenic emissions are excluded from
the analysis. “Clean marine” conditions are defined as peri-
ods when (1) total particle number concentrations are below
1000 cm−3 , (2) black carbon mass is below 50 ng m−3 to fil-
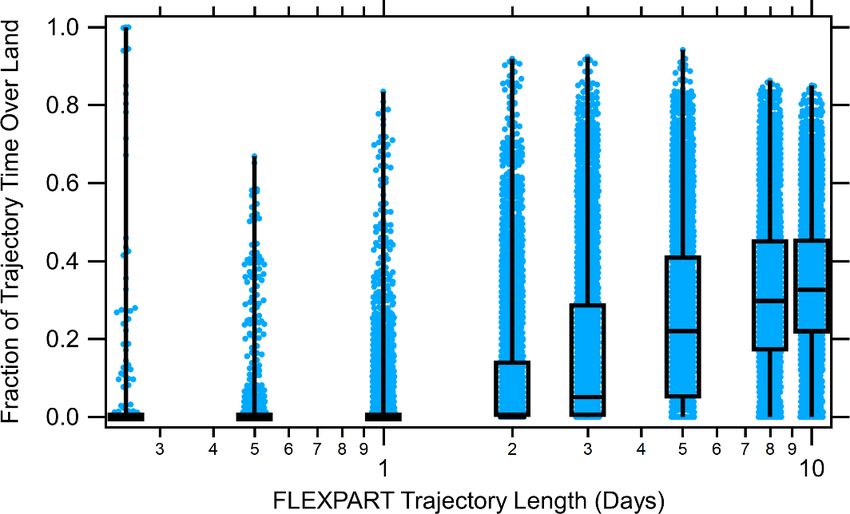
ter out ship contamination and continental transport (Betha Figure 2. Box plot of air mass residence time fraction spent over
et al., 2017; Saliba et al., 2020), (3) radon, a continental land for FLEXPART back trajectories of 6 h to 10 d for all cases
tracer, is below 500 mBq m−3 , (4) AMS non-refractory or- (both marine and continental back trajectories). Blue points rep-
ganic aerosol mass is less than 0.5 µg cm−3 as suggested by resent each individual FLEXPART back trajectory. The horizontal
prior measurements of organic aerosol mass over the marine lines show the 25th, 50th, and 75th percentiles for the fraction of
trajectory time over land, and the vertical lines represent the range.
environment (Russell et al., 2010), and (5) less than 25 %
of the 5 d FLEXPART back-trajectory residence time passes
over continents. Figure 2 shows the fraction of the FLEX-
low describes the explicit calculation of the residence-time-
PART trajectory time over land for 6 h to 10 d trajectories
weighted explanatory variables.
and indicates that the median fraction for the 5 d back tra-
jectory is 25 %, so half of the 2236 h of measurements are Integrated residence-time-weighted explanatory variable
removed due to this criterion alone. In the end, 557 samples T 360 180
are representative of clean marine conditions. Despite meet-
P P P
Rt,long,lat Et,long,lat
ing the clean marine criteria, black carbon mass still mod- =
t=1 long=1 lat=1
(1)
erately (r = 0.51) correlates with AMS non-refractory or- T
P 360
P 180
P
Rt,long,lat
ganic and sulfate aerosol mass (Fig. S3). The correlation even t=1 long=1 lat=1
holds at significantly lower black carbon mass concentration
thresholds, which is similar to previous findings (Huang et Here, Rt,long,lat and Et,long,lat are the MBL residence time
al., 2018b; Saliba et al., 2020; Shank et al., 2012), signify- and explanatory variable values, respectively, at each hour
ing that long-range transport or ship emissions contribute to (t), longitude (long), and latitude (lat) for a FLEXPART back
organic aerosol mass concentrations even in the cleanest re- trajectory with a length of T hours. Weights are applied
mote marine environments. However, approximately 75 % of evenly at all trajectory times. Residence time over land is
the variability in the organic and sulfate aerosol mass is still excluded from the integration of weighted trajectories. For
unaccounted for, indicating a potential influence from marine satellite and modeled biological variables, an 8 d average is
biogenic sources. necessary to obtain sufficient measurement spatial coverage
(Sect. 2.2). While not ideal, an 8 d average is still useful be-
cause the phytoplankton cycle is fairly slow (1 year) rela-
3 Results and discussion tive to the frequency of meteorological disturbances (days),
and consequently the low variation from one 8 d average in
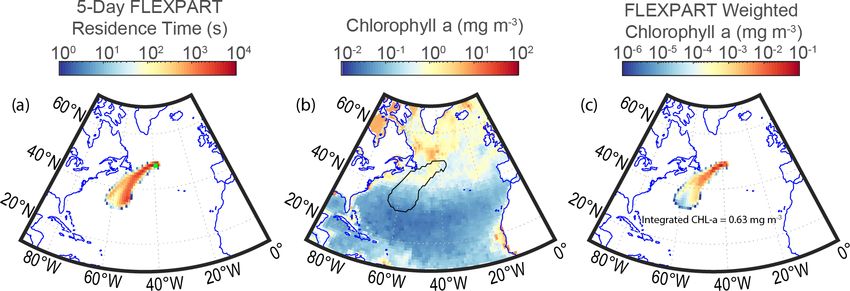
An example of the MBL column-integrated residence time of chlorophyll a values to the next indicates that an 8 d aver-
individual FLEXPART back trajectories is shown in Fig. 3a. age is appropriate (Fig. S5). In addition, advection is slower
This is then normalized and multiplied by the biological in the ocean as ocean currents are significantly slower than
(8 d average) or meteorological (3 or 6 h average) explana- atmospheric wind speed.
tory variables (for example, satellite-derived chlorophyll a Weighted FLEXPART back trajectories are compared to
shown in Fig. 3b) to obtain a residence-time-weighted value particle properties and atmospheric DMS concentrations
that, when integrated, represents the average value over the measured aboard the R/V Atlantis. We define correlation
back trajectory. An example of the residence-time-weighted strength by the calculated Pearson’s coefficient (r) follow-
chlorophyll a is shown in Fig. 3c. Higher values in Fig. 3c ing Devore and Berk (2012), where |r| < 0.25 indicates that
represent regions where chlorophyll a had the greatest influ- there is no correlation, 0.25 ≤ |r| < 0.50 is defined as a weak
ence on the air mass intercepted by the ship due to the corre- correlation, 0.50 ≤ |r| < 0.80 is defined as a moderate corre-
sponding high residence times (Fig. 3a) and high chlorophyll lation, and |r| ≥ 0.80 is defined as a strong correlation. All
a concentrations (Fig. 3b) in these regions. The equation be- presented Pearson’s correlation coefficients are statistically
https://doi.org/10.5194/acp-21-831-2021 Atmos. Chem. Phys., 21, 831–851, 2021838 K. J. Sanchez et al.: Linking marine phytoplankton emissions with FLEXPART
Figure 3. (a) An example 5 d FLEXPART trajectory (MBL column-integrated) residence time distribution from the NAAMES2 campaign
initialized at 00 Z on 19 May 2016 and the ship location, shown by the green square. (b) Satellite chlorophyll a product and an outline of
the 5 d FLEXPART back trajectory. (c) Satellite-derived chlorophyll a weighted by the 5 d FLEXPART residence time and then integrated
to obtain a value representative of the level of influence chlorophyll a may have had over the past 5 d on the air mass measured at the R/V
Atlantis location.
significant (p < 0.05). For consistency, we have assumed tion of non-refractory organic mass is from secondary bio-
that the relationships between variables will be linear. Cor- genic VOC emissions, such as MSA, isoprene and monoter-
relations of trajectories weighted by biological and meteoro- penes, and other unidentified biogenic VOCs (Altieri et
logical parameters with measured aerosol mass, number, and al., 2016; Hallquist et al., 2009; Zorn et al., 2008). Non-
DMS concentrations vary by the length of the weighted tra- refractory organic aerosol mass also correlates with down-
jectory (Fig. 4, Tables S8–S16). In particular, many of these ward shortwave forcing (DSWF), with correlation strength
correlations increase with increasing trajectory length, indi- increasing at longer trajectory lengths (Figs. 4a, 5c). In-
cating that biological and meteorological processes over the creased solar radiation promotes photosynthesis by phyto-
air mass history are influential for measured particle prop- plankton and is necessary for photochemical production of
erties and that using only spatially contemporaneous data secondary organic aerosol. Biogenic VOC emissions (pre-
would miss correlative connections that are lagged in time. cursors of particle-phase organic mass) are a by-product of
Over longer trajectories, the weighted parameter is less likely photosynthesis (Dani and Loreto, 2017) and likely cause part
to be related to the local value because the trajectories cover of the correlation of organic aerosol mass with DSWF. Even
more ocean surface area, and thus they are more likely to be though DSWF moderately correlates with organic aerosol
weighted by both high and low values (for example, chloro- mass concentrations (r = 0.52 at 2 d trajectories), the pres-
phyll a in Fig. 3b). However, there are still cases when a long ence of phytoplankton is necessary for photosynthetic bio-
(5 d) trajectory is consistently weighted by low values or high logical emissions to occur (Silsbe et al., 2016). Figure 5c no-
values, which may lead to extremes in particle concentrations tably shows that DSWF is often higher during NAAMES4
or composition, depending on the effect of the explanatory (March–April 2018) compared to the other campaigns. How-
variable. In the following sections, the correlation strength ever, NAAMES4 has lower measured organic aerosol mass
is interpreted based on known sources and sinks of marine concentrations, particularly when compared to the late spring
particles and DMS. campaign (NAAMES2, May–June 2016). The higher DSWF
during much of NAAMES4 is simply due to the fact that
3.1 Biological controls on marine aerosols the NAAMES4 campaign extended further to the south (to
∼ 20◦ N; Fig. 1d) than any of the other campaigns. The rel-
Measured non-refractory organic aerosol mass correlates atively low abundance of phytoplankton biomass in the trop-
weakly with FLEXPART residence-time-weighted chloro- ical Atlantic, compared to the subarctic Atlantic (shown by
phyll a, with the highest correlation at 2 d trajectory lengths chlorophyll a concentrations; Fig. 1f, h, j, l), results in lower
(r = 0.39; Figs. 4a, 5a). The correlation of organic aerosol levels of photosynthesis and therefore lower VOC emissions
mass with chlorophyll a is similar for CDM (r = 0.32), and organic aerosol mass formation. The amount of photo-
but there is no correlation with seawater particulate or- synthesis taking place depends on both the DSWF and phyto-
ganic carbon or the euphotic zone depth (|r| < 0.25). Or- plankton abundance, both of which are included in the calcu-
ganic aerosol mass correlates moderately with trajectory- lation of net primary production (in addition to other param-
weighted CAFE-modeled net primary production for 2 to 5 d eters; Sect. 2.3). Consequently, the phytoplankton net pri-
trajectories (r = 0.54–0.62) (Figs. 4a, 5b, Table S8). Com- mary production is a better predictor of marine biogenic or-
parisons of non-refractory organic aerosol mass with other ganic aerosol mass and likely biogenic VOC emissions than
net primary production models are shown in the Supplement
in Table S8. These results suggest that a substantial por-
Atmos. Chem. Phys., 21, 831–851, 2021 https://doi.org/10.5194/acp-21-831-2021K. J. Sanchez et al.: Linking marine phytoplankton emissions with FLEXPART 839 Figure 4. Pearson’s correlation coefficients between FLEXPART residence-time-weighted explanatory variables and the following atmo- spheric measurement variables: (a) organic aerosol mass, (b) sulfate aerosol mass, (c) DMS, (d) particle number concentration for diameters < 100 nm, (e) particle number concentration for diameters > 100 nm, and (f) PMA-mode concentration. The explanatory variables listed on the ordinate axis are colored to denote satellite-derived parameters (black text), CAFE ocean biology model parameters (green text), and atmospheric model reanalysis products (blue text). The PMA-mode number concentration is derived from the SEMS and APS instruments on the R/V Atlantis. Pearson’s correlation coefficients are only included for statistically significant cases in which p < 0.05. DSWF, chlorophyll a biomass, or any other individual bio- measurements were collected in the South Atlantic and Arc- logical parameter. tic, respectively. Unlike atmospheric DMS, DMS in seawa- In contrast, the measured sulfate aerosol mass concen- ter correlates moderately with the modeled net primary pro- tration has a weak correlation or no correlation with the duction even when excluding NAAMES2 (r = 0.54). This satellite-measured biological parameters and modeled net difference is driven by variability in the fraction of sea- primary production (r < 0.4), with the exception of the eu- water DMS that is released into the atmosphere. In addi- photic zone depth (r = 0.53 for 5 d trajectory), even though tion, DMS production is highly dependent on phytoplankton the main marine biogenic source of sulfate aerosol is the species (Keller, 1988), complicating the relationship between oxidation of VOC emissions from phytoplankton, specifi- atmospheric DMS measurements and bulk ocean quantities cally DMS (Ayers and Gras, 1991; Bates et al., 1998a, 2012; as well as confounding direct correlations. Covert et al., 1992; Quinn et al., 2000; Rinaldi et al., 2010; In addition, atmospheric DMS and non-refractory sulfate Sanchez et al., 2018). Measured atmospheric DMS concen- aerosol mass are observed to have little to no correlation trations moderately correlate with biological parameters for with each other (r = 0.34) or with ocean biological activ- short trajectories (0–6 h); however, this correlation is driven ity. This lack of correlation may be due to the longer DMS solely by a few measurements made during the bloom phase atmospheric lifetime relative to biogenic VOCs (Kloster et of the phytoplankton cycle (NAAMES2, Fig. 6). Exclud- al., 2006; Sciare et al., 2001). For a typical average OH rad- ing the measurements from NAAMES2 would result in no ical concentration of 0.6 ppt, the lifetime of DMS is approx- significant correlation between measured atmospheric DMS imately 37 h, which is much longer compared to the lifetime and biological parameters. Significantly higher chlorophyll a of known marine biogenic VOCs, such as isoprene (1.8 h) concentrations and net primary production rates are present and monoterpenes (tens of minutes to 3 h depending on the during the NAAMES2 phytoplankton bloom, causing the species) (Atkinson and Arey, 2003; Lee et al., 2006; Li- significantly higher DMS concentrations (Fig. 1e–l). The akakou et al., 2007; Pandis et al., 1995; Seinfeld and Pandis, DMS correlation with chlorophyll a during the bloom period 2006). Also, SO2 , a DMS oxidation product, has a lifetime is consistent with results from similar analyses performed by on the order of days to weeks. Organic aerosol mass likely Arnold et al. (2010) and Park et al. (2018), wherein DMS correlates with sea surface biomass and net primary produc- https://doi.org/10.5194/acp-21-831-2021 Atmos. Chem. Phys., 21, 831–851, 2021
840                                           K. J. Sanchez et al.: Linking marine phytoplankton emissions with FLEXPART

Figure 5. Measured atmospheric concentrations of (a–c) organic and (d–f) sulfate aerosol mass compared to 2 d FLEXPART residence-time-
weighted satellite chlorophyll a, modeled net primary production, and reanalysis model downward shortwave forcing. Pearson’s coefficients
(r) are included for each plot along with best-fit lines shown as black lines.

Figure 6. Measurements of (a–c) atmospheric and (d–f) in-water DMS concentrations compared to R/V Atlantis measurements of chloro-
phyll, net primary production, and downward shortwave forcing. Pearson’s coefficients (r) are included for each plot along with best-fit lines
shown as black lines.

Atmos. Chem. Phys., 21, 831–851, 2021                                                         https://doi.org/10.5194/acp-21-831-2021
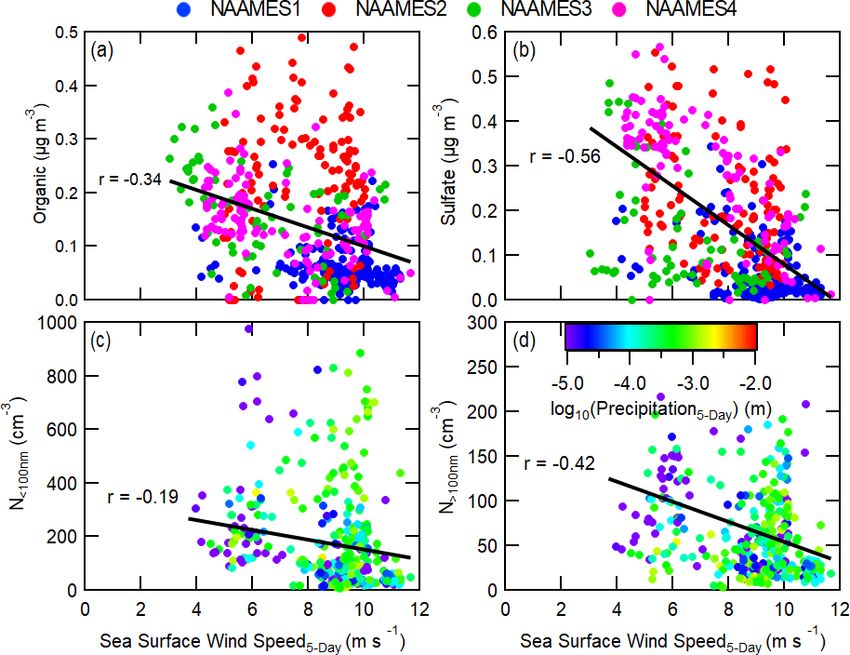
K. J. Sanchez et al.: Linking marine phytoplankton emissions with FLEXPART                                                     841

tion more than sulfate aerosol mass, partially because of the       3.2   Meteorological controls on marine aerosols
shorter lifetime. Once emitted, DMS and its oxidation prod-
ucts can be advected large distances or become lofted into the      Meteorological parameters can also influence particle con-
free troposphere (Clarke et al., 2013; Korhonen et al., 2008;       centrations. In addition to being important for biological pro-
Russell et al., 1998; Sanchez et al., 2018; Thornton et al.,        cesses, DSWF is also important for initiating photochemical
1997), where the resulting sulfate aerosol is not sampled by        oxidation of biogenic VOCs, which leads to the formation of
the ship. DMS also has a number of chemical pathways with           organic and sulfate aerosol mass (Altieri et al., 2016; Bates
various secondary aerosol yields, making a direct link to bi-       et al., 1998b; Frossard et al., 2014b; Hallquist et al., 2009;
ological processes more challenging (Faloona et al., 2009).         O’Dowd et al., 2002; Rinaldi et al., 2010; Sievering et al.,
For these reasons, biomass and net primary production are           1992; Warren and Seinfeld, 1985). This process may cause
not good predictors of DMS (Gunson et al., 2006). Organic           the moderate correlation between sulfate aerosol mass and
aerosol mass precursors quickly condense onto existing par-         DSWF despite having no correlation with satellite biomass
ticles to form secondary organic aerosol (SOA) soon after           or modeled net primary production (Figs. 4, 5f). This also
emission (Ehn et al., 2014; Liakakou et al., 2007; Wennberg         implies that DSWF is involved in both the photochemical ox-
et al., 2018).                                                      idation of VOCs and photosynthesis of marine phytoplank-
   Similar to organic aerosol mass concentrations, particle         ton, and both processes likely strengthen the correlation of
number concentrations have weak correlations with biomass           organic aerosol mass and DSWF. Figure 4 also shows how
abundance (Fig. 4d, e). Comparisons to particle number              other meteorological parameters influence particle concen-
based on size are useful because they provide information on        trations. For example, low-level cloud cover is shown to neg-
possible links to specific processes. The size distributions are    atively correlate with sulfate aerosol mass and N>100 nm . The
split to derive integrated particle concentrations for diameters    presence of clouds will decrease the solar radiation reach-
greater and less than 100 nm (N>100 nm ; N100 nm , while aqueous production pathways would pre-
tribute to changes in particle concentrations at different sizes.   sumably result in a positive low-level cloud cover correla-
Specifically, Aitken-mode particle concentrations (N100 nm ) are driven by the growth        portant than gas-phase photochemical mechanisms. Meteo-
of the Aitken mode through cloud processing and conden-             rological systems have consistent patterns, so, like low-level
sation processes. N>100 nm particles weakly correlate with          cloud cover and DSWF, many other meteorological parame-
modeled net primary production (r = 0.46 for 5 d weighted           ters covary with each other, complicating linking the particle
back trajectories), moderately correlate with non-refractory        properties to specific meteorological processes. Table S5 in-
organic masses (r = 0.65), and strongly correlate with sul-         dicates that DSWF correlates moderately or weakly with all
fate masses (r = 0.83); this is expected since larger particles     the meteorological parameters considered from the GDAS
account for most of the total submicron particle mass mea-          dataset. In this section, we examine how the other meteoro-
sured by the AMS. Small particles contain much less mass,           logical parameters, shown in Fig. 4, also affect aerosol mass
so N
842                                          K. J. Sanchez et al.: Linking marine phytoplankton emissions with FLEXPART

mass irrelevant in this situation. The average dry PMA-mode           fate formation from SO2 occurs rapidly on fresh PMA par-
diameter, determined with a coarse-mode fitting algorithm,            ticles via uptake due to aqueous ozone reactions (Siever-
was 0.54 µm and as high as 1.12 µm (Saliba et al., 2019),             ing et al., 1992). Subsequently, in-cloud sulfate formation
which is larger than Aitken- and accumulation-mode parti-             from SO2 continues by oxidation due to hydrogen perox-
cles. Because PMA particles are large, they are more prone            ide (Jacob, 2000). Other factors associated with high wind
to rapid removal from the MBL through deposition relative             speed conditions, such as coagulation, dry deposition, and
to smaller particles (Pryor and Barthelmie, 2000). Specifi-           enhanced vertical mixing, likely also contribute to the ob-
cally, at wind speeds greater than 10 m s−1 the deposition-           served negative correlation between wind speed and parti-
dependent lifetime of a 3 µm wet-diameter particle in a 500 m         cle concentration. In addition, some of the secondary organic
MBL is about 3–12 h, whereas the lifetime of a 0.1–1 µm               and sulfate mass may be missed by the AMS measurements.
wet-diameter particle is several days to weeks.                       The AMS is limited to measuring only non-refractory parti-
   While counterintuitive, the inverse correlation between            cles, so organic and sulfate aerosol mass that has condensed
N>100 nm and sea surface wind speed is likely driven by               onto refractory PMA is less likely to be efficiently vapor-
enhanced PMA concentrations at higher wind speeds that                ized and measured (DeCarlo et al., 2006; Frossard et al.,
increase the pre-existing condensational sink for gas-to-             2014a). Wind speed also inversely correlates with DSWF
particle conversion. PMA does not significantly contribute            (r = −0.65, Table S5). As previously mentioned, DSWF is
to total particle number concentrations (or N>100 nm ) and in-        proportional to aerosol mass due to its stimulation of VOC
cidentally is often considered not to be a major driver of            emissions by marine biota and role in the photochemical
variability in cloud microphysics (Quinn et al., 2017). In a          oxidation of VOCs. Since meteorological variables covary,
recent modeling study by Fossum et al. (2020), the authors            DSWF may partially drive the correlation strength between
showed evidence that the presence of elevated sea salt con-           wind speed and aerosol mass concentrations or vice versa.
centrations from PMA can indirectly affect cloud droplet                 Precipitation is a well-known sink for aerosol number and
concentrations by enhancing the uptake of water vapor at              mass concentrations (Croft et al., 2010; Stevens and Fein-
low supersaturations, causing a reduction of in-cloud max-            gold, 2009). In addition, new particle formation events have
imum supersaturations. A smaller maximum supersaturation              been shown to correspond to precipitation during the air mass
will lead to fewer small particles (N100 nm ).         cipitation scavenging (Andronache, 2004; Ueda et al., 2016).
This feedback does not explain why non-refractory sulfate             Despite this fact, precipitation was shown to have little to
and organic aerosol mass are also moderately and weakly in-           no correlation with aerosol number or mass (Figs. 4, S4;
versely proportional to wind speed, respectively, but they are        r < 0.40). This observation may partially reflect the precip-
also possibly linked to PMA concentrations. PMA concen-               itation data being a 6 h average GDAS product rather than
trations are fairly low compared to N>100 nm and N100 nm and N
K. J. Sanchez et al.: Linking marine phytoplankton emissions with FLEXPART                                                              843

Figure 7. Measurements of atmospheric (a) organic aerosol mass, (b) sulfate aerosol mass, (c) number concentration for diameters < 100 nm,
and (d) number concentration for diameters > 100 nm compared to the 5 d FLEXPART residence-time-weighted model reanalysis wind
speed. Points are colored based on the corresponding campaign in (a) and (b) and colored by the base-10 logarithm of the 5 d FLEXPART
residence-time-weighted model reanalysis 6 h accumulated precipitation for (c) and (d). Pearson’s coefficients (r) are included for each plot
along with best-fit lines shown as black lines.

and back trajectories weighted by four metrics of satellite-             fate aerosol mass is also derived from marine VOC emis-
measured biological and physical properties (chlorophyll a,              sions. This difference is attributed to the short lifetime of
seawater particulate organic carbon, colored detrital organic            organic aerosol mass precursors, like isoprene and monoter-
materials, euphotic zone depth), modeled net primary pro-                penes (minutes to hours), which were below detection lim-
duction, and model reanalysis meteorological parameters.                 its during NAAMES, relative to sulfate aerosol mass precur-
Correlations between residence-time-weighted explanatory                 sors such as DMS (1–2 d) (Kloster et al., 2006; Liakakou et
variables and aerosol measurements indicate that both bio-               al., 2007; Sciare et al., 2001) and DMS oxidation products
logical and meteorological processes influence aerosol con-              such as SO2 (days to weeks) (Faloona et al., 2009). Further-
centrations and composition. Specifically, non-refractory or-            more, the longer lifetime of DMS and its oxidation prod-
ganic aerosol mass correlates weakly with chlorophyll a                  ucts can delay the formation of sulfate aerosol mass, making
concentration, a proxy for phytoplankton biomass, averaged               sulfate precursors more likely to advect through long-range
over 2 d back trajectories (r = 0.39) and moderately with                transport if vertically lofted into the free troposphere and re-
net primary production over 5 d trajectories (r = 0.62). In              entrained down into the MBL. The MBL-to-free-troposphere
general, the satellite-derived chlorophyll a, absorption co-             transport of DMS is not captured well by the FLEXPART
efficient of colored detrital organic materials, seawater par-           model. In addition, there are numerous DMS chemical path-
ticulate organic carbon, and the euphotic zone depth mod-                ways with various secondary aerosol yields that can obscure
erately or strongly correlate with each other and therefore              any link between sulfate aerosol concentrations and biogenic
had similar relationships to observed particle properties. In            processes (Faloona et al., 2009).
addition, organic aerosol mass moderately correlated with                   Wind speed also weakly to moderately inversely correlated
DSWF, increasingly for longer trajectory lengths (r = 0.58               with aerosol concentration and mass. This relationship may
at 5 d trajectories). These results indicate that organic aerosol        be driven by the enhanced formation of coarse-mode pri-
mass is influenced by the VOC emissions encountered by                   mary marine aerosol (PMA) at higher wind speeds. Specifi-
the air mass, which are driven by biological activity. Sulfate           cally, enhanced PMA concentrations can prevent sulfate par-
aerosol mass only weakly correlates with marine net primary              ticles from activating to cloud droplets and growing through
production (r < 0.50), even though marine non-sea-salt sul-              cloud processing. This result is consistent with a modeling

https://doi.org/10.5194/acp-21-831-2021                                                       Atmos. Chem. Phys., 21, 831–851, 2021
844                                            K. J. Sanchez et al.: Linking marine phytoplankton emissions with FLEXPART

                                                                         with downward shortwave forcing and was anticorrelated
                                                                         with wind speed. Atmospheric DMS and PMA concentra-
                                                                         tions showed better correlations with shorter back-trajectory
                                                                         lengths, reflecting their origin as primary emissions. In sum,
                                                                         this work demonstrates the need to account for air mass his-
                                                                         tory when apportioning marine aerosol sources. While this
                                                                         study seeks to understand linkages between the ocean and
                                                                         atmosphere, we have deliberately excluded the influence of
                                                                         most continental transport to the marine atmosphere. Fu-
                                                                         ture studies are needed to (1) understand how differences
                                                                         in subtropical and subarctic phytoplankton speciation may
                                                                         influence aerosol concentrations (Bolaños et al., 2020) and
                                                                         (2) quantify the contribution of transported aerosols to the
                                                                         marine CCN budget and how those may impact (or even
                                                                         dominate) the relationships we have identified in the remote
                                                                         North Atlantic.

                                                                         Data availability. The NAAMES dataset is archived at
                                                                         the NASA Atmospheric Science Data Center (ASDC;
                                                                         https://doi.org/10.5067/Suborbital/NAAMES/DATA001,
Figure 8. Measurements of (a) the PMA-mode number concentra-
                                                                         NAAMES Science Team, 2018) and the SeaWiFS
tion and (b) total particle surface area compared to 6 h FLEXPART
                                                                         Bio-Optical Archive and Storage System (SeaBASS;
residence-time-weighted model reanalysis wind speed. Both the to-
                                                                         https://doi.org/10.5067/SeaBASS/NAAMES/DATA001,
tal particle surface area and the PMA-mode concentration are de-
                                                                         Werdell and Bailey, 2002). Scripps measurements are avail-
rived from the SEMS and APS instruments on the R/V Atlantis.
                                                                         able at https://doi.org/10.6075/J04T6GJ6 (Russell et al.,
Pearson’s coefficients (r) are included for each plot along with best-
                                                                         2018). The GlobColour data (2020) (http://globcolour.info)
fit lines shown as black lines.
                                                                         used in this study have been developed, validated, and
                                                                         distributed by ACRI-ST, France. GDAS data (2020) are
                                                                         available       at    ftp://arlftp.arlhq.noaa.gov/pub/archives/gdas1/.
study indicating that the enhanced rate of water vapor con-              Modeled net primary production data (2020) are available at
densation onto PMA resulted in decreased cloud supersat-                 http://sites.science.oregonstate.edu/ocean.productivity/custom.php.
urations (Fossum et al., 2020). The concentration of parti-
cles greater than 100 nm in diameter negatively correlated
with wind speed (r = −0.42), consistent with this hypoth-                Supplement. The supplement related to this article is available on-
esis; however, sulfate (r = −0.56) and organic (r = −0.37)               line at: https://doi.org/10.5194/acp-21-831-2021-supplement.
aerosol mass are also negatively correlated with surface wind
speed. We attribute this to the condensation of sulfate and
                                                                         Author contributions. KJS and RHM were responsible for the con-
VOCs onto PMA. While PMA accounts for a low fraction
                                                                         ceptualization, methodology, and writing of the original draft. KJS
of the particle number, it is of larger size compared to most
                                                                         and BZ designed the software. KJS performed the formal analy-
particles and shown to account for 41 ± 23 % of the total par-           sis and visualization. RHM, MHB, and LMR were responsible for
ticle surface area. Large PMA particles have short lifetimes             supervision, project administration, and funding acquisition. GS,
and deposit quickly relative to submicron particles (Pryor               CLC, SLL, PKQ, TSB, JP, TGB, ESS, and MJB curated the data.
and Barthelmie, 2000). This is supported by the moderate                 All authors participated in writing, review, and editing.
correlation between wind speed and PMA concentrations at
0 h trajectories (r = 0.59), which decreased for longer trajec-
tory lengths. Condensed sulfate and organics on PMA in the               Competing interests. The authors declare that they have no conflict
MBL would quickly be removed from the atmosphere. In ad-                 of interest.
dition, the AMS likely missed most secondary aerosol mass
that condensed onto PMA because of its low efficiency for
measuring refractory components.                                         Special issue statement. This article is part of the special issue
   We find that air mass residence time is important for                 “Marine aerosols, trace gases, and clouds over the North Atlantic
relating aerosol organics to ocean chlorophyll a, net pri-               (ACP/AMT inter-journal SI)”. It is not associated with a confer-
                                                                         ence.
mary production, and downward shortwave forcing, with
moderate correlations observed for the longer simulation
ages. Similarly, sulfate aerosol showed moderate correlations

Atmos. Chem. Phys., 21, 831–851, 2021                                                         https://doi.org/10.5194/acp-21-831-2021
You can also read