Systematic Review: Quantitative Susceptibility Mapping (QSM) of Brain Iron Profile in Neurodegenerative Diseases
←
→
Page content transcription
If your browser does not render page correctly, please read the page content below
SYSTEMATIC REVIEW
                                                                                                                                             published: 18 February 2021
                                                                                                                                         doi: 10.3389/fnins.2021.618435

                                            Systematic Review: Quantitative
                                            Susceptibility Mapping (QSM) of
                                            Brain Iron Profile in
                                            Neurodegenerative Diseases
                                            Parsa Ravanfar 1*, Samantha M. Loi 1,2 , Warda T. Syeda 1 , Tamsyn E. Van Rheenen 1,3 ,
                                            Ashley I. Bush 4 , Patricia Desmond 5,6 , Vanessa L. Cropley 1,3 , Darius J. R. Lane 4 ,
                                            Carlos M. Opazo 7 , Bradford A. Moffat 1,5 , Dennis Velakoulis 1,2† and Christos Pantelis 1,7†
                                            1
                                             Melbourne Neuropsychiatry Centre, Department of Psychiatry, The University of Melbourne and Melbourne Health, Carlton
                                            South, VIC, Australia, 2 Neuropsychiatry, The Royal Melbourne Hospital, Parkville, VIC, Australia, 3 Centre for Mental Health,
                                            Swinburne University of Technology, Hawthorn, VIC, Australia, 4 Melbourne Dementia Research Centre, Florey Institute of
                                            Neuroscience & Mental Health, The University of Melbourne, Parkville, VIC, Australia, 5 Melbourne Brain Centre Imaging Unit,
                            Edited by:
                                            Department of Medicine and Radiology, The University of Melbourne, Parkville, VIC, Australia, 6 Department of Radiology, The
                               Yi Wang,
                                            Royal Melbourne Hospital, The University of Melbourne, Parkville, VIC, Australia, 7 Florey Institute of Neuroscience and Mental
      Cornell University, United States
                                            Health, The University of Melbourne, Parkville, VIC, Australia
                        Reviewed by:
                          Alan Wilman,
         University of Alberta, Canada      Iron has been increasingly implicated in the pathology of neurodegenerative
                       Mauro Costagli,      diseases. In the past decade, development of the new magnetic resonance imaging
             University of Genoa, Italy
                                            technique, quantitative susceptibility mapping (QSM), has enabled for the more
                *Correspondence:
                     Parsa Ravanfar         comprehensive investigation of iron distribution in the brain. The aim of this systematic
   sravanfar@student.unimelb.edu.au         review was to provide a synthesis of the findings from existing QSM studies
                 † These authors share      in neurodegenerative diseases. We identified 80 records by searching MEDLINE,
                      senior authorship     Embase, Scopus, and PsycInfo databases. The disorders investigated in these
                                            studies included Alzheimer’s disease, Parkinson’s disease, amyotrophic lateral sclerosis,
                    Specialty section:
          This article was submitted to
                                            Wilson’s disease, Huntington’s disease, Friedreich’s ataxia, spinocerebellar ataxia, Fabry
                    Neurodegeneration,      disease, myotonic dystrophy, pantothenate-kinase-associated neurodegeneration, and
                a section of the journal
                                            mitochondrial membrane protein-associated neurodegeneration. As a general pattern,
             Frontiers in Neuroscience
                                            QSM revealed increased magnetic susceptibility (suggestive of increased iron content) in
         Received: 19 October 2020
         Accepted: 07 January 2021          the brain regions associated with the pathology of each disorder, such as the amygdala
        Published: 18 February 2021         and caudate nucleus in Alzheimer’s disease, the substantia nigra in Parkinson’s disease,
                             Citation:      motor cortex in amyotrophic lateral sclerosis, basal ganglia in Huntington’s disease, and
  Ravanfar P, Loi SM, Syeda WT, Van
   Rheenen TE, Bush AI, Desmond P,
                                            cerebellar dentate nucleus in Friedreich’s ataxia. Furthermore, the increased magnetic
  Cropley VL, Lane DJR, Opazo CM,           susceptibility correlated with disease duration and severity of clinical features in some
Moffat BA, Velakoulis D and Pantelis C
                                            disorders. Although the number of studies is still limited in most of the neurodegenerative
            (2021) Systematic Review:
  Quantitative Susceptibility Mapping       diseases, the existing evidence suggests that QSM can be a promising tool in the
          (QSM) of Brain Iron Profile in    investigation of neurodegeneration.
        Neurodegenerative Diseases.
          Front. Neurosci. 15:618435.       Keywords: quantitative susceptibility mapping, brain, iron, Alzheimer’s disease, Parkinson’s disease,
     doi: 10.3389/fnins.2021.618435         neurodegenerative diseases

Frontiers in Neuroscience | www.frontiersin.org                                     1                                         February 2021 | Volume 15 | Article 618435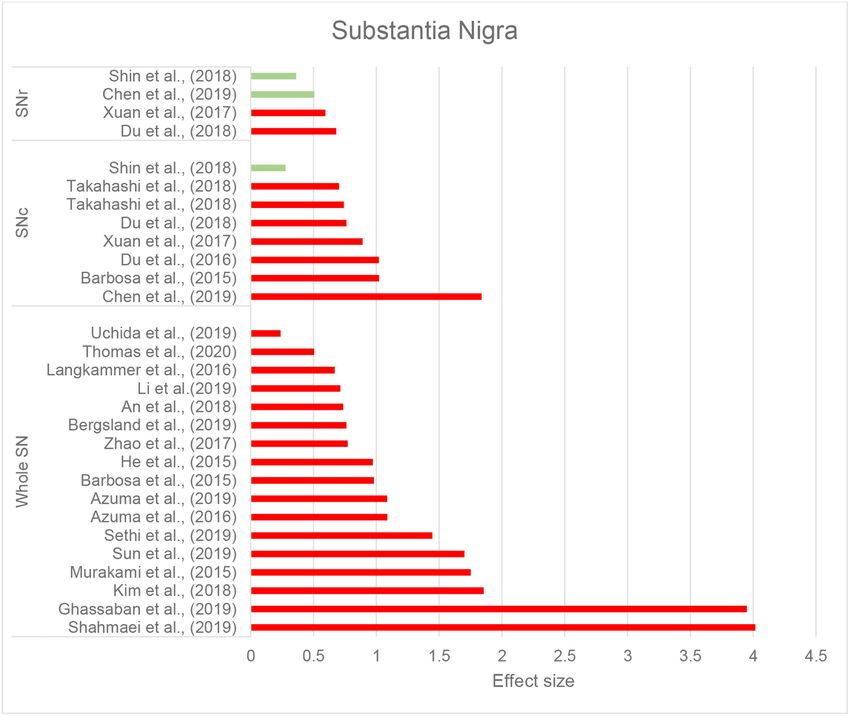
Ravanfar et al.                                                                                                                QSM in Neurodegenerative Diseases

INTRODUCTION                                                                             magnetizability of a material when exposed to an applied
                                                                                         magnetic field. Elements and compounds are categorized
While the presence of iron is vital for normal function and                              as paramagnetic or diamagnetic based on their magnetic
development of the brain, excess iron deposition has been                                susceptibility. Paramagnetic substances (such as most biologic
proposed to play an important role in the pathology of                                   forms of iron and copper) have a positive magnetic susceptibility,
neurodegenerative diseases (Morris et al., 2018). Iron is a key                          are attracted to an external magnetic field, and increase the mean
element in several metabolic pathways throughout the body                                tissue magnetic susceptibility. On the other hand, diamagnetic
including oxidative phosphorylation and DNA synthesis and is                             substances (such as water, myelin, and calcifications) have a
responsible for oxygen transport in the blood. In the central                            negative magnetic susceptibility, are slightly repelled by an
nervous system (CNS), in addition to its general metabolic roles,                        external magnetic field and decrease the mean tissue magnetic
iron plays a critical part in myelin synthesis and neurotransmitter                      susceptibility (Liu et al., 2015; Rumble, 2020).
production (Mills et al., 2010). On the other hand, there has                                Mean magnetic susceptibility of organic tissues is determined
been a growing body of evidence in recent decades suggesting                             by their composition and the magnetic susceptibility of their
a role for iron in the pathology of neurodegenerative diseases,                          constituents. The brain tissue is generally weakly diamagnetic
such as Alzheimer’s disease (AD), Parkinson’s disease (PD), and                          since water (slightly diamagnetic) constitutes 70–85% of the
Huntington’s disease (HD) (Masaldan et al., 2019).                                       brain. Magnetic susceptibility varies slightly among brain
   The proposed role of iron in neurodegeneration is mediated                            regions due to the differences in their tissue composition. The
through two mechanisms. In the first mechanism that can occur                            major contributors to the measurable changes of magnetic
in all individuals regardless of illness, iron induces oxidative                         susceptibility across the brain are myelin (weakly diamagnetic)
damage through production of reactive oxygen species and                                 and iron-containing molecules (mostly strongly paramagnetic).
orchestrates “ferroptosis,” a recently identified form of iron-                          The largest proportion of non-heme iron in the brain is bound
mediated cell death (see more about ferroptosis at Dixon et al.,                         to ferritin, which makes up the greatest contribution to the
2012) (Ndayisaba et al., 2019). The second mechanism is more                             tissue magnetic susceptibility among all iron compounds.
disease-specific. Iron has been shown to interact with hallmark                          Other forms of iron, including free and transferrin-bound
features of neurodegenerative illnesses, such as amyloid-β (Aβ)                          iron only minimally contribute to the measured mean tissue
plaques, α-synuclein aggregates, and tau protein. The interplay                          susceptibility (Liu et al., 2015; Deistung et al., 2017; Duyn
between iron and these proteins promotes their production and                            and Schenck, 2017). Another iron-containing complex
aggregation, and incorporation of iron in their structure further                        that is abundant in the substantia nigra pars compacta
increases the oxidizing capacity resulting in neuronal cell death                        (SNc) and locus coeruleus and constitutes a main source
(Masaldan et al., 2019; Ndayisaba et al., 2019).                                         of magnetic susceptibility in these areas is neuromelanin.
   For the reasons mentioned above, in vivo evaluation of                                Neuromelanin is a dark pigment with a structure similar to
brain iron has been of great interest in neurodegenerative                               melanin found in the skin and iris. It is produced from the
diseases. Magnetic resonance imaging (MRI) can detect iron due                           oxidation of DOPA and dopamine and has high affinity and
to its high magnetic susceptibility. Magnetic susceptibility                             capacity for chelation of iron and other metals, constituting
is a dimensionless physical property that indicates the                                  a major iron storage site in the catecholaminergic ganglia
                                                                                         (Haining and Achat-Mendes, 2017).
Abbreviations: Aβ, Amyloid-β; AD, Alzheimer’s disease; ALS, Amyotrophic
                                                                                             MRI sequences that are sensitive to tissue magnetic
lateral sclerosis; ALSFRS, Amyotrophic lateral sclerosis Functional Rating Scale;        susceptibility are used for investigation of iron. The contrast
aMCI, amnestic mild cognitive impairment; AR-PD, akinetic-rigid Parkinson’s              in susceptibility-based MRI techniques, such as susceptibility
disease; AUC, area under curve; CN, caudate nucleus; CNS, central nervous                weighted imaging (SWI), T2 ∗ -weighted imaging (quantifying
system; CSF, cerebrospinal fluid; CST, corticospinal tract; DLB, dementia with           effective transverse relaxation), R2 ∗ imaging (reciprocal of T2 ∗ ),
Lewy bodies; DM1, myotonic dystrophy 1; DM2, myotonic dystrophy 2; DN,
dentate nucleus; DTI, diffusion tensor imaging; FD, Fabry disease; FRDA,
                                                                                         and quantitative susceptibility mapping (QSM), arises from
Friedreich’s ataxia; GP, globus pallidus; GRE, gradient (recalled) echo; GRE,            microscopic magnetic field shifts due to the variations of tissue
gradient echo; H&Y, Hoehn and Yahr; HD, Huntington’s disease; iLSQR,                     magnetic susceptibility. Recently developed QSM techniques
iterative LSQR; LSQR, sparse linear equation and least-squares; MCI, mild                provide quantitative estimates of local magnetic susceptibility
cognitive impairment; MEDI, morphology enabled dipole inversion; MMSE,
                                                                                         at a voxel-level (Deistung et al., 2017). In each voxel, the local
mini-mental status examination; MoCA, Montreal cognitive assessment; MPAN,
mitochondrial membrane protein-associated neurodegeneration; MRI, magnetic               magnetic field that is used to calculate susceptibility is comprised
resonance imaging; MSA, multiple system atrophy; NBIA, neurodegeneration                 of the background field (magnetic field from sources outside
with brain iron accumulation syndromes; nMEDI, non-linear MEDI; PD,                      the brain or even outside the scanner), the magnetic field from
Parkinson’s disease; PDF, projection onto dipole fields; PET, positron emission          neighboring voxels, and the local magnetic field produced by the
tomography; PKAN, pantothenate-kinase-associated neurodegeneration; PLS,
                                                                                         tissue within the voxel. The main strength of QSM compared
progressive primary lateral sclerosis; PSP, progressive supranuclear palsy;
QSM, quantitative susceptibility mapping; RE-SHARP, regularization-enabled               to traditional susceptibility-sensitive imaging techniques is
SHARP; RN, red nucleus; ROC, receiver operating characteristic curve; SCA,               that it disentangles the local magnetic field from the non-local
spinocerebellar ataxia; SHARP, sophisticated harmonic artifact reduction for             contributions by solving a complex field-to-source inversion
phase; SN, substantia nigra; SNc, substantia nigra pars compacta; SNr, substantia        problem (Haacke et al., 2015). Advanced inference techniques
nigra pars reticulata; SOD1, superoxide dismutase 1; STN, sub-thalamic nucleus;
SWI, susceptibility weighted imaging; TD-PD, tremor-dominant Parkinson’s
                                                                                         enable QSM to localize, quantify, and produce a voxel-wise
disease; UPDRS, unified Parkinson’s disease rating scale; V-SHARP, variable-radius       mapping of mean tissue susceptibility (Haacke et al., 2015; Wang
SHARP; WD, Wilson’s disease.                                                             and Liu, 2015).

Frontiers in Neuroscience | www.frontiersin.org                                      2                                   February 2021 | Volume 15 | Article 618435
Ravanfar et al. QSM in Neurodegenerative Diseases
In the deep gray matter structures, due to less confounding was registered at the International Prospective Register of
effect from myelin and negligible contribution from other Systematic Reviews (https://www.crd.york.ac.uk/prospero/)
paramagnetic metals, QSM has been shown to reliably quantify (CRD42020168598) and was also published as a preprint at the
changes of iron content (Langkammer et al., 2012). The publicly available domain, MedRXiv (Ravanfar et al., 2020).
accuracy of QSM in identifying iron deposition in these We searched MEDLINE (PubMed interface), Embase (Ovid
regions has been validated in post-mortem studies showing interface), Scopus, and PsycInfo (Ovid interface) databases. To
significant correlations between QSM contrast and histochemical ensure the inclusiveness of our search, we examined the reference
measurement of iron (Langkammer et al., 2012; Sun et al., 2015; lists of reviewed studies and relevant literature reviews to
Hametner et al., 2018; Lee et al., 2018; Lewis et al., 2018; Wang identify any further relevant records. Literature search strategies
et al., 2020). In the white matter, on the other hand, alterations were developed to identify any record containing QSM or
in magnetic susceptibility measured by QSM may result from “quantitative susceptibility mapping” and any disease name
changes in myelin as well as iron. In other words, in the basal under the Medical Subject Headings (https://www.ncbi.nlm.
ganglia, an increased magnetic susceptibility is most likely arising nih.gov/mesh/) subheading for “neurodegenerative diseases” in
from an increase in iron content (except in the conditions their title, abstract and keywords. Details of our search strategy
where other paramagnetic metals are also increased), while such can be found in our systematic review protocol, provided in
increase in the white matter can be a result of both an increase Supplementary Material 1. The initial search was performed in
in iron, a decrease in myelin (demyelination) or both (Hametner January 2020 and amended in April 2020 to include all studies
et al., 2018). published during the time of preparing the manuscript.
Over the past decade, QSM has been used by an increasing
number of studies in investigations of brain changes in
neurodegenerative disorders. In this paper, we systematically
Study Selection
Authors PR and SL independently screened the records for
reviewed existing human studies that investigated brain changes
inclusion according to the eligibility criteria specified below. In
in neurodegenerative diseases using QSM. It is important
the first stage, titles and abstracts were screened and studies that
to note that QSM does not directly measure iron content,
met our eligibility criteria were included. Full text records of the
rather it provides an accurate measurement of tissue magnetic
studies included in the first stage were obtained and screened in
susceptibility. To determine whether the alterations in magnetic
the second stage for final decision on inclusion or exclusion. The
susceptibility are indicative of changes in iron content, the
two reviewers discussed any disagreements and if a consensus
brain region where such changes are observed (white vs. gray
could not be reached, a third reviewer (CP) adjudicated the case.
matter), as well as the pathophysiologic processes involved in
Studies included in this review were human studies published as
each neurodegenerative disease should be taken into account.
journal articles in English without any limitation of publication
Therefore, in reporting the findings from QSM studies, we
date, according to the following criteria.
present the direct measures made by QSM, which is tissue
magnetic susceptibility. In the discussion section, we will provide
the implications of the findings in terms of brain iron changes in Design
each neurodegenerative disease separately. We included cross-sectional and longitudinal case control
The overarching aim of this review was to determine studies, retrospective and prospective. Case reports and case
regional disease-specific patterns of brain iron distribution series were not included.
in these disorders. To this end, we sought to address the
following questions: Participants
We included studies investigating patients who were
• Are there any differences in brain tissue magnetic formally diagnosed with any of the disorders recognized as
susceptibility in patients with neurodegenerative diseases a neurodegenerative disease according to the National Institute
in comparison to healthy individuals? of Health, Medical Subject Headings (MeSH), regardless of age.
• In patients with neurodegenerative diseases, do the regional It should be noted that although a large number of QSM studies
changes of magnetic susceptibility correlate with the clinical in multiple sclerosis exist, since the disorder is not classified as
manifestations of the disease and the areas that are most a neurodegenerative disease in MeSH, it has not been included
affected in these conditions? in this review [Studies of QSM in individuals with MS have been
• Is there evidence that the pattern of magnetic reviewed elsewhere (Lee et al., 2017)].
susceptibility changes identified by QSM can differentiate Only those studies that presented the results from an
neurodegenerative diseases? independent sample of data were included. If a study population
was used in more than one study, only the first published study
was included provided that it satisfied other eligibility criteria.
METHODS AND MATERIALS
Search Protocol Investigations
This review followed the Preferred Reporting Items for Of interest to this review were the studies investigating the brain
Systematic Reviews and Meta-Analyses (PRISMA) guidelines structure in neurodegenerative diseases using QSM imaging with
(Moher et al., 2009; Shamseer et al., 2015). Our protocol MRI scanners of any field strength. Studies that used other
Frontiers in Neuroscience | www.frontiersin.org 3 February 2021 | Volume 15 | Article 618435Ravanfar et al. QSM in Neurodegenerative Diseases
FIGURE 1 | PRISMA flow diagram for inclusion of records (Moher et al., 2009).
susceptibility-based imaging techniques, such as SWI, T2 ∗ , and • examined the relationship of QSM indices with pathologic
R2 ∗ without QSM were excluded. markers of the disease.
Studies that focused on the QSM protocols and technical aspects
using a population of either healthy participants or patients
Comparators without any comparison between patients and healthy groups
Included studies were those that: were excluded.
• compared QSM findings between each neurodegenerative
disease and healthy controls and/or, Outcomes
• compared different subtypes or clinical features of a The outcome measure of interest for this review was magnetic
disease and/or, susceptibility reported in ppm (parts per million) or ppb (parts
Frontiers in Neuroscience | www.frontiersin.org 4 February 2021 | Volume 15 | Article 618435Ravanfar et al. QSM in Neurodegenerative Diseases
per billion). In some studies, mean susceptibility values of the In the following sections, we will present the findings of
brain regions of interest (ROIs) were not reported, but the results the review for each neurodegenerative disease structured into
from inter-group comparisons and correlation analyses were the following subheadings: (1) changes in tissue magnetic
provided. This was not considered as an exclusion factor. susceptibility when compared to healthy controls; (2)
correlations between QSM findings and clinical features or
Data Extraction, Synthesis, and Quality other pathologic biomarkers; and (3) accuracy of QSM in
differentiation of patients from healthy individuals. Reported
Assessment changes of susceptibility in the brain regions examined by
Relevant information was extracted and recorded in summary
each study and the calculated effect size for the inter-group
tables for each study by PR and SL independently and compared
differences are summarized in color-coded Tables 2A–J. Detailed
for discrepancies. Quality assessment was performed by
characteristics, main findings and quality assessment of studies
evaluating the risk of bias in each study using a modified
are provided in the Supplementary Tables 1A–H. A summary
version of the National Heart, Lung, and Blood Institute
of susceptibility changes across all neurodegenerative diseases
quality assessment tool for case-control studies which
reviewed in this paper are presented in Table 3.
was customized to improve its application to our target
As shown in Table 1, there are very few QSM studies published
studies (Supplementary Material 1). Factors, such as unclear
in most neurodegenerative diseases. To adhere to the reporting
description of study population and eligibility criteria, data
standards for systematic reviews, we have included and presented
processing by researchers who were not blinded to the clinical
the findings of all existing studies. However, to improve the
characteristics of subjects, inconsistent MRI acquisition and/or
readability of this paper, for the rare neurodegenerative diseases
QSM processing, and failure to account for confounders, such
where fewer than three studies have been published (FRDA,
as age in the statistical analysis, were considered to pose a risk
SCA, Fabry disease, DM, PKAN, and MPAN), their relevant
of bias and reduce the quality of the study. Based on these
subheadings in the results and discussion sections have been
factors, the risk of bias was reported as “high,” “medium,” and
presented in Supplementary Material 3 instead of the main text.
“low” for each study. The data extraction table and quality
Although, in the same way as the other disorders, their findings
assessment tool are available in the systematic review protocol
are presented in the Supplementary Tables 1F–H, 2, and the
(Supplementary Material 1).
color coded tables (Tables 2I,J, 3).
Due to the different methods of MRI acquisition, QSM
processing, brain segmentation, and QSM reference regions Alzheimer’s Disease and Mild Cognitive
among the reviewed studies, a meta-analysis was not possible.
Impairment (MCI)
However, in an effort to quantify the magnitude of magnetic
Magnetic Susceptibility Changes in Alzheimer’s
susceptibility differences between patient and healthy control
Disease and Mild Cognitive Impairment in
groups reported by each study, we calculated the effect size
(Hedge’s g) for each ROI where the mean and standard
Comparison With Healthy Individuals
This review included 10 studies that used QSM to evaluate brain
deviation (or standard error of mean) were reported. Data
iron changes in AD, five studies that included a group of MCI
synthesis was conducted as a narrative report with tables used
subjects (with or without an AD group), and two studies that
to summarize and demonstrate the patterns of alteration in
investigated the association of QSM and Aβ or APOE4 gene in
magnetic susceptibility across the reviewed studies for each
a healthy population (see Supplementary Table 1A).
neurodegenerative disease.
RESULTS TABLE 1 | Number of records included in this review for each neurodegenerative
disease.
Search Summary Neurodegenerative disease Number of studies
A total of 642 records were found in our search across the included
four different databases. After removal of 315 duplicates, the
remaining 327 studies were screened for eligibility, of which Alzheimer’s disease 13
80 were included in our review (see Figure 1 for PRISMA Parkinsonian diseases 43
flow diagram). Amyotrophic lateral sclerosis 8
The neurodegenerative diseases investigated in these studies Wilson’s disease 4
included: AD, PD, HD, amyotrophic lateral sclerosis (ALS), Huntington’s disease 3
Wilson’s disease (WD) and rare genetic neurodegenerative Friedreich’s ataxia 2
diseases including Friedreich’s ataxia (FRDA), multiple system Spinocerebellar ataxia 2
atrophy (MSA), myotonic dystrophy (DM), spinocerebellar Fabry disease 1
ataxia (SCA), progressive supranuclear palsy (PSP), Fabry Myotonic dystrophy 1
disease, and syndrome of neurodegeneration with brain iron Pantothenate-kinase-associated neurodegeneration 2
accumulation (NBIA). Table 1 shows the number of studies Mitochondrial membrane protein-associated 1
found for each neurodegenerative disease. neurodegeneration
Frontiers in Neuroscience | www.frontiersin.org 5 February 2021 | Volume 15 | Article 618435Frontiers in Neuroscience | www.frontiersin.org
Ravanfar et al.
TABLE 2 | Color-coded tables for magnetic susceptibility changes in the regions of interest in each neurodegenerative disease.
(A) Summary of QSM changes in the subcortical structures in AD and MCI.
References Sample size (age, years) BG PUT GP CN AMY HP TH PUL NA SN DN RN
Acosta-Cabronero et al. Early-stage probable AD: 8 (72 ± 6) ↑ ↑ ↑
(2013) HC: 8 (70 ± 5)
Young HC: 3 (32 ± 2)
Van Bergen et al. (2016b) aMCI: 15 (75.27 ± 7.63) −0.123 −0.235 −0.176 −0.077 0.072 −0.149 0
HC: 22 (71.91 ± 5.25)
Moon et al. (2016) Probable AD: 27 (78.63 ± 8.11) 1.315 0.335 0.945 0.244
HC: 18 (46.89 ± 14.69)
Hwang et al. (2016)a HC: 18 (65.2 ± 6.41)
aMCI: 18 (66.9 ± 5.51)
AD: 18 (69. 9 ± 9.81)
Ayton et al. (2017)a HC: 64 (not reported)
MCI: 17 (not reported)
AD:19 (not reported)
Kim et al. (2017) HC: 19 (65.37 ± 6.29) 2.765 1.283 ↑ 5.832 5.799 4.761 3.885
AD: 19 (69.79 ± 10.27)
HC: 19 (65.37 ± 6.29) 2.115 0.146 2.271 3.047 3.107 2.515
aMCI: 19 (65.95 ± 6.75)
6
Du L. et al. (2018) HC: 30 (66.2 ± 7.8) ↑ ∼ ↑ ↓ ↓ ↓ ↓
Mild-Moderate AD: 30 (68.3 ± 6.6)
Tiepolt et al. (2018) HC: 10 (67.1) Left: Left:
AD: 10 (74.1) 9.225 22.349
Right: Right:
7.897 19.18
Meineke et al. (2018) Mild to moderate AD: 6 (58 ± 6) ↑ ↑ ↑ ∼ ↓
HC: 10 (59 ± 7)
MCI: 8 (63 ± 6) ↑ ↓ ↑ ∼ ↓
HC: 10 (59 ± 7)
Kan et al. (2020) HC: 19 (71 ± 5) ↑ ↑ ↑
AD: 38 (80 ± 6)
February 2021 | Volume 15 | Article 618435
QSM in Neurodegenerative DiseasesFrontiers in Neuroscience | www.frontiersin.org
Ravanfar et al.
TABLE 2 | Continued
(B) Summary of QSM changes in the cortical regions in AD and MCI
References Sample size (age, Whole Entorhinal Frontal Temporal Parietal Occipital Cingulate Insula Neocortex Allocortex
years) cortex cortex
Acosta-Cabronero et al. Early-stage probable ↑ ↑ ↑
(2013) AD: 8 (72 ± 6)
HC: 8 (70 ± 5)
Young HC: 3 (32 ± 2)
Van Bergen et al. (2016b) aMCI: 15 (75.27 ± 7.63) 0.154 0.058 0.227 −0.04 0.024
HC: 22 (71.91 ± 5.25)
Hwang et al. (2016) HC: 18 (65.2 ± 6.41)
aMCI: 18 (66.9 ± 5.51)
AD: 18 (69. 9 ± 9.81)
Ayton et al. (2017) HC: 64 (not reported)
MCI: 17 (not reported)
AD:19 (not reported)
Kim et al. (2017) HC: 19 (65.37 ± 6.29) Allocortex: 5.738 precentral gyrus ↑ postcentral Anterior: ↑ 6.566 6.57
AD: 19 (69.79 ± 10.27) 6.570 parahippocampal gyrus, 6.251
Neocortex: gyrus, rt superior Precuneus: Posterior:
6.566 and transverse 6.059 5.643
temporal gyrus
HC: 19 (65.37 ± 6.29) Allocortex: 2.594 Precuneus: Anterior:
7
aMCI: 19 (65.95 ± 6.75) 4.260 3.867 3.670
Posterior:
3.76
Tiepolt et al. (2018) HC: 10 (67.1) Left superior left superior left lingual left anterior Left:
AD: 10 (74.1) orbitofrontal temporal cortex: gyrus: 1.751 cingulate −11.225
cortex: −13.680 cortex:
−17.302 left medial −2.443
right mesial temporal cortex:
orbitofrontal −6.501
cortex: 0.333 left inferior
temporal
cortex:−13.776
February 2021 | Volume 15 | Article 618435
QSM in Neurodegenerative DiseasesFrontiers in Neuroscience | www.frontiersin.org
Ravanfar et al.
TABLE 2 | Continued
(C) Summary of QSM changes in the subcortical structures in PD
References Sample size (age, years) BG PUT GP CN AMY HP TH PUL NA SN SNc SNr DN RN FN STN Nigrosome-1
Lotfipour et al. (2012) PD: 9 (66.6) ↑ ↑
HC: 11(59.2)
Ide et al. (2014) PD: 19 (72.6 ± 7.65) Lateral:
HC: 41 (69.4 ± 9.10) −0.576
Medial:
−0.26
Barbosa et al. (2015) PD: 20 (66 ± 8) −0.261 0.304 0.017 0.052 0.981 1.022 −0.240
HC: 30 (64 ± 7)
He et al. (2015) PD: 44 (58 ± 8.76) −0.73 0.34 −0.003 0.971 0.643
HC: 35 (60.49 ± 6.48)
Murakami et al. (2015) PD: 21 (72.0 ± 7.5) −0.176 −0.215 0 0.023 1.752 −0.343
HC: 21 (69.7 ± 8.6)
Azuma et al. (2016) PD: 24 (63.3 ± 11.0) −0.309 −0.322 −0.004 1.087 0.075
HC: 24 (64.1 ± 10.0)
Peckham et al. (2016) PD: 18 (69.1 ± 11.2) ↑ ↑
HC: 16 (64.4 ± 6.1)
Langkammer et al. PD: 66 (64.7 ± 8.8) 0 0.464 0.002 0.497 0.669 0.446
(2016) HC: 58 (65.0 ± 9.3)
Du et al. (2016) PD: 47 (65.8 ± 10.1) 1.02
8
HC: 47 (62.2 ± 8.8)
He et al. (2017) TD-PD: 19 (62.7 ± 8.2) 0.656
HC: 48 (61.7 ± 6.5)
Sjöström et al. (2017) PD: 62 (65.2 ± 10.5) ∼ ↑ ↑ ↓
HC: 14 (63.5 ± 5.3)
Ito et al. (2017) PD: 26 (64)
HC: 20 (68.5)
Xuan et al. (2017) EOPD: 35 (50.0 ± 5.3) −0.071 −0.072 0 0.703 0.616 0.098
Younger HC: 24 (51.8 ± 7.5)
M-LOPD: 33 (61.9 ± 6.0) 0.57 0.114 −0.448 0.891 0.594 0.538
Older HC: 22 (63.1 ± 7.3)
February 2021 | Volume 15 | Article 618435
Guan et al. (2017b) TD-PD: 27 (55.3 ± 9.0) ↑ ↓ ↓ ↑ ↑ ↑ ↑ ↑
HC: 40 (56.6 ± 9.9)
QSM in Neurodegenerative Diseases
AR-PD: 27 (55.4 ± 9.9) ↑ ↑ ↓ ↑ ↑ ↑ ∼ ↑
HC: 40 (56.6 ± 9.9)
Guan et al. (2017a) ES-PD: 15 (55.8 ± 8.3) ↑ −0.046 ↓ ↑ ↑ ↑ ↑
HC: 40 (56.6 ± 9.9)
LS-PD: 45 (61.1 ± 6.7) ↑ 0.853 ↓ ↑ ↑ ↑ ↑
HC: 40 (56.6 ± 9.9)
Zhao et al. (2017) PD: 29 (67.9 ± 6.7) 0.147 −0.141 −0.316 0.771 −0.078
HC: 25 (64.7 ± 8.3)
(Continued)Frontiers in Neuroscience | www.frontiersin.org
Ravanfar et al.
TABLE 2 | Continued
(C) Summary of QSM changes in the subcortical structures in PD
References Sample size (age, years) BG PUT GP CN AMY HP TH PUL NA SN SNc SNr DN RN FN STN Nigrosome-1
Acosta-Cabronero PD: 25 (63.6 ± 8.6) ↑ ↑ ↓ ↑ ↑ ↑ ↑ ↓ ↑
et al. (2017) HC: 50 (63.6 ± 8.5)
Takahashi et al. PD: 39 (69.24 ± 6.04) 0.703
(2018b) HC: 25 (67.14 ± 6.81)
Kim et al. (2018) ES-PD: 38 (68.3 ± 9.2) 1.855
HC: 25 (65.0 ± 6.3)
Du G. et al. (2018) PD: 72 (66.3 ± 9.5) 0.761 0.681 0.067
HC: 62 (66.2 ± 10.2)
Shin et al. (2018) High-NMS: 13 (69.8 ± 11.2) 0.281 0.235 0.353 0.277 0.361 0.197 0.466
HC: 19 (67.6 ± 8.0)
Low-NMS: 16 (71.4 ± 6.8) 0.11 0.106 0.28 0.098 0.275 −0.094 0.313
HC: 19 (67.6 ± 8.0)
Takahashi et al. ES-PD: 18 (71.2 ± 6.94) 0.741
(2018a) HC: 18 (67.1 ± 4.75)
An et al. (2018) PD: 44 (67.3 ± 9.8) 0.736
HC: 31 (66.9 ± 9.0)
Li et al. (2018) PD: 31 (63.1 ± 8.3) ↓ ↑ ↓ ↑ (Rt)↑ (Rt) ↑ ↑ ↓ ↑
HC: 27 (62.0 ± 7.0)
9
Guan et al. (2019b) PD: 90 (59.38 ± 8.54) ↑ ↑
HC: 38 (57.93 ± 8.04)
Chen et al. (2019) PD: 33 (64.55 ± 11.2) 0.616 GPi: 1.143 0.258 1.838 0.507 0.111 0.707 1.357 0.296
HC: 26 (62.62 ± 10.62) 0.553
Li et al. (2019) PD: 28 (68.20 ± 6.1) 0.714
HC: 28 (64.75 ± 8.0)
Azuma et al. (2019) PD: 18 (69.6 ± 6.2) −0.428 −0.474 0.046 1.085 0.705
HC: 18 (69.1 ± 7.0)
Shahmaei et al. (2019) PD: 30 (66.2 ± 8.5) −0.421 2.449 −0.085 0.995 4.016 1.758
HC: 15 (64.9 ± 9.2)
Sethi et al. (2019) PD: 20 (67.0 ± 10) 1.446 0.189
HC: 174 (45.1 ± 14.2)
February 2021 | Volume 15 | Article 618435
Uchida et al. (2019) PD: 22 (70.8 ± 5.9) 0.369 0.201 0.203 0.371 0.131 0.107 0.237 0.033
HC: 20 (71.4 ± 5.2)
QSM in Neurodegenerative Diseases
PD-MCI: 24 (74.9 ± 5.5) 0.373 0.268 0.417 0.356 0.25 0.158 0.269 0.095
HC: 20 (71.4 ± 5.2)
Sun et al. (2019) PD: 32 (61.6 ± 6.5) −0.174 1.022 0.087 1.701 0.874
HC: 50 (62.0 ± 7.5)
Cheng et al. (2019) PD: 87 (60.9 ± 8.1) 0.641
HC: 77 (63.4 ± 7.3)
Ghassaban et al. PD: 25 (61.8 ± 6.4) 1.157 0.036 0.987 0.061 1.073 3.949 1.212 1.018
(2019) HC: 24 (63.4 ± 8.0)
(Continued)Frontiers in Neuroscience | www.frontiersin.org
Ravanfar et al.
TABLE 2 | Continued
(C) Summary of QSM changes in the subcortical structures in PD
References Sample size (age, years) BG PUT GP CN AMY HP TH PUL NA SN SNc SNr DN RN FN STN Nigrosome-1
Wang et al. (2019) PD: 35 (71.0 ± 7.4) −0.103 0.273 −0.262
HC: 37 (70.4 ± 7.8)
Bergsland et al. (2019) PD: 18 (60.1 ± 6.2) 0.761
HC:16 (58.1 ± 8.7)
Ahmadi et al. (2020) PD: 23 (68.8 ± 8.7) ↑
HC: 27 (65.7 ± 6.5)
Thomas et al. (2020) PD: 100 (64.5 ± 7.7) ↑ 0.504
HC: 37 (66.1 ± 9.4)
10
(D) Summary of QSM changes in the subcortical structures in PSP
References Sample size (age, PUT CN GP SN RN STN HP NA AMY
years)
Ito et al. (2017)b PSP: 14 (68.5) Anterior ↑ ↑
PD: 26 (64)
February 2021 | Volume 15 | Article 618435
Sjöström et al. (2017) PSP: 15 (69.1 ± 6.0) ↑ ↑ ↑ ↑
HC: 14 (63.5 ± 5.3)
QSM in Neurodegenerative Diseases
Mazzucchi et al. PSP:13 (70.3 ± 5.9) 0.919 0.201 0.349 0.908 1.94 1.523
(2019)b PD: 35 (61.0 ± 8.6)
Wang et al. (2019) PSP: 17 (72.5 ± 9.7) 0.506 −0.455 −0.043
HC: 37 (70.4 ± 7.8)
Azuma et al. (2019) PSP: 8 (69.5 ± 7.7) 0.898 0.636 1.459 2.474 1.315
HC: 18 (69.1 ± 7.0)Frontiers in Neuroscience | www.frontiersin.org
Ravanfar et al.
TABLE 2 | Continued
(E) Summary of QSM changes in the subcortical structures in MSA
References Sample size (age, PUT CN GP SN RN DN STN HP NA AMY
years)
Ito et al. (2017)b MSA-P: 6 (67.5) Posterior ↑ ∼
PD: 26 (64)
Sjöström et al. (2017) MSA: 11 (68.9 ± 13.1) ↑ ↑ ↑ ↑
HC: 14 (63.5 ± 5.3)
Mazzucchi et al. MSA: 12 (65.6 ± 8.1) 1.234 0.134 0.344 0.341 0.842 1.071
(2019)c PD: 35 (61.0 ± 8.6)
Wang et al. (2019) MSA-P: 16 (66.4 ± 8.2) −0.029 −0.492 −0.285
HC: 37 (70.4 ± 7.8)
Sugiyama et al. (2019) MSA-C: 28 (63.8 ± 9.5) ∼ ↓ ↑ ↑ ∼ ↑
HC: 23 (62.9 ± 8.1)
11
(F) Summary of QSM changes in the subcortical structures in ALS and PLS
References Sample size (age, years) Motor Cortex PUT GP RN SN HP Subcortical white matter Corticospinal tract
Schweitzer et al. (2015)c Motor neuron disease: 16 (56.3) 1.159
(ALS: 12, PLS: 4)
HC: 23 (56.6)
Costagli et al. (2016) ALS: 17 (62 ± 11) 0.85
HC: 13 (55 ± 11)
February 2021 | Volume 15 | Article 618435
Lee et al. (2017) ALS: 26 (61.08) 0.275 −0.355
HC: 26 (60.88)
QSM in Neurodegenerative Diseases
Acosta-Cabronero et al. (2018) ALS: 28 (61) 0.842 ↑ 0.777 0.849 0.816 ↑ −0.674
HC: 39 (61)
Weidman et al. (2019)c ALS/PLS: 43 (60.6 ± 14.9) 0.54
Non-UMN controls: 15 (58.5 ± 8.4)
Welton et al. (2019) ALS: 21 (54 ± 14) 1.134
HC: 63 (48 ± 18)
Contarino et al. (2020) ALS: 42 (61.4 ± 9.1) 0.399
HC: 23 (57.4 ± 7.3)Frontiers in Neuroscience | www.frontiersin.org
Ravanfar et al.
TABLE 2 | Continued
(G) Summary of QSM changes in the subcortical structures in WD
References Sample size (age, years) PUT GP CN SN RN TH Pons
Fritzsch et al. (2014) WD: 11 (44) 1.059 1.565 0.678 1.726 1.232
HC:10 (41)
Doganay et al. (2018) Neurologic WD: 11 (15 ± 3.3) 0.811 0.822 0.19 ↑ Right: 1.371 ↑
HC: 14 (13.2 ± 2.4)
Saracoglu et al. (2018) Asymptomatic WD: 12 (13.7 ± 3.3) ↑(left posterior) ↑ left ↑ right ↓ ↑ ↑ ↑
HC: 14 (13.2 ± 2.4)
Dezortova et al. (2019) Neurologic WD: 28 (47.1 ± 9.5) 1.742 2.282 1.831 2.234
HC: 26 (44.8 ± 11.7)
12
(H) Summary of QSM changes in the subcortical structures in HD
References Sample size (age, BG PUT GP CN AMY HP TH SN RN
years)
Premanifest HD: 31 (42.0 0.834 0.581 0.626 0.152
Domínguez et al. (2016)
± 8.9)
HC: 30 (40.4 ± 12.1)
February 2021 | Volume 15 | Article 618435
Symptomatic HD: 32 1.59 1.05 1.418 −0.115
(52.2 ± 9.2)
QSM in Neurodegenerative Diseases
HC: 30 (40.4 ± 12.1)
Van Bergen et al. (2016b) Premanifest HD: 15 (42.4 1.879 1.068 1.995 −0.479 −0.638 0.371 −0.835 −0.346
± 8.7)
HC: 16 (43.3 ± 11.7)
Chen et al. (2018) Early and premanifest HD: 0.86 0.886 0.914 0.244 0.061 0.055
24 (42.5 ± 12.9)
HC: 16 (44.8 ± 15.8)Frontiers in Neuroscience | www.frontiersin.org
Ravanfar et al.
TABLE 2 | Continued
(I) Summary of QSM changes in the brain regions in Ataxic disorders
References Sample size (age, CN GP PUT SN DN RN TH Pons Motor cortex Motor white matter
years)
Harding et al. (2016) FRDA: 30 (35.7 ± 12.2) 0.269 0.406 0.277 0.168 1.149 0.912 0
HC: 33 (36.9 ± 13.1)
Ward et al. (2019) FRDA: 20 (34.3 ± 12.5) 1.619
HC: 18 (39.7 ± 13.3)
Xie et al. (2019) SCA3: 18 (44.22 ± 5.51) 0 0.661 −0.067 0.897 0.586 0.903 0 0.256 −0.397
HC: 18 (41.33 ± 10.83)
Sugiyama et al. (2019) SCA6: 9 (60.7 ± 9.1) ↓ ↑ ↓ ∼ ↓ ↓
HC: 23 (62.9 ± 8.1)
(J) Summary of QSM changes in the subcortical structures in NBIA
References Sample size (age, years) PUT GP CN SN RN TH Internal capsule
Dusek et al. (2014) PKAN: 2 (21 and 32 years) ↑ ↑ ↑
HC: 13 (39.7 ± 13.6)
13
Zeng et al. (2019) PKAN: 6 (age range: 6-25 years) ↑ left: 1.508 Left:−1.589 Right:−0.385
HC: 8 (mean: 22.5 years)
MPAN: 4 (21.0 ± 2.9) ↓ ↑ ↑ ↑ ↓
Dusek et al. (2019)
HC: 19 (41.2 ± 14.9)
C19orf12 mutation carriers: 9 (50.4 ± 9.8) ↑ ↑ ↑ ↓ ↑
HC: 19 (41.2 ± 14.9)
a No significant difference was reported between any of the groups.
b Comparison with PD not healthy controls.
c Results demonstrated for comparison of both ALS and PLS vs. controls.
AD, Alzheimer’s disease; ALS, amyotrophic lateral sclerosis; aMCI, amnestic mild cognitive impairment; AMY, amygdala; AR, akinetic-rigid; asymp-WD, asymptotic Wilson’s disease; BG, basal ganglia; CN, caudate nucleus; DN, dentate
nucleus; EOPD, early-onset PD; ES, early stage; FN, fascicula nigrale; FRDA, Friedreich’s ataxia; GP, globus pallidus; GPi, internal globus pallidus; GPe, external globus pallidus; HC, healthy control; HD, Huntington’s disease; HP,
hippocampus; LOPD, late-onset PD; LS, late stage; MCI, mild cognitive impairment; MPAN, mitochondrial membrane protein-associated neurodegeneration; MSA, multiple system atrophy; MSA-P, Parkinsonian type MSA; MSA-C,
cerebellar type MSA; NA, nucleus accumbens; NBIA, neurodegeneration with brain iron accumulation; neuro-WD, neurologic Wilson’s disease; NMS, non-motor symptoms; PD, Parkinson’s disease; PKAN, pantothenate kinase-
February 2021 | Volume 15 | Article 618435
associated neurodegeneration; PLS, primary lateral sclerosis; PSP, progressive supranuclear palsy; PUL, pulvinar nucleus; PUT, putamen; RN, red nucleus; SCA, spinocerebellar ataxia; SN, substantia nigra; SNc, substantia nigra pars
compacta; SNr, substantia nigra pars reticulata; STN, subthalamic nucleus; TD, tremor dominant; TH, thalamus; UMN, upper motor neuron disease; UMN, upper motor neuron; WD, Wilson’s disease; VaD, vascular dementia.
QSM in Neurodegenerative Diseases
No significant difference.
Not studied.
Increased magnetic susceptibility.
Decreased magnetic susceptibility.
Red: significantly higher susceptibility in the patient group, Blue: significantly lower susceptibility in the patient group, Green: non-significant difference. Gray: ROI not studied. Numbers in each cell represent the calculated effect size
(Hedge’s g) based on the reported mean and standard deviation. Arrows indicate the direction of changes in the patient group compared with controls and ∼ indicates equal means among two groups where calculation of effect size
was not possible/data not provided. Empty cells indicate that the data required to determine the direction of inter-group differences was not provided.Ravanfar et al. QSM in Neurodegenerative Diseases
The comparison of magnetic susceptibility in the subcortical magnetic susceptibility with mini-mental state examination
structures among people with AD and healthy individuals (MMSE) and Montreal cognitive assessment (MoCA) in patients
revealed inconsistent findings. The most consistent evidence for with AD was reported in the left CN (Du L. et al., 2018)
increased susceptibility was observed in the amygdala, caudate and GP (Tiepolt et al., 2018). However, such correlations
nucleus (CN), and putamen. All three studies that investigated were not replicated in the study by Moon et al. (2016). In a
the amygdala reported increased susceptibility in both mild longitudinal study combining Aβ positron emission tomography
(Acosta-Cabronero et al., 2013) and moderate (Kim et al., 2017) (PET) and QSM in AD, MCI, and cognitively normal individuals,
stages of AD (Kan et al., 2020). In people with amnestic MCI Ayton et al. (2017) followed the study population by serial
(aMCI), the amygdala did not show any significant difference neuropsychiatric assessments and neuroimaging scans over 6
compared to healthy individuals (Van Bergen et al., 2016b). In the years. Interestingly, in both Aβ-positive and -negative subjects,
CN, six out of seven studies reported higher susceptibility in AD. magnetic susceptibility within certain ROIs was associated with
This increase was detected in both mild and moderate stages of deficits in specific cognitive domains. In the Aβ-negative group,
AD (Acosta-Cabronero et al., 2013; Moon et al., 2016; Kim et al., higher QSM in the frontal lobe and CN was associated with subtle
2017; Du L. et al., 2018; Meineke et al., 2018; Kan et al., 2020) but deterioration in language function. In the Aβ-positive individuals
not in MCI (Hwang et al., 2016; Van Bergen et al., 2016b; Ayton (MCI and AD), magnetic susceptibility of the hippocampus
et al., 2017; Meineke et al., 2018). Only a few studies reported correlated with decline in episodic memory, attention and
the mean susceptibility values in the investigated ROIs to enable executive function in serial assessments, while susceptibility
the estimation of the effect size of differences between groups values in the temporal and frontal lobes predicted decline in
(Table 2A). language functions.
Among seven studies that investigated the putamen, four In a limited number of studies, the correlation of Aβ
reported higher susceptibility in both mild and moderate AD deposition and increased magnetic susceptibility in QSM was
(Acosta-Cabronero et al., 2013; Moon et al., 2016; Du L. et al., investigated in AD. Ayton et al. (2017) reported a significant
2018; Meineke et al., 2018), while in two studies on mild to correlation of Aβ-PET signal and QSM in the frontal, parietal,
moderate and moderate AD stages, no changes were found and occipital cortices but not in the parietal lobe, hippocampus,
(Hwang et al., 2016; Kim et al., 2017). One study did not provide a CN, or cingulate gyrus. On the other hand, in the study by Tiepolt
description of disease stage in the study population (Ayton et al., et al. (2018), where authors examined the correlation of magnetic
2017). In studies of patients with MCI, none detected any change susceptibility and Aβ-PET only in the GP, no such correlation was
in susceptibility in the putamen (Hwang et al., 2016; Van Bergen detected. In a recent study, ultra-high field (9.4 and 14.1T) QSM
et al., 2016b; Ayton et al., 2017; Kim et al., 2017; Meineke et al., at a resolution of 37 µm isotropic voxels in the frontal cortex of
2018). a post-mortem brain from a patient with AD showed that the
Among other studied regions, limited evidence for increased pattern of increased susceptibility in the cortical layers strongly
susceptibility was provided in moderate AD in the hippocampus matched the Aβ depositions in histochemical staining (Tuzzi
(two out of six studies) (Kim et al., 2017; Kan et al., 2020), in mild- et al., 2020). In individuals with MCI, increased susceptibility
moderate AD in the globus pallidus (GP) (one out of six studies) significantly correlated with Aβ deposition in the cortical regions
(Tiepolt et al., 2018) and in moderate AD in the thalamus (one where altered functional coupling with the medial prefrontal
out of four studies) (Kim et al., 2017) (Table 2A). cortex was shown in fMRI (Van Bergen et al., 2016b), while
Cortical gray matter was examined in five studies. Patients in healthy individuals, the significant correlation of magnetic
with early-stage AD showed increased susceptibility in susceptibility and Aβ PET signal was detected in clusters spread
widespread regions over the temporal, parietal and occipital across the cortex and subcortical gray matter, with the strongest
cortices (Acosta-Cabronero et al., 2013). Further, in studies correlations in the GP, CN, and putamen (Van Bergen et al.,
of moderate AD, clusters of increased susceptibility were 2018).
distributed across the cortex including the frontal, parietal, The association between APOE-e4 gene and QSM was
temporal, limbic, and insular lobes (Supplementary Table 1A) investigated in two studies. Van Bergen et al. (2016b) studied
(Kim et al., 2017). Other studies, however, did not report any a group of MCI subjects (n = 15) in comparison with healthy
difference of mean susceptibility in the cortex between patients controls (n = 22). Forty percent of the MCI group and thirty-
with mild or moderate AD and healthy individuals (Hwang et al., one precent of the control group were APOE-e4 carriers. While
2016; Ayton et al., 2017; Tiepolt et al., 2018). Among four studies no differences of magnetic susceptibility in any of the ROIs
that investigated QSM in the cortex in individuals with MCI; one existed between the MCI and healthy groups, in the MCI group,
reported increased susceptibility in the precuneus, allocortex, APOE-e4 carriers had significantly higher susceptibility in the
and anterior and posterior cingulate gyrus (Kim et al., 2017), CN as well as frontal, parietal, occipital, and temporal cortices
while the others did not detect any difference between the MCI than APOE-e4 negative subjects. In another study, Kagerer et al.
and healthy groups (Hwang et al., 2016; Van Bergen et al., 2016b; (2020) reported no significant variation of susceptibility between
Ayton et al., 2017) (Table 2B). APOE-e4 positive and APOE-e4 negative cognitively healthy
adults. However, increased magnetic susceptibility and positive
Correlation of QSM Findings in AD and MCI With APOE-e4 gene status, were synergistically associated with
Clinical Features and Other Pathologic Biomarkers increased default mode network activity. This relationship was
Few studies examined the relationship between QSM changes most pronounced in the posterior cingulate cortex, precuneus,
and severity of cognitive deficits in AD. An association of and lateral parietal cortex. In this study, the authors did not
Frontiers in Neuroscience | www.frontiersin.org 14 February 2021 | Volume 15 | Article 618435Ravanfar et al. QSM in Neurodegenerative Diseases
report any correlation with the cognitive control network, which reported in a noticeable proportion of the studies (Putamen: 8
would be relevant to the disorders of cognition. out of 22, GP: 8 out of 21, and CN: 9 out of 18) (Table 2C).
In the hippocampus, significantly unilateral (Li et al.,
Diagnostic Accuracy of QSM in Differentiation of 2018) or bilateral (Acosta-Cabronero et al., 2017) higher
Patients With AD From Healthy Individuals susceptibility was reported in two out of four studies. In the
A number of studies used the Receiver Operating Characteristic thalamus, and cerebellar dentate nucleus (DN), most of the
(ROC)-curve analysis to evaluate the diagnostic accuracy of studies reported no significant changes in regional magnetic
QSM in differentiation of people with AD and MCI from susceptibility. These findings are summarized in Table 2C and
healthy subjects. In AD vs. healthy controls, high sensitivity, and Supplementary Table 1B.
specificity was observed for magnetic susceptibility of the GP In one of the first studies to investigate QSM in cortical gray
(90 and 100%, respectively) (Tiepolt et al., 2018), while the CN matter in PD, Acosta-Cabronero et al. (2017) reported increased
showed lower accuracy (sensitivity and specificity = 61.67%) (Du susceptibility in widespread regions of the cortex including the
L. et al., 2018). lateral occipital, posterior parietal, rostral middle prefrontal,
Kim et al. (2017) examined both AD and MCI in comparison and middle temporal cortex. In a further update, the same
with healthy controls. The area under curve (AUC) was 0.850, group reported increased susceptibility in prefrontal and right
0.831, and 0.803 for susceptibility of the precuneus, amygdala, insular cortices in PD (Thomas et al., 2020). In the study by
and hippocampus, respectively, showing good accuracy in Uchida et al. (2019), higher susceptibility was observed in the
differentiation of AD from healthy groups. Furthermore, in cuneus, precuneus, fusiform gyrus, insula and cerebellum in PD
differentiation of people with MCI from healthy individuals, patients. None of these studies found any brain region with
susceptibility in the hippocampus, thalamus, precuneus, and lower susceptibility in patients with PD. On the other hand,
various cortical areas showed moderate accuracy (AUC: 0.692– the mean susceptibility value of the whole cortex did not show
0.759). In the comparison between MCI and healthy controls any difference between patients with PD and healthy controls
by Hwang et al. (2016), the mean susceptibility of the in the study by Chen et al. (2019). Surprisingly, Lewy-body
white matter yielded a sensitivity of 55.56% and specificity dementia, which is characterized by cortical involvement by the
of 94.44%. same pathology as PD (α-synuclein), has not been examined in
QSM studies.
Parkinsonian Diseases In one study investigating white matter QSM in PD,
Forty-three studies using QSM in the investigation of brain iron Guan et al. (2019a) reported alterations in widespread
in PD and other parkinsonian diseases, such as MSA, PSP, and areas in the frontal, temporal, and parietal lobes (details in
corticobasal degeneration were included in this review. Supplementary Table 1B). In the inferior longitudinal fasciculus,
there were increases in both magnetic susceptibility and radial
Magnetic Susceptibility Changes in Parkinsonian diffusivity measured by diffusion tensor imaging (DTI).
Diseases in Comparison With Healthy Individuals In six studies, QSM was compared between controls and
Thirty-seven studies reported the measurement and comparison PD or other parkinsonian syndromes, such as PSP and MSA
of magnetic susceptibility in the subcortical gray matter (Tables 2D,E). Compared to healthy controls, susceptibility was
structures among the PD and control groups. Of this, 33 increased in the RN, SN, and GP in PSP (Sjöström et al.,
investigated the SN or its subregions [SNc and substantia nigra 2017; Azuma et al., 2019), in the RN, putamen, and SN,
pars reticulata (SNr)], with 30 (90.9%) reporting significantly in MSA (Sjöström et al., 2017), and in the DN and SN
increased magnetic susceptibility in PD (Table 2C). Investigated in cerebellar type of MSA (MSA-C) (Sugiyama et al., 2019).
in one study, magnetic susceptibility in the SN was also Compared to PD, magnetic susceptibility was higher in the SN,
increased in idiopathic REM sleep behavior disorder which is subthalamic nucleus (STN), putamen, and RN in both patients
considered as a prodromal phase for synucleinopathies with with MSA and PSP, while in PSP, higher susceptibility was
high rates of conversion to PD (Sun et al., 2019). The next further detected in the GP (Ito et al., 2017; Sjöström et al.,
most investigated region was the red nucleus (RN) (22 studies), 2017; Azuma et al., 2019; Mazzucchi et al., 2019). In comparison
where seven studies (31.8%) reported increased susceptibility with PD, patients with parkinsonism dominant MSA (MSA-
in PD (Table 2C). Figures 2, 3 demonstrate the effect sizes for P) showed higher susceptibility in the posterior putamen (Ito
susceptibility differences in the SN and RN respectively, in et al., 2017), lateral SN, STN, and RN (Mazzucchi et al., 2019)
patients with PD compared to healthy individuals. (Supplementary Table 1B).
The alterations in susceptibility were less consistent in the Studies comparing PSP and MSA reported higher
basal ganglia in PD patients. Only four of 22 studies (18.1%) of susceptibility of the GP, RN, and the medial part of the SN
the putamen showed a significant increase in susceptibility while in PSP (Sjöström et al., 2017; Mazzucchi et al., 2019). The only
one study reported significantly decreased susceptibility in the study that compared limbic structures among PD, MSA, and
putamen (He et al., 2015). Six of 21 studies (28.6%) investigating PSP using QSM, reported no susceptibility differences in the
the GP reported increased susceptibility and only one of 18 hippocampus, amygdala, and nucleus accumbens (Wang et al.,
studies (5.5%) reported significantly higher susceptibility in the 2019). Nevertheless, it should be noted that in some of the studies
CN. It is worth mentioning that, while not statistically significant, on MSA, PSP, and PD, study groups were not matched based
a trend toward lower susceptibility in the basal ganglia was on age and disease characteristics. In the study by Mazzucchi
Frontiers in Neuroscience | www.frontiersin.org 15 February 2021 | Volume 15 | Article 618435Ravanfar et al. QSM in Neurodegenerative Diseases
FIGURE 2 | Parkinson’s disease: Effect sizes for the intergroup differences of magnetic susceptibility in the SN, SNr, and SNc between PD and healthy groups. Red
bars indicate significantly higher susceptibility in the patient group, while green color shows a non-significant difference.
et al. (2019), patients with PSP were older than the MSA and PD (Ghassaban et al., 2019). Additionally, this correlation was not
groups. In the study by Ito et al. (2017) patients with PD were found in any of the other subcortical structures including the
at lower disease stages compared to the other groups. Also in GP, putamen, CN, thalamus, RN, and cerebellar DN (Barbosa
the studies by Mazzucchi et al. (2019) and Wang et al. (2019), et al., 2015; Langkammer et al., 2016; Shin et al., 2018; Sun et al.,
the PD group had lower clinical severity scores compared to the 2019).
other groups. In the PD studies included, disease progression stage was
generally assessed by Hoehn and Yahr (H&Y) scale and clinical
Correlation of QSM Findings in PD With Clinical severity of symptoms were evaluated by Unified Parkinson’s
Features and Other Pathologic Biomarkers Disease Rating Scale (UPDRS). H&Y staging evaluates the
In addition to the comparison of QSM in various brain regions overall clinical progression of motor impairments in PD on
among PD and healthy individuals, studies have also evaluated a scale of 1–5, with a score of 1 indicating limited unilateral
its correlation with duration and severity of symptoms, disease involvement and 5 indicating a wheelchair-bound or bedridden
stage, and clinical features of PD. Magnetic susceptibility of state (Goetz et al., 2004). UPDRS is a PD severity assessment
the SN (He et al., 2015) and SNc (Du et al., 2016) were scale, comprised of three parts: UPDRS-I evaluates mental
shown to positively correlate with disease duration, however, status and cognition; UPDRS-II assesses the impairment of
such a correlation has not been agreed upon by all studies daily activities; and UPDRS-III evaluates the severity of motor
Frontiers in Neuroscience | www.frontiersin.org 16 February 2021 | Volume 15 | Article 618435Ravanfar et al. QSM in Neurodegenerative Diseases
FIGURE 3 | Parkinson’s disease: Effect sizes for the intergroup differences of magnetic susceptibility in the RN between PD and healthy groups. Red bars indicate
significantly higher susceptibility in the patient group, while green color shows a non-significant difference.
dysfunction (Movement Disorder Society Task Force on Rating severity (Guan et al., 2017b; He et al., 2017; Mazzucchi et al.,
Scales for Parkinson’s Disease, 2003). 2019). Additionally, the patients with akinetic-rigid PD showed
The majority of evidence indicates a significant association of higher susceptibility in the CN compared to those with tremor-
susceptibility in the SN and its subfields with H&Y illness stage dominant disease (Guan et al., 2017b).
(Langkammer et al., 2016; Guan et al., 2017a,b; Xuan et al., 2017;
An et al., 2018; Chen et al., 2019; Shahmaei et al., 2019). A simlar Cognitive Impairment in PD
association was found in the RN and GP in some (Guan et al., In patients with PD, cognitive impairment was significantly
2017a; Chen et al., 2019; Shahmaei et al., 2019), but not all studies correlated with higher susceptibility in the hippocampus, rostral
(Shin et al., 2018; Sun et al., 2019). CN, thalamus, amygdala, and right putamen (Li et al., 2018;
The correlation of UPDRS sub-scores have been evaluated Uchida et al., 2019; Thomas et al., 2020) but not in the SN and
by a number of studies, showing inconsistent findings. While its subregions, midbrain, and DN (He et al., 2017; Du G. et al.,
some studies suggested a correlation of UPDRS scores with 2018; Ahmadi et al., 2020). Cortical regions where increased
susceptibility in subcortical structures, such as CN, GP, putamen, susceptibility correlated with lower MoCA scores include the
and SN (He et al., 2015; Du et al., 2016; Langkammer et al., 2016; basal forebrain, caudal regions of ventromedial prefrontal cortex,
Guan et al., 2017b; Xuan et al., 2017; An et al., 2018; Du G. right insular cortex (Thomas et al., 2020), cuneus, and fusiform
et al., 2018; Mazzucchi et al., 2019; Uchida et al., 2019; Thomas gyrus (Uchida et al., 2019).
et al., 2020), others did not report such findings (Du et al., 2016; Further, compared to patients with PD who had normal
Acosta-Cabronero et al., 2017; Zhao et al., 2017; Shin et al., 2018; cognition, those with MCI showed higher susceptibility in
Bergsland et al., 2019; Ghassaban et al., 2019; Sun et al., 2019) the head of CN, entorhinal cortex, parahippocampal gyrus,
(Supplementary Table 1B). amygdala, and precuneus (Uchida et al., 2019). In another
study, Li et al. (2018) reported higher susceptibility in the left
Tremor Dominant vs. Akinetic-Rigid PD hippocampus in patients with PD with dementia, compared to
Tremor-dominant and akinetic-rigid clinical presentations of PD cognitively normal PD patients.
were found to have distinct QSM patterns in specific regions
of the brain. While in the SN, magnetic susceptibility did Olfaction in PD
not differ among tremor-dominant and akinetic-rigid groups, Hyposmia is a common non-motor symptom in PD which occurs
the cerebellar DN and RN showed higher susceptibility in in up to 90% of patients (Pantelis and Brewer, 2006; Xiao et al.,
tremor-dominant PD, which positively correlated with tremor 2014). Two studies compared QSM among PD patients with
Frontiers in Neuroscience | www.frontiersin.org 17 February 2021 | Volume 15 | Article 618435You can also read