Sequence of clinical and neurodegeneration events in Parkinson's disease progression
←
→
Page content transcription
If your browser does not render page correctly, please read the page content below
doi:10.1093/brain/awaa461                                                                                                               BRAIN 2021: 144; 975–988              | 975

Sequence of clinical and neurodegeneration
events in Parkinson’s disease progression
 Neil P. Oxtoby,1 Louise-Ann Leyland,2 Leon M. Aksman,1 George E. C. Thomas,2
Emma L. Bunting,2 Peter A. Wijeratne,1 Alexandra L. Young,1,3 Angelika Zarkali,2

                                                                                                                                                                                          Downloaded from https://academic.oup.com/brain/article/144/3/975/6128900 by guest on 25 April 2021
 Manuela M. X. Tan,4,5 Fion D. Bremner,6 Pearse A. Keane,7,8 Huw R. Morris,4,5
Anette E. Schrag,4,5 Daniel C. Alexander1 and Rimona S. Weil2,5,9

See Le Heron et al. (doi:10.1093/brain/awab060) for a scientific commentary on this article.

Dementia is one of the most debilitating aspects of Parkinson’s disease. There are no validated biomarkers that can track
Parkinson’s disease progression, nor accurately identify patients who will develop dementia and when. Understanding the sequence
of observable changes in Parkinson’s disease in people at elevated risk for developing dementia could provide an integrated bio-
marker for identifying and managing individuals who will develop Parkinson’s dementia. We aimed to estimate the sequence of
clinical and neurodegeneration events, and variability in this sequence, using data-driven statistical modelling in two separate
Parkinson’s cohorts, focusing on patients at elevated risk for dementia due to their age at symptom onset. We updated a novel ver-
sion of an event-based model that has only recently been extended to cope naturally with clinical data, enabling its application in
Parkinson’s disease for the first time. The observational cohorts included healthy control subjects and patients with Parkinson’s dis-
ease, of whom those diagnosed at age 65 or older were classified as having high risk of dementia. The model estimates that
Parkinson’s progression in patients at elevated risk for dementia starts with classic prodromal features of Parkinson’s disease (olfac-
tion, sleep), followed by early deficits in visual cognition and increased brain iron content, followed later by a less certain ordering
of neurodegeneration in the substantia nigra and cortex, neuropsychological cognitive deficits, retinal thinning in dopamine layers,
and further deficits in visual cognition. Importantly, we also characterize variation in the sequence. We found consistent, cross-vali-
dated results within cohorts, and agreement between cohorts on the subset of features available in both cohorts. Our sequencing
results add powerful support to the increasing body of evidence suggesting that visual processing specifically is affected early in
patients with Parkinson’s disease at elevated risk of dementia. This opens a route to earlier and more precise detection, as well as a
more detailed understanding of the pathological mechanisms underpinning Parkinson’s dementia.

 1 Centre for Medical Image Computing, Department of Computer Science and Department of Medical Physics and Biomedical
   Engineering, UCL, London, UK
 2 Dementia Research Centre, UCL Institute of Neurology, UCL, London, UK
 3 Department of Neuroimaging, Institute of Psychiatry, Psychology and Neuroscience, King’s College London, London, UK
 4 Department of Clinical and Movement Neuroscience, UCL Queen Square Institute of Neurology, UCL, London, UK
 5 Movement Disorders Consortium, UCL, London, UK
 6 Neuro-ophthalmology, National Hospital for Neurology and Neurosurgery, University College London Hospitals, London, UK
 7 Institute of Ophthalmology, UCL, London, UK
 8 Moorfields Eye Hospital, London, UK
 9 The Wellcome Centre for Human Neuroimaging, UCL Institute of Neurology, UCL, London, UK

Correspondence to: Dr N. Oxtoby
Centre for Medical Image Computing, Department of Computer Science and Department of
Medical Physics and Biomedical Engineering, UCL, London, UK
E-mail: n.oxtoby@ucl.ac.uk

Received June 1, 2020. Revised October 5, 2020. Accepted October 24, 2020. Advance access publication February 5, 2021
C The Author(s) (2021). Published by Oxford University Press on behalf of the Guarantors of Brain.
V
This is an Open Access article distributed under the terms of the Creative Commons Attribution License (http://creativecommons.org/licenses/by/4.0/), which permits unrestricted reuse,
distribution, and reproduction in any medium, provided the original work is properly cited.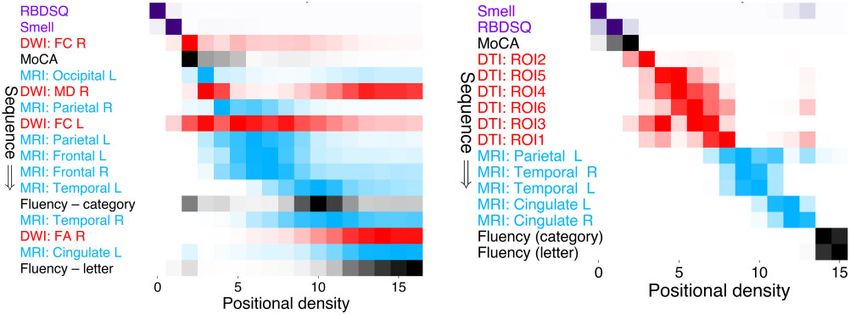
976   | BRAIN 2021: 144; 975–988                                                                                  N. P. Oxtoby et al.

Keywords: event-based model; disease progression; Parkinson’s disease; dementia; vision
Abbreviations: PDD-HR = Parkinson’s disease dementia-high risk; PDD-LR = Parkinson’s disease dementia-low risk; MoCA =
Montreal Cognitive Assessment; QSM = quantitative susceptibility mapping; PPMI = Parkinson’s Progression Markers Initiative

                                                                    of verbal fluency and visuospatial function seem to be early
Introduction                                                        indicators of an individual’s risk of developing dementia
Dementia is one of the most debilitating aspects of                 (Williams-Gray et al., 2013), and visual processing regions
Parkinson’s disease, with important social and economic             are affected early in patients who develop cognitive impair-
implications (Spottke et al., 2005; Leroi et al., 2012). It         ment (Weil et al., 2016). Indeed, multiple lines of evidence
affects half of all patients within 10 years of diagnosis but       support the importance of visual processing regions in
with high variability in the timing of onset (Williams-Gray         Parkinson’s dementia and cognitive decline. These include

                                                                                                                                        Downloaded from https://academic.oup.com/brain/article/144/3/975/6128900 by guest on 25 April 2021
et al., 2013). There are no validated biomarkers of                 accumulation of post-mortem pathology (Toledo et al.,
Parkinson’s disease progression, and the particular sequence        2016), deficits in colour vision (Anang et al., 2014), and our
and evolution of Parkinson’s disease pathology and cognitive        own studies highlighting deficits in quantitative higher-order
decline remain unclear. Knowing the precise sequence of             visual measures (Weil et al., 2019) and retinal thinning
events in Parkinson’s disease progression will be critical for:     (Leyland et al., 2020).
(i) reducing heterogeneity in clinical trials; (ii) monitoring         How these clinical and neuroimaging measures of decline
treatment outcomes as new therapeutic interventions are             fit into a sequential model of progression to Parkinson’s de-
developed; and (iii) providing important insights into the          mentia is not yet known. A particular challenge is the ab-
mechanistic underpinnings of degeneration in Parkinson’s            sence of any objective pathological biomarkers that track
disease. Therefore, a key challenge is to construct quantita-       Parkinson’s disease progression in patients at elevated risk of
tive models of pathological and cognitive decline in                dementia—unlike Alzheimer’s disease, for example, where
Parkinson’s disease progression using real-world patient            neuroimaging and CSF biomarkers are now included in
data such as neuroimaging and clinical measures.                    diagnostic criteria (Dubois et al., 2014). Disease duration
   Pathological changes underlying the development of de-           (time since diagnosis), which can be useful as a measure of
mentia in Parkinson’s disease relate to accumulation of             disease progression in other degenerative diseases such as
a-synuclein (Spillantini et al., 1997), as well as amyloid-b,       Alzheimer’s disease, is particularly ineffective in Parkinson’s
and tau (Irwin et al., 2017) with a synergistic relationship        dementia (Prange et al., 2019). Duration is often negatively
seen between these proteins (Compta et al., 2011; Swirski           related to disease progression as patients with an older age
et al., 2014). However, it is challenging to detect these proc-     at diagnosis frequently progress more rapidly to dementia
esses in patients living with the disease. There is no radio-lig-   while having a shorter duration of disease (Marinus et al.,
and that directly binds a-synuclein. Even compounds that            2018; Prange et al., 2019). Another approach to consider in
directly bind to amyloid, such as Pittsburgh compound B,            modelling progression to Parkinson’s dementia is regressing
have low specificity for predicting dementia in Parkinson’s         measures of interest against a clinical cognitive variable such
disease (Gomperts et al., 2012). The utility of tau-binding         as the Montreal Cognitive Assessment (MoCA) (Nasreddine
ligands has been studied longitudinally in Alzheimer’s dis-         et al., 2005). However, this clinical measure is confounded
ease research (Jack Jr et al., 2018), but they are yet to be        by practice/learning effects (in general) and by ceiling/floor
tested in Parkinson’s disease, and may be similarly afflicted       effects at early/late stages of cognitive involvement. Data-
by low specificity. More generally, molecular neuroimaging          driven approaches that jointly estimate disease progression
markers are costly and not widely available.                        and the unknown (latent) disease stage are an emerging ap-
   Conventional neuroimaging features that measure tissue           proach (Iddi et al., 2018; Li et al., 2019). In the work of
loss caused by neuronal death, such as cortical thickness, are      Iddi and colleagues (2018) this approach was applied to esti-
less likely to be sensitive to early stages of Parkinson’s de-      mate disease progression in a general Parkinson’s population
mentia (Hattori et al., 2012). More advanced techniques             using mostly clinical features.
have begun to show potential to identify tissue changes                A data-driven understanding of Parkinson’s disease pro-
related to neurodegeneration (Lanskey et al., 2018). Of             gression in patients at elevated risk of dementia will enable
these, quantitative susceptibility mapping (QSM) is particu-        robust identification of at-risk patients before dementia has
larly promising as it relates to accumulation of brain tissue       taken hold. Currently the state of the art in Parkinson’s de-
iron, which is strongly linked with neurodegeneration (Ward         mentia risk determination are clinico-genetic algorithms (Liu
et al., 2014; Ndayisaba et al., 2019), co-localizes with amyl-      et al., 2017; Schrag et al., 2017). These calculate an individ-
oid and tau (Ayton et al., 2017), and correlates with cogni-        ual’s risk of cognitive decline by combining demographic,
tive change in Parkinson’s disease (Thomas et al., 2020).           clinical, motor, and cognitive scores, as well as genetic and
   Neuropsychological tests across cognitive domains are            biomarker results. Across all studies, higher age at onset is
used to map cognitive decline in Parkinson’s disease. Tests         consistently and significantly seen as the strongest risk factor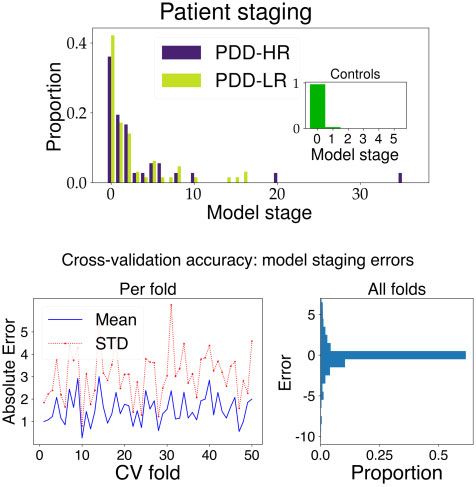
Modelling Parkinson’s progression                                                                BRAIN 2021: 144; 975–988     | 977

for dementia in Parkinson’s disease (Hietanen and                   Mini-Mental State Examination (MMSE) score 425 (two
Teräväinen, 1988; Jankovic et al., 1990; Biggins et al., 1992;    excluded) (Liu et al., 2017), or ophthalmic disease sufficient to
Aarsland et al., 2001, 2007; Akinyemi et al., 2008;                 impair visual acuity (three excluded) (Leyland et al., 2020).
Williams-Gray et al., 2013; Liu et al., 2017).                      Data from 34 unaffected age-matched control subjects, recruited
   Here we used novel event-based disease progression mod-          from unaffected spouses and university databases, were also
                                                                    included. All participants gave written informed consent and the
elling to investigate Parkinson’s disease progression, enrich-
                                                                    study was approved by the Queen Square Research Ethics
ing for those at higher risk of dementia using older age at         Committee.
onset. The event-based model (Fonteijn et al., 2012; Young             We downloaded PPMI data in April 2020 from the
et al., 2014) is a generative statistical model of disease pro-     Laboratory Of NeuroImaging portal accessed via the PPMI
gression that learns the ordering (and uncertainty in this          website (http://www.ppmi-info.org/). PPMI is an observation-
ordering) of observable abnormalities from a cross-sectional        al multicentre study involving over 400 newly diagnosed
dataset, without the need for a priori-defined disease stages       drug-naive patients (451 downloaded) and 200 healthy con-
or normal/abnormal cut-points—making it particularly suit-          trols (196 downloaded), plus a small number of possible pro-

                                                                                                                                        Downloaded from https://academic.oup.com/brain/article/144/3/975/6128900 by guest on 25 April 2021
able, in principle, for Parkinson’s disease where such disease      dromal individuals [hyposmia or rapid eye movement (REM)
stages do not exist in a meaningful way. A recent develop-          sleep behaviour disorder (RBD)], and patients having a PET/
ment uses kernel density estimation (Firth et al., 2020) to         SPECT scan without evidence of dopaminergic deficiency
                                                                    (SWEDD), all with standardized clinical, cognitive and neuro-
allow the approach to cope naturally with the ceiling and
                                                                    imaging assessments. Inclusion criteria for our study was
floor effects seen in clinical data, enabling the extension to
                                                                    PPMI participants having complete baseline data in the meas-
Parkinson’s disease for the first time. The model learns            ures of interest (described below) with known disease dur-
directly from biomarker data, where we use the term                 ation (n = 46 excluded). Prodromal and SWEDD groups were
‘biomarker’ to include any observable dynamic measure that          omitted from model fitting, and controls with RBD were
potentially contains disease information, e.g. clinical/cogni-      excluded [REM Sleep Behaviour Disorder Screening
tive tests, brain imaging, etc. Previous versions of the            Questionnaire (RBDSQ) 55] (Stiasny-Kolster et al., 2007).
event-based model have been used widely in recent years to          Participants from the PPMI dataset each provided written
construct data-driven models of disease progression in spor-        informed consent at their participating site for their data to
adic Alzheimer’s disease (Young et al., 2014; Oxtoby et al.,        be collected and shared for this initiative. Our discovery co-
2017), familial Alzheimer’s disease (Fonteijn et al., 2012;         hort included a richer set of measures than the PPMI cohort.
                                                                    Our comparison experiments included only those clinical and
Oxtoby et al., 2018), Huntington’s disease (Fonteijn et al.,
                                                                    neuroimaging measures available in both cohorts.
2012; Wijeratne et al., 2018), and others (Eshaghi et al.,
2018; Firth et al., 2018). We update the method of Firth
et al. (2020) and apply it to the complex and heterogeneous         Clinical and neuropsychological
problem of Parkinson’s disease progression.                         evaluation
                                                                    Symptom severity was assessed using the Movement Disorders
                                                                    Society Unified Parkinson’s Disease Rating Scale (UPDRS)
Materials and methods                                               (Movement Disorder Society Task Force on Rating Scales for
                                                                    Parkinson’s Disease, 2003). Participants were tested on their
Participants                                                        usual medications and levodopa equivalent daily dose (LEDD)
                                                                    was calculated (Tomlinson et al., 2010). Cognition was tested
We analysed baseline visit data from two separate cohorts. We       using the MoCA. Olfaction was assessed using Sniffin’ sticks
refer to our local cohort as the discovery cohort, which is from    (Hummel et al., 1997) in the discovery cohort, and the
the Vision In Parkinson’s Disease study (Leyland et al., 2020).     University of Pennsylvania Smell Identification Test (UPSIT) in
The second cohort is from the Parkinson’s Progression Marker’s      the PPMI cohort. Participants also completed the Hospital
Initiative (PPMI) (Marek et al., 2011). See Table 1 for demo-       Anxiety and Depression Scale (HADS; Snaith, 2003), and
graphics and statistical comparisons and Supplementary mater-       RBDSQ (Stiasny-Kolster et al., 2007). Control patients scoring
ial for additional details.                                         55 were excluded (discovery cohort n = 1; PPMI cohort
   Our discovery cohort included data from 107 patients with        n = 34), as these could be considered REM sleep behaviour dis-
Parkinson’s disease (disease duration 4.1 ± 2.5 years) who were     order cases rather than true unaffected controls (Stiasny-Kolster
recruited to our UK centre, 37 of whom were diagnosed at age        et al., 2007). Cognitive assessment was in line with recent MDS
65 or later, plus 34 healthy control subjects. Throughout we        guidelines (Litvan et al., 2012) with two assessments per cogni-
will refer to Parkinson’s patients with age at onset 565 as         tive domain, as described previously (Leyland et al., 2020)
PDD-HR (Parkinson’s Disease Dementia–High Risk), and other          (Table 1).
patients as PDD-LR (Parkinson’s Disease Dementia–Low Risk).
This cohort has been described previously (Leyland et al.,
2020). Inclusion criteria were early stage Parkinson’s disease
                                                                    Assessments of visual function
(UK Parkinson’s Disease Society Brain Bank diagnostic criteria)     Visual acuity was measured using a LOGMAR chart and con-
(Gibb and Lees, 1989), within 10 years of diagnosis, aged 49–       trast sensitivity was measured using a Pelli-Robson chart (SSV-
80 years. Exclusion criteria were confounding neurological or       281-PC) (http://www.sussex-vision.co.uk). Colour vision was
psychiatric disorders (four excluded), a diagnosis of dementia or   assessed using the D15 test (Farnsworth, 1943) and error scores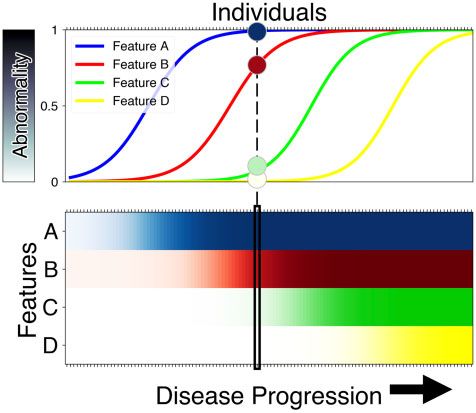
978     | BRAIN 2021: 144; 975–988                                                                                                                       N. P. Oxtoby et al.

Table 1 Descriptive statistics of study participants

                                                 Controls             PDD-LR                PDD-HR              U or v2 (PDD-HR versus Controls)                    P

  Discovery cohort (local study)                   n = 33                n = 64               n = 36
  Age, years                                      64.7 (9.0)            59.7 (5.1)           73.0 (4.0)                            266.5                            50.0001
  Disease duration, years                             –                  4.7 (2.6)            3.4 (2.1)                              –                               –
  Age at onset PD                                     –                 55.5 (4.3)           70.1 (3.8)                              –                               –
  UPDRS total                                      8.2 (5.2)            46.8 (24.0)          42.9 (18.1)                             4.5                            50.0001
  LEDD                                                –                 484 (284)            388 (201)                               –                               –
  Gender, female/male                            18/15                 35/29                13/23                                    1.68                            0.195
  RBDSQ                                            1.7 (1.3)             4.2 (2.5)            4.2 (2.4)                            218                              50.0001
  Smell test (Sniffin’ sticks)                    12.2 (2.6)             8.1 (2.9)            6.8 (3.4)                            133                              50.0001
  Cognition (MoCA)                                28.6 (1.3)            28.2 (1.7)           27.6 (2.2)                            416.5                             0.015
  Category Fluency (animals)                      22.1 (5.2)            22.0 (5.1)           20.2 (6.4)                            459                               0.053

                                                                                                                                                                                   Downloaded from https://academic.oup.com/brain/article/144/3/975/6128900 by guest on 25 April 2021
  Letter Fluency                                  16.8 (5.6)            16.5 (4.9)           16.3 (6.4)                            553.5                             0.315
  External cohort (PPMI study)                     n = 127              n = 206               n = 146
  Age                                             60.0 (11.0)           55.6 (7.3)           70.9 (3.7)                           3119                              50.0001
  Disease duration, years                             –                 0.53 (0.55)          0.65 (0.62)                             –                               –
  Age at onset PD                                     –                 55.0 (7.3)           70.3 (3.7)                              –                               –
  UPDRS total                                      1.8 (2.8)            26.0 (11.1)          30.2 (11.1)                            36                              50.0001
  Gender female/male                             48/79                72/134                48/98                                    0.52                            0.470
  RBDSQ                                            1.9 (1.4)             3.9 (2.5)            4.2 (2.6)                           4408                              50.001
  Smell test (Sniffin’ sticks equivalent)         13.6 (1.7)             9.3 (3.4)            7.4 (3.6)                           1208                              50.0001
  Cognition (MoCA)                                28.2 (1.1)            27.4 (2.2)           26.8 (2.2)                           5409                              50.0001
  Category Fluency (animals)                      22.0 (5.4)            21.8 (5.5)           19.5 (4.6)                           6732                              50.0001
  Letter Fluency                                  14.5 (4.3)            13.2 (4.9)           12.2 (4.4)                           6194                              50.0001

Values are mean (SD), except where indicated otherwise. Each P-value shown is for a Mann-Whitney U-test (means) or v2-test (proportions) of the null hypothesis that there is no
statistical difference between the PDD-HR and control samples. For comparison of olfactory performance, PPMI UPSIT scores were converted to Sniffin’ Sticks equivalent using an
equi-percentile method (Lawton et al., 2016). LEDD = Levodopa equivalent daily dose; PD = Parkinson’s disease; RBDSQ = REM Sleep Behaviour Disorder Screening
Questionnaire; UPDRS = Unified PD Rating Scale; UPSIT = University of Pennsylvania Smell Identification Test.

log transformed. Higher-order visuo-perception was measured                                 previously shown an association between cognitive risk and
using two contrasting tasks, that each probe distinct aspects of                            these layers in Parkinson’s disease (Leyland et al., 2020).
higher-order visuo-perception: the Cats-and-Dogs test that meas-
ures skew tolerance (Weil et al., 2017; Leyland et al., 2020) and                           Genetic analysis
biological motion (Saygin, 2007). These tests were administered
at the start of each testing session using a counterbalanced de-                            The dementia risk genes we considered were APOE4, MAPT
sign to control for order effects. Stimuli were generated within                            (H1/H1), and GBA. In our discovery cohort, blood samples
MATLAB Psychophysics Toolbox 3 and implemented on a Dell                                    were collected, and DNA extracted from an EDTA sample. We
Latitude 3340, in a darkened room.                                                          performed single nucleotide polymorphism (SNP) array geno-
                                                                                            typing using the NeuroChip array (Blauwendraat et al., 2017).
                                                                                            MAPT haplotypes were distinguished using the rs8070723 and
Ophthalmic assessments and retinal                                                          rs17649553 SNPs. Standard quality control procedures were
structure                                                                                   conducted to remove individuals with low overall genotyping
                                                                                            rates (598%), related individuals, heterozygosity outliers [42
A comprehensive ophthalmic assessment was performed by a                                    standard deviations (SD) from the mean], and population out-
consultant ophthalmologist (F.B.) and included slit-lamp exam-                              liers (46 SD from the mean of any of the first 10 genetic princi-
ination and measurement of intra-ocular pressures.                                          pal components after merging with European samples from the
  Inner retinal layer structure was measured using high-reso-                               HapMap reference panel). Variants were removed if they had a
lution spectral-domain optical coherence tomography (SD-OCT;                                low genotyping rate (599%), Hardy-Weinberg equilibrium P-
Heidelberg HRA/Spectralis v.6.8.1.0) (Nassif et al., 2004) after                            value 5 1  10–5 and minor allele frequency 51%. Following
pharmacological mydriasis according to a standard protocol                                  quality control, genotypes were imputed on the Michigan
(Archibald et al., 2011), as described previously (Leyland et al.,                          Imputation Server (https://imputationserver.sph.umich.edu) (Das
2020). Automatic layer segmentation was applied to compute                                  et al., 2016) to the Haplotype Reference Consortium panel
the thickness of each retinal layer and manually corrected and                              (r1.1).
verified as previously described (Leyland et al., 2020). We                                    For the external cohort we downloaded genetics spreadsheets
focused on the ganglion cell layer (GCL) and inner plexiform                                from the PPMI database. SNP genotyping of APOE from DNA
layer (IPL) as these are the locations of dopaminergic amacrine                             was performed using the TaqManTM method, with results in
cells, with most evidence for thinning in Parkinson’s disease                               ‘Current_Biospecimen_Analysis_Results.csv’ in the PPMI data-
(Chorostecki et al., 2015; Polo et al., 2016) and we have                                   base. SNP genotyping for MAPT and GBA was performed
Modelling Parkinson’s progression BRAIN 2021: 144; 975–988 | 979
using Illumina Immunchip and NeuroX arrays and analysed (treated as missing data), but all other brain regions were
using Genome Studio v1.9.4 and results in ‘PPMI_PD_ included for these individuals.
Variants_Genetic_Status_WGS_20180921.csv’ in the PPMI Image acquisition in the PPMI cohort followed a very similar
database. As only seven patients carried GBA mutations in the 3D T1-weighted 1.5 or 3 T MRI protocol to the local 3 T proto-
discovery cohort (n = 2 T369M, n = 3 E326K and n = 2 col described above: sagittal plane MP-RAGE or SPGR (spoiled
N370S), these were excluded from the current analyses as GBA gradient) sequence (slices = 170–200, 1 1 1.2 mm voxels,
carriers may have progression that differs in rate and/or se- 0 mm slice gap, field of view = 256 256 mm). Diffusion-
quence (and are likely to have a lower age at dementia onset) weighted images were acquired along 64 uniformly distributed
but cannot be modelled with a sample of n = 7. For consistency directions with a b-value = 1000 s/mm2 and a single b = 0
we also excluded GBA carriers in our PPMI analysis (n = 10 image (116 116 matrix, 2 mm isotropic resolution, repetition
controls, n = 39 PDD-LR, n = 7 PDD-HR). After excluding time = 900 ms, echo time = 88 ms, 2-fold acceleration). All
GBA carriers, included patients were tested for genetic variation other parameters followed site-dependent manufacturer recom-
due to MAPT and APOE4 status in key features of Parkinson’s mendations for the scanner used (GE/Siemens/Philips). Scans
disease progression (UPDRS-3 and MoCA) using a Mann- were read by a radiologist at each site to meet standards of clin-
Downloaded from https://academic.oup.com/brain/article/144/3/975/6128900 by guest on 25 April 2021
Whitney U-test. The Supplementary material contains a detailed ical practice and ensure that there were no significant abnormal-
analysis of genetics in both cohorts. ities. Cortical thickness estimates were obtained as above using
FreeSurfer v6.0.0.
MRI acquisition and image analysis Quantitative susceptibility mapping reconstruction
In the discovery cohort, high-resolution anatomical T1-weighted QSM image reconstruction was performed as described in
images [magnetization prepared rapid aquisition gradient echo Thomas et al. (2020). Phase preprocessing used the QSMbox
(MP-RAGE)] were acquired at 3 T on a Siemens Prism-fit MRI pipeline for single-echo, coil-combined data (https://gitlab.com/
system with a 64-channel head coil (repetition time = 2530 ms, acostaj/QSMbox) (Acosta-Cabronero et al., 2018), with 3D
echo time = 3.34 ms, inversion time = 1100 ms, flip angle a = complex phase data unwrapped using a discrete Laplacian
7 , slices = 176, 1 1 1 mm voxels, field of view = method. Brain masks (required to separate local from back-
256 256 mm). Susceptibility-weighted MRI images were ground fields), were calculated from magnitude data using the
obtained from a 2 1-accelerated, 3D flow-compensated BET2 algorithm in FSL v5.0. (https://fsl.fmrib.ox.ac.uk). Phase
spoiled-gradient-recalled echo sequence. Flip angle 12 ; echo preprocessing was performed using Laplacian boundary value
time, 18 ms; repetition time, 25 ms; and receiver extraction followed by variable spherical mean-value filtering.
bandwidth, 110 Hz/pixel. Matrix size was 204 224 160 We estimated susceptibility maps using multi-scale dipole inver-
with 1 1 1 mm3 voxel resolution (scan time 5 min 41 s). sion (Acosta-Cabronero et al., 2018). Filtering during recon-
Multishell diffusion weighted imaging (DWI) was acquired struction was performed using an 8 mm kernel. QSM spatial
with the following parameters: b = 50 s/mm2 (17 directions), normalization and regional extraction was performed using
b = 300 s/mm2 (eight directions), b = 1000 s/mm2 (64 direc- QSMexplorer (https://gitlab.com/acostaj/QSMexplorer) (Acosta-
tions), b = 2000 s/mm2 (64 directions); 2 2 2 mm isotropic Cabronero et al., 2016). For template creation, radio-frequency
voxels, echo time = 3260 ms, repetition time = 58 ms, 72 slices, bias corrected MP-RAGE images were spatially normalized
2 mm thickness, acceleration factor = 2. using a previously optimized ANTs (http://stnava.github.io/
Because of MRI safety requirements, five patients and one ANTs) routine. Bias-corrected magnitude gradient echo images
control subject were unable to undergo MRI scanning. All were then affinely co-registered to their corresponding MP-
images were assessed visually for quality, including artefacts RAGE volume using ANTs. QSM spatial standardization was
such as motion and distortions. All T1-weighted scans were completed through a composite warp of the above transforma-
bias-corrected via the FreeSurfer protocol (described in detail in tions and high order interpolation. Mean absolute QSM values
Collins et al., 1994; Dale et al., 1999; Fischl et al., 1999) with were extracted from the set of cortical regions defined by the
parameters optimized for 3 T. Cortical reconstruction and volu- Desikan-Killiany-Tourville atlas (Klein and Tourville, 2012) in
metric segmentation of MRI scans for both cohorts was per- OASIS-30 space. The study-wise to OASIS-30 space non-linear
formed using FreeSurfer-v6.0 software (http://surfer.nmr.mgh. warp field was calculated with a deformable b-spline co-registra-
harvard.edu/) (Fischl et al., 1999; Fischl and Dale, 2000). This tion routine in ANTs. Desikan-Killiany-Tourville labels were
involves skull stripping, volumetric labelling, intensity normal- brought into study space using the inverse of this transformation
ization, grey/white matter segmentation and registration to and nearest-neighbour interpolation. To minimize partial-vol-
established surface atlases. Cortical thickness was calculated as ume contamination, each cortical region of interest was inter-
the closest distance from the grey–white matter boundary to the sected with a binarized study-wise grey matter mask, inferred
grey matter–CSF boundary at each vertex. from anatomical MP-RAGE images using SPM12 (https://www.
Cortical reconstructions were visually inspected slice-by-slice fil.ion.ucl.ac.uk/spm/software/spm12/). The PPMI study does not
for segmentation errors. Subjects with any inaccuracies that include QSM data.
were considered severe enough to significantly affect cortical
thickness measures were excluded from the analyses: one con- Diffusion weighted imaging reconstruction
trol participant failed the reconstruction process and one con- Prior to diffusion processing, each volume of the raw data was
trol’s whole brain was removed from the analysis due to poor visually inspected and evaluated for the presence of artefact;
segmentation. A further five patients with Parkinson’s disease only scans with 515 volumes containing artefacts were
and three control subjects had the temporal lobe cortical thick- included (Roalf et al., 2016). DWI images underwent standard
ness measures excluded due to poor segmentation locally preprocessing including denoising (Veraart et al., 2016),980 | BRAIN 2021: 144; 975–988 N. P. Oxtoby et al.
removal of Gibbs ringing artefacts (Kellner et al., 2016), eddy- per hemisphere: frontal, parietal, occipital, temporal, plus the
current and motion correction (Andersson et al., 2003) and bias cingulate) were calculated from T1-weighted structural MRI by
field correction (Tustison et al., 2010) followed by upsampling combining the default estimates returned by FreeSurfer for the
to a voxel size of 1.3 mm3 (Raffelt et al., 2012) and intensity 68 cortical regions of interest in the Desikan-Killiany atlas
normalization across subjects. Fibre-orientation distributions (Desikan et al., 2006). We included absolute QSM measures
(FODs) for each participant were computed via multi-shell from 12 brain regions out of 96 in the Desikan-Killiany-
three-tissue constrained spherical-deconvolution using the Tourville atlas using the Mann-Whitney U-test for PDD-HR ver-
group-average response function for each tissue type (grey mat- sus controls (P 5 0.05 uncorrected). We adjusted all measures
ter, white matter and CSF) (Dhollander et al., 2016). A group- for gender, age, and years of education using a linear model:
averaged FOD template was created from 30 randomly selected y gender (age + education) trained on controls. This
subjects at baseline (20 patients with Parkinson’s disease, 10 accounts for confounding effects such as the influence of age
healthy control subjects) and each participant’s FOD image was and education on performance in clinical assessment tasks and
registered to the template (Raffelt et al., 2011). Fixel-based met- allows for possible differences between genders.
rics were then derived from each subject in template space For our comparison experiments on PPMI data we included a
(Raffelt et al., 2012). In addition to fixel-based metrics, we
Downloaded from https://academic.oup.com/brain/article/144/3/975/6128900 by guest on 25 April 2021
subset of measures: only those available in both cohorts (see
derived the diffusion tensor from each participant’s FOD image text and Supplementary material).
(Veraart et al., 2013) and calculated a fractional anisotropy
(FA) and mean diffusivity (MD) map for each participant, which
was registered to template space. Mean fibre cross-section (FC) Statistical analysis
as well as mean FA and MD were calculated from the left and The event-based model
right substantia nigra based on the DISTAL atlas (Ewert et al.,
We updated a recent version of the event-based model that
2018). FC was chosen from the three derived fixel-based metrics
incorporates non-parametric mixture modelling (Firth et al.,
as prior work by our group, and others, has shown this to be
2020). Our novelty is described below. We used this model to
the most sensitive fixel-based metric in both baseline and longi-
estimate the most likely sequence of clinical and neuroimaging
tudinal change in Parkinson’s disease (Rau et al., 2019; Zarkali
events in the progression to Parkinson’s disease dementia, and
et al., 2020). Diffusion data from 14 participants in the discov-
the uncertainty (positional variance) in the sequence. This longi-
ery cohort failed the predetermined quality control criteria and
tudinal picture of disease progression is extractable from cross-
were not included in our analyses (treated as missing data).
sectional data by assuming a single monotonic progression and
For the PPMI cohort we downloaded available diffusion ten-
exploiting combinations of observable abnormality (earlier/later
sor imaging (DTI) metrics from six hand-drawn regions of inter-
events) across individuals (Fig. 1). By analogy, if all patients
est within the left and right substantia nigra (Vaillancourt et al.,
who present with the common cold have a cough, but only
2009) and included mean FA values.
some of these also sneeze, we would infer with very high confi-
dence that coughing comes before sneezing (of course, this ana-
Data selection and preparation logy only works for a hypothetical common cold that is
We aimed to build a data-driven model of Parkinson’s disease progressive/non-remitting). The confidence in the ordering of
progression in patients at elevated risk for dementia. Most stud- events is quantified intrinsically within the event-based model
ies of Parkinson’s disease—including the cohorts analysed and depends on the data (and the nature of disease progression).
here—recruit recently diagnosed patients, with very few having Returning to our analogy, confidence in the ‘cough-then-sneeze’
severe cognitive deficits. Therefore, as described above, we sequence would be reduced if only most patients presented in
focused our models on those patients considered to be at ele- this manner, rather than all patients. We present event-based
vated risk for developing dementia due to older age at onset models as positional density heat maps, also known as position-
(Hietanen and Teräväinen, 1988; Dubois et al., 1990; Jankovic al variance diagrams (Fonteijn et al., 2012). A positional density
et al., 1990; Biggins et al., 1992; Katzen et al., 1998; Aarsland heat map shows the posterior distribution of events and their
et al., 2001, 2007; Akinyemi et al., 2008; Williams-Gray et al., position in the most likely sequence. ‘Hot’ regions of high dens-
2013). Specifically, we use a threshold age at onset of 65 years, ity correspond to high confidence in the ordering, appearing as
classifying older patients at diagnosis (565 years old) as PDD- a narrow, dark diagonal pattern in the map. ‘Cool’ regions of
HR, and the other patients as PDD-LR. Our threshold reflects broad, lower density correspond to lower confidence in the
the average age at onset for Parkinson’s disease, which is esti- ordering, e.g. some events are likely to occur concurrently as far
mated to be between 60 and 70 years old (Macleod et al., as the model can discern from the data. Our methodological
2018). We stress-tested this dementia risk threshold by building novelty is in the mixture modelling step of event-based model-
models using thresholds of 60 and 70 years, which showed ling. We allowed only a small fraction of data from controls to
strong and significant rank correlation with the main model pre- be labelled as abnormal/post-event. Specifically, any controls
sented (Supplementary material). Table 1 shows detailed demo- having extreme abnormality above the 90th percentile for that
graphics of included participants in our cohorts. marker (including control and patient data) were labelled as ab-
In our discovery cohort we selected clinical, cognitive, retinal, normal, otherwise data from controls remained labelled as nor-
and visual measures from our battery (Leyland et al., 2020) mal/pre-event. This adds clear interpretability to our models:
based on specificity to Parkinson’s dementia (Liu et al., 2017; they represent progression to Parkinson’s dementia as disease-
Schrag et al., 2017; Leyland et al., 2020). UPDRS scores were specific deviations from normality. Markers were excluded if
not included in the modelling because motor symptoms are pre- mixture modelling was unable to discern disease signal from the
sent in all patients with Parkinson’s disease (by definition). data (separation between controls and patients consistent with
Measures of average cortical thickness in each brain lobe (five disease progression).Modelling Parkinson’s progression BRAIN 2021: 144; 975–988 | 981
measurements across events. Following Young et al. (2014), we
assigned the stage that maximizes the individual likelihood.
Patient stage is akin to a data-driven, multivariate risk score,
with previous work showing strong predictive value for cogni-
tive outcomes in sporadic Alzheimer’s disease (Young et al.,
2014), and for disease onset in familial Alzheimer’s disease
(Oxtoby et al., 2018) and Huntington’s disease (Wijeratne
et al., 2018).
Cross-validation
We used repeated stratified 5-fold cross-validation to ensure ro-
bustness of the event-based model results. This involved refitting
both the mixture models and the sequence on 80% of the co-
hort data and testing accuracy on the held out 20% for each of
Downloaded from https://academic.oup.com/brain/article/144/3/975/6128900 by guest on 25 April 2021
10 5-fold random partitions, giving a total of 50 cross-valid-
ation folds/models, which are averaged to find the final model
(see Supplementary material for details). This gives a more ro-
bust model (both in terms of the sequence and uncertainty in
the sequence) than a single maximum-likelihood model built on
Figure 1 How the event-based model works. The event- 100% of the data. Additionally, this enables us to compare the
based model is a statistical method for quantifying a sequence of 50 models to assess model robustness and generalizability using
observable abnormality in a set of disease-relevant features (bio- cross-validation similarity and consistency quantified by the
markers). The model works by assessing, at the group level, combi- Bhattacharyya coefficient given above. We cross-validated
nations of simultaneously normal and abnormal measurements in model accuracy via patient staging (described above) with the
different biomarkers across individuals at multiple stages of disease gold standard model stage provided by staging from the full
progression. Top: In neurodegenerative disease progression (left to cross-validated model (all folds combined). This necessitated
right), observable abnormality (vertical axis) across multiple fea- two runs of cross-validation: one to generate the ground truth
tures (A, B, C, D) likely proceeds in a cascade or sequence A! model stage for each participant, and a second to calculate met-
B!C!D, as in an influential hypothetical model of Alzheimer’s dis- rics across cross-validation folds. Model robustness is evidenced
ease progression (Jack et al., 2010; Jack Jr et al., 2013). Bottom: A by high similarity (average BC closer to unity) and simultan-
cross-sectional sample of individuals (columns) at different stages of eously high consistency (low standard deviation of BC) between
disease progression (horizontal axis) showing the corresponding models across cross-validation folds. Model accuracy is evi-
observed combinations of normal (white) and degrees of abnormal-
denced by low errors in patient staging across folds.
ity (shades of colour) across the four features. A single individual
sampled near the middle of the disease is shown in both panels: External cohort: PPMI
early events (A and B) have higher abnormality than later events (C
For comparison, our experiments were repeated on available
and D). Whenever such an individual shows an elevated value of
data in the PPMI cohort. We included healthy controls and
biomarker A, but a normal value for biomarker B, this adds evi-
patients with Parkinson’s disease (Table 1). Our PPMI experi-
dence that A changes before B.
ments included the subset of measures available: clinical, cogni-
tive, DTI metrics in the substantia nigra, and cortical thickness.
Our retinal and visual measures are not available in PPMI, nor
Similarity measure for event-based models are the brain iron content biomarkers from QSM. We quantify
the comparison statistically using rank correlation and our simi-
We use the Bhattacharrya coefficient (BC) as a similarity meas-
larity measure defined above after first averaging the posterior
ure (Liese and Miescke, 2008) for event-based models in terms
within data modality (Supplementary material).
of statistical overlap between two posterior distributions:
BC ¼ 1 H 2 (1) Data availability
where H is the mean Hellinger distance (Watanabe, 2009) be- The derived data and python code that support the findings of
tween models, calculated row-wise in the positional density map this study are available from the corresponding author, upon
(mean and SD reported). The Bhattacharrya coefficient is equal reasonable request. The underlying event-based model code is
to zero when the posterior positional densities of two event- publicly available at https://github.com/noxtoby/kde_ebm_open.
based models do not overlap (maximal Hellinger distance), and
it is equal to unity when the positional densities overlap exactly.
To provide some context, we calculate a reference value of BC0 Results
= 0.37 ± 0.02, which represents the statistical similarity of
randomized models (Supplementary material).
Participants
Patient staging Table 1 presents key descriptors in both cohorts. Briefly, our
Each individual participant is assigned a fine-grained disease discovery cohort included 33 controls and 36 PDD-HR
stage within the model via the data likelihood for their set of patients. These groups were used to estimate event982 | BRAIN 2021: 144; 975–988 N. P. Oxtoby et al.
distributions within the event-based model, i.e. marker/event cortical neurodegeneration, iron accumulation, vision defi-
severity in the progression to Parkinson’s dementia. See ciency (in tests of skew tolerance, biological motion, and
Supplementary material for details of the event distributions. acuity), and cognitive decline (fluency and language
All patients (including 64 PDD-LR) were used to estimate dysfunction).
the sequence of events (under the assumption that all
patients would eventually progress to dementia, given suffi- Patient staging
cient survival). Our external cohort included 127 controls,
146 PDD-HR patients, and 206 PDD-LR patients. In We assigned each participant in the discovery cohort to their
MoCA and UPDRS-3 scores we found no variation due to most likely numerical stage within the model (see ‘Materials
MAPT or APOE4 status (Mann-Whitney U-test, all and methods’ section and Young et al., 2014), given their
P 5 0.13) and, when GBA cases were included in the data. A histogram of the staging results is shown in Fig. 3.
analyses, results were statistically indistinguishable Qualitatively, model stage concurs with expectations, i.e.
(Supplementary material). Together this suggests that genetic healthy controls (Fig. 3) are very early (mostly stage zero)
with Parkinson’s disease patients at varying stages (we found
Downloaded from https://academic.oup.com/brain/article/144/3/975/6128900 by guest on 25 April 2021
variation is not a factor in our study (larger numbers are
required to investigate progression in genetic Parkinson’s, no statistically significant differences between PDD-LR and
particularly for GBA). PDD-HR stages).
Features: clinical, cognitive, visual Cross-validation
and imaging markers Figure 3 shows that, under cross-validation, the model is
likely to generalize well to other patient cohorts: good simi-
Our final set of 42 features for discovery is shown on the larity (high mean BC), high consistency (low SD BC), and
vertical axis of Fig. 2, including eight clinical/cognitive meas- high accuracy (low staging errors) across 50-folds. Ten
ures, six vision measures, four retinal measures, eight region- repeats of stratified 5-fold cross-validation produced high
al measures of cortical thickness, four measures of white statistical overlap of BC = 0.60 ± 0.04 (mean, SD across
matter neurodegeneration in the substantia nigra, and 12 re- folds) relative to the reference value BC0 = 0.37 ± 0.02
gional measures of brain iron content. The subsets of fea- (Supplementary material), as well as low mean absolute
tures for cross-cohort comparison are shown on the vertical error of 1.5 ± 3.3 stages in patient staging (see ‘Materials and
axes of Fig. 4, including clinical/cognitive measures, meas- methods’ section).
ures of white matter neurodegeneration in the substantia
nigra, and measures of regional cortical thickness.
Comparison with external dataset:
Sequence of events in Parkinson’s PPMI
disease progression A visual comparison of our Parkinson’s progression model
(Fig. 2) with a model built using the PPMI dataset is shown
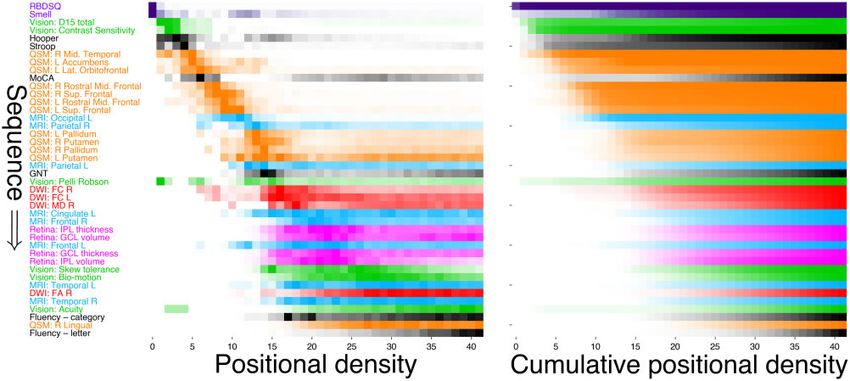
Our cross-validated probabilistic model of Parkinson’s dis- in Fig. 4, on the subset of comparable features available in
ease progression in patients at elevated risk of dementia is both cohorts. The models show high qualitative and quanti-
presented as the positional density map in Fig. 2 (left). The tative concordance: classical Parkinson’s symptoms and cog-
right side shows a complementary visualization of the cumu- nitive decline precedes neurodegeneration, with white matter
lative abnormality (left to right). In each panel, disease pro- degeneration in the substantia nigra generally preceding cor-
gresses from upper left to lower right, with colour intensity tical thinning; supported by high rank correlation s = 0.87
reflecting row-wise positional/cumulative density and confi- (P = 0.017) and statistical similarity BC = 0.96
dence in the ordering. Thus, a dark diagonal pattern (left (Supplementary material). Supplementary Fig. 5 explores the
panel) shows strong confidence in the ordering and a light, subsequence of abnormality in cortical thickness.
off-diagonal pattern shows weak confidence in the ordering.
Rows in Fig. 2 are coloured to reflect the data modality.
The model estimates that progression starts with classic
prodromal features of Parkinson’s disease (REM-sleep be-
Discussion
haviour problems, olfactory dysfunction; shown in purple) We used data-driven event-based modelling to reveal the
then proceeds to early visual dysfunction (D15 colour, con- fine-grained probabilistic sequence of decline in clinical, cog-
trast sensitivity; light green), then increased iron content pri- nitive and neuroimaging measures during Parkinson’s dis-
marily in temporal and frontal regions (orange) along with ease. We enriched for Parkinson’s dementia by focusing the
cognitive deficits (Stroop, Hooper, MoCA; greyscale), then model on patients at high risk of dementia due to their older
abnormal cortical thickness apparently starting in the occipi- age at onset (565 years) and used repeated stratified cross-
tal lobe (light blue). At this point the ordering becomes less validation for robustness, plus repeat experiments on an ex-
certain, but involves white matter neurodegeneration in the ternal cohort for comparison. Our dementia enrichment
substantia nigra (red), retinal thinning (magenta), further strategy is supported by the PDD-HR group havingModelling Parkinson’s progression BRAIN 2021: 144; 975–988 | 983
Downloaded from https://academic.oup.com/brain/article/144/3/975/6128900 by guest on 25 April 2021
Figure 2 Event-based model of progression in Parkinson’s disease. Data-driven sequence of events in Parkinson’s disease progression
colour coded by modality shown as: positional density (left); and cumulative abnormality (right) from repeated stratified 5-fold cross-validation.
The estimated sequence of events is seen on the vertical axis, with ordering proceeding from top to bottom (earliest to latest event). Colour in-
tensity represents the proportion (0 in white, 1 most intense) of the posterior distribution in which events (y-axis) appear in a particular position
in the sequence (x-axis). This model is robust, having a similarity of BC = 0.60 ± 0.04 across 50 cross-validation folds. D15 = colour test; GCL =
ganglion cell layer; GNT = Graded Naming Test; IPL = inner plexiform layer; L = left; R = right; RBDSQ = REM sleep behaviour disorder
screening questionnaire; UPDRS = Unified Parkinson’s disease rating scale.
significantly lower MoCA scores than the PDD-LR group at longitudinal cohorts that include the prodromal phase in
follow-up 1.5 years later (Mann-Whitney U-test, P 5 0.05; confirmed cases will be useful to confirm the ordering of
Supplementary material). these early premotor features.
Our data-driven model estimates that the earliest events in We highlight the relatively early appearance of colour de-
Parkinson’s disease progression in patients at elevated risk of tection deficits and contrast sensitivity, measured here by
dementia include measures of REM sleep behaviour prob- simple tests capable of being performed by opticians and
lems and olfactory dysfunction. These events are followed optometrists. Early involvement of visual dysfunction is
by early changes in visual performance (including colour interesting—particularly so because it precedes retinal abnor-
vision loss), and cognitive dysfunction. The earliest events mality and the earliest cortical neurodegeneration. This is
detectable with neuroimaging are QSM estimates of brain consistent with emerging data that suggest visual changes
tissue iron accumulation in frontal and temporal regions, are an early manifestation or even a precursor of cognitive
before regional abnormality in cortical thickness from change in Parkinson’s disease (Williams-Gray et al., 2013;
T1-weighted MRI and white matter neurodegeneration in Anang et al., 2014), including some of our own work on the
the substantia nigra from diffusion-weighted MRI. The data discovery cohort (Leyland et al., 2020) and more recently
and model suggest that retinal thinning, like cortical thin- showing, in very large cohorts, that Parkinson’s disease
ning, is a relatively late occurrence. Our results provide patients with poor vision have a worse phenotype with
data-driven support for current understanding of higher rates of dementia (Hamedani et al., 2020; Han et al.,
Parkinson’s disease progression, with early loss of smell and 2020). Together, this evidence suggests the exciting prospect
REM sleep changes (Hummel et al., 2007; Stiasny-Kolster that routine assessment of vision may have a role in disease
et al., 2007). As our aim was to model progression in estab- stratification for cognitive decline in Parkinson’s disease.
lished disease, all patients had Parkinson’s disease (rather Our model placed abnormal measures of brain tissue iron
than prodromal disease), which is why we omitted UPDRS before abnormal cortical thickness in Parkinson’s disease
scores from the model. Including them would see motor dys- progression. We also found that the sequence of regional
function as the earliest event, which could be somewhat mis- cortical thinning was highly uncertain (Supplementary ma-
leading at the individual patient level since studies of terial). This is consistent with reports that grey matter atro-
populations in prodromal stages of Parkinson’s disease have phy is inconsistent across patients and often a late event in
shown that smell and sleep changes are often found before Parkinson’s dementia (Hattori et al., 2012; Lanskey et al.,
motor changes (Korczyn and Gurevich, 2010). Large 2018) and is also consistent with our recent separate work984 | BRAIN 2021: 144; 975–988 N. P. Oxtoby et al.
difference in age and disease duration between the cohorts:
PPMI patients are younger and have less advanced disease
(Table 1), due to our cohort being enriched for older onset
Parkinson’s disease and also for longer disease duration.
We did not find differences in progression features be-
tween patients carrying APOE4 or MAPT H1/H1 polymor-
phisms in our cohort or the PPMI dataset and our analyses
were not powered to detect differences in the sequence of
progression between groups carrying these polymorphisms.
We also excluded the small number of patients carrying
GBA mutations as these patients are likely to have a more
rapid progression to dementia and may show a divergent se-
quence of events (Blauwendraat et al., 2020), although we
Downloaded from https://academic.oup.com/brain/article/144/3/975/6128900 by guest on 25 April 2021
note that the model is statistically unchanged if these seven
patients are included [s = 0.75 (P = 2 10–12 ) and BC =
0.99] (Supplementary material). Future work including
much larger numbers of patients, and enriched for specific
genetic subtypes, should specifically examine the role of gen-
etic variation in modifying the rate and sequence of events in
Parkinson’s disease.
Figure 3 Patient staging results: discovery cohort. Top: The event-based model would also be of interest applied
Model stage showing most healthy controls at stage zero (inset); to dementia with Lewy bodies or established Parkinson’s dis-
and patients at varying, but mostly early, stages. Bottom: Cross-valid-
ease dementia. As visual processing deficits are seen in the
ation accuracy across 50-folds from repeated stratified 5-fold cross-
validation. Left: Mean and standard deviation (STD) absolute error
prodromal phase of dementia with Lewy bodies (McKeith
in patient stage. Right: raw errors in patient stage. Overall mean ab- et al., 2020) and in patients with more rapid Parkinson’s dis-
solute error was 1.5 ± 3.3 stages. CV = cross-validation. ease dementia (Anang et al., 2014; Hamedani et al., 2020),
we predict that visual changes will also be found as early
events in Lewy body dementia.
on the discovery cohort showing that cortical brain iron Limitations and future work
increases are seen in Parkinson’s disease patients in relation
to cognitive performance (Thomas et al., 2020). The hetero- In the absence of markers of disease progression for pro-
geneity observed in both cohorts motivates future work on dromal Parkinson’s dementia, we used later age at onset
data-driven subtyping (see below). (565 years) as a proxy for a higher-risk group for
Our model suggests that loss of retinal tissue in key dopa- Parkinson’s dementia. This is based on a wealth of evidence
mine-containing layers (GCL and IPL) occurs after brain tis- that higher age at onset of Parkinson’s disease is a strong
sue iron increases and grey and white matter atrophy has predictor for earlier and more aggressive Parkinson’s demen-
commenced. This might suggest that retinal changes are like- tia (Dubois et al., 1990; Katzen et al., 1998) and is likely to
ly to occur later, after retrograde signals from cortical brain be a more robust marker than, for example, global cognitive
regions, and not concurrently with brain atrophy. Similar scores such as the MMSE or MoCA, which lack sensitivity
effects of cortical damage having a retrograde effect on ret- in diagnosing dementia in Parkinson’s disease (Zadikoff
inal thickness are seen in multiple sclerosis (Henderson et al., 2008; Hoops et al., 2009), particularly at early stages
et al., 2008). This could be verified in prospective datasets. of Parkinson’s dementia. Ultimately, quantitative markers of
Recent models of axonal degeneration as an early feature of disease activity in Parkinson’s dementia are needed to enable
Parkinson’s disease suggest that this process of de-arboriza- early detection and better stratification of patients at risk of
tion may occur throughout the nervous system, and could Parkinson’s dementia. Our data-driven model may fill this
explain changes seen in both the retina and cortex (Adalbert role, being akin to a multimodal, computational biomarker
and Coleman, 2013), but with differing timings. of progression to Parkinson’s dementia.
A particular strength of our study is the analysis of an ex- Our results are built on cross-sectional data from patients
ternal dataset which supports many of our conclusions on with established Parkinson’s disease, at elevated risk of
the subset of features available in both cohorts. Specifically, developing Parkinson’s dementia. In order to fully validate
models built on each cohort showed quantitative agreement our results, we aim to test the model on prospective data,
on the ordering of prodromal symptoms of Parkinson’s dis- with enough follow-up time to allow for conversion of
ease, cognitive decline, white matter neurodegeneration in patients to Parkinson’s dementia. This is ongoing work.
the substantia nigra, and cortical thinning (Supplementary Indeed, our models could be used to inform the design of
material). This is remarkable given the considerable such prospective studies, e.g. identifying which events areYou can also read