DigitalCommons@UMaine - The University of Maine
←
→
Page content transcription
If your browser does not render page correctly, please read the page content below
The University of Maine
DigitalCommons@UMaine

Electronic Theses and Dissertations Fogler Library

Summer 8-20-2021

Quantifying Surface Changes on McMurdo Ice Shelf, Antarctica
Ann M. Hill
University of Maine, ann.hill@maine.edu

Follow this and additional works at: https://digitalcommons.library.umaine.edu/etd

 Part of the Glaciology Commons

Recommended Citation
Hill, Ann M., "Quantifying Surface Changes on McMurdo Ice Shelf, Antarctica" (2021). Electronic Theses
and Dissertations. 3458.
https://digitalcommons.library.umaine.edu/etd/3458

This Open-Access Thesis is brought to you for free and open access by DigitalCommons@UMaine. It has been
accepted for inclusion in Electronic Theses and Dissertations by an authorized administrator of
DigitalCommons@UMaine. For more information, please contact um.library.technical.services@maine.edu.
QUANTIFYING SURFACE CHANGES ON MCMURDO ICE SHELF, ANTARCTICA

 By

 Ann M. Hill

 B.A. Skidmore College, 2018

 A THESIS

 Submitted in Partial Fulfillment of the

 Requirements for the Degree of

 Master of Science

 (in Earth and Climate Sciences)

 The Graduate School

 The University of Maine

 August 2021

Advisory Committee:

 Kristin M. Schild, Research Assistant Professor of Earth and Climate Sciences, and Climate
 Change Institute, Advisor

 Seth Campbell, Assistant Professor of Earth and Climate Sciences, and Climate Change Institute

 Peter Koons, Professor of Earth and Climate Sciences, and Climate Change Institute
Copyright 2021 Ann M. Hill

 All Rights Reserved

 ii
QUANTIFYING SURFACE CHANGES ON MCMURDO ICE SHELF, ANTARCTICA

 By Ann Hill

 Thesis Advisor: Dr. Kristin M. Schild

 An Abstract of the Thesis Presented
 in Partial Fulfillment of the Requirements for the
 Degree of Master of Science
 (in Earth and Climate Sciences)
 August 2021

The amount of ice stored in Antarctica has the potential to raise sea level by almost 60 meters.

Mass is primarily lost through glaciers draining the ice sheet and flowing into and ice shelves. Ice

shelves float on the ocean and act as a resisting force to the flow of the glaciers, thereby modulating

the flow of tributary glaciers, and consequently glacier contribution to global sea level rise.

McMurdo Ice Shelf (MIS) buttresses four tributary glaciers, three of which will be discussed in

this thesis, as well as the northwest corner of the faster flowing Ross Ice Shelf, which has tributary

glaciers flowing from both East and West Antarctica. McMurdo Ice Shelf also serves as a runway

for planes traveling to research bases on Ross Island. Therefore, if MIS were to thin, become

unstable, or collapse, the results would not only impact the rate of sea level rise, but also Antarctic

science logistics. This thesis quantifies changes in surface elevation and surface velocity to better

understand the relationship between MIS and its tributary glaciers. I isolated the surface elevation

change resulting from accumulation and ablation, and tracked ice shelf retreat across the study

region. I differenced high resolution digital elevation models (DEMs, 2011 – 2015) in the Hut

Point region of Ross Island, first correcting for errors introduced in DEM processing, and then

removing the tidal and atmospheric pressures across the ice shelf region. These results revealed

variable elevation change across the ice shelf (± 2 m) and across the ice on Hut Point Peninsula (±

5 m) as well as ice shelf front retreat (up to 1 km). While both the ice shelf thinning and the frontal
retreat contribute to the instability of MIS, the retreat is immediately concerning as it threatens to

cut off Ross Island from the runways via Pegasus Road, thereby necessitating that a relocation of

the road be considered. To further explore this system, I focused on evaluating velocity changes,

and deriving strain rates across the glacier-ice shelf system on both seasonal and annual timescales

by combining NASA velocity products with newly constructed geospatial velocity maps, utilizing

Landsat imagery. These results revealed speeds as high as 225 m a-1 on the glaciers and 215 m a-1

on the ice shelf, with higher speeds occurring during the summer months. Two relationships

between MIS and its tributary glaciers emerge: (1) seasonal velocity fluctuation of both the ice

shelf and the tributary glacier, and (2) fluctuation of only MIS velocity and consistent velocity on

the adjacent glaciers between seasons. These two relationships suggest spatial variability in the

system’s driving forces, and necessitate future work focusing on resolving these drivers. Results

from this thesis are the first of their kind to use remote sensing to evaluate the relationship between

tributary glaciers and MIS, and bridge a gap between in situ surveys and modeling projections.

ACKNOWLEDGEMENTS

First and foremost, I would like to thank my advisor, Dr. Kristin M. Schild for her constant support,

guidance, and advice. I would also like to thank my committee member, Dr. Seth Campbell, for always

encouraging me, and indulging my curiosity, regardless of how off-topic my question. I always value your

patience while helping me. Also, thank you to my committee member, Dr. Peter Koons, especially for

guiding me through strain rate calculations. I greatly appreciate your kindness, understanding, and how you

always listen to my thought process and reasoning, even if the logic is false.

Thank you to Dr. Chris Gerbi for taking me on as a research assistant during my first year, despite my lack

of background in Python.

Thank you to Dr. Laurie Padman for your assistance in running the Tidal Model Driver in the McMurdo

Ice Shelf region to eliminate the tidal signal when differencing digital elevation models.

Thank you to my funding sources, the National Science Foundation Office of Polar Programs grant

1842021, and the University of Maine. Also, thank you to the Dan and Betty Churchill Exploration Fund,

and the Geological Society of America Graduate Student Research Grant for providing funding for

fieldwork in Patagonia, despite its cancelation due to COVID-19.

Thank you to Dr. Greg Gerbi, Dr. Meg Estapa, and Jennifer Cholnoky for your guidance, support, and

encouragement in the graduate school application process, and for your work in preparing me for graduate

school. You guys believed in me when I didn’t, which has been more impactful than I could ever express.

Thank you so much to the amazing friends I have made here in Maine; I am so grateful for all of our

adventures, dinners, and game nights, which helped foster a healthier work-life balance than I have ever

had before. I am so lucky to have your support and encouragement, and I cannot wait for our future

expeditions!

 iii
Finally, and most importantly, I am so fortunate to have parents as dedicated, kind, supportive, encouraging,

and awesome as mine! Regardless of what wild idea I am pursuing, I know you will both do anything to

see me succeed, whether it be studying abroad in a High Arctic archipelago of which you have never heard,

or completing an extended backpacking trip. I don’t know where I would be without you two, but I do know

it would not be very far.

 iv
TABLE OF CONTENTS

ACKNOWLEDGEMENTS………………………………………………………………………..………iii

LIST OF TABLES…………………………………………………………………………………………ix

LIST OF FIGURES………………………………………………………………………………………...x

LIST OF ABBREVIATIONS…………………………………………………………………………….xiii

Chapter

1. INTRODUCTION……………………………………………………………………………………...1

 1.1. Motivation: Why study ice shelf – glacier interactions? …………………………………………1

 1.2. Background: The ice shelf – glacier system………………………………………………………2

 1.2.1. Force balance in an ice shelf – glacier system……………………………………………….3

 1.2.2. Oceanic and atmospheric forcings…………………………………………………………...5

 1.2.3. Tidal influence……………………………………………………………………………….5

 1.3. Present state……………………………………………………………………………………….6

 1.4. Thesis overview…………………………………………………………………………………...7

 1.4.1. Study site……………………………………………………………………………………..7

 1.4.2. Research questions………………………………………………………………………….10

 1.5. Thesis structures…………………………………………………………………………………10

 1.5.1. Chapter two………………………………………………………………………………...11

 1.5.2. Chapter three……………………………………………………………………………….12

2. RECENT STABILITY OF THE MCMURDO ICE SHELF AND HUT POINT

 PENINSULA GLACIERS IN WEST ANTARCTICA……………………………………………...13

 2.1. Abstract…………………………………………………………………………………………..13

 2.2. Introduction………………………………………………………………………………………14

 2.3. Methods………………………………………………………………………………………….18

 v
2.3.1. Ice thickness changes………………………………………………………………………18

 2.3.1.1. Vertical DEM correction………………………………………………………..19

 2.3.1.2. Atmospheric pressure correction………………………………………………..20

 2.3.1.3. Tidal correction………………………………………………………………….20

 2.3.2. Subsurface ice structure…………………………………………………………………….21

 2.3.3. TZ Hillside ice velocity…………………………………………………………………….22

 2.3.3.1. In situ surveys…………………………………………………………………...22

 2.3.3.2. Numerical modeling…………………………………………………………….23

 2.4. Results……………………………………………………………………………………...……23

 2.4.1. Spatial variability of HPP region…………………………………………………………..23

 2.4.2. Ice structure………………………………………………………………………………...25

 2.4.2.1. Pegasus Ice Road structure……………………………………………………...25

 2.4.2.2. TZ Hillside ice structure………………………………………………………...26

 2.4.3. Ice velocity profiles………………………………………………………………………...27

 2.4.3.1. In situ surveys…………………………………………………………………...27

 2.4.3.2. Numerical modeling…………………………………………………………….29

 2.5. Discussion………………………………………………………………………………………..30

 2.5.1. McMurdo Ice Shelf stability………………………………………………………………..30

 2.5.2. Hut Point Peninsula stability………………………………………………………………..32

 2.6. Conclusion……………………………………………………………………………………….33

 2.7. Acknowledgements………………………………………………………………………………34

3. QUANTIFYING TEMPORAL AND SPATIAL SURFACE VELOCITY

 CHANGES ACROSS THE ICE SHELF-GLACIER INTERFACE………………………………….35

 3.1. Abstract…………………………………………………………………………………………..35

 3.2. Introduction………………………………………………………………………………………35

 3.3. Methods………………………………………………………………………………………….39

 vi
3.3.1. Deriving velocities from feature tracking………………………………………………..…40

 3.3.2. Quantifying glacier-ice shelf velocity behavior…………………………..………………...41

 3.3.3. Anomalies………………………………………………………………………………..…44

 3.3.4. Strain rates………………………………………………………………………………….44

 3.3.5. Identifying surface melt…………………………………………………………………….45

 3.4. Results……………………………………………………………………………………………46

 3.4.1. Geospatial velocity patterns….……………………………………………………………..46

 3.4.2. Average ice shelf and glacier surface speeds………………………………………………49

 3.4.3. Surface speed along central transects………………………………..……………………..52

 3.4.4. Surface speed frequency distribution……………………………………………………….54

 3.4.5. Surface speed anomalies……………………………………………………………………56

 3.4.6. Volumetric and shear strain rates…………………………………………………………..59

 3.4.7. Identifying surface melt…………………………………………………………………….65

 3.5. Discussion………………………………………………………………………………………..66

 3.5.1. Comparison to other data…………………………………………………………………...66

 3.5.2. Surface velocity patterns……………………………………………………………………66

 3.5.3. Future work…………………………………………………………………………………69

 3.6. Conclusion……………………………………………………………………………………….70

 3.7. Acknowledgements………………………………………………………………………………70

4. CONCLUSION……………………………………………………………………………………….71

 4.1. Summary…………………………………………………………………………………………71

 4.2. Future work………………………………………………………………………………………72

BIBLIOGRAPHY…………………………………………………………………………………………74

APPENDIX………………………………………………..………………………………………………80

BIOGRAPHY OF THE AUTHOR………………………………………………………………………..85

 vii
LIST OF TABLES

Table 3.1. Data source used for each date, region, and calculation…………………………………..41

Table 3.2. Tributary glacier and ice shelf area averages, centerline transect averages, and

 glacier-ice shelf percent difference……………………………………………………….68

Table A.1. Imagery used in thesis and specific figures……………………………………………….83

 viii
LIST OF FIGURES

Figure 1.1 Driving versus resisting forces in a simple glacier-ice shelf system……………………...4

Figure 1.2. Map showing study region and focus study sites with

 major geographic points noted…………………………………………………………….8

Figure 2.1 Map showing study region and focus study sites with major geographic

 points noted………………………………………………………………………………15

Figure 2.2 Airborne image of Hut Point Peninsula (HPP), part of Ross Island……………………..18

Figure 2.3. Schematic diagram outlining the steps and data sets used in the

 developed method to correct each DEM prior to differencing…………………………..19

Figure 2.4. Surface elevation change on McMurdo Ice Shelf (MIS) and Hut Point Peninsula

 (HPP) between 6 February 2011 and 25 November 2015……………………………….24

Figure 2.5. A 400 MHz GPR profile collected along the Pegasus Ice Road in January 2015……….25

Figure 2.6. One of the parallel GPR Transects on the TZ Hillside (location noted in Fig. 2.7)……..27

Figure 2.7. The field survey area (inside green dotted line) of the TZ Hillside……………………...28

Figure 2.8. Temporal snapshot of the 3-D TZ Hillside finite element numerical model

 showing modeled ice velocities (m a-1) and a slice across the proposed road…………...29

Figure 3.1. Map showing study region and focus study sites with

 major geographic points noted…………………………………………………………...37

Figure 3.2. Map of annual average surface velocity in McMurdo Ice Shelf region from

 MEaSUREs…………………………………………………...………………………….39

Figure 3.3. Comparison of COSI-Corr to ITS_LIVE and GoLIVE datasets in the

 Terror and Aurora Glacier and Windless Bight region……………………………..……40

Figure 3.4. Location of transects over true-color image of focus regions, with ice shelf

 and glacier areas outlined discretely……………………………………………………..43

Figure 3.5. Idealized models of strain rate……………………………..…………………………….45

 ix
Figure 3.6 Surface velocity on Koettlitz Glacier and adjacent ice shelf……………………………47

Figure 3.7. Surface velocity on Terror and Aurora Glaciers, and the ice shelf in the

 adjacent Windless Bight…………………………………………………………………48

Figure 3.8. Comparison of the average surface speed on ice shelf in two study

 regions through time……………………………………………………………………..50

Figure 3.9 Comparison of average speed on Koettlitz Glacier, and the adjacent ice shelf area…….51

Figure 3.10 Comparison of average speed on Terror Glacier, Aurora Glacier, and the adjacent

 ice shelf area……………………………………………………………………………..52

Figure 3.11 Surface speed along transects on each of the three glacier sites and their

 adjacent ice shelf areas…………………………………………………………………...53

Figure 3.12. Surface speed distribution across Terror, Aurora, and Koettlitz Glaciers,

 and their adjacent ice shelf areas………………………………………………………...55

Figure 3.13. Ice shelf surface speed anomaly for region adjacent to Terror and Aurora Glaciers……57

Figure 3.14. Surface speed anomaly for Terror and Aurora Glaciers…………………………………58

Figure 3.15. Volumetric strain rate on the ice shelf adjacent to Koettlitz Glacier…………………….60

Figure 3.16. Shear strain rate on the ice shelf adjacent to Koettlitz Glacier…………………………..61

Figure 3.17. Volumetric strain rate on the ice shelf in the Windless Bight region……………………63

Figure 3.18. Shear strain rate on the ice shelf in the Windless Bight region………………………….64

Figure 3.19. Example of poorly calibrated surface reflectance, resulting in false NDLI

 values on MIS……………………………………………………………………………65

Figure 3.20. Comparing average surface speed on tributary glaciers to adjacent MIS area……….….67

Figure 3.21. Comparing average centerline transect surface speed on tributary glaciers to

 adjacent MIS area …………………………………………………………………….…68

Figure A.1. Surface elevation changes on McMurdo Ice Shelf (MIS) adjacent to

 Koettlitz Glacier………………………………………………………………………….79

 x
Figure A.2. Locations of COSI-Corr and ITS_LIVE/GoLIVE data splicing along the Aurora

 Glacier transect…………………………………………………………………………..80

Figure A.3. Location of COSI-Corr and ITS_LIVE/GoLIVE data splicing along the Terror

 Glacier transect…………………………………………………………………………..81

Figure A.4. Location of COSI-Corr and ITS_LIVE/GoLIVE data splicing along the Koettlitz

 Glacier transect…………………………………………………………………………..82

 xi
LIST OF ABBREVIATIONS

AASW Antarctic Surface Water

CDW Circumpolar Deepwater

COSI-Corr Co-registration of Optically Sensed Images and Correlation

DEM Digital Elevation Model

EAIS East Antarctic Ice Sheet

GoLIVE Global Land Ice Velocity Extraction

GPR Ground Penetrating Radar

GSSI Geophysical Survey Systems, Inc.

HPP Hut Point Peninsula

ICESat-2 Ice, Cloud and land Elevation Satellite-2

InSAR Interferometric Synthetic Aperture Radar

ITS_LIVE Inter-Mission Time Series of Land Ice Velocity and Elevation

MEaSUREs Making Earth System Data Records for Use in Research Environments

MIS McMurdo Ice Shelf

NDLI Normalized Difference Lake Index

NOAA National Atmospheric and Oceanic Administration

RIS Ross Ice Shelf

SAR Synthetic Aperture Radar

TMD Tidal Model Driver

TWTT Two Way Travel Time

TZ Transition Zone

WAIS West Antarctic Ice Sheet

 xii
CHAPTER ONE

 INTRODUCTION

1.1. Motivation: Why study ice shelf - glacier interactions?

As global average greenhouse gas concentrations continue to rise in the atmosphere, and consequently

atmospheric temperatures, the scientific community expects to see continued sea level rise due to both

thermal expansion and contribution from land-based ice. If all of the grounded ice on Earth melted,

Antarctica would contribute 57.9 ± 0.9 m to sea level rise (Morlighem et al., 2020), Greenland would

contribute 7.42 ± 0.05 m (Morlighem et al., 2017), and all other glaciers and ice caps would contribute 0.32

± 0.08 m (Farinotti et al., 2019). Specific rates of sea level rise vary by source, and can range from 1.56 ±

0.33 mm a-1 (Frederikse et al., 2020), to 3.07 ± 0.37 mm a-1 (Cazenave et al., 2018). While current rates of

sea level rise are dominated by contributions from smaller mountain glaciers and ice caps, Antarctica has

the potential to contribute far more to raise sea level rise over a prolonged period of time than any other

region (e.g. Bulthuis et al., 2019; DeConto & Pollard, 2016; Edwards et al., 2019; Hanna et al., 2020;

Levermann et al., 2014; Meier et al., 2007; Pattyn & Morlighem, 2020; Zemp et al., 2019). Therefore, I

focus this thesis on the controls of Antarctic sea level contribution.

The size of the Antarctic Ice Sheet is determined by its mass balance, which is calculated by subtracting

the annual ablation from the annual accumulation (Rignot et al., 2008). The Transantarctic Mountains

divide Antarctica. East Antarctic Ice Sheet (EAIS) has remained in a steady state, with some mass gain

found around along the coast, while the discharge of the West Antarctic Ice Sheet (WAIS) has exceeded

that of its surface accumulation (Rignot et al., 2019), resulting in a negative mass balance. The Ross Ice

Shelf lies between WAIS and EAIS, and consequently drains ice from glaciers on both sides of the

Transantarctic Mountains (Tinto et al., 2019). The location of Ross Ice Shelf makes it an essential

component of the dynamics of this region.

 1
Ice shelves form when glaciers flow off of their bedrock and float on the ocean, which must be cold enough

so the ice does not immediately melt. Ice shelves play an essential role in reducing the amount of discharge

from tributary glaciers by slowing their flow, thereby reducing the rate of mass transfer from land to sea.

Following the retreat of ice shelves, glaciers can accelerate and drain mass rapidly. This relationship was

observed following the collapse of the Larson A Ice Shelf, located on the northwest side of the Antarctic

Peninsula, where its tributary glaciers underwent a 450% velocity increase over the following 8 months

(Royston & Gudmundsson, 2016), thereby increasing the ice discharge rate and subsequent sea level rise.

Ross Ice Shelf is the largest ice shelf in the world and drains much of WAIS, a marine-based ice sheet,

meaning it rests on bedrock that sits below sea level (Horgan et al., 2011). As glaciers and ice shelves

interact as a system, changes in one location can propagate, altering the behavior up-glacier or down-glacier

onto the ice shelf, a process known as teleconnection (Reese et al., 2018). As most of WAIS is marine-

based, when water flows between the ice and the bed, the ice floats on the water, prying the ice apart from

the bed, which consequently allows more water to flow farther under the ice and floating more of the glacier.

This compounding process is known as a positive feedback loop, and the resulting reduced bed coupling

enhances the effects of up-glacier teleconnections (Reese et al., 2018). Glaciers and ice shelves are highly

responsive to small changes in their environment, such as increasing oceanic or atmospheric temperatures.

Due to this sensitivity, quantifying the relationship between ice shelves and their tributary glaciers is vital

in understanding future sea level rise. In this thesis, I explore the relationship between McMurdo Ice Shelf

(MIS) and its tributary glaciers.

1.2. Background: The ice shelf - glacier system

As ocean and atmospheric temperatures continue to increase, the contribution of glaciers to the mass

balance of ice shelves is of particular importance. While glacier contribution may help to thicken and

stabilize ice shelves, once ice flows from tributary glaciers across the grounding line into the ice shelf, that

mass contributes to sea level rise. Many external environmental factors can affect the interplay between ice

 2
shelves and glaciers, and these operate on timescales ranging from daily to decadal. Drivers of short-term

fluctuations include tides and atmospheric pressure, which can cause velocity and elevation shifts over a

matter of hours or days. Annual-scale impacts include precipitation, surrounding sea ice concentrations,

ocean current variability, and atmospheric and oceanic temperature changes. Decadal-scale, and longer,

impacts on the behavior of glaciers and ice shelves include the Pacific decadal oscillations, which influence

the ocean temperature at the ice-ocean interface (Rignot et al., 2019). These factors can contribute to

changes to the glacier-ice shelf system on seasonal to annual timescales, and are highlighted in the

remainder of section 1.2.

1.2.1. Force balance in an ice shelf – glacier system

The ice shelf helps to buttress its tributary glaciers by, together with the ocean, providing a resisting force

against the driving force of the glacier, ultimately slowing the glacier’s velocity (Fig. 1.1). Therefor the

thicker and larger the ice shelf, the more effective it will be at reducing mass transfer from land to ice shelf

(Fig. 1.1 A). When ice shelves shrink due to mass loss, the resisting force that acts against the driving force

of the glacier decreases, allowing the glacier velocity to increase (Fig. 1.1 B). Finally, when the ice shelf is

absent, the ocean provides the only resisting force against the flow of the glacier, and the glacier velocity

increases further (Fig. 1.1 C). Mechanisms of mass loss include the sub-ice shelf circulation of warm ocean

water, as well as surface melt resulting from above-freezing atmospheric temperatures (Fig. 1.1 D). Even

though changes in the size and dynamics of an ice shelf indicate future changes in the velocity and mass

balance of the tributary glaciers, uncertainties exist surrounding how much ice shelf change is required to

incite changes in the glaciers, and what facets of change are the most impactful. Therefore, this thesis

focuses on quantifying changes across the McMurdo Ice Shelf (MIS) and its tributary glaciers using remote

sensing techniques.

 3
Figure 1.1. Driving versus resisting forces in a simple glacier-ice shelf system. Ice shelves act as a buttress
to glaciers. Together the ice shelf and the ocean act as resisting forces (green arrows) against the driving
force (brown arrows) of the glacier. As shown in the full ice shelf scenario (A), the velocity of the glacier
is relatively slow due to the large ice shelf. In the partial ice shelf scenario (B), some of the ice shelf has
disintegrated, reducing the resisting force and increasing the glacier velocity. When no ice shelf remains
(C), the ocean provides the only resisting force, and the glacier velocity increases more. Also shown are
mechanisms of ice shelf melt (D) including basal ice shelf melt due to warm water circulation, and high

 4
summer surface melt due to intrusion of Antarctic Surface Water (AASW) and high quantities of surface
sediment.

1.2.2. Oceanic and atmospheric forcings

Warming of both the ocean and the atmosphere is tied to glacier acceleration and retreat, as seen in the

Antarctic Peninsula where glaciers in the southwest experience more retreat than those located in the

northwest (Cook et al., 2016). This difference in glacier behavior results from the southernmost Antarctic

Peninsula glaciers interacting with the warmer Circumpolar Deepwater (CDW), while those in the north

experience the colder surface water circulation (Cook et al., 2016). Spence et al. (2017) attribute this

warming to changes in wind patterns reducing circulation and trapping warm water along the coast.

Additionally, not all glaciers along the Antarctic Peninsula have ice shelves, making those more vulnerable

to change in response to oceanic conditions.

1.2.3. Tidal influence

Tides can impact the behavior of glaciers and ice streams from the terminus to over 80 km up glacier from

the grounding line through dynamic coupling (Anandakrishnan et al., 2003; de Juan et al., 2010).

Observations of glacier dynamics in relation to tides suggest that ice shelves and ice streams behave as a

single system, where changes in the tidal height incite changes in the glacier velocity (Brunt et al., 2010;

Doake et al., 2002). However, there is a lag between peak ice shelf velocity values and the maximum and

minimum tidal heights. The ice shelf reaches its maximum velocity after the maximum tide height, as the

tide is dropping, and the glacier reaches its minimum velocity after the minimum tide height, as the tide is

rising. This delay is also observed as far as 80 km up glacier from the grounding line (Anandakrishnan et

al., 2003). Additionally, higher strain rates measured near the front of the glacier, in comparison to those

up glacier, indicate that the tidal effects become muted when moving farther from the terminus (Podolskiy

et al., 2016). Conversely, on Greenland glaciers the maximum tidal velocity often occurs at low tide, instead

of partway between falling and rising tide, suggesting this difference is associated with the presence of

 5
large ice shelves in Antarctica that are absent in Greenland (Sugiyama et al., 2015). Overall, the ice shelves

appear to buffer the tributary glaciers, acting as a barrier between the ocean and the glaciers, delaying the

impact of the tides on the tributary glaciers.

1.3 Present state

While at present Antarctica is not the main contributor to sea level rise, the previously mentioned forcings

do contribute both to its behavior and its mass balance. From 1993 – 2018, Antarctica contributed 0.25 mm

a-1 to sea level rise out of 3.07 ± mm a-1 total annual sea level rise for this period (Cazenave et al., 2018),

and from 2012 – 2016 Antarctica contributed 0.53 mm a-1 to sea level rise, 0.48 mm a-1 of which originated

in West Antarctica (Bamber et al., 2018). As the Antarctic atmospheric temperature is almost always below

freezing, surface melt comprises a very small portion of the mass loss from Antarctica, and most mass loss

stems from mass transfer across the groundling line (Bamber et al., 2018). However, the small amount of

surface melt that does occur can have other negative impacts on the glacier-ice shelf system. For instance,

surface melt decreases the albedo, meaning more energy is absorbed by the surface and less is reflected

back to the atmosphere than snow or ice. In East Antarctica, the lower albedo caused by surface melt makes

it approximately three times easier for further melt to follow (Jakobs et al., 2019). Additionally, when the

water refreezes, the snow has a lower albedo than the new snow (Jakobs et al., 2021). Surface meltwater

can also incite hydrofracturing. As water is slightly denser than ice, if surface melt is sustained its pressure

can propagate cracks to the glacier bed (van der Veen, 2007). Therefore, on ice shelves, hydrofracturing

can accelerate calving (DeConto & Pollard, 2016), a process believed to have contributed to the breakup of

Larson B Ice Shelf (Banwell et al., 2013; Scambos, 2004). Furthermore, the fastest Antarctic ice velocities

are found along the coast on ice shelves (600 m a-1 – 1000 m a-1) and outlet glaciers (300 m a-1 – 600 m a-
1
 ), while the slowest velocities are towards the center of the continent (near 0 m a-1). These high velocities

result in rapid mass loss into the ocean, and increased surface melt would only amplify this process.

 6
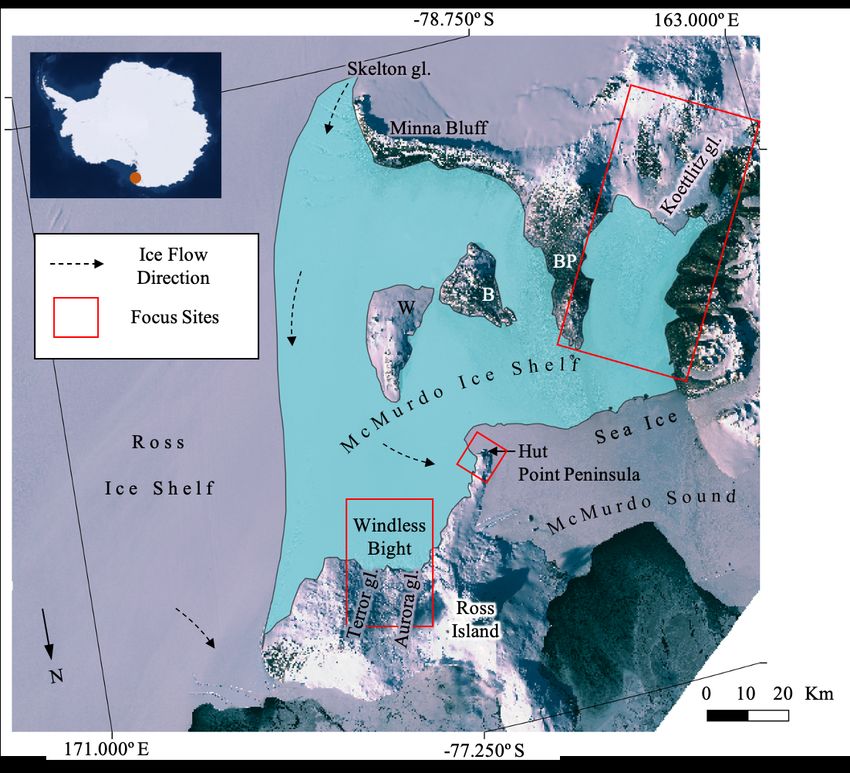
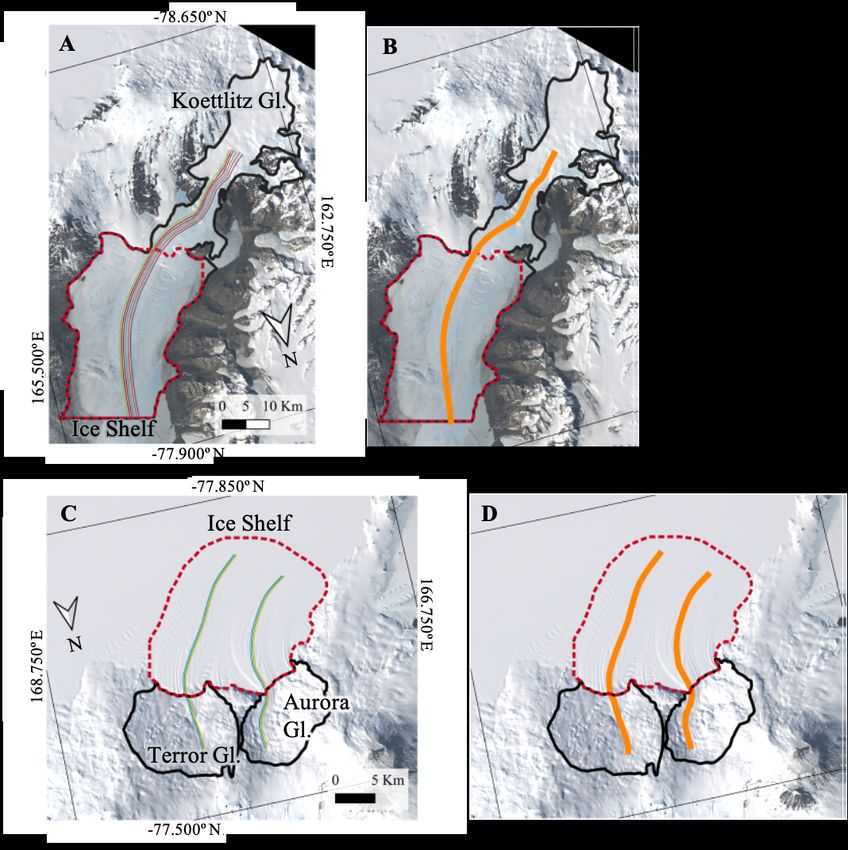
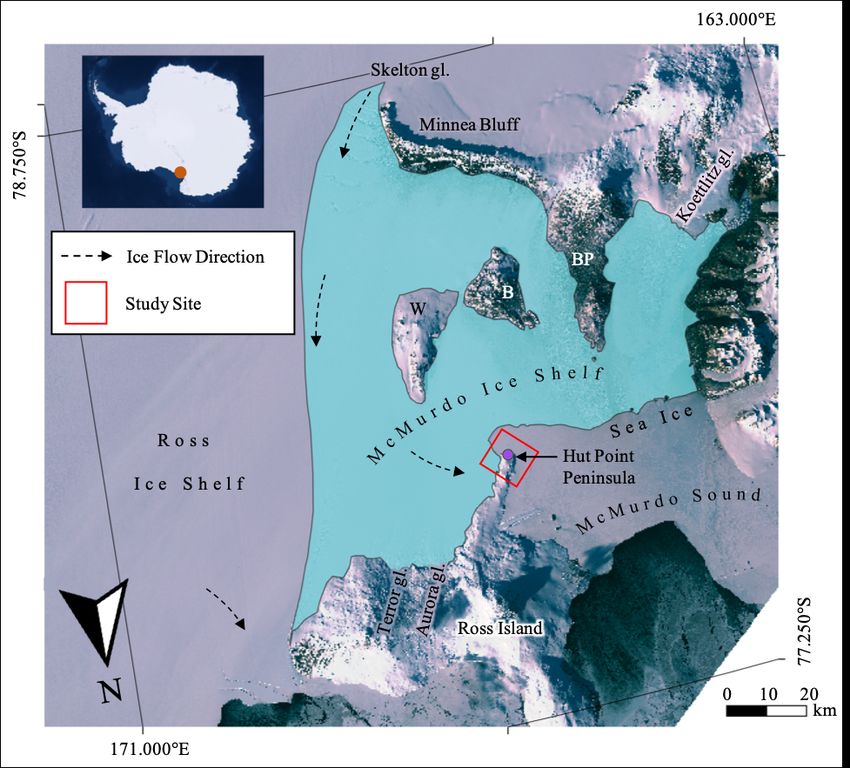
1.4. Thesis overview

1.4.1. Study site

For this thesis, I will focus on ice shelf-glacier interactions at McMurdo Ice Shelf, a critical and vulnerable

location in Antarctica. The McMurdo Ice Shelf covers ~1,500 km2, borders the Transantarctic Mountains

to its west (Banwell et al., 2017), and provides a buttress to four glaciers, Koettlitz, Terror, Aurora, and

Skelton, as well as the northwest corner of the much larger Ross Ice Shelf (~500,809 km2) (Fig. 1.2; Rignot

et al., 2013). In comparison to other ice shelves in Antarctica, MIS is relatively thin, varying greatly from

approximately 6-200 m across the ice shelf (Arcone et al., 2016; Campbell et al., 2017; Glasser et al., 2006).

MIS also experiences unusually high surface melt, reaching four times that seen on other Antarctic glaciers,

but experiences little calving (Glasser et al., 2006). The upward direction of ice flow around Black Island

transports basal sediment to the surface, which is then further exposed by ablation, leading this area to have

the highest sedimentation rates across the ice shelf (Glasser et al., 2006). During the summer season,

approximately 25% of the surface becomes flooded with streams and ponds, mostly concentrated in this

area (Glasser et al., 2006). The surface hydrology redistributes the debris across the ice shelf (Glasser et al.,

2006). Conversely, high accumulation rates, up to 1.5 m a-1, are found in Windless Bight, near the grounding

lines of Terror Glacier and Aurora Glacier (Fig. 1.2; Heine, 1967).

 7
Figure 1.2. Map showing study region and focus study sites with major geographic points noted. The MIS
(inset, orange circle; turquoise shading) is bound by the Ross Ice Shelf, and McMurdo Sound. Noted are
the locations of White Island (W), Black Island (B) and Brown Peninsula (BP). The red boxes define the
focus study sites of Terror and Aurora Glaciers flowing into Windless Bight, Hut Point Peninsula, and
Koettlitz Glacier and its adjacent ice shelf. Ice flow directions are denoted by dashed arrows (Campbell et
al., 2017) with tributary glaciers (gl.) labeled. Background image from Sentinel-2, collected on 11 October
2019.

While MIS can be difficult to measure, the existing research concludes that MIS is particularly vulnerable

to collapse, more so than any area of RIS (Rack et al., 2013; Stern et al., 2013; Tinto et al., 2019). If MIS

collapses, a potential retreat of RIS could follow. This reliance on MIS by RIS for stability is particularly

concerning because RIS buttresses both East and West Antarctic drainage basins. Furthermore, modeling

found MIS to experience tele-buttressing, whereby ice shelf thinning induces immediate acceleration of

 8
MacAyeal and Bindschadler Ice Streams over 900 km away, across the grounding line (Reese et al., 2018).

Currently, the thickness, and therefore a component of the resistive force of MIS, is controlled by the

balance of mass input from tributary glaciers and melt from oceanic and atmospheric forcings. However,

recent studies have found inconsistent results concerning thinning rates of the MIS region collected using

the same airborne radar program, suggesting challenges in data interpretation. Tinto et al. (2019) found that

warm sub-ice shelf circulation results in summer melt rates of 10 m a-1 in the MIS region, while the

neighboring RIS predominantly experiences summer melt rates of
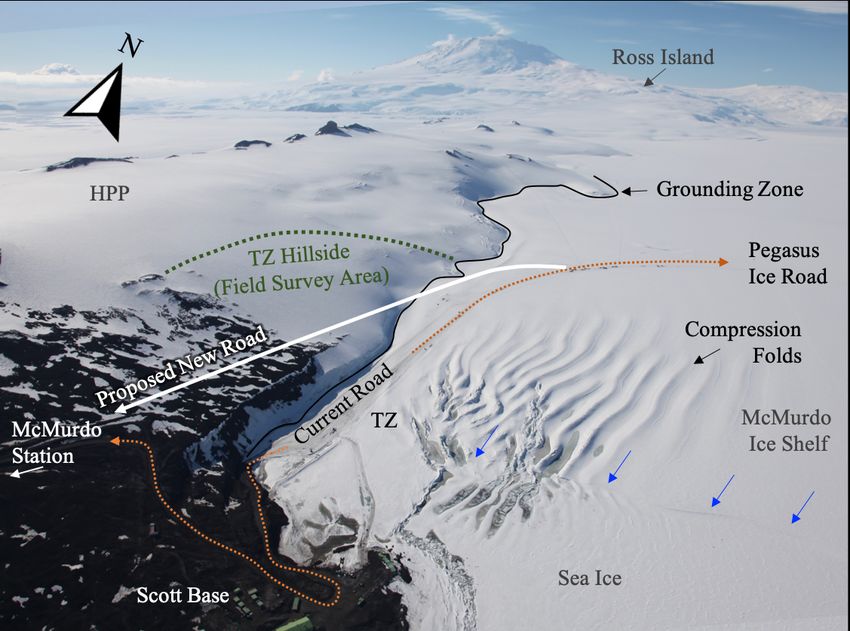
McMurdo Ice Shelf is also logistically important for both the U.S. Antarctic Program and the New Zealand

Antarctic Program, whose bases (McMurdo Station and Scott Base, respectively) lie adjacent to MIS on

Ross Island. The ice runways on MIS are the primary access point for the two bases, with Pegasus Road

connecting the runways to Ross Island. Due to the complex positioning, Pegasus Road crosses the

boundaries between MIS, sea ice, and Ross Island. This region of Pegasus Road experiences folding and

faulting, which forms as the ice shelf buttresses against the sea ice and rock. Thinning of MIS could lead

to retreat and destabilization of MIS, ultimately threatening the logistics of these two field programs.

1.4.2. Research questions

The behavior of Koettlitz, Terror, and Aurora Glaciers is modulated by MIS, and therefore, their longevity

is interconnected. However, few studies examine changes in glacier dynamics from a coupled glacier-ice

shelf behavior perspective (Smith et al., 2020). In this thesis, I will address this gap by answering the

question, what is the relationship between both surface elevation and surface velocity on the tributary

glaciers and McMurdo Ice Shelf? To answer this question, I will address the following specific objectives:

 1. Quantify large-scale spatial elevation by calculating the change in elevation over time on MIS and

 Ross Island

 2. Quantify changes in the glacier-ice shelf relationship by establishing a time series of surface

 velocity and strain rate of MIS and tributary glaciers

Each objective will be addressed in its own chapter of this thesis, as outlined in the following section.

1.5. Thesis structure

This thesis consists of an introduction chapter (Chapter one), two scientific papers (Chapters two and three),

a summary and next steps chapter (Chapter Four), a complete list of references used throughout this thesis,

and an appendix with the remainder of data not included in the scientific papers. The two scientific papers

 10
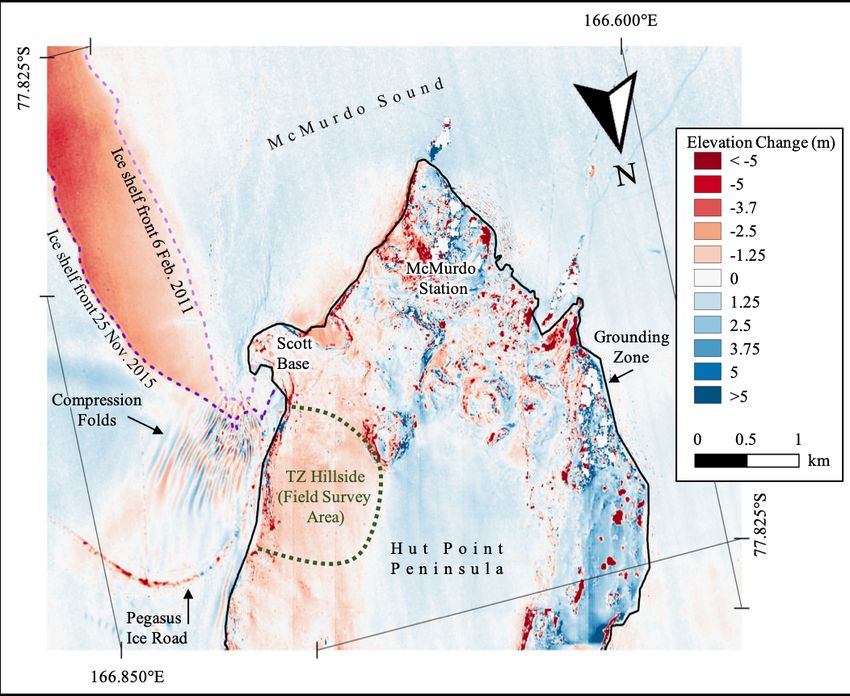
are presented in their submitted (Chapter two) or in preparation (Chapter three) versions. The only

modifications to the papers were those needed to comply with the University of Maine Graduate School

thesis requirements: the references for each paper have been combined into one complete list of references

for this thesis, and figure captions, chapter sections, and the in-text citation formatting is uniform

throughout the thesis. Each of the two scientific chapters begins with an abstract, and follows the common

journal format of an introduction, methods, results, discussion, conclusion, and acknowledgements. Below

are the summaries for each scientific chapter.

1.5.1. Chapter two

Chapter two, “Recent Stability of the McMurdo Ice Shelf and Hut Point Peninsula Glaciers in West

Antarctica”, uses a combination of remote sensing imagery, in situ measurements, and modeling results to

identify changes in the McMurdo Ice Shelf region, and how the stability could impact Hut Point Peninsula

based logistics. This study used Digital Elevation Models (DEMs), from the Polar Geospatial Center for

2011 and 2015, to quantify ice thickness changes across MIS and Hut Point Peninsula. Given that this

region is critically important for the operation of the US and New Zealand Antarctic bases, and is a region

in flux, additional in situ surveys were performed as reconnaissance for the potential rerouting of the current

ice road. The in situ surveys and numerical models investigated the ice shelf stability at a structural level.

The in situ surveys included Ground Penetrating Radar (GPR) profiles collected adjacent to the current ice

road to measure ice structure, and GPS velocity surveys in the same region. Using these in situ

measurements, a numerical model was established to evaluate the long-term stability and maintenance of

this proposed new road region. Major findings of the project showed variable thinning of the ice shelf in

this region, and substantial retreat of the ice shelf front adjacent to Hut Point Peninsula between 2011 and

2015, ultimately threatening the longevity of the current Pegasus Road.

This manuscript was submitted to the peer-reviewed journal Cold Regions Science and Technology on 23

April 2021. My co-authors are Dr. Seth W. Campbell and Dr. Kristin M. Schild, both at the University of

 11
You can also read