Australian household food waste - A summary of behaviours, attitudes, perceived and actual food waste - Fight Food Waste CRC
←
→
Page content transcription
If your browser does not render page correctly, please read the page content below
In-home research

Australian household food waste

A summary of behaviours, attitudes, perceived
and actual food waste
Behaviour, attitudes, perceived and actual food waste

This research was commissioned by the Project Steering Group for the Designing effective interventions to
reduce household food waste project. It is part of a four-year research project delivered through the Fight
Food Waste Cooperative Research Centre.

Project Steering Group members are:

Authors

Dr Gamithri Gayana Karunasena (Central Queensland University)

Professor David Pearson (Central Queensland University)

Published June 2021

The Fight Food Waste Cooperative Research Centre (CRC) gratefully acknowledges the Australian
Government’s financial contribution through the Cooperative Research Centres program as well as the
participants of this project.

We thank Instinct and Reason for collecting and analysing the data in this report. Their team successfully
navigated a complex methodology, interruptions due to COVID-19 and the need for complete transparency
with respondents about the research purpose and requirements. In particular, we would like to thank
Danica Jobson for her dedication and commitment.

This document should be cited as: Karunasena, G.G, Pearson, D, and Fight Food Waste CRC (2021) Australian
household food waste: A summary of behaviours, attitudes, perceived and actual food waste, Fight Food
Waste Cooperative Research Centre, Adelaide. Australia.

© Fight Food Waste Limited 2021

Level 1, Wine Innovation Central Building, Cnr Hartley Grove and Paratoo Road, URRBRAE SA 5064

enquiries@fightfoodwastecrc.com.au +61 8 8313 3564

All information, data and advice contained within the report is provided by the Fight Food Waste CRC
in good faith and is believed to be accurate and reliable as at the time of publication. However, the
appropriateness of the information, data and advice in the report is not guaranteed and is supplied by Fight
Food Waste CRC ‘as is’ with no representation or warranty.
Behaviour, attitudes, perceived and actual food waste

Report background:

“Designing effective interventions to reduce household food waste” is a Fight Food Waste CRC’s research
project. The project reports will provide evidence-based insights covering food waste behaviours and
attitudes of Australian households, quantification of perceived and actual household food waste, advice
regarding priority segments, identification of global best practise interventions, household food waste
reduction interventions for priority segments, messages for selected intervention and cost-effective
methodologies for evaluating the impact of selected interventions.

How to read the reports in this series:

This report is one of six reports published in the series “Australian household food waste”. A summary of the
implications and evidence to support these is provided in “A summary of behaviours, attitudes, perceived
and actual food waste” whilst the other five reports provide detailed results. These being: “Survey findings
of behaviours and perceived food waste”, “Electronic-diary findings of recorded food waste and disposal
methods”, “Kerbside bin audit findings of actual food waste”, “Focus group findings of attitudes to food
waste”, and “Choice model findings of food waste reduction interventions”.
Contents
Table of Figures .......................................................................................................................................... ii
List of Tables.............................................................................................................................................. iii
1.     Executive Summary ............................................................................................................................ 1
       1.1.      Recommendations............................................................................................................................... 1
       1.2.      Change needs a number of ingredients .............................................................................................. 2
       1.3.      Behaviours needing to change to reduce food waste......................................................................... 2
       1.4.      The causes of food waste are complex ............................................................................................... 4
       1.5.      Key food wasters ................................................................................................................................. 4
       1.6.      Few Australians realise they have an issue ......................................................................................... 4
       1.7.      Estimates of amount of food waste .................................................................................................... 4
2.     Methodology ...................................................................................................................................... 5
       2.1       Research project inclusions ................................................................................................................. 5
       2.2       Sample Limitations .............................................................................................................................. 7
       2.3       Sample Profile ...................................................................................................................................... 7
3.     Overall findings from the qualitative research ..................................................................................... 9
       3.1.      The question of what causes food waste is highly complex ............................................................... 9
       3.2.      Need recognition is missing............................................................................................................... 10
       3.3.      Food waste situation analysis............................................................................................................ 10
       3.4.      Model of change ................................................................................................................................ 12
4.     Overall findings from the quantitative studies ................................................................................... 14
       4.1.      Food waste volume and cost outcomes ............................................................................................ 14
       4.2.      Conversion factor electronic-diary to bin audit results for only red bin data .................................. 18
5.     Food waste volumetric outcomes – benchmark survey ...................................................................... 18
6.     Food waste outcomes from the electronic-diary ................................................................................ 21
       6.1.      Most wasted food products (by value) ............................................................................................. 23
7.     Food waste outcomes from the physical bin audit ............................................................................. 26
       7.1.      Food waste result between recorded and physical bin audit (only food disposed of in red bin) .... 27
8.     What behaviours are linked to food waste? ....................................................................................... 30
9.     What interventions might reduce food waste? .................................................................................. 34
10. Future research considerations ......................................................................................................... 40
Appendix A – methodological notes .......................................................................................................... 41
       In-home food waste social research survey sample recruitment ................................................................ 41
       Screening questions ...................................................................................................................................... 42
       Electronic diary ............................................................................................................................................. 42
       Bin audit ........................................................................................................................................................ 42
       Analysis ......................................................................................................................................................... 43
       Technical data collection and analysis.......................................................................................................... 44
       Per Capital Food Waste Calculation Methodology ....................................................................................... 47
Appendix B – Survey Forms ....................................................................................................................... 48
Appendix C – Electronic diary .................................................................................................................... 66

                                                                                                                                                                           i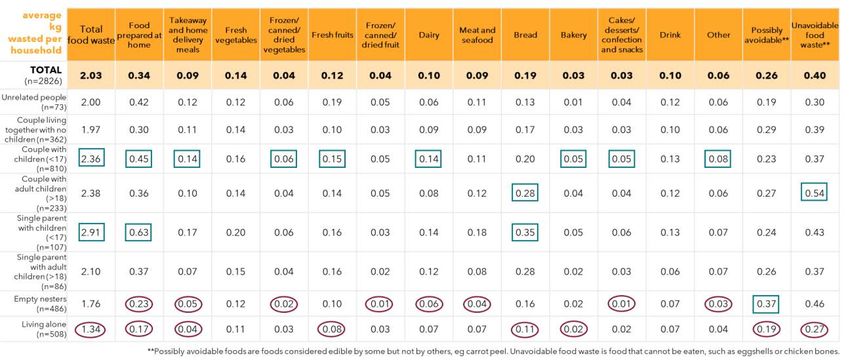
Table of Figures
Figure 1: Research phases ....................................................................................................................................... 6
Figure 2: Method ..................................................................................................................................................... 6
Figure 3: Model of change ..................................................................................................................................... 13
Figure 4: Quantity of food disposed ...................................................................................................................... 15
Figure 5: Calculation assumptions ......................................................................................................................... 15
Figure 6: Value of food disposed ........................................................................................................................... 16
Figure 7: Food waste measures ............................................................................................................................. 17
Figure 8: Comparisons of food waste across the three food waste measures ..................................................... 17
Figure 9: Electronic diary conversion factor .......................................................................................................... 18
Figure 10: Food disposal methods ........................................................................................................................ 21
Figure 11: Food waste and value (includes all food disposed of) - by total sample ............................................. 22
Figure 12: Food waste and value (only food disposed of in red bin) - by total sample ........................................ 22
Figure 13: Top recorded food products wasted (includes food disposed in-house)- by value............................. 23
Figure 14: Food waste from the bin audit and estimate for total food waste...................................................... 27
Figure 15: Food waste result between recorded in electronic-diary and physical bin audit (only food disposed
of in red bin) .......................................................................................................................................................... 27
Figure 16: Classification of very low to high food wasters .................................................................................... 31
Figure 17: Food planning relationships with level of food waste ......................................................................... 31
Figure 18: Food purchasing and its relationships with level of food waste .......................................................... 32
Figure 19: Food storage and its relationships with level of food waste ............................................................... 32
Figure 20: Food preparation and its relationships with level of food waste ........................................................ 33
Figure 21: Food disposal and its relationships with level of food waste .............................................................. 34
Figure 22: Experiments testing interventions ....................................................................................................... 35
Figure 23: Planning and shopping choice model design ....................................................................................... 35
Figure 24: Planning and shopping interventions and relative impact on reducing food waste ........................... 36
Figure 25: Scenario showing likely impact on food waste with optimal intervention strategies employed ........ 36
Figure 26: Storing interventions choice model design .......................................................................................... 37
Figure 27: Storing interventions and relative impact on reducing food waste .................................................... 37
Figure 28: Scenario showing likely impact on food waste with optimal intervention strategies employed ........ 38
Figure 29: Preparing and disposing interventions choice model design .............................................................. 38
Figure 30: Interventions and relative impact on reducing food waste ................................................................. 39
Figure 31: Scenario showing likely impact on food waste with optimal intervention strategies employed ........ 39

                                                                                                                                                                          ii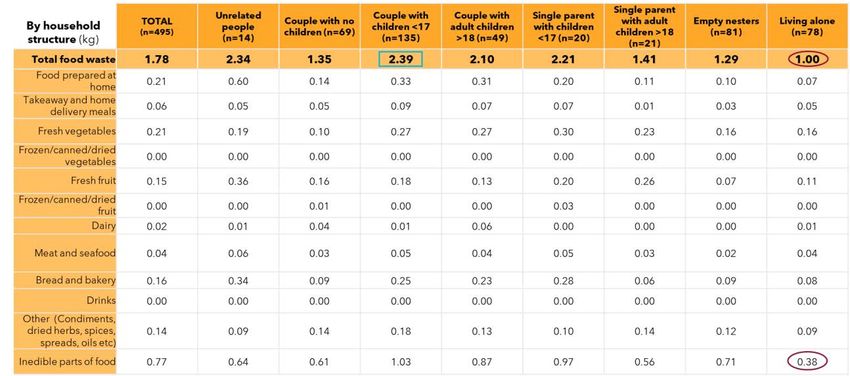
List of Tables
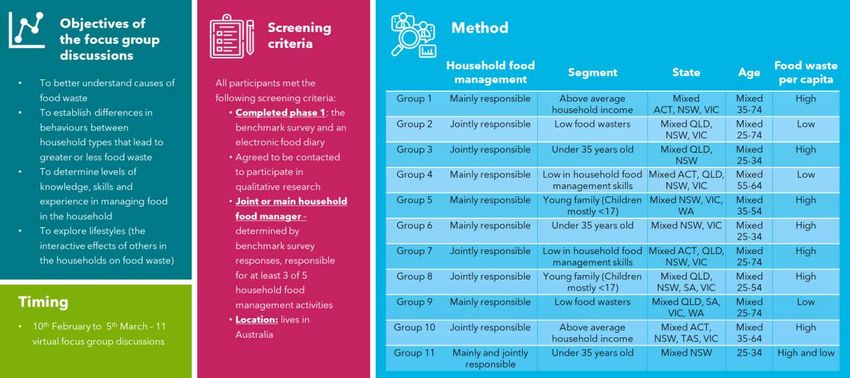
Table 1: Qualitative method .................................................................................................................................... 7
Table 2: Sample profile Household structure.......................................................................................................... 8
Table 3: Sample profile Household income ............................................................................................................ 8
Table 4: Sample profile Age and Gender ................................................................................................................. 9
Table 5: Estimated food waste (in kg) - by state ................................................................................................... 19
Table 6: Estimated food waste (in kg) - by household structure .......................................................................... 20
Table 7: Estimated food waste (in kg) - by age ..................................................................................................... 20
Table 8: Estimated food waste (in kg) - by income ............................................................................................... 21
Table 11: Recorded food waste (includes all food disposed of) - by state ........................................................... 23
Table 12: Recorded food waste (includes all food disposed of) - by age and gender .......................................... 24
Table 13: Recorded food waste (includes all food disposed of) – by household structure .................................. 25
Table 14: Recorded food waste (in kg) - by weekly household income................................................................ 26
Table 15: Recorded food waste via bin audit (in kg) - by state ............................................................................. 28
Table 16: Recorded food waste via bin audit (in kg) - by age and gender ............................................................ 29
Table 17: Recorded food waste via bin audit (in kg) - by household structure .................................................... 29
Table 18: Recorded food waste via bin audit (in kg) - by weekly household income ........................................... 30
iii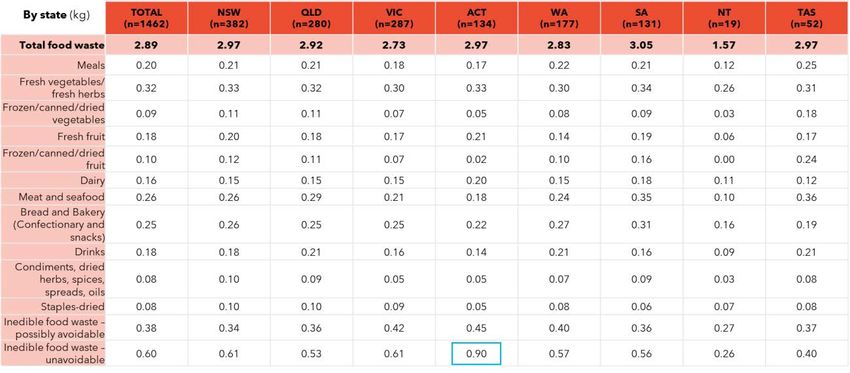
1. Executive Summary
Following the Fight Food Waste Cooperative Research Centre (FFW CRC) 2019 benchmark study into
Australians and food waste, it was apparent that householders underestimate the amount of food waste they
produce, and it was deemed necessary to undertake further research to capture a better household measure
of the amount of food waste produced and why it was happening.

This 2020/21 study achieves three measures of food waste as assessed by main and joint household food
managers. The study starts with a self-report survey that asks householders to estimate food waste, then uses
an electronic-diary that records food waste over a seven-day period, and finally, includes a physical bin audit
to measure the food waste found in the bin (matched to the same period as the electronic-diary). The study
compares the three food waste records and then, using focus group discussions, explores the causes and
remedies for food waste.

1.1. Recommendations
The research suggests that consideration should be given to the following initiatives:
    •   A broad strategy should be considered that generates ‘need recognition’ for changed food
        management amongst the heavy food wasters of the wealthy, families with children and those under
        35-years old.
    •   Facilitation: Social norms dictate that food waste avoidance is desirable so people will use tools,
        guidance on making structural changes to lifestyle, food management that facilitate positive change
        are needed.
    •   Reinforcement: Food management is an everyday activity that lends itself to the formation of habits
        as mental shortcuts reduce demand on the mind’s limited thinking power. Once behaviour change is
        triggered, reinforcement strategies using multiple channels are needed to make sure positive
        behaviours become established.
    •   Education: After establishing the value of food waste, then build awareness of the environmental
        impact of food waste, focusing on the carbon emissions spent to grow, distribute and market the food.
    •   Tools as habit changers: There was extensive support in the focus groups and the choice modelling for
        tools that help. Household food managers want tools that help them achieve their goals (see need
        states) AND reduce food waste. Where these two align then food waste is likely to be lowered.
    •   Change strategies need to recognise the emotional needs at work and develop solutions that gratify
        these need states yet deliver better food waste outcomes. Four spaces were identified:
        •   Food is planned, prepared, and provided my way (individualism)
        •   Food is for us to nurture other and to bond around (belonging)

                                                                                                             1
•   Food needs to make everyone happy (freedom)
           •   Food is to be efficiently managed (control)

1.2.   Change needs a number of ingredients
       •   People need to want to change, and this is currently uncommon because most people don’t believe
           they personally waste a significant amount of food.
       •   Overcoming structural factors that impact directly on food waste such as busy, unpredictable lifestyles
           and stage of life pressures such as career peaking, parenting, caring for elderly family members, etc
           play a crucial role in triggering risky food waste behaviours.
       •   However, many also face logistical issues such as being located far from shops … “I have to shop for a
           week because I’m a long way from the shops… so I tend to buy in case I need something”. These
           structural and logistical issues need to be acknowledged by individuals so that they can put strategies
           in place to minimise risky food waste behaviours.
       •   Many food managers are missing knowledge + experience + expertise as some have never been taught
           how to cook, or have negative food waste attitudes established and, as such, are unprepared to
           manage food in a way that minimises food waste.
       •   Habits need to shift, and this speaks to the heart of the challenge. Food is a low order issue with almost
           everything else deemed more important. Food management becomes a mental shortcut (a habit) that
           uses little cognitive energy. People say they are extremely busy and that they have no time to plan
           and manage food (especially families with younger children) which is code for everything else is more
           important than making sure I don’t produce any food waste. So, habits needing change require
           conscious effort.
       •   Once need for change is triggered, it isn’t attitudes that need to change; it is behaviours. Most
           participants found tools that make change appealing. They emphasised the need for ease and
           convenience. However, simple, easy-to-use and access tools are needed to compensate for adverse
           habits and a lack of knowledge, skills, and expertise.

1.3. Behaviours needing to change to reduce food waste
Many, if not all of these factors, are inter-related, making it difficult to say that one single behaviour is the
cause of food waste. However, the evidence from the quantitative data analysis and supported by the
conversations in the focus group discussions shows that the following behaviours have a positive impact on
the amount of food waste a household produces. The following behaviours are in order of their impact on
food waste, and include:

                                                                                                                   2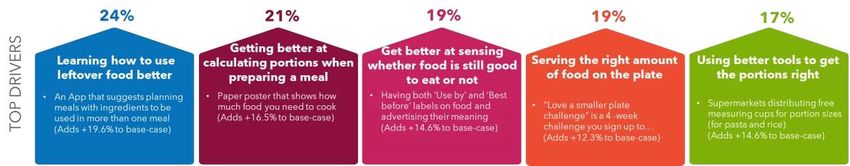
1. Buying better
•   Regularly checking what food is in the fridge or freezer, which is critical knowledge that informs food
    purchases.
•   Rotating food by moving oldest items to the top/front of fridge/freezer means the food manager
    knows what food is there and this informs better food purchases.
•   Only buying what’s on the shopping list (avoid buying ‘just in case’ which runs risks of wasting food).
•   Those who buy too much food in the first place and have no way to eat it all will end up producing
    more food waste.
2. No food waste is a goal
•   Those who claim to not waste any food at all (this demonstrates a strong desire to avoid food waste
    and means more proactive food waste behaviours are adopted).
3. Prepare what’s needed
•   Those who only prepare as much food as is needed (taking away any risk of making too much food).
    Conversely, those who cook too much food run the risk of this food being uneaten and the data shows
    a clear correlation with higher levels of food waste. Similarly, those who cook food ‘just in case’ are
    also likely to waste more food.
4. Let consumers serve themselves
•   Those who let others serve themselves avoids plated food waste. Household members not finishing
    their meals means the leftover plate waste is almost certainly thrown away. This links to the earlier
    behaviours of allowing people to serve themselves ensuring the right amount of food is plated up.
5. Better storage knowledge
•   Reading the storage instructions (they know how long they have to use the food).
•   Being prepared to use food past its ‘use by’ or ‘best by’ dates (giving greater opportunity to use the
    food). Conversely those who strictly abide by these dates waste more food.
6. Some new knowledge is needed
•   Learning how to use cooked leftovers (and being prepared to eat what is left over is linked to reduced
    food waste). Without a household demand for leftovers, food is often stored in fridge or freezer but
    is ultimately discarded. Households that have a culture of prioritising eating leftovers waste less food.
•   Lack of knowledge about how to use left-over ingredients is linked to higher levels of food waste.
    Learning new skills and expertise or having access to tools that guide action here could reverse this
    relationship.
7. Need to stick to a plan
•   Those who don’t cook the meals they planned and substitute with take-away, go out for a meal or buy
    extra ingredients for a meal that they happen to feel like at that moment, produce more food waste.

                                                                                                           3
1.4. The causes of food waste are complex
Many factors contribute to food not being eaten. Starting with a widespread attitude that there isn’t a
personal food waste problem, structural realities of life that make food management challenging (such as
affordability and competing priorities that make food management a low order issue), lack of knowledge about
food and how to repurpose and use ingredients, lack of cooperation between household members to minimise
food waste, lack of food management expertise, entrenched attitudes that undermine food waste prevention
(e.g. it is always better to have too much than too little in the fridge and on the table), behaviours that increase
the risk of food being wasted (both conscious and unconscious [habits]), and finally, values that discount the
environment and prioritise individual rights and preferences over all else.

1.5. Key food wasters
The groups wasting more food than the average, and thus are key target audiences for change strategies are:
    •    busy families (especially young families with children under 17 years)
    •    wealthy (those with household incomes over $3,000 per week, over $156,000 per year)
    •    those under 35 years of age

1.6. Few Australians realise they have an issue
Householders underestimate their food waste significantly. This was evident with self-reported results from
the survey and electronic-diary being significantly below the actual amount measured in the bin audit.

Another important contributing factor to food waste and to the lack of awareness of the food waste issue is
the widely held belief that the only issue is when food waste is sent to landfill. This has led to the strong
position that composting is virtuous and hence there is little awareness of all the effort embedded in the food
being lost. If unaddressed this could lead to adverse outcomes for the FOGO (food organics garden organics)
bin introductions. People feel they are doing the right thing by disposing of food (either composting at home
or in a FOGO bin) rather than addressing the root issue of eating all the food they buy and hence not wasting
any of it.

1.7. Estimates of amount of food waste
The survey estimate was 2.03 kg of food waste per household per week and the electronic-diary found 2.89kg.
The bin audit shows 1.78kg per household per week. However, this bin audit data does not include food
disposed of by other methods such as being fed to pets, put in home compost bin, and down the sink. Using
the bin audit result and adding these additional disposal amounts it is estimated that 4.22 kg of food is wasted

                                                                                                                  4
per household per week. The cost of this food waste is $41.02 per household per week. When adjusted for
the number of people in the household, the estimated amount is 1.88 kg ($18.55) of food is wasted per person
per week. According to the electronic-diary, fresh vegetables, meat and sea food, bread and bakery, meals,
fresh fruits and drinks are the top 6 products wasted in Australia.
2. Methodology
The following section summarises the overall research design of the project. Please refer the individual reports
for more details on the methodology for each data source (“Survey findings of behaviours and perceived food
waste”, “Electronic-diary findings of recorded food waste and disposal methods”, “Kerbside bin audit findings
of actual food waste”, “Focus group findings of attitudes to food waste” and “Choice model findings of food
waste reduction interventions”).
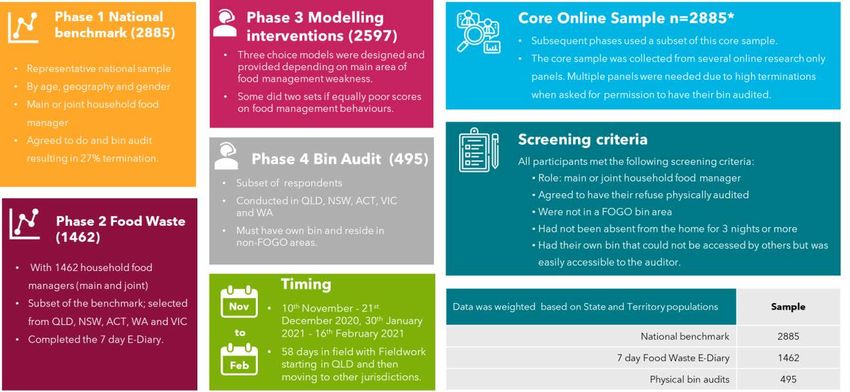
2.1 Research project inclusions
1. A national self-report benchmark survey with 2885 main and joint household food managers (a
shortened version of the 2019 survey)
2. A 7-day detailed electronic-diary record of food disposed of by 1462 respondents (a sub-set of the
benchmark sample of 2885). These respondents completed an electronic-diary that recorded all the
food waste the respondent was aware of and how it was disposed (i.e., in the red bin, down the sink,
supplied to animals, placed in the compost or worm farm, etc)
3. Testing of potential interventions: all 1462 respondents who completed the electronic-diary also
completed one or two discrete choice experiments where possible interventions designed to support
better household food management behaviours were tested based on the respondent’s weakest food
management behaviour identified in the benchmark survey. There were three different models
produced based on responses from 2597 respondents (some took part in two choice experiments
because their household food management behaviours were equally weak in two areas).
4. The final element of the quantitative phase was a sub-set of 495 of the 1462 electronic-diary
respondents who were selected for a physical food waste audit of their bin, carefully aligned to their
7-day electronic-diary record.
The four quantitative data sets (ie. Survey, electronic-diary, testing potential interventions, and bin
audit) are linked with an anonymous respondent ID and FFW CRC are able to make comparisons
between each, with the physical bin audit capturing the most reliable evidence about the quantity of
food waste. The accuracy of self-reported food waste has long been questioned, with self-reported
food waste suspected of being highly inaccurate. The daily record kept by the electronic-diary has
many advantages as it also captures food waste that is disposed of in ways that the physical bin audit
5cannot measure (e.g., fluids disposed down the sink, composting and food fed to animals). The
physical bin audit is highly accurate apart from where food waste is disposed of by other means.
5. Finally, qualitative research using 10 focus group discussions explored how the behaviours identified
in the quantitative research actually led to food being wasted.
Figure 1: Research phases
The quantitative methodology is outlined in 2 below.
Figure 2: Method
The qualitative stage involved 10 virtual focus group discussions where participants were recruited directly
from the survey sample based on demographics and whether they came from a household with above or
below average food waste.
6The details are outlined in Table 1 below.
Table 1: Qualitative method
2.2 Sample Limitations
FFW CRC required participant permission for the physical bin audit from every respondent, irrespective of
whether they were audited or not. This, and other sample requirements, led to a substantial proportion of the
sample drawn for the study being terminated before having the opportunity to complete the survey. This
potentially affected both the sample quality and the actual food waste behaviour of households by bringing a
bias to the sample by only including those prepared to have their bin physically audited.
About 40% of the original sample was terminated for a variety of reasons, including:
1. The need for a weekly waste pick-up (many places in Australia have a 14-day one).
2. The sample could NOT include those people living in a FOGO bin collection area. This would have
required two bins to be audited which was outside the scope of the contract, and food waste may
have been hard to discern in the FOGO bin. The proportion of Australian households with a FOGO bin
is rapidly rising and means the chance to replicate this study will be much harder/more costly in the
future
3. Respondents needed a secure bin to ensure only one household’s food waste was present.
4. The respondent needed to be present in the house for most of the week and not away from home.
2.3 Sample Profile
• 4921 Australian households cleared all the screener questions from the original 8289 who were invited
to take part in the study.
7• 71% agreed to do an electronic-diary and have the physical bin audit conducted (3568).
• 2885 (or 81%) completed the benchmark survey and 1462 completed the electronic-diary.
• 495 had physical bin audits conducted.
Despite the potential sample biases introduced by the requirements outlined above, the sample acquired
across the three research phases closely resembled the Australian population in many respects. There was a
slight skew away from people living alone (23% in the Australian population and slightly less in all phases), and
there were similar but minor variations in other demographic categories.
Table 2: Sample profile Household structure
The sample acquired across the three research phases for income also closely resembled the Australian
population. There was a skew in the benchmark survey to lower income (22% in the Australian population and
30% in the benchmark survey). There were only minor variations in other categories.
Table 3: Sample profile Household income
The sample acquired across the three research phases for age varied from the Australian population. There
was a skew in the benchmark survey away from those aged 18–34 years. This was to be expected with
8considerable numbers of Australian youth still living at home and unlikely to play a significant role in household
food management (a requirement of study participation).
As a result of the natural skews caused by the survey screener requirements, the data was only weighted by
state/territory to make it representative of the Australian population mainly and jointly responsible for
household food management.
Table 4: Sample profile Age and Gender
3. Overall findings from the qualitative research
The research involves 10 focus group discussions to better understand causes of food waste, establish
differences in behaviours between household types that lead to greater or less food waste, determine how
levels of knowledge, skills and experience in managing food in the household impact food waste, and finally,
explore lifestyles (the interactive effects of others in the households on food waste).
3.1. The question of what causes food waste is highly complex
The focus group discussions reveal that many factors contribute to food not being eaten. Starting with a lack
of awareness that food waste is an issue, it is then the structural and logistical realities of life that make food
management challenging (such as affordability and competing priorities that make food management a low
order issue), lack of knowledge about food and how to repurpose and use ingredients, lack of cooperation
between household members to minimise food waste, lack of food management expertise, entrenched
attitudes that undermine food waste prevention (e.g. it is always better to have too much than too little in the
fridge and on the table), behaviours that increase the risk of food being wasted (both conscious and
9unconscious [habits]), and finally, values that discount the environment and prioritise individuality – “If I want
to waste food I have a right to do so”.
Many, if not all of these factors, appear inter-related. Knowledge about food management varies as does
knowledge of the environmental issues surrounding food waste. Poor knowledge in these areas allows adverse
attitudes to form which, in turn, lead to food management behaviours that increase the risk of food waste.
Because of weak motivations to reduce food waste, many food waste risky behaviours become habits.
Convenience dominates over careful planning, people fail to cooperate with each other because of competing
interests and priorities, people put entertainment and socialising first over preventing food waste, and a
preference to eat whatever food that provides instant gratification overrides the need to eat food that is
planned for leaving it to be wasted.
3.2. Need recognition is missing
At the heart of the challenge facing those wanting to see food waste reduce is that many Australians don’t
feel responsible for the food that is wasted. This is either because they believe they “don’t really waste much
food”, or they “just don’t realise uneaten food impacts climate change”. Almost all in the 10 focus groups think
that composting and feeding food to animals negates any adverse environmental impact. The qualitative work
affirms that in order to change behaviours, the first step is to ensure all Australians understand that there is a
need to change their own food management behaviours to reduce food waste. The steps include:
1. Generate recognition that food waste is an important environmental issue that needs their personal
attention and focus
2. Generate greater awareness that every household is producing more waste than it needs to (and that
they think they do)
3. Cost the waste for household food managers (to prove it is costing the household a significant sum of
money)
4. Provide tools and education that facilitates new and changed behaviour and reduces food waste
5. Build habits that mean less food waste.
3.3. Food waste situation analysis
The situation analysis derived from analysis of the focus groups shows that there are several factors that mean
achieving a greater focus on food waste is not an impossible task and that right now is an opportune time.
Strengths
10• Few Australians want to be seen as food wasters. It is not generally acceptable to be seen by others
as wasting food. Many people would intervene if they saw food being wasted and would object to it
in front of others even if the food were being wasted in someone else’s home. There is not a
fundamental opposition to wasting less food and this is a very positive starting point.
• Furthermore, in a COVID-19 world, many Australians have had time to focus on food and to think more
about their knowledge, skill set, what food is better for them etc. Where food is often a chore in a
busy world, over the last year, food has been more pleasurable for many.
• There was also greater interest in “what really matters” and this has come to include their
relationships with family and friends, a rising concern for the environment and how food waste
contributes to climate change.
• Moreover, stagnant wages growth for 80% of Australians over the last two or more decades means
food affordability matters more and this links to a need to reduce the food that is wasted.
While there are some situational factors working in favour of a greater focus on food waste, there are also
some very significant barriers to success. These will require energy and effort to challenge the entrenched
views of people’s perceived reality.
Weaknesses
• Most people underestimate their food waste with almost all believing that their own personal
household food waste is relatively minimal. Most believe they personally don’t have a problem!
• People define food waste differently (many don’t know exactly what it is and what are the elements
of food waste).
• Therefore, the need for them to change their personal food waste behaviours is almost non-existent.
In behavioural change terms the need recognition for any change is low and, without it, few will look
for help to change their behaviour.
• Knowledge of the link between food waste and environmental damage is confused and focuses on
reducing landfill and not on minimising CO2 emissions generated through the food supply chain.
Many in the focus groups did not want to waste money and clearly there is an opportunity to calculate the
average value of food waste and promote it to the Australian community. This will help get some attention on
the problem, but for many, this message will bypass them. For many wealthy Australians (and a key food waste
target), the cost of the wasted food is less important than the cost of their time to address the problem.
Similarly, busy families (another key food waste target) are simply overwhelmed by the scope of their
responsibilities and cannot find time to address the problem. The key to encouraging changed behaviours in
11both audiences are simple tools, information, storage, education on ‘use by’ and ‘best by’ dates and other
initiatives that facilitate changed behaviours.
Opportunities
• To stimulate need recognition by emphasising the dollar value of food wasted
• To stimulate action by promoting knowledge of food waste and its impact on climate change
• Provide tools that assist change in food waste generation.
It was apparent in the focus group discussions that people presently have some time and energy to focus on
important issues like the environment and on food waste. However, this is unlikely to last as people revert to
more normal lives post COVID-19. Instead, food waste practitioners will be faced with a world overloaded with
information and even greater competition for the attention of food managers.
Threats
• COVID-19 was a short term opportunity and soon people will return to a frenetic lifestyle where food
waste matters less
• In an attention-declining world, food waste will struggle to get its messages to the wealthy and busy
families that need to reduce wasted food
3.4. Model of change
The qualitative research revealed that change will need a number of elements and that these elements will
need to be staged.
The following figure illustrates the challenges facing food waste practitioners:
12Figure 3: Model of change
People will need to want to change
Most agreed that a person must want to change, and most do not because they don’t believe they personally
waste a significant amount of food. Many in the focus groups declared… “I don’t waste food …if anything is
left, it’s composted … I never let it get to land fill so why do I need to change?”. Put another way, “It’s well and
good for a supermarket to offer [measuring cups / fridge and freezer thermometers and to be free], but it’s
just going to end up in a drawer long term like the thermometer [because it’s not an important enough issue
to make me focus on it]”. A change strategy will have to overcome these points of opposition particularly to
prove the substantive food waste issue is personal, before householders will seek information on how to
change their behaviours.
Overcome significant contributing factors
Lifestyles and the stage of life play a crucial role in driving food waste risky behaviours. As many busy families
stated “we just don’t have time to cook the things we plan to. Things stay in the back of the fridge and go green
and furry before we even notice” … “I never know who will be here for dinner” … “I never know who will be
home on the week-end” … “Life is just too unpredictable [so I am preparing food just in case]” … “I have fussy
eaters … whenever I try something new most of it isn’t eaten [plated food is often thrown away]” .
However, many also face structural issues such as being located far from shops … “I have to shop for a week
because I’m a long way from the shops… so I tend to buy in case I need something”. These issues need to be
acknowledged so that strategies can be put in place to minimise risky food waste behaviours.
13Need knowledge + experience + expertise
Some people report having never been taught how to cook, or their parents didn’t drill into them the need to
finish everything on their plate when they were young. As some outlined … “My mother did everything for me
when it came to food … I am totally unprepared to deal with preparing meals” … and they often recognised
their lack of knowledge and ability by saying that “other people [in the group] seem to know so much about
how to substitute and use ingredients in different ways … I have no idea at all”. Hearing how others manage
food and are able to avoid waste triggered an interest in many. Simple practical tips that are easy to remember
are a way of stimulating better behaviours.
Habits must shift
At the heart of the challenge is that food is a low order issue for many. Many report being extremely busy
(especially families with younger children) and that “we would never think what we were going to do for a
meal next Monday … we need to get into the habit of thinking ahead … and planning ahead.” However, they
also acknowledge the difficulties of changing entrenched food planning, purchasing, and preparing habits.
“this kind of change will take some effort because we are just not used to thinking about meals … we are in
auto pilot most of the time.”
Tools
Once need for change is triggered it isn’t attitudes that need to change; it is behaviours. Most focus group
participants found tools that make change easier to be appealing. “I’d love [an app that suggests meals you
can make with ingredients, tells you what’s in the fridge and when things are going to go off]. It would definitely
assist me”. They emphasised the need for ease and convenience … “It needs to be easy though … it wouldn’t
work if I have to spend more time entering all the food in my fridge and their expiry dates into the app”.
4. Overall findings from the quantitative studies
4.1. Food waste volume and cost outcomes
When compensating for food disposed of in the home, the data showed that 4.22 kg of food was wasted per
household per week. The conversion figure from the electronic-diary to the physical bin audit was a factor of
1.46 (i.e., the electronic-diary accounted for 68% of the food waste found in the bin. See Assumptions for in-
home food disposal compensation in Figure 4). When adjusted for the number of people in the household, the
data showed that 1.88 kg of food was wasted per person per week.
14Figure 4: Quantity of food disposed
The following assumptions have been used for the calculations:
Figure 5: Calculation assumptions
The cost of food waste is $41.02 per household per week or $2,133 per household per year. This amounts to
$18.55 per person per week. The costs are based on detailed data from the electronic-diary results which
include cost estimates on almost 900 food products.
15Figure 6: Value of food disposed
The sample comprised 53.9% of respondents who were the main household food manager planning for food
shopping; doing the food shopping; unpacking and storing the food; doing the food preparation including
cooking and disposing of food not eaten. The remaining 46.1% were only partly responsible for some of these
roles in the household.
The two groups were quite different in the roles they played in food management, their knowledge of what
occurred across many of the household food management roles including knowing about all the food waste
that may be generated. Nevertheless, they were actively engaged, albeit to a lesser extent in the production
of food waste, and their views matter.
The following chart highlights significant differences in the food waste estimates, electronic-diary records and
the physical bin audits of their household bins.
While the physical bin audits showed little difference between the main household food manager and the
joint household food managers (2.26 and 2.67 respectively), the electronic-diary records told a different story.
In these, the main food managers recorded 1.06 kg per household per week in the electronic-diary, and the
joint food manager recorded 2.22 kg of food waste per household per week. This high quantity of food waste
was not reflected in the physical bin audit suggesting that the joint food mangers food volume estimates were
higher than the amount of food waste produced and therefore more inaccurate. However, the results for food
waste put directly into the red bin by the main household food manager did not align well with the bin audit
and revealed a large discrepancy (2.26 kg per and not the 1.06kg recorded in the electronic-diary. In contrast
the results from the joint household food managers were much closer (2.67 kg in the audit and 2.22 kg in the
electronic-diary).
16Figure 7: Food waste measures
When comparing the three studies, the quantity of food waste increased from 2.02 kg per household in the
benchmark (0.98 kg per person) relying on an individual’s estimate, to 2.89 kg as recorded in the electronic-
diary over a 7-day period (1.36 kg per person), to 4.22 kg per household (1.88 kg per person) as weighed in
the physical bin audit (and weighted by the proportion of food disposed of outside the red bin as recorded in
the electronic-diary).
Figure 8: Comparisons of food waste across the three food waste measures
According to the physical bin audits, the largest proportion of food waste was inedible food waste that is
possibly avoidable and unavoidable (1.83 kg per household or 0.81 kg per household per person). This includes
17anything inedible such as peels, skins, bones, shells, cores, and stems. The four other main forms of food waste
are: fresh vegetables (0.50 kg per household or 0.23kg per person); food prepared at home (0.50 kg per
household or 0.21kg per person); bread and bakery (0.39 kg per household or 0.16 kg per person); and then
fresh fruit (0.36 kg per household or 0.17 kg per person).
4.2. Conversion factor electronic-diary to bin audit results for only red bin data
Given that physical bin audits will be rarely undertaken given the high costs involved, a key outcome of this
study was to calculate the conversion factor from electronic-diary to physical bin audit. These costs are likely
to be magnified as more green and FOGO bins are given to households and a measurement of food waste will
require checking red as well as green and FOGO bins.
Figure 9: Electronic diary conversion factor
The conversion factor for foods recorded as being disposed of in the red bin on the electronic-diary compared
with the physical red bin audit overall is 1.38.
5. Food waste volumetric outcomes – benchmark survey
The food waste study started with a regular online survey called the benchmark study. In this initial online
survey respondents estimated the food they wasted. Essentially this was a guess and the results show food
managers estimating their food waste at 2.03 kg per household on average across Australia. This is significantly
lower than the quantities measured in the electronic-diary (2.89 kg per household) and estimated total (4.22
kg per household. This being bin audit and adding additional amounts from fed to pets, put in home compost
bin, and down the sink). As has long been suspected, individuals significantly underestimate the quantity of
food waste. The food waste estimate is highest in the ACT at 2.88 kg per household and lowest in Tasmania at
1.43 kg per household.
The breakdown in food waste while being much lower than other measures, has a similar pattern regarding
the types of food waste that is most prominent. According to the estimate of individual food managers, the
largest proportion of food waste is inedible food waste that is possibly both avoidable and unavoidable (0.66
18kg per household). Possibly avoidable foods are foods considered edible by some but not by others, e.g. carrot
peel.
Unavoidable food waste is food that cannot be eaten such as eggshells or chicken bones. The other main forms
of food waste are food prepared in the home (0.34 kg per household), followed by bread and bakery items
(0.22 kg per household), then fresh vegetables (0.14 kg per household), and then fresh fruit (0.12 kg per
household).
Estimates of food waste were fairly uniform across all the food categories nationally. The stand-out difference
in the benchmark was that ACT participants more than any others, felt that they could possibly avoid some of
their food waste.
Table 5: Estimated food waste (in kg) - by state
Households with children (under 17 years) estimate that they waste significantly more food (2.36 kg per
household) than the national benchmark average (2.03 kg per household). Estimates by single parents with
children under 17 years was especially high (2.91 kg per household). Both groups felt that their food waste
was mostly from food they prepared at home. Couples with adult children at home were most likely to feel
that their food waste was unavoidable, yet once children had left home the empty nesters felt they could do
more to avoid food waste. About a quarter of all households in Australia consist of only one person. This group
estimated that they wasted the least food in the benchmark suggesting that more control over all the food
activity stages from planning to disposing food waste may help minimise food waste.
19Table 6: Estimated food waste (in kg) - by household structure
Those aged 35–54 years thought that they wasted the most food (2.29 kg per household compared to national
average 2.03). Households with children under 17 years were mainly in this age group so this aligned with the
higher food waste reported earlier. Older participants (55–74 years) thought they wasted less food (1.75 kg
per household) and were more likely to think waste could be avoided. The same pattern appeared in many
food categories with takeaway/home delivery food waste showing the most difference between younger and
older age groups. Those aged 18–34 years reported 0.15 kg of waste while those aged 75 and older report
0.03 kg per household.
Table 7: Estimated food waste (in kg) - by age
According to estimates of food waste, it is those on average household incomes who reported most food
waste (2.28 kg per household compared to the national average of 2.03 kg per household). The lowest food
waste volume was reported by those with no income (1.64 kg per household and 1.81 kg per person by those
earning $1-$999 household income per year. The physical bin auditing and electronic-diary results shows those
with the higher household income are least accurate in their estimated food waste.
20Table 8: Estimated food waste (in kg) - by income
Food waste is disposed of in many ways other than the red bin, with 47% of households tipping some food
waste down the sink (sometimes to almost every time); 37% placing waste in the green waste bin; 36% feeding
some food to animals; 30% composting waste and 12% putting food waste in their worm farm.
Figure 10: Food disposal methods
6. Food waste outcomes from the electronic-diary
21The electronic-diary data which includes food disposed of through all means shows that 2.89 kg of food is
wasted per household per week, or 1.36 kg wasted per person per week.
Figure 11: Food waste and value (includes all food disposed of) - by total sample
The electronic-diary data shows 1.28 kg of food is disposed on in the red bin per household per week. This
amount does not include food disposed of via other means such as fed to pets, put in home compost bin/worm
farm, or tipped down the sink.
Figure 12: Food waste and value (only food disposed of in red bin) - by total sample
226.1. Most wasted food products (by value)
Figure 13: Top recorded food products wasted (includes food disposed in-house)- by value
The electronic-diary estimate of food waste found Victoria recorded the least food waste (2.73 kg per
household) and South Australia the highest (3.05 kg per household). The national average for estimated food
waste in the electronic-diary is 2.89 kg per household with all results (except the NT with only 19 respondents)
falling within 5.5% of the national average.
Table 9: Recorded food waste (includes all food disposed of) - by state
The electronic-diary reflects a similar pattern as the benchmark regarding age, with the youngest category of
18–34-year-olds recording the most food waste (3.59 kg per household), and the 55–74-year-old age group
the least (2.38 kg per household). The benchmark saw this pattern in many of the food categories. Males
23recorded more food waste than did females (3.04 kg per household compared to 2.80 kg per household) with
the largest difference being the type of food wasted (meat and seafood) where males recorded wasting 50%
more than females.
Table 10: Recorded food waste (includes all food disposed of) - by age and gender
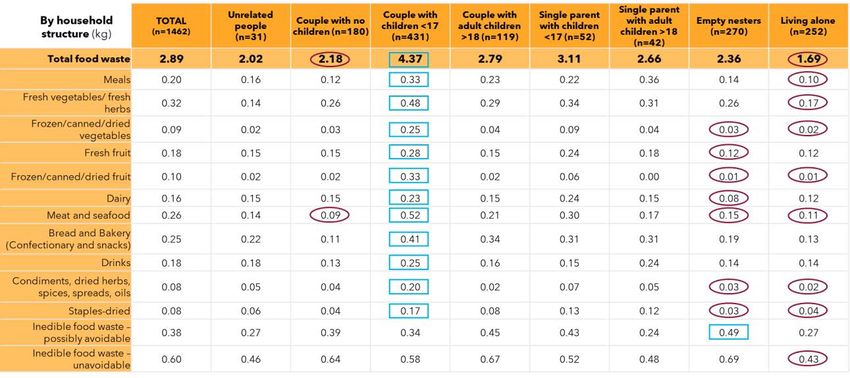
The electronic-diary aligns strongly with the benchmark results regarding the significantly larger food waste
measurements for families with children under 17 years (4.37 kg per household compared to average of 2.89
kg per household).
24Also, those living alone measured lower levels of food waste (1.69 kg per household) compared to the average
of 2.89 kg per household). There are other weak correlations with the benchmark study where couples without
children measured less waste (2.18 kg) as did ‘empty nesters’ (2.36 kg per household).
Table 11: Recorded food waste (includes all food disposed of) – by household structure
The measurement provided by the electronic-diary revealed that high income households had more food
waste (4.65 kg per household compared to the average of 2.89 kg per household). This was significantly more
than lower income households (under $50,000 HHI households produced 2.33 kg per household and $50,000–
$100,000 HHI households produced 2.49 kg per household). This indicates a strong correlation between
household income and food waste. Although not significant at the 99% level, prima facie, food waste trends
upwards as income increases. This correlation between income and food waste was not clear in the
benchmark study where there was only one significant correlation — the income category ($1000–$1999 per
week).
25You can also read