Management of the Kaibab Plateau Bison Herd in Grand Canyon National Park - 2018-2019 Operations Report
←
→
Page content transcription
If your browser does not render page correctly, please read the page content below
National Park Service
U.S. Department of the Interior

Natural Resource Stewardship and Science

Management of the Kaibab Plateau Bison Herd in
Grand Canyon National Park
2018–2019 Operations Report
Natural Resource Report NPS/GRCA/NRR—2020/2167
ON THIS PAGE
It takes a team: some of the 2019 Grand Canyon National Park Bison capture team.
NPS Photo/ Bryan Maul

ON THE COVER
Bison in Little Park, North Rim, Grand Canyon National Park
NPS Photo/ Skye Salganek
Management of the Kaibab Plateau Bison Herd in
Grand Canyon National Park
2018–2019 Operations Report
Natural Resource Report NPS/GRCA/NRR—2020/2167

Miranda L. N. Terwilliger1, Cynthia R. Hartway2, Kate A. Schoenecker3, Gregory Holm1, Linda C.
Zeigenfuss3, Megan Swan4, D. Skye Salganek1, Danielle Buttke5, DVM5, and Dana T. Musto1
1
Grand Canyon National Park
Grand Canyon, AZ
2
Wildlife Conservation Society
Missoula, MT
3
 U.S. Geological Survey, Fort Collins Science Center and
Ecosystem Science and Sustainability, Colorado State University
Fort Collins, CO
4
 Southern Colorado Plateau Inventory & Monitoring Network
National Park Service
Flagstaff, AZ
5
 Biological Resources Division and Wildlife Health Branch and Office of Public Health
National Park Service
Fort Collins, CO

August 2020

U.S. Department of the Interior
National Park Service
Natural Resource Stewardship and Science
Fort Collins, Colorado
The National Park Service, Natural Resource Stewardship and Science office in Fort Collins,
Colorado, publishes a range of reports that address natural resource topics. These reports are of
interest and applicability to a broad audience in the National Park Service and others in natural
resource management, including scientists, conservation and environmental constituencies, and the
public.

The Natural Resource Report Series is used to disseminate comprehensive information and analysis
about natural resources and related topics concerning lands managed by the National Park Service.
The series supports the advancement of science, informed decision-making, and the achievement of
the National Park Service mission. The series also provides a forum for presenting more lengthy
results that may not be accepted by publications with page limitations.

All manuscripts in the series receive the appropriate level of peer review to ensure that the
information is scientifically credible, technically accurate, appropriately written for the intended
audience, and designed and published in a professional manner.

This report received formal, high-level peer review based on the importance of its content, or its
potentially controversial or precedent-setting nature. Peer review was conducted by highly qualified
individuals with subject area technical expertise and was overseen by a peer review manager.

Views, statements, findings, conclusions, recommendations, and data in this report do not necessarily
reflect views and policies of the National Park Service, U.S. Department of the Interior. Mention of
trade names or commercial products does not constitute endorsement or recommendation for use by
the U.S. Government.

This report is available in digital format from the Natural Resource Publications Management
website. If you have difficulty accessing information in this publication, particularly if using assistive
technology, please email irma@nps.gov.

Please cite this publication as:

Terwilliger, M. L. N., C. R. Hartway, K. A. Schoenecker, G. Holm, L. C. Zeigenfuss, M. Swan, D. S.
Salganek, D. Buttke, and D. T. Musto. 2020. Management of the Kaibab Plateau bison herd in Grand
Canyon National Park: 2018–2019 operations report. Natural Resource Report NPS/GRCA/NRR—
2020/2167. National Park Service, Fort Collins, Colorado. https://doi.org/10.36967/nrr-2278108.

NPS 113/173624, August 2020
                                                    ii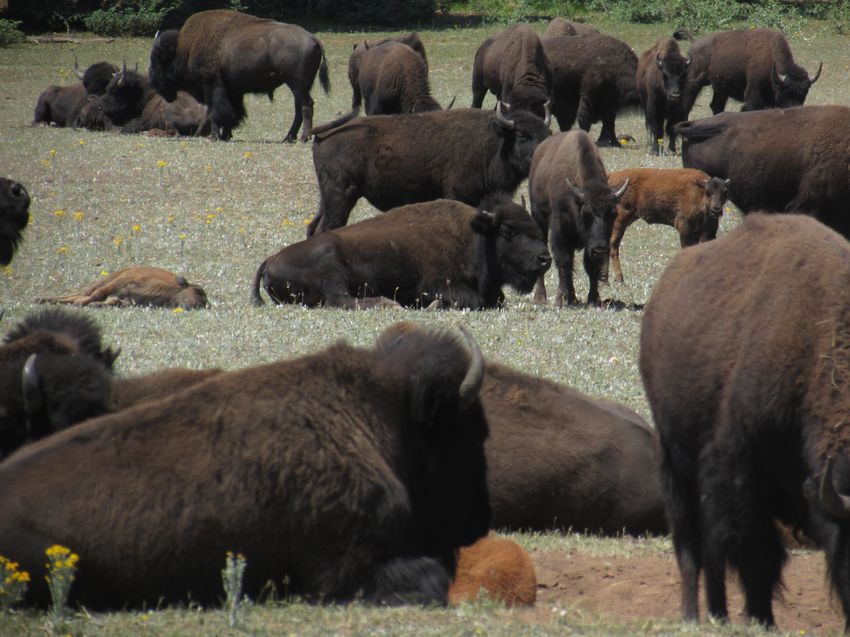
Contents
                                                                                                                                                      Page

Figures.................................................................................................................................................... v

Tables ................................................................................................................................................... vii

Executive Summary ............................................................................................................................viii

Acknowledgements ................................................................................................................................ x

List of Acronyms .................................................................................................................................. xi

Herd History........................................................................................................................................... 1

Live Capture Operations ........................................................................................................................ 5

       Planning .......................................................................................................................................... 5

       Baiting ............................................................................................................................................ 6

       Capture Operations ......................................................................................................................... 7

Disease Monitoring .............................................................................................................................. 11

Genetic Testing .................................................................................................................................... 13

       Introduction .................................................................................................................................. 13

            Sampling and DNA extraction ................................................................................................ 14

            Genetic Diversity Analysis ...................................................................................................... 15

            Genetic Differentiation Analysis ............................................................................................. 15

            Cattle Introgression Analysis .................................................................................................. 16

       Results .......................................................................................................................................... 16

            Genetic Diversity Analysis ...................................................................................................... 16

            Genetic Differentiation Analysis ............................................................................................. 17

            Cattle Introgression Analysis .................................................................................................. 18

Population Size & Distribution Study (Ongoing) ................................................................................ 26

       Population Estimation .................................................................................................................. 26

       Demography ................................................................................................................................. 27

Effects of Bison on Habitat (Ongoing) ................................................................................................ 29

       Meadow Resources....................................................................................................................... 29
                                                                             iii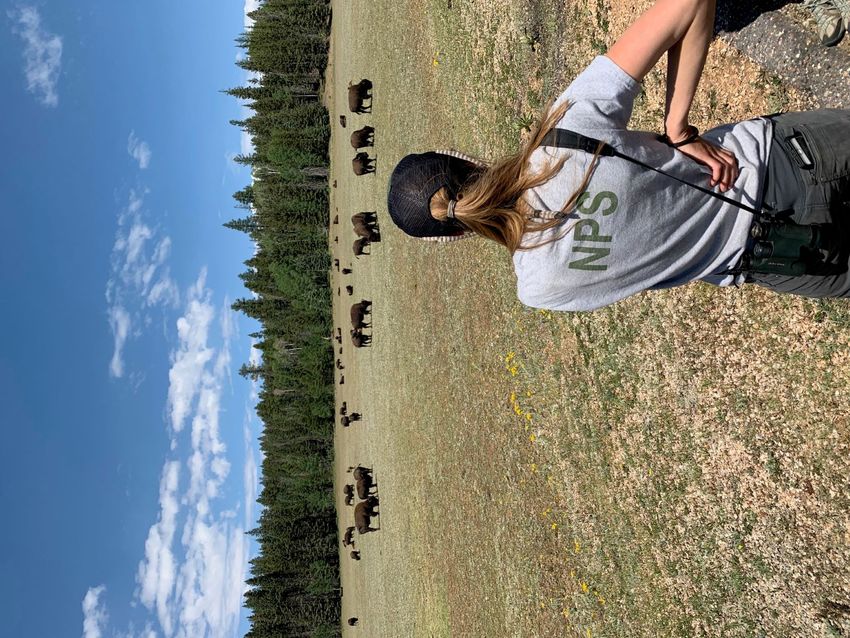
Contents (continued)
                                                                                                                                                Page

           Site Selection ........................................................................................................................... 30

           Field Methods .......................................................................................................................... 31

           Statistical Analyses.................................................................................................................. 32

           Findings/ Preliminary Results ................................................................................................. 33

           Next Steps................................................................................................................................ 34

       Spring Resources .......................................................................................................................... 34

       Disturbance and Wallow Mapping ............................................................................................... 36

       Bison Trail Mapping..................................................................................................................... 36

       Seasonal Distribution and Habitat Selection ................................................................................ 37

Human/ Bison Conflict ........................................................................................................................ 38

Genetic Glossary .................................................................................................................................. 40

Literature Cited .................................................................................................................................... 41

                                                                          iv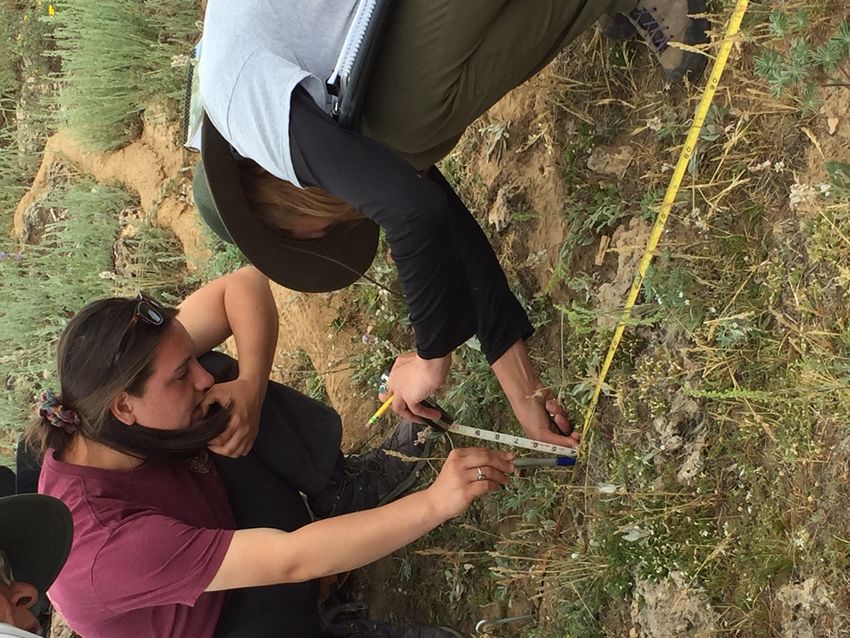
Figures
Page
Figure 1. Map of areas of significance to the history and management of the Kaibab
Plateau bison herd. ..............................................................................................................................xiii
Figure 2. Bison in House Rock Valley around 1930. ........................................................................... 1
Figure 3. Number of Bison harvested by hunters from the House Rock/ Kaibab Plateau
Herd over time (AZGFD 2002, 2015, and 2019b). ................................................................................ 3
Figure 4. Bison in pens at House Rock Wildlife Area after the 2014 relocation attempt. .................... 4
Figure 5. The newly completed corral and capture facilities in the fall of 2018. ................................. 5
Figure 6. Bison on their wintering grounds at Powell Plateau at the edge of the canyon. .................... 6
Figure 7. Dana Musto throws out “cake” while baiting bison into the capture pen.............................. 7
Figure 8. Bison in the capture pen (trap)............................................................................................... 8
Figure 9. An InterTribal Buffalo Council (ITBC) truck backs up to the chute to load
bison. ...................................................................................................................................................... 9
Figure 10. NPS Veterinarian Dr. ......................................................................................................... 11
Figure 11. Biologists remove tail hair from a bison for genetic analysis............................................ 14
Figure 12. a) The genetic structure of 17 DOI and 2 Parks Canada herds that have been
sampled using a standardized genetic panel (cluster #1 represents the Kaibab Plateau
Herd/ GRCA samples). ........................................................................................................................ 19
Figure 13. NPS and USGS biologists put a tracking collar on a captured bison. ............................... 26
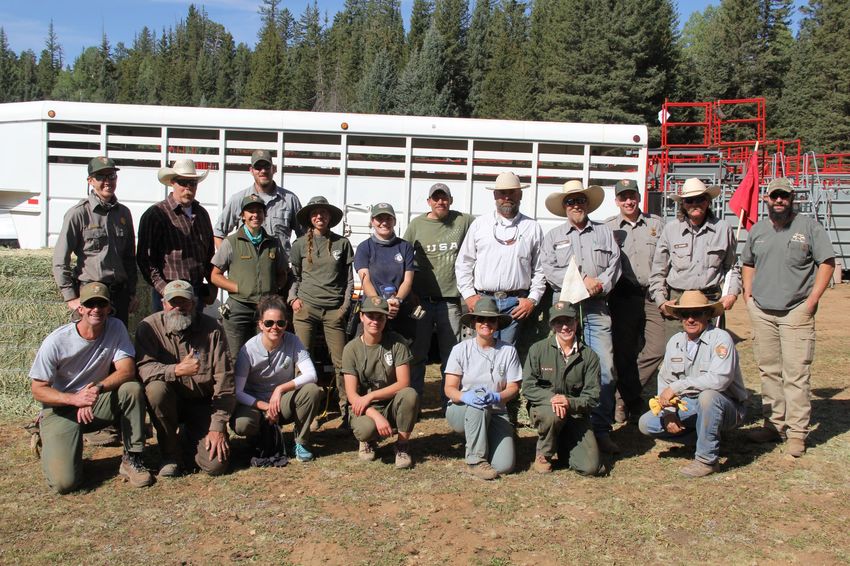
Figure 14. A group of bison viewed from above during an aerial survey........................................... 27
Figure 15. Skye Salganek conducts a classification survey in Little Park in 2019. ............................ 28
Figure 16. Bison in Little Park meadow, North Rim, Grand Canyon. ................................................ 29
Figure 17. Randomly placed meadow monitoring sites on the Kaibab Plateau on National
Park (GRCA, with bison) and National Forest (KNF, no bison) lands. .............................................. 31
Figure 18. Staff performing vegetation monitoring. ........................................................................... 32
Figure 19. Vegetation Cover by Functional Group. ............................................................................ 34
Figure 20. Crystal pond in 2010 on the left (no bison use) and in 2014 on the right (high
bison use). ............................................................................................................................................ 35
v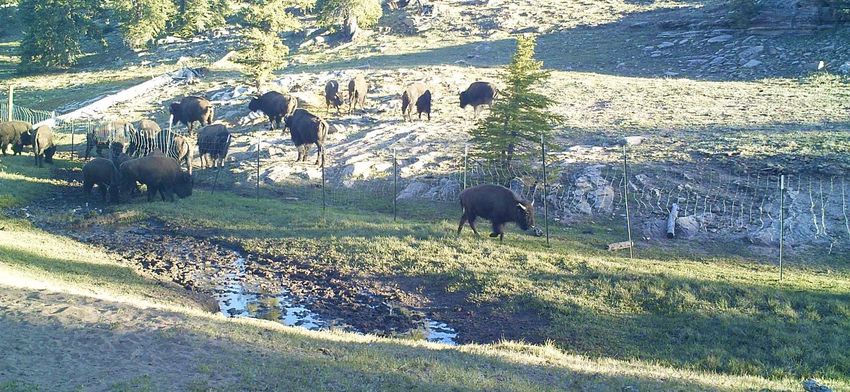
Figures (continued)
                                                                                                                                           Page

Figure 21. Image from a motion detecting camera deployed at a spring shows the
ineffectiveness of fencing—there are as many bison inside the fence as outside. ............................... 36

Figure 22. Distinctive bison-created trail. ........................................................................................... 37

Figure 23. National Park Service messaging for wildlife safe distances. ........................................... 38

Figure 24. A National Park Service social media post to help the public learn to keep
their distance from wildlife. ................................................................................................................. 39

                                                                       vi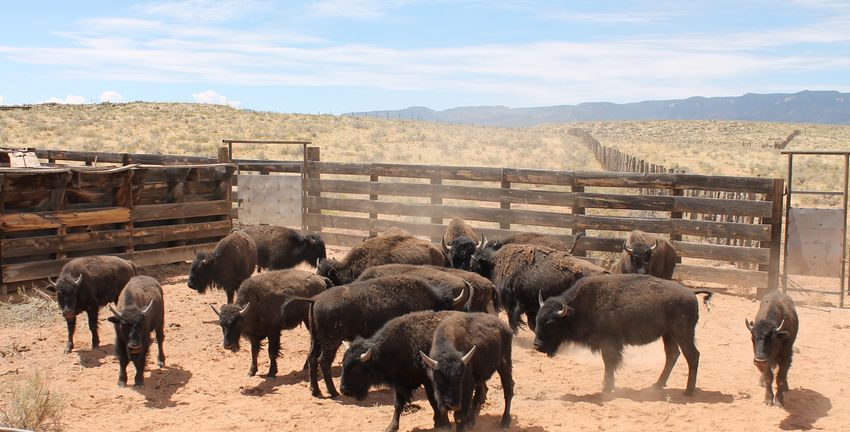
Tables
                                                                                                                                                Page

Table 1. Population estimates for the House Rock bison herd along with where they were
primarily located. ................................................................................................................................... 2

Table 2. Age classifications of Grand Canyon National Park 2019 captured bison. ............................ 9

Table 3. A summary of genetic diversity measures for the Kaibab Plateau herd /GRCA,
along with 16 other DOI and 2 Parks Canada bison herds. ................................................................. 16

Table 4. The number of private alleles found within 17 DOI and 2 Parks Canada bison
herds, and the identity of each private allele (listed as “locus.allele”). ............................................... 20

Table 5. A comparison of cattle introgression data for the Kaibab Plateau herd to
published and unpublished data for 19 other federal, state and private bison herds. ........................... 21

Table 6. Allele frequencies for 15 nuclear DNA microsatellite markers diagnostic for
cattle introgression in bison for 8 NPS, 2 BLM and 2 Parks Canada herds. ....................................... 22

Table 7. Origin (in 1905) and augmentation history of the Kaibab Plateau herd (formerly
the House Rock herd) that now occupies the northern rim of Grand Canyon (Trudeau
2006, Sisk et al. 2009, AZGFD 2017). ................................................................................................ 24

Table 8. Dominant plant species by site. ............................................................................................. 33

Table 9. Indices of Plant Community Similarity................................................................................. 33

                                                                          vii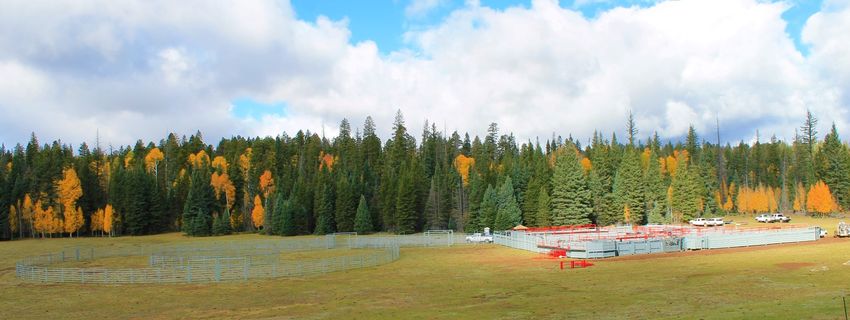
Executive Summary
The House Rock bison herd on the Kaibab Plateau, hereafter the “Kaibab Plateau bison herd”, is
descended from a private bison herd which was introduced into Arizona in 1905. It is spatially
distinct from the small, present-day herd at House Rock Wildlife Area (HRWA). The State of
Arizona recognizes and designates bison within Arizona as wildlife under state law. The herd was
managed in the HRWA of the Kaibab National Forest (KNF) by the Arizona Game and Fish
Department (AZGFD) from 1926–2009 at a population target of approximately 100 individuals.
Since 2010, the herd has primarily resided on the North Rim of Grand Canyon National Park
(GRCA).

By 2014 the Kaibab Plateau population was estimated at 400–600 bison and projected to grow as
large as 1,500 animals in the next ten years if management actions were not taken. On September 1,
2017, the National Park Service (NPS) Intermountain Regional Director signed a Finding of No
Significant Impact (FONSI) for the Initial Bison Herd Reduction Environmental Assessment (EA) at
GRCA. AZGFD, US Forest Service (FS), Bureau of Land Management (BLM), and the InterTribal
Buffalo Council (ITBC) were Cooperators in the preparation of the EA.

The EA authorized the NPS plan to reduce the bison herd to fewer than 200 animals within five
years. Allowable methods of herd reduction include lethal removal with skilled volunteers and non-
lethal capture with live transport of bison to willing recipients, including tribes and
governmental/non-governmental organizations. AZGFD-managed harvests outside of park
boundaries will also contribute to the reduction.

In summer-fall 2018, NPS contractors designed and constructed a corral for capturing live bison in
the Little Park Meadow just south of the park’s North Rim entrance. NPS Roads crew also
constructed a gravel-covered access road to the new corral. Due to impending winter weather and
initiation of bison migration to lower pastures, NPS was not able to perform a pilot bison corralling
event in 2018.

At a September 2019 pilot bison capture event, the NPS captured 51 live bison, 31 of which were
transferred to the Inter-Tribal Buffalo Council (ITBC) under a signed agreement. The ITBC
transported and transferred the bison to the Quapaw Tribe in Oklahoma. NPS implemented a
pathogen sampling protocol developed by a wildlife veterinarian with the NPS Biological Resources
Division and oversaw testing and documentation necessary to move live bison across state lines.

GRCA initiated research with USGS partners to GPS/VHF collar and release bison during corral
trapping. The team collared 14 bison and plans to collar another 11 in 2020. Objectives of the
research are to evaluate seasonal herd movements, develop a robust and repeatable bison population
estimation method, determine potential effects of bison on vegetation, and develop a resource
selection model.

Genetic analyses of samples from animals captured in 2019 indicate that the current Kaibab Plateau
herd is significantly differentiated from all other Department of Interior (DOI) bison herds tested but

                                                  viii
is most genetically similar to the herds at Wind Cave National Park and Wichita Mountain National
Wildlife Refuge. The Kaibab Plateau herd also has more unique nuclear DNA alleles than any other
sampled DOI bison herd. The level of cattle introgression in nuclear DNA is ~1.6%, on the high end
for DOI herds, but roughly equivalent to what has been detected in the herd at Badlands NP (1.3%)
and the North Unit herd at Theodore Roosevelt NP (1.4%). However, the level of cattle
mitochondrial DNA (inherited through the mother only) for the Kaibab Plateau herd is ~98%, far
higher than any of the other DOI herds tested (typically 0–1%).
Some individuals, both within and outside the NPS, have referred to the Kaibab Plateau herd as
bison-cattle hybrids, “beefalo,” or “cattalo.” The new and unprecedented genetic data presented here
indicate that such labels are not supported. The evidence now indicates that this herd is more
appropriately considered as having value, albeit with challenges, for coordinated conservation of
plains bison. This newly informed perspective on this herd does not negate the need to address issues
of ecological, natural, and cultural resource damage from a burgeoning bison herd, nor change the
need for reduction of the current population.
The NPS is committed to continuing to work with partners, including AZGFD, ITBC, and adjacent
land management agencies to achieve bison reduction targets on the North Rim as called for in the
2017 Initial Bison Herd Reduction Plan.
ixAcknowledgements
Thank you to the Bison Technical Workgroup (alphabetical by first name, NPS employees unless
otherwise specified): Blake McCann, Brendan Moynahan, Carl Lutch (AZGFD), Dan Niosi, Dustin
Sene, Eddie Childers, Elaine Leslie, Gregory Holm, Gregory Schroeder, Jenny Powers, John Heiser,
John Mack, Miranda Terwilliger, Natasha Kline (FS), Patrick Toomey (ITBC), Rob Nelson
(AZGFD), and Tom Olliff.
Thank you to the 2019 Bison Capture Team members (alphabetical by first name, NPS employees
unless otherwise specified): Allen Bruner, Austin Kelley, Bill Archard, Brandon Torres, Brian
Watson, Bryan Maul, Chris Clark, Chris Dodds, Christina Caparelli, Christina Ryan-Miller, Cindy
Donaldson, Cody Lane, Dana Musto, Danielle Buttke, Daniel Willner, Drew McGahan, Dustin Sene,
Ed Forbis, Elyssa Shalla, Eric Selchert (ITBC), Gregory Holm, James Ward, Jamie Westenfelder,
Joelle Baird, John Root, John Saul (Aspen Veterinary), Kate Hensel, Kate Schoenecker (USGS),
Kensie Stallings, Kevin Chandler, Kevin Kennedy, Kimberly Furgerson, Kirsten Fuller, Kristen
Luetkemeier, Lily Daniels, Logan Stevenson, Matt Krupp, Matt Nirenberg, Mark Rose, Miranda
Terwilliger, Murray Shoemaker, Paul Roghair, Rebecca Potter, Rick Wallen, Ryan Dastrup (FS),
Sammy Roberts, Santiago Garcia, Sarah Ciarrachi, Sarah Schoenfelder, Shea (Charles) Edmondson,
Sherwin Macarthur, Skye Salganek, Stephanie Cruz, Todd Russell (FS), Tony Miller, and Zoey
(Mitch) Sawicki.
The following individuals also assisted in planning or monitoring in 2018–2019 (alphabetical by first
name, NPS employees unless otherwise specified): Becky Latanich, Craig Chenevert, Dana Sullivan,
Debbie Brenchley, Desiree Espericueta, Janet Cohen, John Quinn, Kirby Lynn Shedlowski, Michael
Quinn, Phillip Andrews, Rosa Palarino, and the 2019 Grand Canyon Field Institute students and
staff.
A sincere thank you to park leadership who supported our endeavors (alphabetical by first name):
Chris Lehnertz, Donna Richardson, Doug Lentz, Elston Stephenson, Janet Balsom, Jason Watkins,
Jeanne Calhoun, Katie Morris, Lisa Carrico, Mary Risser, Matt Vandzura, Rachel Bennet, Robin
Martin, Sarah Creachbaum, Sharon Ringsven, Todd Stoeberl, Tom Shehan, and Woody Smeck.
And thank you to many others un-named who helped us with the myriad of bison related projects at
Grand Canyon National Park.
xList of Acronyms
AZGFD Arizona Game and Fish Department
BADL Badlands National Park (South Dakota), US NPS
BLM U.S. Bureau of Land Management
BOOK Book Cliffs (Utah), US BLM
CHIC Chickasaw National Recreation Area (Oklahoma), US NPS
CSU Colorado State University
DOI U.S. Department of the Interior
DNA Deoxyribonucleic Acid
EA Environmental Assessment
ELK Elk Island National Park (Alberta), Canada
FONSI Finding of No Significant Impact
FTN Fort Niobrara National Wildlife Refuge (Nebraska), US FWS
FWS U.S. Fish and Wildlife Service
FS U.S. Forest Service
GPS/VHF GPS = Global Positioning System; VHF = Very High Frequency (radio)
GRASS Grasslands National Park (Saskatchewan), Canada
GRCA or park Grand Canyon National Park (Arizona), US NPS
GRTS Generalized Random Tessellation Stratified
HEMO Henry Mountains (Utah), US BLM
HRWA House Rock Wildlife Area (Arizona), US FS
ITBC Inter Tribal Buffalo Council
IMT Incident Management Team
KNF Kaibab National Forest (Arizona), US FS
KPH Kaibab Plateau Herd (formerly the House Rock herd)/ Grand Canyon
National Park, US NPS/ Arizona Game and Fish Department (Arizona)
mtDNA mitochondrial DNA
NBR National Bison Range (Montana), US FWS
NER National Elk Refuge, US FWS / Grand Teton National Park, US (Wyoming)
NP National Park (U.S. or Canadian)
NPP National Park and Preserve
NPS U.S. National Park Service
NRA National Recreation Area
NSM Neal Smith National Wildlife Refuge (Iowa), US FWS
NWR National Wildlife Refuge, US FWS
RMA Rocky Mountain Arsenal National Wildlife Refuge (Colorado), US FWS
SH Sully’s Hill National Wildlife Refuge (North Dakota), US FWS
TAPR Tallgrass Prairie National Preserve (Kansas), US NPS
THROn Theodore Roosevelt National Park North Unit (North Dakota), US NPS
xiTHROs Theodore Roosevelt National Park South Unit (North Dakota), US NPS
UCD-VGL University of California Veterinary Genetics Laboratory at Davis
USGS U.S. Geological Survey
WICA Wind Cave National Park (South Dakota), US NPS
WM Wichita Mountains Wildlife Refuge (Oklahoma), US FWS
WRST Wrangell-St. Elias National Park and Preserve (Alaska), US NPS
YELL Yellowstone National Park (Wyoming/ Montana/ Idaho), US NPS
xiiFigure 1. Map of areas of significance to the history and management of the Kaibab Plateau bison herd.
xiiiHerd History
Miranda Terwilliger and Gregory Holm, Science & Resource Management, Grand Canyon National
Park, AZ
Figure 2. Bison in House Rock Valley around 1930. Photo Art Metzger Collection, Northern Arizona
University, NAU.PH.90.9.57
The Kaibab Plateau bison herd descended from animals brought to northern Arizona in 1905 to the
Grand Canyon Game Preserve, much of which is now Grand Canyon National Park (GRCA or
“park” hereafter) by Charles Jesse “Buffalo” Jones, a person now revered for helping save bison
from extinction (Easton & Brown 1961, Onstott 1970, Trudeau 2006). Jones attempted to crossbreed
the bison with Galloway heifers but this venture was not particularly successful and by 1907 or 1908
the ranching operation went bankrupt (Trudeau 2006). Jones drove off any cattle and successful
appearing cross-breeds out of the region in 1909 and sold the remaining 15–20 bison and bison-cattle
hybrids to “Uncle Jimmy” James T. Owens (Trudeau 2006, Table 1). Owens, who also served as the
Game Warden of the Grand Canyon Game Preserve, managed the that herd until 1926. Owens
mostly kept the bison at House Rock Valley (Figure 2) but had permits to graze them on the Walhalla
Plateau in the park (Anderson 1998). The Grand Canyon Game Preserve was later superseded by the
Kaibab National Forest (KNF, created in 1908) and Grand Canyon National Park (created in 1919) as
they are known today. Elements of the Game Preserve were folded into the Kaibab National Forest’s
enabling legislation although not into the park’s enabling legislation.
1Table 1. Population estimates for the House Rock bison herd along with where they were primarily
located.
YEAR Estimated Bison Primary Range Owner Source
1909 15–20 Grand Canyon Game Preserve Trudeau 2006
1921 64 GRCA Permit issued to Jimmy Owens
1926 98 KNF/ AZGFD Trudeau 2006
1950–1960s 330 KNF/ AZGFD AZGFD 2002, FS 1984
1970 100 KNF/ AZGFD AZGFD 2002, Adams & Dood 2011
1998 100 KNF/ AZGFD AZGFD 2002
2002 130–160 KNF/ GRCA AZGFD 2002
2010 >300 GRCA/ KNF Interagency Bison Group 2011
2012 400 GRCA Interagency Bison Group 2013
2014 400–600 GRCA Plumb et. al 2016
Bison are recognized as wildlife in the state of Arizona (ARS 17,1). In 1926, the Arizona Game and
Fish Department (AZGFD) purchased and began managing the population of 98 bison as a free-
ranging wild herd (Table 1). Public culls in a corral began in 1927. Between 1928–1950, the state
held a grazing permit for House Rock Valley to pasture up to 250 head of bison (Interagency Bison
Group 2013). House Rock Valley consists of 30 acres owned by AZGFD (Adams and Dood 2011)
and 53,878 acres managed by the U.S. Forest Service (FS). In 1950, the state entered a formal
agreement to manage the bison population on an allotment in what is now known as the House Rock
Wildlife Area (HRWA) in the Kaibab National Forest (Figure 1) with the FS, the U.S. Bureau of
Land Management (BLM), and affected cattle ranchers (FS 1950). During the 1970s the state
managed the population for 100 bison post-cull (AZGFD 2002), in 1982 they introduced free chase
hunting (AZGFD 2002), and in 1984 agreed to manage the herd at 75–90 bison post-hunt (FS 1984,
Table 1). AZGFD bison count numbers show that from 1990 to 1997, the state-maintained bison herd
numbered from between 69 and 96 head, post-hunt (Interagency Bison Group 2013).
By the late 1990s or early 2000s, the bison began dispersing up to the top of the Kaibab Plateau and
into GRCA (Weber 2011, Interagency Bison Group 2013). It is thought that several drought seasons,
poor range conditions in House Rock Valley, and multiple fires in the Saddle Mountain Wilderness
contributed to the bison migration into higher elevation grazing areas on the Kaibab Plateau.
As of 2010, bison ceased returning to the HRWA at all with most bison never leaving the park or
venturing farther than 5 miles from the park boundary onto adjacent FS lands (bison satellite collar
data and aerial survey data). As of 2012, the herd numbers were estimated at 400 (Interagency Bison
Group 2013). The herd now winters primarily on the North Rim’s Powell Plateau and other rim
edges and uses the North Rim meadows and inter-connected springs during the remainder of the year
(pre-2019 collar data).
2Outside of park lands, the AZGFD manages an active bison hunt on the Kaibab National Forest
(AZGFD 2017, Figure 3). Current hunting regulations allow for harvest almost all year with both bull
and cow harvests scheduled (as the House Rock Herd, AZGFD 2019a). Most bison are harvested
within 5 miles of the park boundary and animals can be baited in with salt and harvested at watering
sites. The bison hunts alone have ceased to be effective as the sole means of managing the population
at the target of 100 post-hunt adults.
Bison Harvested
80
70
60
50
40
30
20
10
0
1982
1983
1984
1985
1986
1987
1988
1989
1990
1991
1992
1993
1994
1995
1996
1997
1998
1999
2000
2001
2002
2003
2004
2005
2006
2007
2008
2009
2010
2011
2012
2013
2014
2015
2016
2017
2018
Figure 3. Number of Bison harvested by hunters from the House Rock/ Kaibab Plateau Herd over time
(AZGFD 2002, 2015, and 2019b). Blanks represent gaps in the data. The blue line marks where bison
stopped returning to the House Rock Wildlife Area completely.
In 2014, managing partners captured and relocated 19 bison back to House Rock Valley where the
bison were held in an AZGFD holding pasture for 4 months (Figure 4). The pasture gates were then
opened, and all bison independently returned to the North Rim of the park within 24 hours (Holm
2015). By 2014, the herd had grown to an estimated 400–600 animals (Plumb et al. 2016, NPS
2017). Sturm and Holm (2015) suggested that, without additional management, the population could
grow as large as 1,200 to 1,500 bison within 10 years. Managing partners (AZGFD, FS, and GRCA)
agreed on a target population of 80–200 bison ranging across the 215,000-acre Kaibab Plateau
landscape (Plumb et al. 2016, NPS 2017).
3Figure 4. Bison in pens at House Rock Wildlife Area after the 2014 relocation attempt. NPS Photo/ Greg
Holm
In September 2017, the National Park Service (NPS) Intermountain Regional Director signed a
Finding of No Significant Impact (FONSI) for the Initial Bison Herd Reduction Environmental
Assessment (EA) at GRCA with the goal of reducing the bison population to fewer than 200 animals
over a 5-year period (NPS 2017). The EA, written in cooperation with AZGFD, the FS, the BLM,
and the InterTribal Buffalo Council (ITBC), and in consultation with the park’s traditionally
associated tribes, approved the use of live capture and removal as well as lethal removal using skilled
volunteers. The EA also recognized the contribution to herd reduction by state permitted hunting on
adjoining KNF lands.
In late 2017, AZGFD introduced 17 yearling pregnant bison cows from the American Prairie Reserve
in Montana (Wind Cave National Park lineage) to the HRWA where they have remained fenced for
the time being. Therefore, the herd currently on the Kaibab Plateau is referred to as the Kaibab
Plateau bison herd (KPH), and the herd currently within House Rock Valley is referred to as the
House Rock herd. However, the cooperative goal stated in the EA refers to all bison on the Kaibab
Plateau.
4Live Capture Operations
Miranda Terwilliger, Gregory Holm, D. Skye Salganek, and D. Musto, Science & Resource
Management, Grand Canyon National Park, AZ
In September of 2019, the park implemented a pilot (test) live capture and removal of bison. GRCA
partnered with the ITBC (GRCA 2018) to identify and ship selected bison captured on the park to
recipient tribes.
Planning
The park engaged various other bison experts in a Technical Workgroup to help inform the capture
operations shortly after the FONSI was signed. The workgroup assisted park staff in designing a
capture facility. Important features of the design include a capture pen or trap, capture alley, working
alleys, squeeze chute with a scale, holding pens, a series of solid panels around the entire structure to
limit bison range of vision (to reduce bison stress levels), and catwalks over key alleys to improve
employee safety. The capture facility was then built on-site by contractors and completed by mid-
October 2018 (Figure 5). Together, the park and ITBC formalized an agreement to assist with the
transfer of bison (GRCA 2018).
Figure 5. The newly completed corral and capture facilities in the fall of 2018. NPS Photo/ Greg Holm
The park planned to implement a pilot live capture in 2018 and had created an Incident Management
Team (IMT) to manage and plan the operation. Significant operations planning occurred. Due to the
timing of the capture infrastructure completion and an early wet, heavy snow, bison had moved on to
their winter grounds on the Powell Plateau some 15 miles away (Figure 1, Figure 6). Once on their
wintering grounds, bison have not been known to return to the corral area until the spring. GRCA
thus postponed the pilot live capture event to fall 2019.
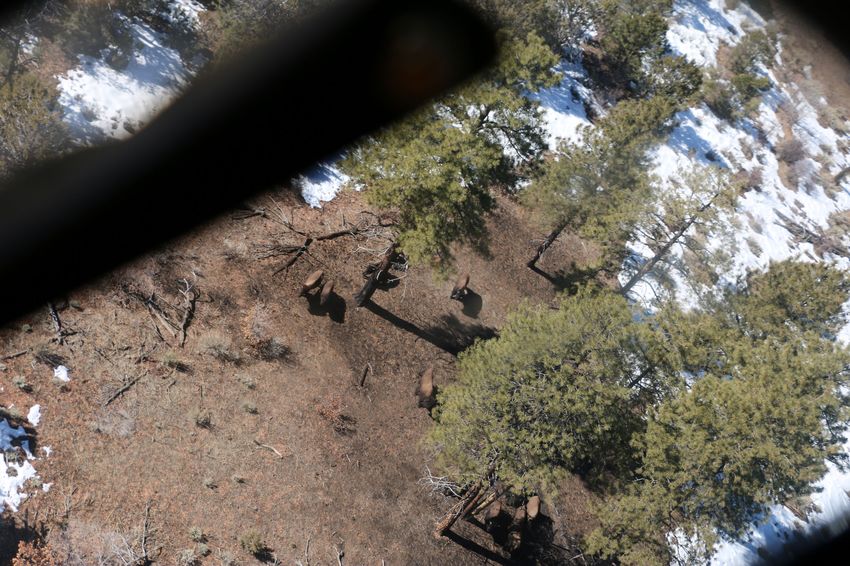
5Figure 6. Bison on their wintering grounds at Powell Plateau at the edge of the canyon. While this photo
is blurry, it shows how the bison use the extreme edge of the canyon. NPS Aerial Photo/ Brandon Holton
In July of 2019, the park finalized the “Grand Canyon Limited Pilot Bison Reduction Corralling
Operations Plan 2019” (Terwilliger and Holm 2019) and Acting Park Superintendent Woody Smeck
signed an Incident Management Team (IMT) Designation of Authority on Aug 1, 2019 (GRCA
2019a). Building off the planning from the previous year, the park moved forward toward live
capture and corralling in September 2019 and developed an Incident Management Plan (GRCA
2019b).
Baiting
A 2014 attempt at corralling and relocating bison back to House Rock Valley demonstrated that
baiting can be an effective way to get bison to a corral site in GRCA (Holm 2015). Bison in Grand
Canyon are generally skittish at the approach of humans, except for within the Little Park meadows
where the park entrance road passes through and bison are more habituated to human visitation. In
addition to bringing bison into the capture pasture, a key goal was to get the bison acclimated both to
the capture facilities and to people being around the capture facilities to reduce stress during the
actual operation. As the capture facilities were built along a bison trail between key water sources,
the bison quickly acclimated to the capture and corral structures in the meadow. The delay of capture
6for a year also gave the bison more time to get acclimated to the corral structure. In addition, staff
began to bait the capture pasture with fresh hay, water, contained salt blocks, and “cake”, a bait
mixture formulated specifically for bison (see Appendix A, Figure 7). Staff used the same truck at
the same two times a day to familiarize the bison with the feeding schedule and the approach vehicle.
Water seemed to be the biggest draw for bison particularly during dry spells when they drained the
water troughs nightly. Baiting efforts and bison presence were tracked through the operation. In
addition, a motion-activated camera was situated so that staff could determine bison presence
throughout the day and night.
Figure 7. Dana Musto throws out “cake” while baiting bison into the capture pen. NPS Photo/ Skye
Salganek
Capture Operations
Capture operations were planned for early September and were managed by an Incident Management
Team (IMT) and guided by an Incident Management Plan (GRCA 2019b). Grand Canyon staff were
joined by staff from the KNF, ITBC, and the US Geological Survey (USGS). Additionally, a few
invited experts from other bison parks (Yellowstone and Badlands National Parks) and an NPS
veterinarian joined to help train and advise the IMT.
Staff arrived on the North Rim, where they camped at the administrative area known as Lindberg
Hill. There, staff talked through the process of capture, ran through mock capture and processing
exercises, discussed safety, and had an opportunity to ask questions of experts at a bison round table.
Baiting continued until enough bison were in the trap to shut the gates. While staff waited for bison
7to be captured, they assisted in the removal of fencing around springs that had been ineffective at
excluding bison.
Bison were captured in the late afternoon of September 13th by the security team, which radioed the
news to the IMT. A crew then headed to the capture facility to make safety adjustments to the
facility, secure water and feed in the holding pens, to estimate number captured, and to monitor the
settling of the bison (Figure 8). The bison were left to acclimate overnight, and processing began the
next morning. Processing the captured bison took 1.5 days.
Figure 8. Bison in the capture pen (trap). NPS Photo/ Bryan Maul
Instinctive bison herding behavior and flagging encouraged bison through the working alleys and to a
squeeze chute for processing. Once an animal was safely secured in the squeeze chute, biologists
collected samples and measurements, marked bison for re-capture tracking, and animals were
identified either for removal (shipment) or identified for GPS/VHF collaring and release. Bison
identified for removal were prepared by administering vaccinations according to recipient tribal and
state requests and sorted into holding pens.
During this capture event 51 bison were handled (Table 2). All bison were classified to age by
observations of horns and body size (Table 2, Hornaday 1889, Garretson 1938, Seton 1929).
Fourteen animals were also aged by the more reliable method of tooth eruption (Table 2, Frison and
Reher 1970). Comparing the aging techniques for those 14 animals, it became clear that a lot of the
young animals were larger than expected, thus they may have been estimated to be older than they
actually were when using only the horn/ body size method. Based on these results, we recommend
using the tooth eruption method to age captured bison in the future. The average weight was 621
pounds with females averaging 663 pounds and males averaging 560 pounds. The largest animal
captured was a young adult male at 1,340 pounds followed by a 1,000-pound aged adult female. A
8total of 31 animals were shipped to the Quapaw Nation in Oklahoma, 2 died, 4 were released due to
transportation limitations, and 14 were collared with tracking devices and immediately released.
Table 2. Age classifications of Grand Canyon National Park 2019 captured bison. All bison were aged via
body/ horn classification while only a subset was aged using tooth eruption.
Aging via Body/ Horn
Classification Female Male Aging via Tooth Eruption Female Male
Calf (8yrs) 14 0 5–10 years 5 –
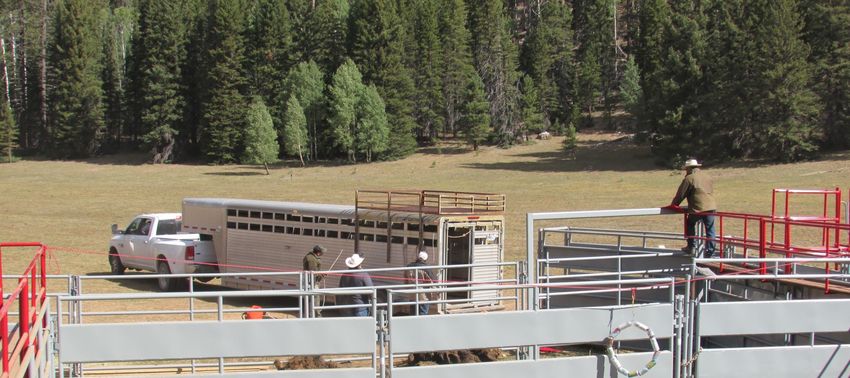
TOTAL 30 21 TOTAL 9 5
Bison that were to be shipped were held for 4 days waiting for ITBC contract truckers. Animals were
inspected and certified for transport by a locally contracted veterinarian. They were held sorted by
size and sex and according to shipment capacity to avoid them causing each other injury. Three small
livestock trailers with sliding doors picked the bison up at the capture facility (Figure 9) where they
were transported to a facility outside St. George, UT for loading onto a single larger semi-truck for
shipment to Oklahoma.
Figure 9. An InterTribal Buffalo Council (ITBC) truck backs up to the chute to load bison. NPS Photo/
Kristen Luetkemeier
9The IMT held an after-action review to learn from this initial pilot experience (GRCA 2019c); that
review is being incorporated into a future 4-year live capture and removal operating plan. The after-
action review covers the lessons learned from the pilot capture along with suggestions and
recommendations for future operations (GRCA 2019c). The park is committed to continuing to work
with partners, including AZGFD, ITBC, and adjacent land management agencies and tribes to
achieve bison reduction targets on the North Rim as called for in the 2017 Initial Bison Herd
Reduction Plan (NPS 2017).
10Disease Monitoring
Danielle Buttke, Biological Resources Division/ Wildlife Health Branch and Office of Public Health,
National Park Service, Fort Collins, CO
Miranda Terwilliger, Science & Resource Management, Grand Canyon National Park, AZ
Hunter harvested animals from the House Rock/ Kaibab Plateau herd have been consistently tested
for brucellosis by the state of Arizona since 2012 and none have tested positive (Anne Justice-Allen,
AZGFD DMV personal communication). As a closed herd with no new introductions since 2001, the
risk of brucellosis introduction is extremely low. All previous introductions have been made from
herds that were brucellosis free. Primary disease risks at this time would arise from trespass animals
in the park or other wildlife, including arthropod vectors and environmental diseases such as anthrax
or leptospirosis (Jones et. al 2020). Basic disease and parasite screening occurred for six animals in
2003 with negative results. Currently, the park collects biological samples for disease surveillance
during live capture events (Powers 2003; Figure 10). The park also conducts necropsies on freshly
dead carcasses when found. To date, there have been no diseases detected from the samples tested.
Figure 10. NPS Veterinarian Dr. Buttke with blood samples for disease surveillance. NPS Photo/ Bryan
Maul
While bison brucellosis has been visible and important in other areas of the United States (from an
animal health and regulatory perspective), other diseases could pose significant risks to bison
conservation. Endemic diseases such as anthrax, hemorrhagic disease, and disease associated with
Mycoplasma bovis, as well as foreign animal diseases such as foot-and-mouth disease (FMD),
heartwater, and Schmallenberg virus could all impact bison herds. Bison are also susceptible to other
11cattle diseases, such as bovine tuberculosis (TB), paratuberculosis (Johne’s disease) and bovine viral
diarrhea virus (BVDV), among others, and could serve as a source of disease if infected.
12Genetic Testing
Cynthia Hartway, Wildlife Conservation Society, Missoula, MT
Miranda Terwilliger, Science & Resource Management, Grand Canyon National Park, AZ
Introduction
The population size of bison within Grand Canyon National Park is quite large for its current range
and given that it occurs at the outermost extreme of the historic bison range (as it is currently
known—Plumb et.al 2016). The high abundance is having significant impacts on cultural and natural
resources that the Park Service is obligated to protect (NPS 2017). Genetics will not be used in
making decisions about immediate bison herd reduction as outlined in the EA (NPS 2017) but should
be considered during long-term management of a much smaller bison population.
The Department of the Interior (DOI) oversees the stewardship of approximately half of all the plains
bison managed for conservation in North America and has overarching conservation goals for the
species (DOI 2008, DOI 2014, Hartway et. 2020). In particular, concerns have been raised about how
to maintain or increase levels of genetic diversity within individual bison herds while also reducing
levels of cattle introgression (Hedrick 2010, Dratch and Gogan 2010). Whether the Kaibab Plateau
bison herd (KPH) is important to the genetic conservation of the other DOI herds, or how this herd
could contribute to the recovery of other wild conservation bison herds, will be based on current
genetic information. Information on the genetic composition of the Kaibab Plateau Herd is important
for partners when deciding whether to receive and integrate them into their own herds. Information
about genetics may also have implications for managing the genetic health of the remaining Kaibab
Plateau Herd once reduction goals have been met.
As bison numbers dwindled in the late 1800s, a handful of private citizens from Texas to Manitoba
captured small numbers of individuals from the wild, ultimately saving the species from extinction
(Freese et al. 2007; Dratch and Gogan 2010, Figure 2). While bison numbers have rebounded,
concerns remain about the long-term genetic health of conservation bison herds on Department of
Interior (DOI) lands, since most DOI herds were founded with small numbers of individuals and
some have had only limited genetic exchange since their founding (DOI 2008, Dratch and Gogan
2010). Additionally, attempts to crossbreed bison with domesticated cattle were carried out within
some foundational herds in the late 1800s and early 1900s. While these crossbreeding efforts were
largely unsuccessful (Halbert and Derr 2007; Hedrick 2010), subsequent mixing of bison from
foundational herds during the establishment of new conservation herds in the early 1900s has
resulted in residual cattle DNA within DOI herds. Consequently, concerns have been raised about
how to maintain or increase levels of genetic diversity within individual bison herds while also
reducing levels of cattle introgression (Hedrick 2010, Dratch and Gogan 2010).
The Kaibab Plateau Herd was minimally sampled in 2003 (16 samples from the then “House Rock
Bison herd”) and the biological samples analyzed by the DNA Technologies Core Lab, College of
Veterinary Medicine, Texas A&M University (Derr 2003). These samples confirmed historic records
(Mead 2002) about attempts between 1906–1909 to crossbreed the bison with cattle as most bison
13sampled possessed cattle mitochondrial DNA. They estimated cattle chromosomal nuclear DNA was
(“diversity panel”), and 15 nuclear microsatellites and one mitochondrial DNA marker to detect
cattle introgression (“introgression panel”). The diversity panel markers were based on microsatellite
panels developed at Texas A&M University (Halbert and Derr 2007, Halbert and Derr 2008); a
subset of these markers was adopted as a standard measure of bison genetic diversity and integrity by
DOI in 2010 (Dratch and Gogan 2010). The cattle introgression panel was developed from 5
common breeds of cattle (Halbert and Derr 2007) and was used to test for the presence of known
nuclear cattle alleles and for the presence of cattle mitochondrial DNA (mtDNA). The small number
of loci in the introgression panel makes it appropriate for testing for the presence of introgression at a
herd level, but poorly sensitive for detecting introgression in individual animals (Dratch and Gogan
2010).

Genetic Diversity Analysis
UCD-VGL provided estimates of observed heterozygosity (HO), expected heterozygosity (HE; Nei
1987), and the mean number of alleles per locus (MNA) for the Kaibab Plateau Herd (Penedo 2019).
Observed heterozygosity measures the level of genetic diversity in a population, with values near 1.0
indicating high levels of genetic diversity, and values near 0 indicating low levels of diversity.
Expected heterozygosity estimates the level of genetic diversity expected to occur in the
population in the absence of other evolutionary influences. Significant deviations between the
observed and expected heterozygosity of a population can indicate that evolutionary forces such as
inbreeding are affecting the population. To compare the allelic diversity of the Kaibab Plateau Herd
to other herds within DOI, allelic richness was calculated (Mousadik and Petit 1996) using the
computer software package “hierfstat” (Goudet and Jombart 2015) in R (R core, 2018). Allelic
richness is an unbiased estimator of the observed number of alleles per locus, allowing for
comparisons across populations.

Genetic Differentiation Analysis
To assess the genetic relatedness of the Kaibab Plateau Herd to the 16 DOI and 2 Parks Canada herds
previously genotyped in Hartway et al. (2020), genotype data from all 19 herds were pooled and
analyzed using Discriminant Analysis of Principal Components (DAPC; Jombart et al. 2010; Jombart
and Ahmed 2011). DAPC is a multivariate method using synthetic variables (discriminant functions)
to identify and maximize genetic variation within and between selected groups. The purpose is to
identify clusters of genetically related individuals (Jombart et al. 2010; Jombart and Ahmed 2011)
across the entire sampled bison population. DAPC analysis was carried out using the software
package R “adegent” (Jombart 2008) and was used to transform the data into synthetic variables that
best describe variation between clusters, while also minimizing within cluster variance, to assign
each individual genetic sample to a genetic cluster. Resultant clusters in a scatterplot of the first and
second linear discriminates of DAPC were plotted for a visual representation of the genetic structure
of the DOI bison meta-population.

All 19 bison herds were tested for the presence and richness of private alleles using the R software
package “poppr” (Kamvar et al. 2014, Kamvar et al. 2015). Private alleles are those found only
within a single population (Allendorf et al. 2013), and private allelic richness can provide a simple
measure of how distinct a population is from other populations (Kalinowski, 2004).

                                                   15
Cattle Introgression Analysis
Cattle introgression in the Kaibab Plateau Herd was assessed using two measures: the percentage of
nuclear alleles in the introgression panel that were of cattle origin; and the percentage of sampled
individuals that tested positive for cattle mitochondrial DNA (mtDNA).
Results
Genetic Diversity Analysis
High observed heterozygosity means significant genetic variability in a population, while low
observed heterozygosity means little genetic variability in a population. Geneticists compare the
observed level of heterozygosity to what is expected (expected heterozygosity) under the Hardy-
Weinberg equilibrium, a principle assuming that allele and genotype frequencies in a population will
remain constant from generation to generation in the absence of other evolutionary influences. If the
observed heterozygosity is significantly lower than the expected heterozygosity, this difference is
likely attributed to forces such as inbreeding of a small population, or a population bottleneck. If
observed heterozygosity is significantly higher than expected heterozygosity, this result is attributed
to the likely mixing of two previously isolated populations, or the intentional addition of individuals
with different genetics.
The genetic diversity of the Kaibab Plateau Herd was found to be relatively high. Observed
heterozygosity for the Kaibab Plateau Herd was 0.60 (sd=0.1) and expected heterozygosity was 0.60
(sd=0.2). The mean number of alleles per locus was found to be 4.62 (sd=1.4), and allelic richness
was 3.85 (sd = 1.0). The Kaibab Plateau Herd has had the intentional addition of individual bison
with different genetics (see Cattle Introgression Analysis section, Table 7), which has likely kept the
herd genetically healthy and within the range reported for other wild bison herds.
Table 3. A summary of genetic diversity measures for the Kaibab Plateau herd /GRCA, along with 16
other DOI and 2 Parks Canada bison herds. “Sample Size” is the number of genetic samples collected
from each herd, “He” is expected heterozygosity; “Ho” is observed heterozygosity; “Ar” is estimated allelic
richness, and “MNA” is the uncorrected mean number of alleles per locus.
Sample
Herd Size He (sd) Ho (sd) Ar (sd) MNA (sd)
Badlands NP – BADL 100 0.596 (0.02) 0.584 (0.01) 3.73 (1.1) 4.50 (1.4)
Book Cliffs – BOOK 38 0.657 (0.02) 0.630 (0.01) 4.14 (1.1) 4.83 (1.4)
Chickasaw NRA – CHIC 10 0.480 (0.03) 0.550 (0.02) 2.60 (0.8) 2.60 (0.8)
Elk Island NP – ELK 84 0.634 (0.02) 0.626 (0.01) 4.0 (0.9) 4.79 (1.4)
Ft. Niobrara NW – FTN 357 0.637 (0.02) 0.615 (0.01) 4.04 (1.0) 5.46 (1.7)
Grasslands NP – GRASS 125 0.621 (0.02) 0.609 (0.01) 3.87 (1.0) 4.77 (1.4)
16Table 3 (continued). A summary of genetic diversity measures for the Kaibab Plateau herd /GRCA,
along with 16 other DOI and 2 Parks Canada bison herds. “Sample Size” is the number of genetic
samples collected from each herd, “He” is expected heterozygosity; “Ho” is observed heterozygosity; “Ar”
is estimated allelic richness, and “MNA” is the uncorrected mean number of alleles per locus.
Sample
Herd Size He (sd) Ho (sd) Ar (sd) MNA (sd)
Kaibab Plateau / GRCA 51 0.60 (0.02) 0.60 (0.01) 3.85 (1.0) 4.62 (1.4)
Henry Mtns – HEMO 85 0.556 (0.02) 0.544 (0.01) 3.22 (0.8) 3.73 (1.1)
National Bison Range – NBR 302 0.647 (0.02) 0.642 (0.01) 4.08 (1.1) 5.04 (1.6)
National Elk Refuge/ Grand Teton 100 0.526 (0.02) 0.515 (0.01) 2.97 (0.8) 3.75 (1.2)
NP – NER
Neal Smith NWR – NSM 53 0.642 (0.02) 0.647 (0.01) 3.96 (1.0) 4.54 (1.5)
Rocky Mtn Arsenal NWR – RMA 71 0.650 (0.02) 0.643 (0.01) 4.12 (1.0) 5.04 (1.5)
Sully’s Hill NWR – SH 22 0.544 (0.02) 0.557 (0.02) 3.37 (1.0) 3.71 (1.3)
Tallgrass Prairie NP – TAPR 43 0.662 (0.01) 0.647 (0.01) 4.07 (0.9) 4.63 (1.2)
Theodore Roosevelt NP North Unit 100 0.531 (0.03) 0.529 (0.01) 3.09 (0.9) 3.48 (1.0)
– THROn
Theodore Roosevelt NP South Unit 87 0.585 (0.02) 0.569 (0.01) 3.64 (0.9) 4.19 (1.2)
– THROs
Wichita Mtns. NWR – WM 576 0.597 (0.02) 0.588 (0.01) 3.76 (1.0) 4.87 (1.3)
Wind Cave NP –WICA 100 0.660 (0.01) 0.650 (0.01) 4.04 (0.9) 4.69 (1.3)
Wrangell-St. Elias NPP –WRST 24 0.524 (0.02) 0.503 (0.01) 3.04 (0.8) 3.31 (1.0)
Yellowstone NP – YELL – 0.615 A 0.625 A 4.15 A 4.84 A
A From Halbert and Derr (2007)
Genetic Differentiation Analysis
Results from the K-means clustering analysis suggest 12 distinct genetic clusters within the 19
sampled bison populations. The scatter plot in Figure 12a shows the degree of similarity (or
differentiation) between the 12 identified genetic clusters, with the discriminant function axes
representing the largest between-group variance. Figure 12b shows the number of individuals from
each herd assigned to each genetic cluster. DAPC analysis suggests that the Kaibab Plateau Herd is
genetically unique from all other DOI and Parks Canada herds sampled, and that the the Kaibab
Plateau Herd (Figure 12, cluster 1, label GRCA) is genetically most similar to Wind Cave NP
(cluster 8, denoted as WICA) and Wichita Mountains NWR (Figure 12, cluster 3, denoted as WM).
Evaluation of private alleles in the nuclear DNA within each herd revealed eight alleles unique to the
Kaibab Plateau Herd Table 4), more than any other herds analyzed in this study.
17Cattle Introgression Analysis
Analysis of the cattle introgression panel indicated that 1.6% of the nuclear alleles in the
introgression panel for the Kaibab Plateau bison herd were of cattle ancestry (Table 5), which
indicates that very little cattle DNA remains in the genetic component (nucleus) that determines the
physical expression of traits. Ninety eight percent (50 of 51) of the sampled individuals had cattle
mitochondrial DNA, which indicates that since the crossbreeding of bison and cattle in 1905–1907,
very few female bison from other herds have been introduced to this Kaibab Plateau Herd population
(see Cattle Introgression Analysis section, Table 7).
18Figure 12. a) The genetic structure of 17 DOI and 2 Parks Canada herds that have been sampled using a standardized genetic panel (cluster #1
represents the Kaibab Plateau Herd/ GRCA samples). Points represent individual bison samples; numbered circles represent the 12 unique
genetically differentiated clusters in the bison data; and b) the relative number of individual samples (represented by black squares) from each
herd (right axis) assigned to each genetic cluster (top axis).
19Table 4. The number of private alleles found within 17 DOI and 2 Parks Canada bison herds, and the
identity of each private allele (listed as “locus.allele”).
Number of
Herd private alleles Private alleles (nuclear DNA alleles)
Kaibab Plateau/ 8 BL1036.187; BM1862.203; BM720.237; BMS1001.110;
GRCA BMS1001.108; BMS1747.87; BMS1862.146; HUJ246.252
Grasslands NP 4 BM6017.132; BM720.239; BMS941.79; RM372.144;
Wichita Mtns NWR 4 BM1706.240; BM47.106; BMS812.92; BMS941.77
Ft. Niobrara NWR 3 BM4107.167; BM4107.177; BMS1117.95
National Elk Refuge/ 3 BM1225.263; BM2830.140; TGLA44.149
Grand Teton NP
Badlands NPL 2 BM4028.122; BMS2258.136
Book Cliffs 1 BM6017.110
Elk Island NP 1 AGLA232.159
Henry Mtns. 1 RM372.140
National Bison 1 BMS510.95
Range
Neal Smith NWR 1 IL4.87
Rocky Mtn. Arsenal 1 BM1824b.202
NWR
Wind Cave NP 1 BMS1716.185
Wrangell-St. Elias 1 BM1225.275
NPP
Chickasaw NRA 0 –
Sully’s Hill 0 –
Tallgrass Prairie NP 0 –
Theodore Roosevelt 0 –
NP – North
Theodore Roosevelt 0 –
NP – South
20You can also read