The U.S. Railroads and COVID-19: Keeping Supply Chains Moving - Northwestern University Transportation Center - Northwestern University ...
←
→
Page content transcription
If your browser does not render page correctly, please read the page content below
The U.S. Railroads and COVID-19:
Keeping Supply Chains Moving

Northwestern University Transportation Center

Evanston, Illinois

May 2021
The U.S. Railroads and COVID-19:
 Keeping Supply Chains Moving

      Joseph L. Schofer, Hani S. Mahmassani,
       Max T.M. Ng, and Breton L. Johnson

   Northwestern University Transportation Center

                 Evanston, Illinois

                    May 2021

            © Northwestern University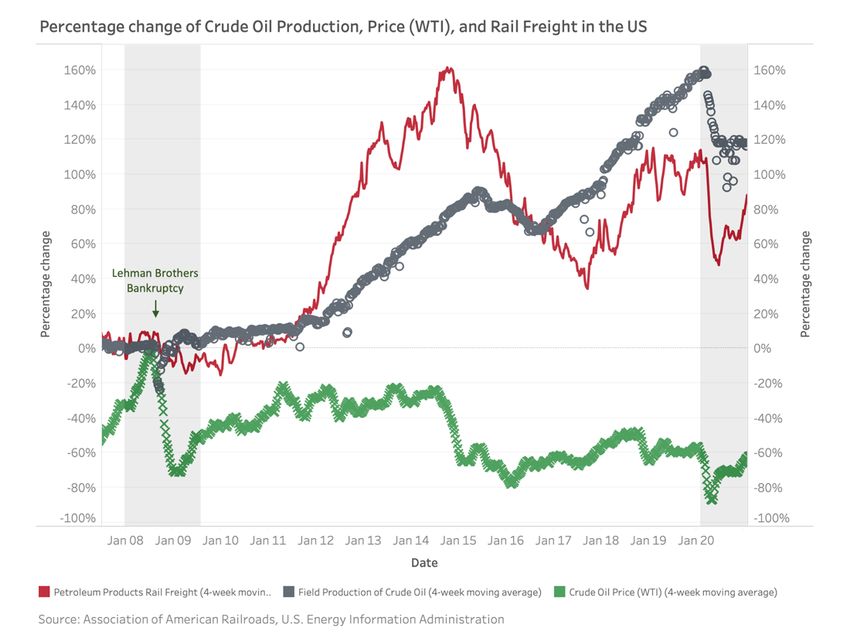
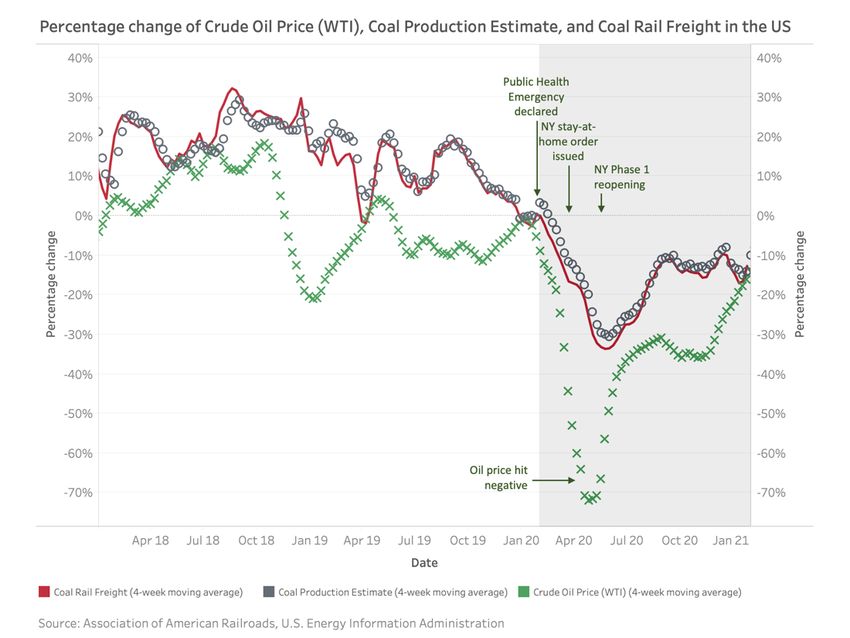
Table of Contents

Executive Summary................................................................................................ ii

Acknowledgements and Disclaimer ..................................................................... vi

1. Objective and Approach .....................................................................................1

2. Background and Context ....................................................................................2

3. Analyses of Rail Freight Impacts of Major Economic Disruptions ................4

4. Industry Perspectives on COVID-19 Impacts and the Future ......................18

5. e-Commerce and Omnichannel Retailing .......................................................31

6. The Future – Implications and Recommendations ........................................35

Appendix A.............................................................................................................39

Appendix B .............................................................................................................53

Appendix C.............................................................................................................57

                                                            i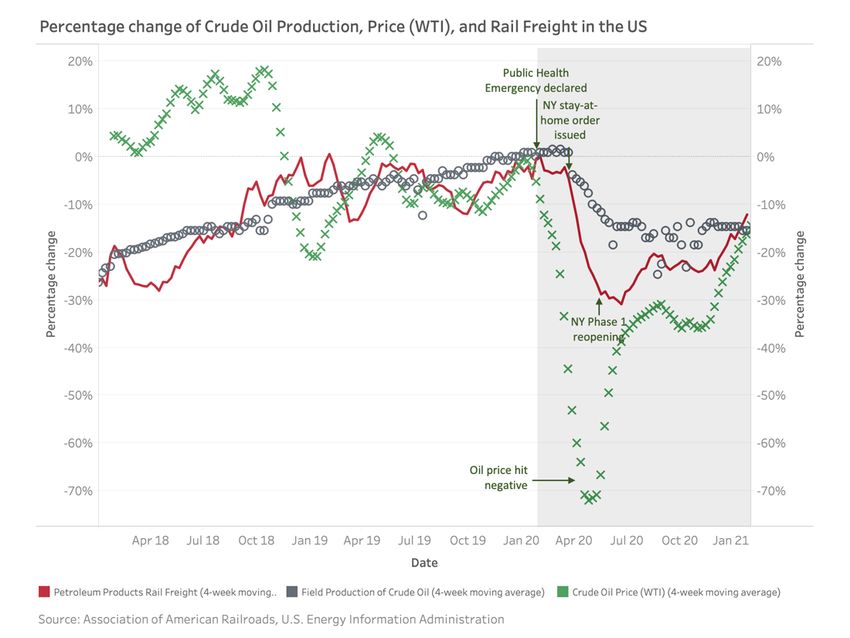
Executive Summary

                            Background and Initial COVID-19 Impacts
The rapid onset of the COVID-19 pandemic in March 2020 marked a challenging time for the
country and the U.S. freight industry. Manufacturing slowed, consumer purchasing patterns
changed, and for many, shopping moved online. The freight industry suffered a sharp decline in
shipments, followed by a surprisingly quick rise. The movement of goods by freight rail had to
quickly adapt to meet dynamically changing demand and volatile supply patterns. Despite this
disruption, freight rail showed a great deal of resilience and reliability. This report addresses how
the rail industry met the challenge of this whiplash in demand, explores impediments to
performance during this period and looks beyond the crisis towards the future for the rail sector.
The assessment outlined in this report was completed by researchers at Northwestern
University’s Transportation Center (NUTC). The results show how the U.S. freight rail
industry was an essential component of pandemic resilience, demonstrating a high level
of adaptability to meet consumer and business demands.
                                      NUTC Study Approach
NUTC researchers conducted an analysis of shipment data, supplemented with qualitative
insights from leading railroads, intermodal (IM) carriers, equipment manufacturers, car
leasing companies, shippers and e-commerce players to inform this report. What emerges
from this analysis is a rich picture of the impacts of COVID-19 on the freight industry, the
performance of the logistics system in general and railroads in particular, along with views of
causes, effects, and the future. The results illustrate the inherent value of the freight rail
industry to logistics and transportation in the U.S. In-depth interviews with industry leaders
and experts revealed that a handful of choke points, many of which did not belong to the freight
rail industry, complicated supply chain responses to COVID-19. These choke points included
congestion at West Coast ports and terminals nationwide, driven by both physical capacity and
labor shortages, alongside inefficiencies in the chassis market. While these contributed to an
already challenging logistical environment, ultimately, freight rail kept goods moving when other
methods of transport were constrained.
Overall, commodities traditionally carried by freight rail suffered varying fates in 2020. Some
products were negatively affected, including energy-related commodities (i.e., coal, petroleum
and petroleum products, frac sand), while demand for others grew or rebounded during the
pandemic, including grain products and intermodal, respectively.
                                     Freight Rail’s Response
Rail freight experienced a rapid rebound following the precipitous drop in traffic in March
and April 2020, achieving a near-full recovery in five months as the rail industry adapted
to keep goods moving despite the challenges created by logistical choke points. As the
recovery proceeded through the rest of 2020, the flow of intermodal (IM) traffic, containers moving
by rail for the longest legs of their overland trips, rebounded strongly, some exceeding volumes
in the same week of 2019 (and 2018 - a record year). This explosion in IM rail shipments was
driven by shifts in consumer spending from experiences (theaters, restaurants) to in-home

                                                 ii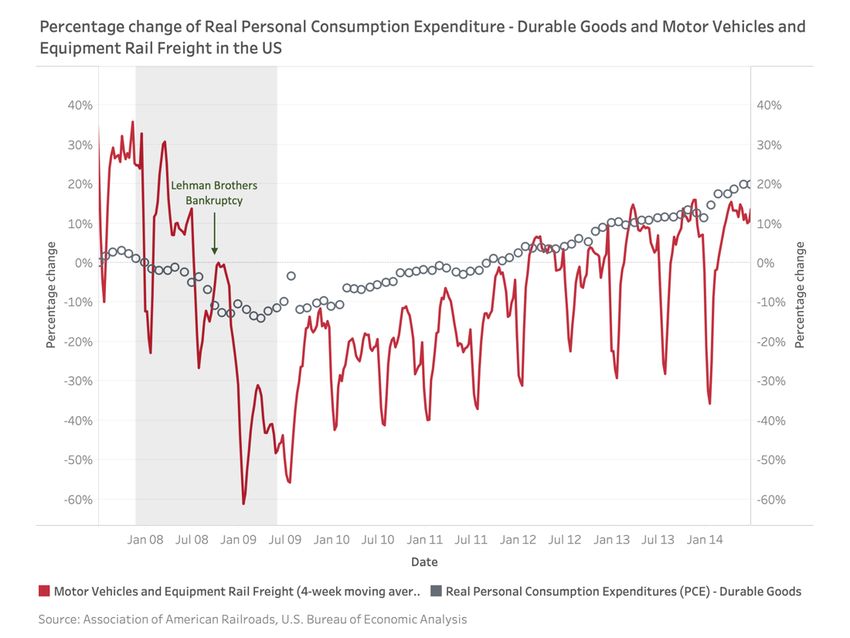
products, the accelerated growth in e-commerce through large retailers, and tightening capacity
in trucking, which is more dependent on labor availability than rail.
The principal IM flows are from ports and manufacturing centers to inland distribution centers
(DCs), but some moves go through intermediate and transload terminals, where goods are shifted
from marine to domestic containers. IM logistics are complicated because of the multiplicity of
entities that must collaborate to facilitate the flows: maritime carriers, ports and port operators,
suppliers of chassis (trailers that carry containers by truck), truckers, warehouse operators,
retailers, and the railroads. Bottlenecks anywhere in this complex system affect overall
performance.
Those interviewed for this study—including rail industry leaders, intermodal carriers, and major
shippers—expressed surprise at the rapidity of the rebound in demand, a marked difference from
the years-long recovery coming out of the Great Recession. Throughout 2020, rail's advantage
was rooted in the capacity and cost efficiency that it brings to e-commerce. Data shows that freight
railroads responded well to rapid demand shifts, particularly in intermodal traffic. The sharp
intermodal increase was driven in part by the rise of e-commerce, a tight trucking market, and
shifts in consumer spending.
                        The Rise of Intermodal Traffic and E-Commerce
Rail has become a core partner in intermodal traffic, broadly supporting purchasing
patterns as many shifted from consumption of experiences to consumption of goods
following the onset of the pandemic. Intermodal traffic emerged as a major growth driver during
the pandemic, exceeding 2019 and 2018 volume levels in Q3 and Q4 of 2020. The rapid rise has
been driven in large measure by growth in e-commerce—particularly from large retailers—as
consumers shop online.

                                                iii
Findings to date suggest that a majority of customers who pivoted to e-commerce in 2020
will likely continue using it in the years to come, driven both by convenience and price. The
rise of e-commerce will hold the freight rail industry’s performance to a high standard moving
forward. The market commands both high prices and high performance, and large retail
customers have the market power to obtain high service levels from the railroads. Some industry
players view rail performance – speed and reliability – as more important for attracting and
retaining customers than price competition. Moving forward, developments like shipment visibility,
now expected by increasingly demanding customers, can increase rail's competitiveness and
responsiveness to intermodal demands.
                          Implications for Post-Pandemic Development
The shock brought on by the pandemic showcased the need for the reliable movement of
freight, an undertaking handled well by the rail industry. As outlined in this report, the choke
points that stifled the supply chain industry in 2020—congestion at West Coast ports, chassis
shortages, and truck freight load rejection, among others—caused service disruptions that were
detrimental to consumers and could impede future demand growth. Nonetheless, the reliability of
the freight rail network played an essential role in ensuring critical needs for all sorts of goods
were met. In the years to come, additional operational changes and technology like Positive Train
Control (PTC) can further streamline the freight rail network and build transparency with
customers. Industry observers see opportunities for railroad performance improvements through
continued operational innovations, the realization of full benefits from Precision Scheduled
Railroading (PSR) and Positive Train Control (PTC), and the use of Internet of Things (IOT)
technologies to track shipments and support management.
With the growth of e-commerce, online retail, and rapid delivery models, a reliable freight
rail industry remains important for shippers. When the truck freight industry was unable to
meet heightened demand in 2020, the freight rail industry provided companies, including large
retailers, with the option and flexibility needed to continue moving their goods. When interviewed
for this report, industry experts reinforced that on-time delivery reliability and performance
ultimately dominate price when considering shipping options. Post-pandemic, freight rail can lead
the logistics industry and its customers forward in what is certain to be a volatile future. The bulk
markets are a secure core rail business, and the promise of continued growth in IM traffic seems
strong.
                                Public Policy and The Path Ahead
The results of this study point to a strong future for the U.S. rail industry, which responded
with resilience to the large disruptions and quick shifts in demand due to COVID-19,
showing a level of adaptability that will be important in what is likely to be an increasingly
volatile future. Ultimately, public policy will play a key role in the future of the logistics
industry and the ability of freight rail to continue its reliable performance that is at the core
of the nation’s supply chains. The public sector can facilitate the development of inland terminal
capacity to better support regional commerce and economic development. There are
opportunities for collaborations in port and terminal development to increase capacity – bringing
together railroads, developers, local, and state governments. Governments at all levels need to
understand the environmental, efficiency, and resilience advantages of rail freight and make
                                                 iv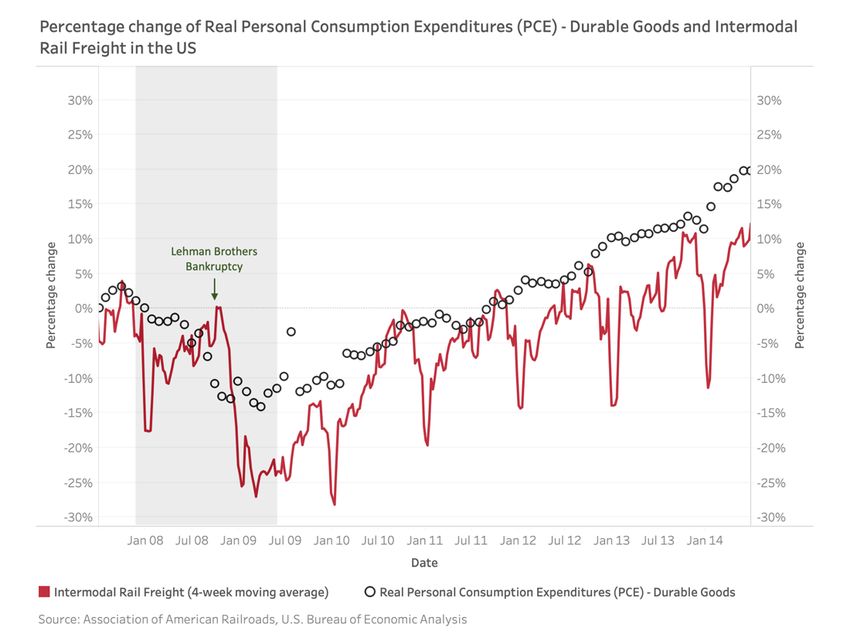
informed decisions about transportation investments and regulatory policies. New consumer
demands, including the rise of e-commerce, are likely to persist. Regulatory and investment
policies should keep these long-term shifts in mind and remain neutral in the competition among
freight modes, focusing on safety, performance, and fairness, rather than specifying how service
should be delivered.

                                               v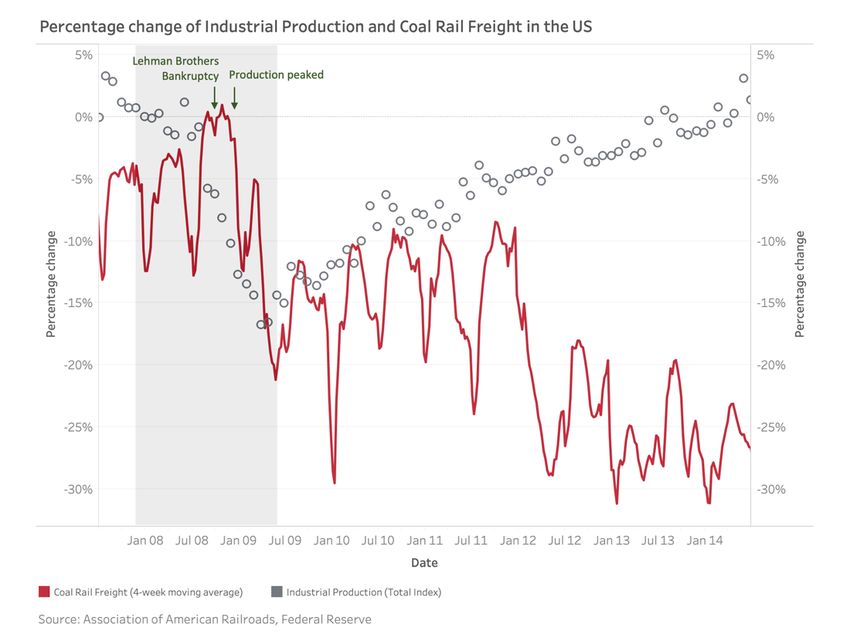
Acknowledgements and Disclaimer

The Transportation Center research team gratefully acknowledges the important contributions to
this effort through the provision of data and timely guidance from the Association of American
Railroads; from Rachel Cole, Librarian with the Transportation Collection of the Northwestern
University Library; from the twenty industry leaders who gave their time to be interviewed for this
project, listed in Appendix C; and from the staff of Northwestern’s Transportation Center.
The content of this report is the sole responsibility of the authors and does not necessarily reflect
the positions or policies of the Association of American Railroads or any of the organizations
represented by those interviewed for this work.

                                                 vi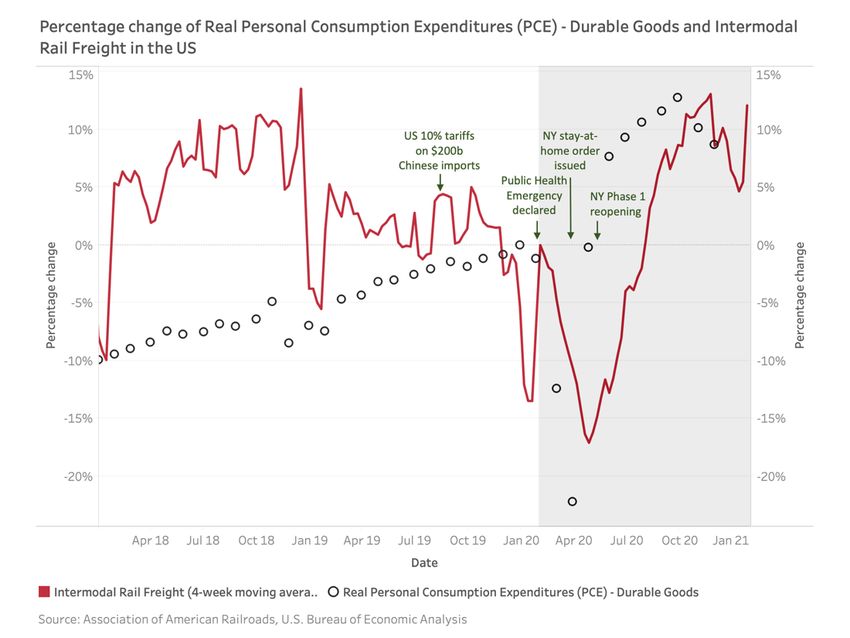
1. Objective and Approach

This report addresses the impacts of the COVID-19 pandemic on U.S. rail freight service and the
prospects for rail as the pandemic recedes, considering likely changes in domestic and global
supply chain patterns and emerging developments in e-commerce and the supply chains that
support it.
It provides data-supported insights into the critical role rail freight plays in the nation’s essential
supply chains in the face of the pandemic-induced disruption and post-pandemic economic
rebound, looking ahead to the next 2 to 5 years. A key aspect of this role is the contribution of rail
to the success of e-commerce, supporting on-demand delivery in the context of competition from
other modes, especially trucking and air freight. The findings of this study can help position the
rail industry to support emerging trends in sourcing, manufacturing, and consumer purchasing.
The main questions addressed in this report are these:
• How did the rail industry fare during previous economic downturns and corresponding
   recoveries?
• How did the COVID-19 pandemic impact the rail industry, particularly in terms of trade and
   shipping patterns, as well as changing markets for energy commodities?
• How have key industry leaders viewed the impacts of COVID-19, the rebound, the functioning
   of the logistics system, and particularly the role and performance of rail freight?
• What are the main opportunities that appeal to the unique strengths of rail service in the
   post-pandemic period?
• How can public policy impact the rail freight sector and its competitive position, both
   positively and negatively, in the post-pandemic period?
Our approach to this effort comprised four components: (1) monitoring contemporary trade and
academic literature on the pandemic, freight and logistics, international trade, and consumptions
patterns; (2) graphical and statistical analysis of flows, performance, and pricing of rail and truck
shipments for both the 2008 Great Recession and COVID-19; (3) short-term time series forecasting
of rail shipments and economic parameters; and (4) in-depth interviews with leaders in the railroad,
trucking, and consumer sales sectors.
All of these information sources were brought together to prepare this report, which is organized
as follows: Section 2 presents the background and context in commerce and freight transportation
as the COVID-19 pandemic began to take effect. Section 3 presents and compares rail, truck, and
trade data for both the 2008 recession and COVID-19, considering differences in the patterns of
post-event recovery. It further extends the data analysis using time series models to explore near-
term scenarios for rail freight and the U.S. economy. Section 4 summarizes the perspectives of key
industry leaders on the pandemic experience, the rebound, and the future, with emphasis on the
performance of and opportunities for the rail industry. Section 5 briefly reviews trends in e-
commerce and discusses the role of the intermodal rail freight in this growing sector. Section 6
addresses near term future expectations and opportunities for the rail industry, public policy issues
of importance to the future of rail freight, and brings the report to closure.

                                                  1
2. Background and Context
Railroads have been an essential part of the United States economy for 170 years, helping to grow
the nation by supporting settlement and economic growth from coast to coast. The rail industry
has always been in a state of change, ranging from adopting new power sources to changing
product mixes to innovations in operating strategies to integration with other transportation modes.
The industry has responded to and facilitated market trends, with focus shifting from passengers
to freight, from products to bulk commodities, from mostly domestic flows to a central role in
international trade, and from break bulk shipments to containerization and intermodal traffic.
U.S. railroads have supported the dispersion of manufacturing as components have been sourced
more broadly from North America and beyond. They have played a key role in the expansion of
U.S. agricultural exports. Recently, railroads have facilitated the shift in the U.S. energy economy
as domestic oil production expanded rapidly, in both volume and spatial extent, through new
extraction techniques. They have become a core partner in intermodal traffic, broadly supporting
retail marketing patterns. And, in the face of necessity, railroads have adapted to short- and long-
term downturns in some of these markets, for example, the domestic coal industry, imposed by a
variety of external factors.
Nimbleness of the rail industry in the face of market volatility has advanced in part because of the
regulatory relaxation that came with the Staggers Act of 1980, which freed the industry of rate
regulations and other anticompetitive measures, giving the railroads the flexibility to adapt services
and to price at levels that allowed them to earn their cost of capital.
The industry has continued to innovate, fulfilling the mandate for Positive Train Control (PTC) to
assure system safety and support improvements in operating efficiencies. The Class I railroads
have moved to a variety of forms of Precision Scheduled Railroading (PSR), blocking trains to
facilitate origin to destination moves with fewer stops, and reducing needs to re-sort trains in
intermediate yards. Across the Class I railroads this increased average train speeds and reduced
dwell times in yards,1 boosting reliability and efficiency, releasing some resources in the process,
and lowering operating ratios in response to investor priorities.
COVID-19 brought about rapid and complex changes in the demand for freight transportation –
decreases, increases, and shifts in products to be moved. Railroads, like all of the transportation
industry, are at the mercy of such large-scale economic patterns, as illustrated by past events, most
recently the Great Recession of 2007-2009. Positioned in the middle of the economy, the industry
has responded, adapted, and maintained its central role in the most efficient freight and logistics
system in the world.
1
Supplychaindive, “6 charts show how PSR changed rail,” April 22, 2020,
https://www.supplychaindive.com/news/6-charts-psr-rail-speed-dwell-OR/571792/ (accessed March 24, 2021).
2The impacts of the pandemic came as a result of the shutdown of the U.S. economy, both by
necessity and by rule, as people stayed home, certain businesses were forced to close while others
ramped up production, unemployment exploded and thus income dropped, affecting both the scale
and scope of consumer purchasing. Many people were buying less; others were buying different
things and making purchases in different ways. At about the same time, U.S. exports and imports
were affected by international trade conflicts and tariffs. The freight industry, and the railroads,
were greatly affected by these economic forces.
COVID-19 changed the product mix in the logistics system, boosting consumer goods and
changing the ways in which they were purchased. While continuing to move most bulk
commodities, the railroads had the capacity and flexibility to respond to the rapid expansion of
demand for intermodal freight in the middle of 2020.
In Section 3, we present and analyze the quantitative trends in rail and truck movements and the
economic drivers that have occurred since the onset of the COVID-19 pandemic, comparing them
to experiences during the Great Recession, and considering, in particular, the rebound patterns and
what they may foretell about the short-term future.
33. Analyses of Rail Freight Impacts of Major Economic Disruptions
3.1 Approach
With a view to highlighting and contrasting similarities and differences in the previous economic
recession, known as the Great Recession (December, 2007 – June, 2009),2 with the economic
disruption brought by the COVID-19 pandemic, the economic indicators in Table 1 were selected
with respect to various components of rail freight. Data sources include the Association of
American Railroads (AAR), Freightwaves SONAR, The Federal Reserve Bank, The U.S.
Department of Transportation Bureau of Transportation Statistics, the Bureau of Economic
Analysis, the Energy Information Administration, and the Census Bureau.
To study the trends of the rail freight and economic indicators of different types and times, the
following parameters were examined:
1. The lag or lead time of the rail freight drop compared with the corresponding economic
indicator;
2. The extent of the drop in the Great Recession and under COVID-19; and
3. The duration taken for half and full recovery for the rail freight, in comparison to the
economic indicator.
The weekly rail freight traffic data3 used were the 4-week moving average United States-originated
traffic excluding the U.S. operations of Canadian and Mexican railroads unless otherwise
specified. U.S. recessions are shaded in charts.
The analysis on total carload and intermodal rail freight is first presented, followed by intermodal
freight. The detailed analysis on carload commodities can be found in Appendix A.
2
National Bureau of Economic Research, “US Business Cycle Expansions and Contractions,” NBER, 2020,
http://www.nber.org/research/data/us-business-cycle-expansions-and-contractions.
3
Association of American Railroads, “Weekly Rail Traffic Data” (Association of American Railroads, 2021).
4Table 1 - Rail Freight Components, Related Trucking Metrics, and Economic Indicators
Rail Freight Truck Freight Metrics Economic Indicators
Components
Overall / • Industrial Production (Federal Reserve)4
Intermodal • Truck Tonnage Index (Bureau of • Real Personal Consumption Expenditures (PCE) -
Transp. Statistics)5 Durable Goods (Bureau of Economic Analysis)8
• Longhaul Outbound Tender • Retail Sales (U.S. Census Bureau)9
Volume Index6 and Tender Reject
Index7 (Freightwaves SONAR)
Coal / • Coal Production Estimate (Energy Information
Administration)10
• Crude Oil Prices: West Texas Intermediate (WTI)
(Energy Information Administration)11
• Industrial Production (Federal Reserve)
Petroleum / • EIA Field Production of Crude Oil (Energy
Products Information Administration)12
• Crude Oil Prices: West Texas Intermediate (WTI)
(Energy Information Administration)
Motor Vehicles / • Domestic Auto Production (Bureau of Economic
and Equipment Analysis)13
• Real Personal Consumption Expenditures (PCE) -
Durable Goods (B. of Econ. Analysis)
Lumber and / • Housing Starts: Total: New Privately Owned
Wood Products Housing Units Started (Census Bureau)14
4
Board of Governors of the Federal Reserve System (US), “Industrial Production: Total Index” (FRED, Federal
Reserve Bank of St. Louis, 2021), https://fred.stlouisfed.org/series/IPB50001N.
5
Bureau of Transportation Statistics, “Truck Tonnage Index - Seasonally Adjusted” (Bureau of Transportation
Statistics, 2021), https://data.bts.gov/Research-and-Statistics/Truck-Tonnage-Index-Seasonally-Adjusted/fdsx-2s48.
6
FreightWaves, “Longhaul Outbound Tender Volume Index” (FreightWaves, 2021).
7
Freightwaves, “Longhaul Outbound Tender Reject Index” (Freightwaves, 2021).
8
U.S. Bureau of Economic Analysis, “Real Personal Consumption Expenditures: Durable Goods (Chain-Type
Quantity Index)” (U.S. Bureau of Economic Analysis, 2021),
https://fred.stlouisfed.org/series/DDURRA3M086SBEA.
9
U.S. Census Bureau, “Retail Sales: Retail and Food Services, Total,” FRED, Federal Reserve Bank of St. Louis
(FRED, Federal Reserve Bank of St. Louis, 2021), https://fred.stlouisfed.org/series/MRTSSM44X72USS; U.S.
Census Bureau, “Retail Sales: Nonstore Retailers,” FRED, Federal Reserve Bank of St. Louis (FRED, Federal
Reserve Bank of St. Louis, 2021), https://fred.stlouisfed.org/series/MRTSSM454USS.
10
U.S. Energy Information Administration, “Weekly Coal Production” (U.S. Energy Information Administration,
2021), https://www.eia.gov/coal/production/weekly/.
11
U.S. Energy Information Administration, “Crude Oil Prices: West Texas Intermediate (WTI) - Cushing,
Oklahoma” (FRED, Federal Reserve Bank of St. Louis, 2021), https://fred.stlouisfed.org/series/DCOILWTICO.
12
U.S. Energy Information Administration, “Weekly U.S. Field Production of Crude Oil (Thousand Barrels per
Day),” 2021, https://www.eia.gov/dnav/pet/hist/LeafHandler.ashx?n=PET&s=WCRFPUS2&f=W.
13
U.S. Bureau of Economic Analysis, “Domestic Auto Production” (FRED, Federal Reserve Bank of St. Louis,
2021), https://fred.stlouisfed.org/series/DAUPNSA.
14
U.S. Census Bureau and U.S. Department of Housing and Urban Development, “Housing Starts: Total: New
Privately Owned Housing Units Started” (FRED, Federal Reserve Bank of St. Louis, 2021),
https://fred.stlouisfed.org/series/HOUSTNSA.
53.2 Historical Context for Rail Service Resilience under the Great Recession
Total Carload and Intermodal Rail Freight
Industrial Production (IP) was chosen as the economic indicator to evaluate the response of total
rail freight, including both carload and intermodal shipments, at the macroscopic level. Selected
commodities and intermodal rail freight were studied in a similar manner with respective
corresponding economic indicators.
Figure 1 - Percentage change of Industrial Production and Rail Freight in the US (2007-2014)
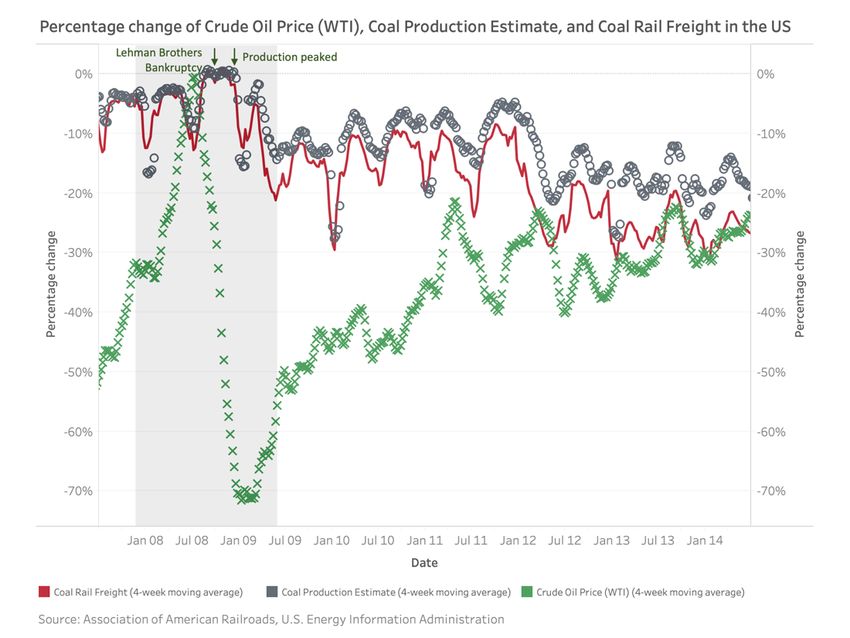
As shown in Figure 1, the drop in IP started with the onset of the recession in December, 2007 and
gained pace in August, 2008. Meanwhile, the total rail freight in 2008 stayed around 3% below
the start of the year and then decreased significantly in October, 2008, which lagged behind IP by
two months. The levels of decrease were 17% for IP and 23% for rail freight. Although rail freight
reached its bottom level in January, 2009, which coincided with the usual trough at the end of the
year, recovery did not start before IP also reached its bottom in May, 2009.
The half recovery of rail freight took a year, the same time as that of IP. It took rail freight 5 years
to achieve full recovery, one year later than IP.
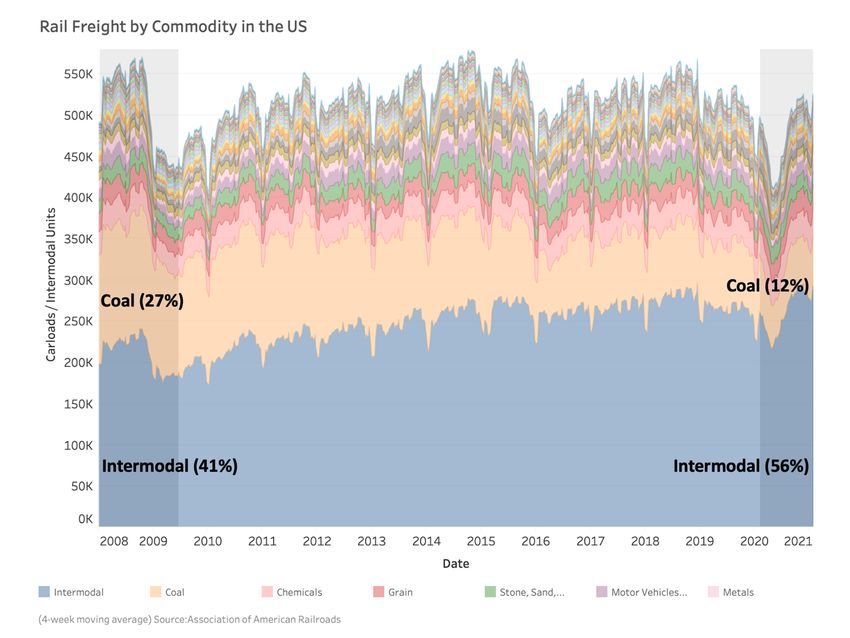
Figure 2 illustrates the proportions of rail freight by commodity type before, during, and after the
recession. Intermodal and coal constituted around 70% of rail freight by total carload and
intermodal units.
6Figure 2 - Proportion of Rail Freight by Commodity in the US (carloads/intermodal units 2008-2010)
Intermodal (IM) Rail Freight
IM rail freight has grown rapidly by 70% over the past 20 years. Real Personal Consumption
Expenditure (PCE) - Durable Goods was chosen to reflect the changes in the demand side for IM
freight. This is because durable goods are more sensitive to economic changes than the non-durable
proportion in PCE.
Figure 3 shows that as the financial crisis unfolded from August to October, 2008, Real PCE –
Durable Goods gradually decreased by 13%. The IM freight volume fell by 26% within three
months from October, 2008 to January, 2009, which lagged behind the PCE for four months and
coincided with the usual year-end trough.
Recovery for IM freight began in March, 2009, after the durable goods expenditures hit bottom in
the same month. This was similar to the trends in total rail freight and IP. Half of the losses were
recovered in 10 months for Real PCE – Durable Goods and 12 months for IM. The full recovery
of IM was completed in 2.5 years, which was faster than the 5 years of overall freight and at the
same time when the durable good expenditure returned to the pre-recession level.
7Figure 3 - Percentage change of Real Personal Consumption Expenditure (PCE) – Durable Goods and Intermodal
Rail Freight in the US (2007-2014)
Figure 4 - Percentage change of Real Personal Consumption Expenditure (PCE) – Durable Goods and Truck
Freight in the US (2007-2014)
8Figure 4 compares the same economic indicator with truck freight volume as captured by the Truck
Tonnage Index from the Bureau of Transportation Statistics. As a competing mode, truck freight
tracked closely with IM, albeit with a smaller drop of 14%, similar to that in Real PCE - Durable
Goods. In contrast to IM, which lagged behind the PCE indicator by four months, the truck
response was rapid, showing no lag for the Truck Tonnage Index to fall and reach the bottom.
The truck recovery time was analogous to IM, with minimal lag or lead to Real PCE – Durable
Goods, taking 10 months for half recovery and 2.5 years for a full recovery.
3.3 Current Downturn: Impact of COVID-19 Pandemic on Rail and Intermodal
In this phase of the analysis, the patterns of disruption due to COVID-19 were examined in search
of similarities and differences with the Great Recession. As before, selected economic indicators
were utilized to relate the response of rail freight to the disruption of specific economic factors,
first as a whole for all carload and intermodal freight, followed by breakdowns into intermodal
and commodity flows (in Appendix A).
Total Carload and Intermodal Rail Freight
Figure 5 - Percentage change of Industrial Production and Rail Freight in the US (2018-2021)
As shown in Figure 5, rail freight suffered a significant drop of 18% in the early phase of COVID-
19 lockdown from February to April, 2020, closely following the drop in IP of 18% from February
to March. This illustrated the short-term disruptive effect of the COVID-19 lockdowns in contrast
to the two-month lag of rail freight at the onset of the economic recession in 2008.
9As the lockdown was relaxed following the re-opening of various states, the respective rebounds
of the rail freight and IP were rapid, recovering half of the losses within three months. Rail freight
grew further to the pre-COVID level, achieving full recovery in five months. Nevertheless, IP was
still 3% below the pre- pandemic at the end of 2020. The deviation of total rail freight from IP was
supported mainly by the growth in intermodal traffic, which will be discussed later.
Before the coronavirus outbreak, there was a 10% decline in rail freight from the peak in 2018
during the China-United States trade war. As of January, 2021, while rail freight recovered all the
losses since the pandemic, it had not yet reached the previous peak.
Figure 6 shows the proportion of rail freight by commodity types before and during the pandemic.
The portion of intermodal freight rose continuously from the last recession to more than 55% at
the start of 2021. By contrast, coal freight percentage dropped from more than 25% in 2010 to
around 12% in 2021.
Figure 6 - Proportion of Rail Freight by Commodity in the US (carloads/intermodal units 2020-2021)
10Intermodal (IM) Rail Freight
Figure 7 - Percentage change of Real Personal Consumption Expenditure (PCE) – Durable Goods and Intermodal
Rail Freight in the US (2018-2021)
Figure 7 shows the response of IM rail freight in the pandemic. During the early stage of the virus
outbreak, from February to April, 2020, the freight volume suffered a significant 17% drop, while
Real PCE - Durable Goods decreased by 22%.
IM freight showed a V-shaped recovery following full recovery of the durable goods consumption
in May. The IM volume returned to the original level in three months in July, lagging by two
months. In the third quarter of 2020, the freight volume and the PCE indicator increased further to
more than 10% higher than the start of the year. This growth was supported by the new demand in
e-commerce induced by the pandemic and lockdown measures.
Before the above events, IM rail freight showed a gradual decrease of 5% since 2018, which took
place during the China-United States trade war.
Within IM, trailer rail freight experienced a strong increase of nearly 40% beyond the initial
rebound in 2020, closely following retail sales, as further discussed in Appendix A.
11Figure 8 - Percentage change of Real Personal Consumption Expenditure (PCE) – Durable Goods and Truck
Freight in the US (2018-2020)
Truck freight (Tonnage Index) experienced a smaller drop of 8% compared with IM (17%) and
Real PCE – Durable Goods (22%) in April, 2020 as shown in Figure 8.
The half recovery of the Truck Tonnage Index took three months and had not yet achieved full
recovery as of December, 2020. However, it is worth noting that the Truck Tonnage Index covers
all motor good transport. During the initial stages of COVID-19, short-distance goods transport
was subject to a smaller decrease, carrying supplies of living essentials (e.g., groceries), which
explains the relatively mild drop in truck freight in April, 2020.
To focus on long-haul truck freight (longer than 800 miles), which provides more insights into the
market competition for IM, the Long Outbound Tender Volume Index and the Rejection Index were
extracted from Freightwave SONAR (Figure 9 and Figure 10). The long-haul tender volume
decreased by 30% in April, 2020, matching the timing of the drop in the Truck Tonnage Index.
From April to October, the Long Outbound Tender Volume Index increased by 100%, echoing the
growth of Real PCE – Durable Goods and the shift of expenditures from services to goods during
the pandemic.
The Longhaul Outbound Tender Rejection Index indicates the excess of demand over supply for
truck freight for longer journeys. Since September, the rejection index increased to more than 25%
- more than a quarter of total loads tendered were rejected. This suggests the capacity limitation of
truck freight and likely shifted some demand to IM, a capacity benefit reflecting the ability of the
railroads to respond to market volatility.
12Figure 9 – Long Outbound Tender Volume Index (USA) (2019-2021)
Figure 10 – Long Outbound Tender Rejection Index (USA) (2019-2021)
3.4 A Look Ahead – Time Series Analyses and Predictions
Building on the insights from the resilience of rail freight in the Great Recession in 2008 and
correlation with the economic indicators in the pandemic of 2020, this section looks forward to
explore how economic indicators and rail freight might develop in the first half of 2021.
13Methodology
Time series models were developed using three future scenarios defined in Table 2 to address the
what-if questions. Scenario A assumed that the economic trends before 2020 would have continued
through 2020, providing a vision of the future that ignored the impact of the pandemic. Scenario
B also assumed continuation of pre-2020 trends but adjusted the economic indicators to match the
actual values for December, 2020, assuming the pre-pandemic trend would resume only in 2021.
Scenario C incorporated both the trend and impact of the pandemic and extended them to 2021.
While forecasting of macro-economic indicators and rail freight is extremely uncertain, these three
models serve as a basis for exploring possible futures.
Table 2 – Scenarios for Time Series Modeling for Economic Indicators and Rail Freight
Scenario Economic Indicators Rail Freight
Input Output Input Output
A. Omitting the January, 2012 - January, 2020 - January, 2012 - January, 2020 -
pandemic impact December, 2019 June, 2021 December, 2019 June, 2021
B. Omitting the January, 2012 - January - June, January, 2012- January - June,
pandemic impact and December, 2019 2021 December, 2019 2021
adjusting indicators to (adjusted to
match actual levels match
December, 2020)
C. Modeling the January, 2012 - January - June, January, 2012 - January - June,
pandemic impact December, 2020 2021 December, 2020 2021
Both the economic indicators and rail freight vary seasonally. For example, PCE and intermodal
freight tend to increase at the retail peak seasons and rail freight tends to drop at the year-end
holidays. Data used for this analysis were adjusted to account for this seasonal variation to simplify
comparisons. Separate time series models of the economic indicators were constructed for each
scenario for use in predicting rail freight patterns.
This analysis focused only on intermodal, coal, and motor vehicles and equipment, using the
variables listed in Table 3. Detailed methodology and further analysis for carload commodities are
presented in Appendix B.
Table 3 – Components of Rail Freight and Economic Indicators in Time Series Modeling
Rail Freight Economic Indicator
Intermodal Real Personal Consumption Expenditures (PCE) - Durable Goods
Coal Industrial Production
Motor Vehicles and Equipment Real Personal Consumption Expenditures (PCE) - Durable Goods
14Intermodal (IM) Rail Freight
Figure 11 – Time Series Model for Real Personal Consumption Expenditure (PCE) – Durable Goods (2018-2021)
Because Real PCE – Durable Goods published by Federal Reserve shown in Figure 11 was
seasonally adjusted (seasonal variation removed), the prediction from the models extended past
trends as straight lines. After the initial lockdown ended in April, 2020, the PCE quickly rose and
was nearly 10% higher than Scenario A, which illustrates the jump in personal consumption during
the second half of 2020.
In 2021, predictions for Scenario A were the lowest among the scenarios because the actual surges
in goods purchase were not represented. Scenario B, which assumed the resumption of the previous
trend and a sustained growth onwards, is the most optimistic prediction.
Based on the PCE model, Figure 12 shows the IM freight predictions for the three scenarios. In
2020, the COVID-19 impact is illustrated by the difference of as much as 15% between the actual
IM freight and Scenario A. However, since the third quarter of 2020, IM freight grew to an even
higher level, as much as 7% higher than the Scenario A, which assumed continuation of pre-
COVID trends, due largely to the surge in purchasing. This is another sign of how intermodal
freight responded promptly and kept the goods moving.
15Figure 12 – Time Series Model for Average Weekly Intermodal Rail Freight based on Real Personal Consumption
Expenditure – Durable Goods (2018-2021)
In 2021, Scenario A formed the lowest reference assuming the past trend and omitting the IM
freight growth in the previous year. In contrast, Scenario B, which represents the case where the
current increase in purchasing and its contribution to the IM market would be sustained in 2021,
showed that IM freight might be maintained at a high level in early 2021 after the year-end peak
in 2020. A similar result was obtained in Scenario C. In fact, IM freight volume actually performed
better than all three scenarios as of January, 2021, which indicates unexpectedly strong growth,
likely tied to continuing strength in the e-commerce market. Essentially, the actual recovery in
IM is “off the charts”, exceeding both where it would have been had pre-pandemic trends
continued, as well as the strong growth revealed in the initial recovery.
3.5 Summary
The recovery of rail freight in 2020 was remarkable but uneven across markets. Intermodal was a
strong driver of the quick rebound and continued growth under the new norm brought by the surge
in demand for products over services. Products and commodities, such as motor vehicles and
lumber, returned to pre-COVID levels, since the respective demands were either less affected or
recovered promptly after the major lockdown was lifted and manufacturers adapted to the quick
shift in consumer demand. This was largely different from the previous major disruption to the rail
freight industry during the Great Recession in 2007-2009, which was mainly driven by wide-
ranging economic impacts and decline on both supply and demand sides.
16The return of coal and petroleum freight remained sluggish due to weak demand and low energy
prices. Even though production was expected to rise after the pandemic, fierce competition with
natural gas and transition to renewable energy appeared to limit their opportunity to attain previous
peaks.
Considering the shock brought by coronavirus in the second quarter of 2020, the rapid pace of
recovery was a pleasant surprise for the economy, retailers that were able to adapt, and most
consumers. A large part of sustained recovery and growth of rail freight is likely to be influenced
by whether the long-term growth in e-commerce will continue when the pandemic is over, and the
extent to which intermodal freight will benefit from omnichannel retailing.
KEY TAKEAWAYS: COVID-19 IMPACTS ON RAIL FREIGHT
• COVID hit the RRs quickly and hard. But recovery was swift and overall rail freight
is exceeding 2019 volumes.
• RRs responded well through the recovery, although employment losses due to
COVID-19 and PSR may have made recovery initially more difficult.
• Still, rail capacity was sufficiently nimble to pick up IM traffic growth that long haul
trucks could not, rebounding above 2019 weekly shipment levels.
• Demand for bulk commodities outside the energy sector have held reasonably strong
and the rail system has kept them moving. The flow of agricultural products, once
depressed by trade conflicts and tariffs, also showed rebound.
• IM is an important rail market going forward because it commands high prices and is
critical to the nation’s economic recovery.
• Actual recovery in IM has exceeded both where it would have been had pre-pandemic
trends continued, as well as the strong growth revealed in the initial phase of the
recovery.
• Bulk commodities (of course) are still primary markets for RRs, because rail is most
efficient at moving these products.
• To the extent that RRs can sustain and continue to improve performance, IM will be
important in the future.
174. Industry Perspectives on COVID-19 Impacts and the Future
4.1 Approach
In this component of the project, perspectives on the COVID-19 experience, the rebound, and the
future were gathered from 20 leaders from the shipping and logistics industry – representatives of
rail and truck carriers, rail car and intermodal chassis manufacturers and pool operators, and major
national shippers (Appendix B). This was accomplished through a series of structured, virtual
interviews, supported by tracking the trade literature to broaden industry views. The results provide
detail beyond the data, including insights into causal factors, obstacles to recovery, and challenges
and opportunities for the future.
4.2 Pre-COVID trends in the rail industry
In the years shortly before COVID-19 hit, energy shipments by rail were declining; coal has been
experiencing a long-term decline - coal’s share of electricity generation fell by half, from 48% to
19% between 2008 and 2020 (Figure 13). This was driven primarily by the ready availability of
less costly (and cleaner) natural gas. Shipments of petroleum fuels were reduced by the global
oversupply of petroleum which undercut the prices of domestically-produced shale oils and hit the
economics of fracking.
Since the opening of Panama Canal Neopanamax locks in 2016, which incentivized east and Gulf
coast port and harbor investments to accommodate larger container ships, there has been some
shift in Asian imports headed for Midwest and eastern U.S. destinations from west to east and Gulf
coast ports. This was supported by the economies of larger container ships, as well as by some
shift in sourcing from China to Southeast Asia in search of lower production costs, which made
the Suez Canal route to North America more competitive for east coast destinations. An additional
factor has been ongoing congestion and labor uncertainties in southern California (SoCal) ports,
which gave retailers and manufacturers the incentive to diversify the use of inbound ports to assure
more resilient supply chains.
The shift to east coast (EC) ports favored truck-to-destination container movements, rather than
IM, because haul lengths to markets are shorter in the east. Still, west coast (WC), and particularly
SoCal ports continue to have a strong draw for containerized imports because of time and cost
advantages to both the west coast and Midwestern U.S. markets.
The heavy-and-slow bulk product markets – energy, building, and waste materials, and agricultural
products – are where rail has its greatest competitive advantage, except in the Mississippi Valley
where barge is also important. Before and during the pandemic, agricultural exports experienced
volatility because of trade conflicts with China, Canada, and Mexico.
18Figure 13 – U.S. Electricity Generation by Major Energy Source
The growth of lucrative intermodal (IM) traffic – trailers and
containers carried on specialized cars for the longest legs of Fast-growing e-commerce trade
trips from ports or manufacturers to inland distribution …has become an important
centers – had been underway for several decades when the marketing target for the rail
pandemic struck, as discussed in Section 3. Before the industry.... Conversely, IM has
pandemic, IM units represented about half of the railroad become an essential component
market in terms of carload and car volumes (see Figure 14). of the overall supply chain
The IM cargo is a mix of imports and manufactured goods logistics for e-commerce.
headed for distribution centers and consumers, or
component parts destined for assembly plants. The Internet brought online purchasing, e-
commerce, into the market, and imported goods purchased online became a growing component
of IM traffic. While not all IM traffic is linked to e-commerce, any products sold through e-
commerce channels that move by rail are IM. The years immediately prior to COVID-19 saw the
Class I railroads begin to introduce versions of Precision Scheduled Railroading (PSR), which has
resulted in fewer, more direct, and longer trains operating on more predictable schedules. This
improved service quality – speed and reliability – in key markets, reduced or eliminated service in
smaller origin-destination markets, and allowed railroads to sideline or repurpose unneeded power
and infrastructure (notably classification yards), and to realign workforces to match service
19offerings. PSR has allowed the industry to focus on minimizing operating ratios, which enhanced
support from investors.
Figure 14 - Proportion of Rail Freight by Commodity in the US (carloads/intermodal units 2007-2021)
4.3 COVID-19 Impacts and Rebound: The Role of Intermodal
Industry leaders confirmed, as illustrated in Section 3, that
COVID-19 led to a quick shift in
the negative effects of COVID-19 on rail volumes were
consumer demand from
strong and rapid for most commodities. Precipitating forces
were a sudden drop in employment and shutdowns in services to products, energizing
manufacturing because of both the drop in demand and the retail purchasing of products
need to assure workplace safety. Plant closures affected both for in-home use and home
inbound and outbound freight – e.g., plastics for auto improvement, and particularly
manufacturing and finished vehicles – both major products boosting shopping via e-
moving by rail. commerce… As a consequence,
demand for intermodal
Those interviewed unanimously expressed surprise with the
shipments exploded…
rapidity of the rebound in demand for some products, a
marked difference from the multi-year rebound of the Great Recession of 2007-2009. COVID-19
led to a quick shift in consumer demand from services to products, energizing retail purchasing of
20products for in-home use and home improvement, and particularly boosting shopping via e-
commerce as consumers found that many needs could be met without leaving home (see Section
6).
As a consequence, demand for intermodal shipments
IM rail service played a critical
exploded – the description used by many of those
role in the nation’s supply chains
interviewed. The push to IM was accelerated by capacity
during the period of the COVID-
constraints in the trucking market, attributable to persistent
driver shortages amplified by the spread of COVID-19. 19 pandemic, providing much-
Manifestations in the trucking industry included both needed capacity to keep
tender rejections (refusals of service) on contracted rates essential goods flowing to
and surcharges for above-contract shipment volumes, as described consumers.
in Section 3 and reported in the
interviews. In this regard, IM rail service played a critical role in the nation’s supply chains during
the period of the COVID-19 pandemic, providing much-needed capacity to keep essential goods
flowing to consumers.
The IM market, particularly the growing share coming
…industry participants suggested
from e-commerce, is an important one for the railroads,
that on-time delivery reliability not simply for the cargo volumes but also the high revenue
dominated price in the choice of potential. That potential comes with a challenge because
shipment options, particularly in of the customer demands for high levels of performance:
the e-commerce market. short travel times and especially reliability of on-time
delivery of consumer products and manufacturing inputs.
Discussions with industry participants suggested that on-time delivery reliability dominated price
in the choice of shipment options, particularly in the e-commerce market.
How Intermodal works: A complex system with many moving parts
Delivering end-to-end IM freight services – moving boxes from ports or factories to assembly
plants, distribution centers, and retail stores – while clearly a centerpiece of the U.S. logistics
system, is a complex and challenging process. Efficient IM requires the collaboration and
coordination of multiple entities: ocean carriers, ports and port operators, trucking companies
(drayage and long-haul), manufacturers and assemblers, retailers, rail car manufacturing and
leasing companies, chassis providers, inland terminal operators, warehouses, and distribution
centers, and, in the middle of the process, the railroads themselves. This process is illustrated in
Figure 15, which shows graphically the process flow among the key actors and signals the
dependence.
The potential for disconnects and delays exists throughout the process, but particularly at the
network nodes – terminals and interchange points. Integrated carriers, i.e., those controlling all of
the end-to-end resources – equipment and drivers, holding long term contracts – may be better
equipped to assure the success of IM logistics, but the market offers a variety of options for moving
containerized freight by IM. And when the demand peaks unexpectedly, as was the case when the
21COVID-19 rebound began, some capacity and performance issues can be expected; that they were
relatively few is a credit to the nimbleness of this complex system.
of the efficiency of the overall process on the performance of every entity in the chain.
Figure 15 – Illustration of Intermodal Freight Components in Overall Container Movement Process
Delays at Ports. Ports, primarily the busiest container ports in
And when the demand
the country, Los Angeles and Long Beach (the “SoCal” ports) are
peaks unexpectedly, as was
major points of congestion on the IM network.15 These ports have
the case when the COVID-
a long history of both market dominance and congestion, the latter
due to sheer volume of container moves, but also because of a 19 rebound began, some
recent history of labor strife. A number of regulatory and pricing capacity and performance
schemes have been applied to reduce port congestion, with varied issues can be expected; that
success. they were relatively few is a
credit to the nimbleness of
When COVID-19 hit, inbound, loaded container volumes dropped this complex system.
precipitously, first reflecting manufacturing shutdowns in China,
and later the dip in U.S. economic activity (see Figure 1616). By July, 2020, adjustments in the
U.S. economy began to pull more products through the Asian supply chain; October showed an
almost 30% increase in containers coming through the Port of Los Angeles compared with 2019.
Similar increases were reported in EC ports, as well,17 and demands for drayage were pressing
capacity limits in mid-2020.18
15
United States. Department of Transportation. Bureau of Transportation Statistics, “Port Performance Freight
Statistics Program: Annual Report to Congress 2018,” 2019, https://doi.org/10.21949/1502601.
16
Port of Los Angeles, City of Los Angeles, “Container Statistics | Port of Los Angeles,” 2021,
https://www.portoflosangeles.org/business/statistics/container-statistics.
17
Mark Szakonyi, “Congestion Risks at North American Ports Rise as Winter Nears,” Journal of Commerce,
December 11, 2020, sec. Maritime News,
http://www.proquest.com/docview/2469462373/abstract/FCC985E60A0A42BDPQ/1.
18
Jeff Berman, “Capacity, Demand, and Equipment Outlooks Make for Challenging Ocean Container Market,”
Logistics Management, January 19, 2021,
22Multiple factors contributed to this uptick – PPE purchases, shifts to buying material goods instead
of experiences, store stocking and purchasing for the holiday season, and inventory restocking that
was deferred from spring and summer because of the pandemic. On top of this peak in inbound
container flows, COVID-19 hit port workers and truck drivers – over 600 cases were reported in
the Port of Los Angeles between December, 2020 and February, 2021,19,20 and 800 tested positive
or were in quarantine by the end of February.
Figure 16 - Port of Los Angeles Monthly Loaded Imported TEUs, 2019 and 2020
As of February, 2021, containers are still not moving off the WC docks fast enough. Early in the
pandemic, retailers were refusing to take boxes – sales were off and unloading labor was short,
and port storage was filling up.21 Retailer acceptance of cargo has remained slow, apparently a
result of the entire supply chain backing up and the SoCal ports remain heavily congested as import
containers stack up, filling available storage space to 95% of capacity and above. As on-dock
https://www.logisticsmgmt.com/article/capacity_demand_and_equipment_outlooks_make_for_challenging_ocean_c
ontainer.
19
Bill Mongelluzzo, “LA-LB Congestion to Clear by Late Spring: Terminal Operators,” Journal of Commerce,
February 5, 2021, sec. Port News,
http://www.proquest.com/docview/2486641005/abstract/6E84C1CDC3714935PQ/1.
20
Costas Paris, “Shipping Companies Look at Sailing Away From Choked Southern California Gateways,” Wall
Street Journal, February 8, 2021, sec. C Suite, https://www.wsj.com/articles/shipping-companies-look-at-sailing-
away-from-choked-southern-california-gateways-11612802085.
21
Mark Szakonyi, “US Port Congestion Threat Demands United Industry Response,” Journal of Commerce, April 2,
2020, sec. Port News, http://www.proquest.com/docview/2385563743/abstract/1B7E37DC65344DF9PQ/1.
23storage reaches capacity, container throughput slows, and inbound ships spend more time in berths
and at anchor. Limited labor and limited lift capacity appear to be ongoing factors, but the primary
cause seems to be the slow rate of recipients retrieving inbound boxes – using the WC ports as
remote warehouses.
As many as 54 ships were anchored off the SoCal ports awaiting berths in February, 2021.22 There
has been some movement to divert ships to other WC ports – Oakland, Seattle, and Tacoma. Some
marine carriers have redirected or canceled sailings, and the State of California has asked the
Federal Maritime Commission to investigate the problem.
Port congestion and COVID-19-related supply chain problems have led some shippers to pursue a
four-corner strategy, dividing inbound shipments between SoCal, the Pacific Northwest, and two
east coast ports, Savannah or Charleston and the Port of
New York, to reduce risks of delays. Some container owners The draw of SoCal ports remains
were reported to be reluctant to ship boxes to EC ports strong for a variety of reasons,
because of slow return cycles compared to WC ports, further including the nearness to large
congesting WC ports. WC markets and the high level of
efficiency of rail for moving IM
This four-corner trend continues to be reported but the shipments to the U.S. interior.
impacts seem to be limited. The draw of SoCal ports
remains strong for a variety of reasons, including the nearness to large WC markets and the high
level of efficiency of rail for moving IM shipments to the U.S. interior. Arguably it is difficult for
both carriers and shippers to move away from established logistics patterns supported by extensive
private and public infrastructure, concentration of labor, and deep organizational experience.
Transload Facilities. Near-shore transload facilities could be additional choke points on the
overall IM logistics network, while providing shippers additional flexibility in adjusting
destinations in quasi real-time in response to changing market demands. About a third of inbound
international containers, 20 and 40 foot boxes, are transloaded to 53 foot domestic containers at or
near the ports for transport by IM rail. Only the smaller boxes are accommodated on most container
ships, while the domestic containers can be swapped for the internationals at a ratio of 2 for 3,
amplifying inland shipping capacity. Port-area holding and transloading also gives retailers some
flexibility by allowing last minute choices of inland destinations for specific products. The
remaining two-thirds of inbound marine containers are split about evenly between rail to smaller
cities and truck to destinations in SoCal.
Equipment Shortages: Boxes, Chassis, but not Rail Cars. Beyond WC ports operating at
capacity, some IM delays were attributed to lack of equipment availability – domestic containers
(boxes) and chassis for moving boxes over the road. This was exacerbated by the surge in imports
driven by consumer demand for certain types of goods during the pandemic. Some retailers
reported that their boxes sometimes missed scheduled outbound trains. Some retailers and
22
Marine Exchange of Southern California, February 16, 2021.
24You can also read