The livelihood impacts of COVID-19 in urban South Africa - A view from below WIDER Working Paper 2021/56 - UNU-WIDER
←
→
Page content transcription
If your browser does not render page correctly, please read the page content below

WIDER Working Paper 2021/56

The livelihood impacts of COVID-19 in urban
South Africa

A view from below

Simone Schotte1,2 and Rocco Zizzamia2,3

March 2021
Abstract: This paper investigates the impact of the COVID-19 pandemic and related policy
measures on livelihoods in urban South Africa. Using qualitative research methods, we analyse two
rounds of semi-structured phone interviews, conducted between June and September 2020 in the
township of Khayelitsha, Cape Town. We contextualise these by presenting a snapshot of the
nationwide dynamics using quantitative panel data. Our findings describe how the shock of the
COVID-19 pandemic has deepened the economic vulnerability which preceded the crisis.
Survivalist livelihood strategies were undermined by the economic disruption to the informal
sector, while the co-variate nature of the shock rendered social networks and informal insurance
mechanisms ineffective, causing households to liquidate savings, default on insurance payments,
and deepen their reliance on government grants. In addition, the impact of the pandemic on
schooling may deepen existing inequalities and constrain future upward mobility.
Key words: COVID-19, welfare dynamics, lockdown, South Africa, mixed methods
JEL classification: I18, J46, O55
Acknowledgements: This study contributes to UNU-WIDER’s research on ‘Transforming
informal work and livelihoods’. The field research for this study was made possible by support
from the ‘Southern Africa – Towards Inclusive Economic Development’ (SA-TIED) programme
under ‘Work Stream 4: Turning the tide on inequality’, run by UNU-WIDER and the National
Treasury of South Africa. Both authors contributed equally to the data collection, analysis, and
writing. We are very grateful to Murray Leibbrandt and Rachel Gisselquist for helpful comments
and discussions. We are also indebted to Mzulungile Cabanga for exceptional fieldwork and
research assistance. Any errors remain our own.

1 UNU-WIDER, corresponding author: schotte@wider.unu.edu; 2 Southern African Labour and Development Research Unit,

University of Cape Town, South Africa; 3 University of Oxford, United Kingdom
This study has been prepared within the UNU-WIDER project Transforming informal work and livelihoods.
Copyright © UNU-WIDER 2021
UNU-WIDER employs a fair use policy for reasonable reproduction of UNU-WIDER copyrighted content—such as the
reproduction of a table or a figure, and/or text not exceeding 400 words—with due acknowledgement of the original source,
without requiring explicit permission from the copyright holder.
Information and requests: publications@wider.unu.edu
ISSN 1798-7237 ISBN 978-92-9256-994-5
https://doi.org/10.35188/UNU-WIDER/2021/994-5
Typescript prepared by Siméon Rapin.
United Nations University World Institute for Development Economics Research provides economic analysis and policy advice
with the aim of promoting sustainable and equitable development. The Institute began operations in 1985 in Helsinki, Finland, as
the first research and training centre of the United Nations University. Today it is a unique blend of think tank, research institute,
and UN agency—providing a range of services from policy advice to governments as well as freely available original research.
The Institute is funded through income from an endowment fund with additional contributions to its work programme from
Finland, Sweden, and the United Kingdom as well as earmarked contributions for specific projects from a variety of donors.
Katajanokanlaituri 6 B, 00160 Helsinki, Finland
The views expressed in this paper are those of the author(s), and do not necessarily reflect the views of the Institute or the United
Nations University, nor the programme/project donors.
1       Introduction

The COVID-19 pandemic has delivered a devastating economic shock to livelihoods across the world.
Early indications suggest that the poor within developing countries have suffered disproportionately.
More specifically, within countries, the impact of the pandemic has been unequal across households with
differential access to income, assets, employment, health care, and social protection, as well as along
gender lines (Adams-Prassl et al. 2020; Gisselquist and Kundu 2020). The inequality of the impact was
acutely felt in the labour market, where workers in elementary occupations, those in the urban informal
economy, and those without unemployment insurance have been most affected by distancing polices and
the overall drop in demand (Balde et al. 2020; Espi et al. 2020; Jain et al. 2020a; Lakuma and Nathan
2020; Ranchhod and Daniels 2020a; Schotte et al. 2021).

Much of the existing evidence for these effects has relied primarily on quantitative data collected through
rapid telephone surveys. However, to obtain a deeper and more granular understanding of the livelihood
responses to the COVID-19 shock, there is much to gain by combining quantitative data with an analysis
of detailed qualitative evidence. This is the goal of this paper.

In this article, we assess how the COVID-19 pandemic and related policy measures have affected peo-
ple’s livelihoods, focusing on low-income and disadvantaged communities in urban South Africa, with
the aim of providing a detailed ‘view from below’. We present a snapshot of the quantitative evidence on
the COVID-19 impact that has been gathered at the national level and enrich these findings by providing
an in-depth qualitative analysis that explores the perceptions, coping strategies, and main challenges
experienced by people who were highly vulnerable to the shock.

We focus on South Africa as a case study, being among the countries most heavily affected by the
pandemic. The COVID-19 lockdown in South Africa was one of the earliest and strictest in global
comparison (Gustafsson 2020), causing a substantial disruption of labour markets, with already disad-
vantaged workers bearing the heaviest burden (Casale and Shepherd 2020; Espi et al. 2020; Jain et al.
2020a; Ranchhod and Daniels 2020a; Rogan and Skinner 2020). Despite stringent, early confinement
policies implemented to reduce contagion, COVID-19 infections in South Africa continued to surge
rapidly. Cape Town—with its poor, densely populated townships—and the surrounding Western Cape
province quickly emerged as hotspots.

Our qualitative research strategy draws on two rounds of semi-structured interviews conducted between
June and September 2020 with respondents residing in Khayelitsha, a large township on the outskirts
Cape Town. The sample was drawn from a previous qualitative study—consisting of in-depth life-history
interviews and wealth ranking exercises—that we conducted in Khayelitsha in 2017. The interviews in
this extension study focused on the impact of the pandemic on economic livelihoods and well-being
and were analysed using a thematic approach. This analysis was supplemented by two key informant
interviews that shed light on issues experienced at the broader community level.

Our findings highlight three interrelated consequences of the COVID-19 pandemic. First, consistent
with prior quantitative evidence on the COVID-19 shock in South Africa (Jain et al. 2020a; Ranchhod
and Daniels 2020a), we find that the pandemic was experienced first and foremost as a sudden and
dramatic shock to labour markets. While this shock to earnings and employment was experienced by
almost all workers in our sample, the consequences appear especially severe and long-lasting for those in
informal work, whether in wage labour or self-employment. The shock also percolated through to those
not directly affected by job or earnings losses, drying up distributional channels of support. Consistent
with Jain et al. (2020b), this shock to labour market income appears to have affected household spending,
with several respondents reducing consumption of essential food and non-food items.

                                                    1
Second, the shock to earnings has led to a general decrease in the underlying resilience of households
to future potential shocks—which could include the second wave of COVID-19 infections from which
South Africa emerged in February 2020. Providing novel evidence on a dimension not captured in
the quantitative data, our qualitative data show that households have lost access to both formal and
informal mechanisms of social insurance in the crisis. Several respondents reported defaulting on funeral
policies, drawing down on savings, witnessing rotating savings and credit associations disintegrate, and
losing access to remittance income. Covariate shocks such as the COVID-19 pandemic compromise
community-based risk sharing institutions (Dercon 2002), and subsequently expose individuals to future
idiosyncratic shocks. In this regard, the expansion of government social protection through top-ups
to existing grants and through the introduction of a new social relief grant has been indispensable in
sustaining the livelihoods of the poor.
Third, amongst our interlocutors there was a general sense that developments in the pandemic context
have led to a perception of a loss of control of the outcomes in one’s life. We propose that the psycholog-
ical distress experienced by individuals in our sample can be understood in terms of this fatalistic shift.
Individual anxieties were centered on where respondents have ‘skin in the game’—younger men were
distressed primarily about their perceived loss of agency in the labour market, while older respondents
were more anxious about the uncontrollable disease environment.
This work adds to two strands of research. First, we expand on the rapidly expanding body of research
investigating the livelihood impacts of COVID-19 in developing countries in general (Abraham et al.
2020; Balde et al. 2020; Gisselquist and Kundu 2020; Lakuma and Nathan 2020; Sumner et al. 2020),
and in South Africa in particular (Espi et al. 2020; Jain et al. 2020a; Köhler and Bhorat 2020; Ranchhod
and Daniels 2020a; van der Berg et al. 2020; Wills et al. 2020). By presenting novel qualitative evidence,
our paper is able to speak to processes which remain out of reach of large quantitative rapid-assessment
surveys—such as the inter-linkages between livelihood strategies and informal support networks, the
psychological experience of the pandemic, and the exacerbation of underlying vulnerabilities.
Second, our paper adds to existing work investigating the determinants of economic vulnerability and
resilience to shocks, expanding both the qualitative (Neves and Toit 2013; Du Toit and Neves 2007)
and quantitative (Schotte et al. 2018; Zizzamia et al. 2019) literature. In this regard, the COVID-19
context provides us with the opportunity to investigate how prior work on vulnerability to economic
shocks maps onto the outcomes observed in face of new and dramatic health, economic, and social
challenges. Previous research has shown that—prior to the pandemic—two thirds of the South African
population were either poor or vulnerable to falling into poverty (Schotte et al. 2018). As Schotte (2019)
and Zizzamia (2020) argue, among those households with few buffers to protect their living standards,
negative shocks to income can easily generate a poverty trap that is difficult to escape from, and health
shocks and job losses are among the main trigger events that can precipitate a downward spiral. Making
use of newly collected data in South Africa, we are able to show that pre-existing markers of vulnerability
map onto poverty and deprivation outcomes in the post-COVID context, and help explain heterogeneity
in the experience of the shock.
Our findings give rise to concerns that the COVID-19 pandemic has both exposed and exacerbated
existing inequalities. It may not only present a temporary income shock but also hamper people’s income
generating activities in the longer term—with potential lasting implications for the incidence, depth, and
severity of poverty.
The paper proceeds as follows: Section 2 discusses the South African context and policy landscape in the
wake of the COVID-19 pandemic. Section 3 presents the qualitative and quantitative data used and the
methodology of analysis. Section 4 provides a snapshot assessment of the quantifiable economic impact
of COVID-19 on South African households. Section 5 proceeds with an in-depth analysis of our quali-
tative data, assessing the impact of COVID-19 on township livelihoods. Section 6 concludes.
22 COVID-19 in South Africa: background and policy environment
For policy-makers around the world, navigating the response to the COVID-19 pandemic has been a
balancing act between protecting public health and the economy. South Africa bears one of the largest
COVID-19 case loads worldwide, and its policy response has been one of the earliest and strictest in
global comparison.
In face of rising infections in the country, which since the first registered case in early March 2020
had rapidly spread to all nine provinces, a national lockdown came into effect on 27 March. This full
lockdown was later framed by the government as ‘Level 5’ in a ‘Risk Adjusted Strategy’ to manage the
spread of COVID-19. Over time, the government gradually relaxed the regulations, with a move onto
‘Level 4’ coming into effect on 1 May, ‘Level 3’ on 1 June, ‘Level 2’ on 18 August, and ‘Level 1’ on 21
September 2020 (see Appendix Table A1 for a summary of alert levels).
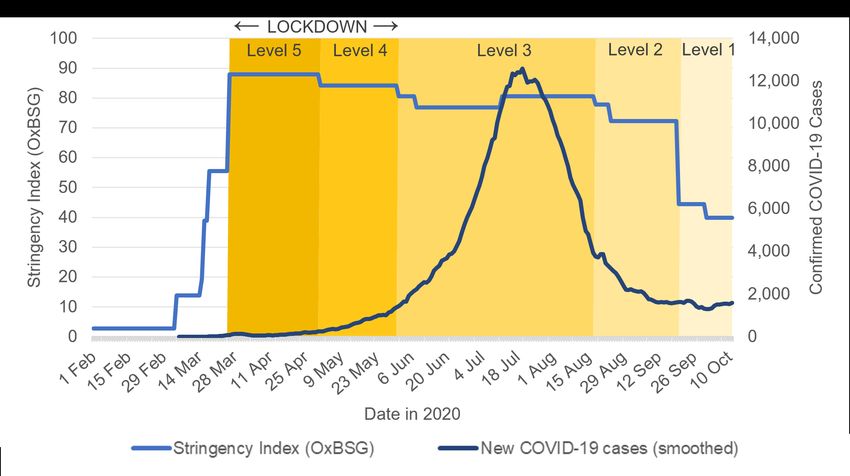
Figure 1 illustrates the stringency of policy measures that were in place in South Africa between March
and October 2020 in response to COVID-19. Level 5 entailed a complete stop to all but essential com-
mercial activity and a severe curtailment of freedom of personal movement, including strict stay-at-home
orders and the active involvement of the South African Defence Force in enforcing regulations. In sub-
sequent levels, the restrictions on commercial activity were gradually relaxed, yet remaining relatively
rigid by international standards. Strict stay-at-home orders remained in force in Level 4, so that mean-
ingful relaxation on the freedom of movement for the general population only began in Level 3.
Despite stringent, early confinement policies to reduce contagion, COVID-19 infections in South Africa
continued to surge rapidly, with the first wave reaching peak levels in mid-July 2020 (see Figure 1).
In the early phases of the pandemic, Cape Town—with its poor, densely populated townships—and
the surrounding Western Cape province quickly emerged as hotspots, accounting for 45 per cent of the
nation’s confirmed cases as of 28 June 2020 (NICD 2020). Despite the sharp subsequent fall in new
infections between late July and end of August, by September 2020 South Africa had by far the highest
number of total confirmed COVID-19 cases in Africa and the sixth highest case count worldwide.
Figure 1: COVID-19 cases and government response stringency index
Note: the stringency index published by the Blavatnik School of Government (OxBSG) is a composite measure based on nine
response indicators including school closures, workplace closures, and travel bans, rescaled to a value from 0 to 100
(strictest); it shows the pandemic response level in the districts subject to the strictest lockdown measures.
Source: authors’ illustration based on Hale and Webster (2020) and Roser et al. (2020).
3The economic impact of stringent distancing polices and the overall drop in demand were acutely felt in
the labour market—triggering job losses, business closures, and underemployment. Jain et al. (2020a)
and Ranchhod and Daniels (2020b) estimate that 40 per cent of South Africans who had been em-
ployed in February 2020 were not actively employed during the Level 5 lockdown, with half of this
decline in active employment appearing to be due to permanent lay-offs or business closures (Jain et al.
2020a). Employment losses were concentrated among those who were already disadvantaged prior to
the pandemic—women, less-skilled workers, informal workers, low-income earners, and those with a
history of unemployment (Casale and Shepherd 2020; Espi et al. 2020; Jain et al. 2020a; Ranchhod and
Daniels 2020a; Rogan and Skinner 2020). The evidence also points to a large impact of the COVID-19
crisis on household poverty: two in five South Africans had lost their main source of household income
over the initial lockdown, and almost every second household ran out of money to buy food during April
(Wills et al. 2020).
With the gradual relaxation of confinement measures to Level 4 (1 May) and Level 3 (1 June), commer-
cial activity recommenced and labour markets witnessed a partial recovery (Jain et al. 2020b; Ranchhod
and Daniels 2020b). Approximately half of the loss in active employment that occurred between Febru-
ary and April was recovered by June (Jain et al. 2020b), and the recovery was sustained into October
(Bassier, Budlender, and Zizzamia 2021).1
In addition to the partial recovery in the labour market, targeted social assistance measures introduced
from May onward helped to cushion the blow delivered by COVID-19. In response to the crisis, on 26
March 2020, South Africa’s government introduced the Temporary Employee/Employer Relief Scheme
(TERS), a social insurance scheme administered through the contribution-based Unemployment Insur-
ance Fund (UIF).2 Approximately one month later, on 21 April 2020, a set of social assistance measures
were introduced, aimed at delivering relief to households not covered by employment-related insurance
schemes. These consisted of: a) an increase to the Child Support Grant (CSG) of ZAR300 (US$17)3 for
one month, followed by an increase of ZAR500 (US$30) per month from June to October (but limited
during the latter period to one increase per caregiver); b) an increase to all other social grants (such as
the old age pension and the disability grant) of ZAR250 (US$15) per month until October, and; c) the
introduction of a special COVID-19 Social Relief of Distress Grant (SRDG) of ZAR350 (US$21) per
month, newly introduced to assist people who are unemployed and not receiving any other grant or UIF
(Bassier, Budlender, and Zizzamia 2021).
The delivery of UIF-TERS and the SRDG were compromised by delays and early implementation fail-
ures.4 Despite these initial delays, Jain et al. (2020b) show that coverage by the SRDG increased re-
markably between June and July/August. By October, the SRDG had become a core element of South
1 This recovery was driven almost exclusively by those who reported having been furloughed—placed on either paid or unpaid
leave—in April. In contrast, almost all of those who reported having lost their jobs completely between February and April
remained not employed in June. Approximately 40 per cent of those who had been placed on ‘unpaid leave’ during the
lockdown had lost their jobs by June (Bassier, Budlender, and Zizzamia 2021).
2 TERS is an earnings relief benefit for employers unable to pay their employees due to the COVID-19 lockdown (Department
of Employment and Labour 2020a). The minimum payment was set at ZAR3,500 per month (US$205), equal to the National
Minimum Wage, and the maximum payment was set at approximately ZAR6,700 (US$394). TERS benefits were initially
restricted to workers who were contributing to UIF, but on 26 May 2020 a successful legal challenge expanded the scheme to
any worker who could prove an employment relationship, whether registered with UIF or not.
3 US$ calculated with an exchange rate of US$1 = ZAR17, the approximate value during the first months of the pandemic.
4 TERS payments were initially delayed due to large backlogs of applications and infrastructure breakdowns (Department
of Employment and Labour 2020b). While eligibility for an SRDG-like grant was previously estimated at approximately 15
million South Africans (Bassier, Budlender, Zizzamia, Leibbrandt, and Ranchhod 2021), as of 11 June 2020, the South African
Social Security Agency had received over 6.5 million applications but had only paid 600,000 grants (Webster 2020). In June,
the state also revealed that 60% of rejected applicants actually qualified, leading to lengthy implementation delays for these
individuals (SASSA 2020).
4Africa’s social assistance landscape and, alongside the CSG, proved most effective at reaching the poor-
est South Africans (Bassier, Budlender, and Zizzamia 2021).
The partial labour market recovery along with the roll-out of social assistance interventions did lead
to some economic recovery for South African households. While the labour market shock was in-
equality enhancing—initially poorer households were worst affected and benefited least from the partial
recovery—the government’s social assistance interventions were progressively targeted, with the lowest
deciles of the populations benefiting disproportionately (Jain et al. 2020b; Köhler and Bhorat 2020).
Comparing incomes in April and June, Jain et al. (2020b) find evidence of a decrease in household
poverty rates by between 3 and 6 percentage points for the general population.
3 Data and methods
3.1 Qualitative data
The main focus of this paper is on the analysis of two rounds of semi-structured phone interviews,
conducted between June and September 2020. The 15 respondents, who are identical between rounds,
were selected from a previous qualitative study conducted from July to September 2017 in Khayelitsha,
a large African township situated about 30 kilometres south east of Cape Town’s city centre. Khayelitsha
was selected as a study site because it closely resembles many of the context characteristics that typically
condition the livelihoods of the urban poor in South Africa (Schotte 2019; Zizzamia 2020).5
Participants of the 2017 study were drawn from a sampling frame that had been designed to capture
the local socio-economic diversity, covering different neighbourhoods and welfare levels (for detailes,
see: Schotte 2019; Zizzamia 2020). The study used a combination of focus group discussions (FGDs)
and individual, in-depth life-history interviews (LHIs). Both research elements involved wealth ranking
exercises: as part of the FDGs, four welfare levels—ranked from four (lowest) to one (highest)—were
endogenously defined within the local township context. The LHIs traced fluctuations in well-being
on this four-point scale over respondents’ lifetime, and linked these fluctuations to their determinants.
While there was some common understanding of the established welfare levels, subjective perceptions
regarding the own capabilities and position in society also played a role in the individual rankings. For
this reason, the approach is well-suited to trace individual shocks and changes to well-being, while
comparisons of levels of well-being across individuals must be treated with caution.6
For the extension study, the LHI respondents were recontacted in early June 2020. Out of 31 original
respondents, 11 could not be reached, one was deceased, five refused to be re-interviewed and 14 agreed
to participate in this research. To improve the representation of the young population in Khayelitsha and
5 Established in the early 1980s, Khayelitsha has been growing rapidly, driven by endogenous population growth and con-
tinuing rural-to-urban migration, mainly originating from the Eastern Cape. The township comprises old formal areas built
originally by the apartheid government, which are generally wealthier, and newer areas that contain a mix of government-
provided housing, informal backyard dwellings, and densely populated informal settlements with limited sanitation infrastruc-
ture. According to the 2011 Census, 74 per cent of the township population had a monthly household income below ZAR3,200
(equivalent to US$2.1 per person per day in a household of three), thus being considered poor by national and international
standards.
6 Across FGDs, participants emphasized a clear distinction between levels one and two, on the one hand, and levels three and
four, on the other, with the latter showing clear markers of poverty: those on level three were characterized as having their
most elementary needs (e.g. food and electricity) satisfied, but still needing to economize a lot. All income is used to satisfy
other basic needs, without being able to build up a financial cushion to buffer economic shocks. In comparison, those on level
four showed markers of food poverty, being repeatedly characterized as “going to sleep on an empty stomach”.
5increase our sample size, one additional respondent—a young male—was added from the 2017 sampling
frame.7
Figure 2 illustrates the timing of the data collection in the extension study. The first round of interviews
was conducted from 11 June to 7 July 2020 (alert level 3), and the second round from 28 August to 24
September 2020 (alert levels 2/1).8 The first interview round included a set of retrospective questions
to establish how the participants’ overall life circumstances had evolved between our last visit in 2017
and February 2020, before the pandemic had reached South Africa. The remainder of the interviews
focused on how the participants’ situation had changed since the onset of the pandemic up to the time
of the interview, including probing questions regarding their household’s ability to buy essential goods,
changes in their own and close family members’ employment situation, and the schooling situation of
children in the household. Respondents were also asked about their opinions regarding the implemented
government response measures and, in the second round, the relaxation of the same.
Figure 2: Timeline
Source: authors’ graphical presentation.
As part of the interviews, respondents were asked to rank their welfare levels in February, June, and
September 2020, using the same four-level welfare scale originally established in 2017. This allowed us
to identify shifts in welfare—both in terms of the initial shock as well as the subsequent recovery—and
relate these to the COVID-19 economic shock. Each interview round was coded and analysed using a
thematic approach, following a similar methodology as proposed by Nyashanu et al. (2020).9
To supplement the evidence gathered, two key informant interviews were conducted after participant
interviews had been completed. These were designed to provide background information on two broader
changes in the township environment attributable to the pandemic, which were brought up as relevant by
some of the interviewees: first, the emergence of new informal settlements in Khayelitsha; and second,
changes in the occurrence of violence and crime.
7 While no LHI had been conducted with the respondent, extensive background information was available from a structured
survey administered in 2017. A consequence of this late inclusion is, however, that we do not observe the pre-2020 life-course
trajectory as we do for the other 14 respondents.
8 For simplicity, in the remainder of this paper we refer to the two interview periods as June and September 2020.
9 Interviews took 35 minutes on average and were conducted in respondents’ native language (isiXhosa) by a skilled and
experienced interviewer who had been part of the original research. All interviews were audio recorded and subsequently
translated and transcribed into English. The transcripts were entered into NVivo for organization and to facilitate the analysis.
Transcripts were read repeatedly by both lead researchers to gain a first understanding of respondents’ experiences and liveli-
hood dynamics during the pandemic. Pertinent sections of the interviews were clustered together into themes. Some of these
themes were defined ex ante by the topics that the interviewer was instructed to cover, while others emerged organically from
unanticipated topics which interviewees brought up as relevant. Within each theme. comparisons were then made across the
body of interviews to identify recurring accounts, as well as relevant discrepancies. Each round of interviews was first analysed
independently, before comparing and relating themes across the two rounds in a final step of analysis.
63.2 Quantitative data
Preceding the qualitative analysis, to contextualize individual accounts and provide a broader per-
spective, we present a snapshot of the nationwide dynamics observed using quantitative data. The
panel data are derived from the National Income Dynamics Study: Coronavirus Rapid Mobile Survey
(NIDS-CRAM 2020a, 2020b) as well as earlier waves of NIDS collected prior to the pandemic (NIDS
2017).
The NIDS-CRAM study—run by researchers from the University of Stellenbosch, University of Cape
Town, and University of the Witwatersrand—has facilitated reliable assessments of the economic, health,
and social impacts of COVID-19. The panel study allows assessing how livelihoods and labour market
outcomes across South Africa have changed over the course of 2020, using a combination of repeated
interview rounds and retrospective questions.10 Three NIDS-CRAM waves are available. The first
wave was administered between 7 May and 27 June and asked retrospective questions about February
(pre-lockdown), April (alert level 5), and the last seven days (alert levels 4/3). The second wave was
administered between 13 July and 13 August 2020 (alert level 3), including retrospective questions
about June (alert level 3). The third wave was administered in October 2020. Our analysis focuses on
the first two waves, for which the timing coincides with our qualitative data collection (see Figure 2
above).
4 The economic impact of the pandemic: a quantitative snapshot
This section presents evidence on the immediate economic impact of the COVID-19 pandemic on house-
holds in South Africa. First, we assess the magnitude of the initial shock to household expenditure and
discuss potential implications for poverty and food insecurity. Second, we check for heterogeneity in
the experience of the shock and link this assessment to pre-existing markers of vulnerability. Third, we
provide evidence on the extent of economic recovery in the early post-lockdown period.
4.1 Immediate shock of the COVID-19 pandemic
Prior to the COVID-19 pandemic, in 2017, 46 per cent of NIDS-CRAM respondents were poor by
national standards. That is, they were lacking the financial means to cover basic needs. Moreover, 19
per cent were food-insecure. That is, their household would have been unable to purchase sufficient food
to fulfil caloric requirements, even if all expenditure was dedicated to food (Figure 3a).11
Figure 3b presents three indicators of economic distress experienced in the early phases of the pandemic.
Firstly, 40 per cent of NIDS-CRAM respondents reported that their household had lost its main source
of income between the start of the lockdown on 27 March and April 2020. While some of these losses
may be due to factors unrelated to COVID-19, given the timing and the magnitude of the effect, it seems
reasonable to assume a direct link in the majority of cases. Secondly, 47 per cent of respondents said
that their household ran out of money to buy food in the month of April. This presents a substantial rise
compared to pre-COVID outcomes. According to estimates by van der Berg et al. (2020) drawing on data
10 The NIDS-CRAM sample is a representative sub-sample of the most recent wave of the NIDS panel survey collected in
2017, which itself is broadly nationally representative of South Africa’s adult population in 2017 (Kerr et al. 2020), following
the same individuals over time since 2008.
11 Drawing on the definitions used by Statistics South Africa’s (Stats SA), households with a per capita expenditure below the
upper bound poverty line, set at ZAR1,136 per person per month in March 2017 Rands (equivalent to US$2.2 per person per
day), are classified as poor. Household with a per capita expenditure below the food poverty line, set at ZAR515 (equivalent
to US$1 per person per day), are classified as food-poor (Stats SA 2017).
7from the General Household Survey, back in 2018 a much smaller share of 25 per cent reported running
out of money for food at any point in the past year, a far less demanding criterion. The experience
of running out of money to buy food is likely conditioned by usual consumption patterns. While it
signals severe financial pressure, it may not always translate into food insecurity (i.e. ‘going hungry’).
This is, households may still be able to find ways to put food on the table, for example, by opting for
less expensive foods, through support provided by social networks or (non-)government programmes,
drawing down savings, or borrowing (van der Berg et al. 2020). Nonetheless, as the third indicator
shows, 24 per cent reported that at least one household member went hungry in May or June 2020. While
not directly comparable to the expenditure-based measures of food poverty presented in Figure 3a, this
points to a likely rise in the incidence of food insecurity in the early phases of the pandemic.
Figure 3: Event prevalence
Note: estimates for weighted NIDS-CRAM adult population. Poverty status in 2017 is defined based on household per capita
expenditure in relation to national upper-bound and food poverty lines. HH abbreviates household.
Source: authors’ compilation based on NIDS wave 5 and NIDS-CRAM wave 1.
4.2 Vulnerability factors and heterogeneity in the shock experience
Respondents who had been poor in 2017 were more likely to report economic distress in 2020 (see
Figure 4). This is expected, as households with insufficient means to cover basic needs are hardly able
to build up a financial cushion to buffer economic shocks. However, as Figure 4 shows, a substantial
share of respondents who had been non-poor in 2017 was also vulnerable to the pandemic shock.
8Figure 4: Event prevalence by poverty status in 2017
Note: estimates for weighted NIDS-CRAM adult population with 95% confidence intervals. Poverty status in 2017 is defined
based on household per capita expenditure in relation to national upper-bound and food poverty lines. HH abbreviates
household.
Source: authors’ compilation based on NIDS wave 5 and NIDS-CRAM wave 1.
Given the patterns observed in Figure 4, Table 1 explores discrepancies in the incidence of economic
distress experienced prior- and post-COVID-19 by different population groups. In 2017, the incidence
of poverty, especially food poverty, was substantially higher among respondents in rural compared to
urban areas. This geographic gap is remarkably less pronounced in the outcome measures for 2020.
Importantly, respondents living in informal housing, concentrated in urban peripheral areas, showed the
highest incidence of financial distress since the start of the lockdown—with 50 per cent reporting losing
their main source of income, 65 per cent running out of money for food, and 36 per cent going hungry.
Moreover, while labour earnings and remittances shielded respondents against poverty in 2017, these
income sources were at highest risk to be lost during the lockdown.
9Table 1: Event prevalence by individual characteristics
2017 2020
HH lost main
source of Any HH
income since HH ran out member
lockdown of money to went hungry
HH was HH was started in buy food in in last 7 days
poor food-poor March April (May/June)
Total 46.2 % 18.9 % 40.0 % 47.0 % 24.0 %
By location
Rural 58.4 % 28.2 % 43.0 % 51.7 % 31.3 %
Urban 43.6 % 16.9 % 39.3 % 46.0 % 22.4 %
Ratio rural/urban 1.3 1.7 1.1 1.1 1.4
By housing type
A house or flat 42.0 % 15.7 % 38.5 % 44.4 % 21.1 %
A traditional house 75.1 % 45.4 % 43.2 % 51.4 % 35.6 %
An informal house 56.9 % 22.3 % 50.4 % 65.1 % 36.2 %
Ratio traditional/informal 1.3 2.0 0.9 0.8 1.0
By main income source
Labour 35.5 % 11.9 % 43.5 % 40.4 % 17.7 %
Government grant 64.2 % 30.4 % 33.4 % 56.1 % 31.5 %
Remittances 46.0 % 17.2 % 47.0 % 55.0 % 32.8 %
Other 27.9 % 9.0 % 27.9 % 28.1 % 15.9 %
Ratio grants/labour 1.8 2.6 0.8 1.4 1.8
Ratio grants/remittances 1.4 1.8 0.7 1.0 1.0
Note: estimates for weighted NIDS-CRAM adult population. HH abbreviates household.
Source: authors’ calculations using NIDS wave 5 and NIDS-CRAM wave 1.
The profiles of those who came under economic distress since the onset the COVID-19 pandemic thus
differ in key respects from those who had experienced poverty previously. They are considerably more
urban, often located in informal urban settlements, and more reliant on labour earnings as their main
source of income. However, we may expect that many of those who newly experienced financial distress
in 2020 had previously been on the brink of poverty. That is, despite being able to cover basic needs in
2017, they faced a higher risk of falling into poverty in the event of economic shocks.
To investigate this, we need a measure of vulnerability that has more structural signal than previously re-
alized expenditure levels alone. The availability of panel data spanning the pre- and post-COVID period
provides a unique opportunity in this regard. It allows us to investigate the individual- and household-
level characteristics that conditioned poverty entries and exits prior to the pandemic, and use these to
assess the ex-ante vulnerability to poverty among NIDS-CRAM respondents.12 On this basis, we can
divide the NIDS-CRAM sample into five social strata, using the multilayered stratification schema sug-
gested by Schotte et al. (2018). The approach starts from a standard division of the sample into three
main classes based on monetary thresholds: the poor, the middle class, and the elite.13 Among the poor,
we then distinguish those with below average chances of exiting poverty and thus a comparatively high
12 The modelling approach and its applications to NIDS data are described in detail by Schotte et al. (2018) and Zizzamia et
al. (2019), to which we refer interested readers.
13 As before, respondents are classified as poor in 2017 if their household per capita expenditure fell below the national upper-
bound poverty line. In addition, we define the elite as those with per capita expenditures well above the national average, fixing
the elite threshold at two standard deviations above the mean (Schotte et al. 2018).
10ex-ante risk of poverty persistence—the chronic poor—from those with above average chances of mak-
ing it out of poverty—the transient poor. Analogously, among the middle class, we distinguish those
who face an above average ex-ante risk of slipping into poverty—the vulnerable—from the more eco-
nomically stable and secure ‘true’ middle class. The poverty risk scores underlying this classification
are calculated based on pre-COVID characteristics recorded in 2017.
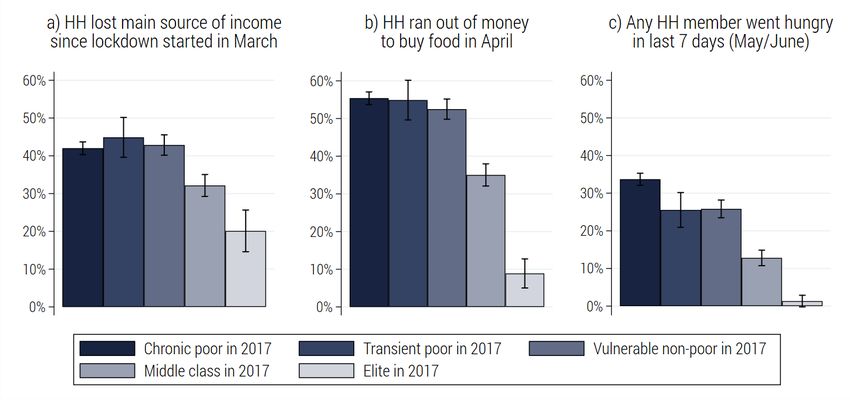
Figure 5 illustrates the results. We find that economic distress since the onset of the COVID-19 pandemic
was experienced by respondents across the income range. However, with respect to all three indicators,
the incidence is significantly lower among those who had previously been considered as stably middle
class or elite. In contrast, the transient poor and the vulnerable non-poor faced the highest risk of job
loss, were similarly exposed to severe financial pressures as the chronic poor, and experienced elevated
levels of food insecurity. Analysing the pandemic impact, it is important to understand that the transient
poor and the vulnerable non-poor share a number of structural commonalities, which are masked by
their static division along the poverty line. Both are in a position of economic insecurity and instability,
which primarily derive from their volatile position in the labour market. Respondents who were more
resilient to the shock (i.e. the middle class and elite) were more likely to be formally employed ex-
ante, with a permanent work contract and union coverage. By contrast, the transient poor and the
vulnerable were more likely to be in unstable and informal employment relationships, and a larger share
was either unemployed or economically inactive prior to the pandemic (Schotte et al. 2018; Zizzamia et
al. 2019).
Figure 5: Event prevalence by economic class in 2017
Note: estimates for weighted NIDS-CRAM adult population with 95% confidence intervals. Class categories based on Schotte
et al. (2018); Zizzamia et al. (2019). HH abbreviates household.
Source: authors’ compilation based on NIDS waves 1–5 and NIDS-CRAM wave 1.
Our findings align with other studies identifying precarious forms of work as key indicators of pre-
existing vulnerabilities that materialized during the COVID-19 crisis. For example, using NIDS-CRAM
data, Espi et al. (2020), Jain et al. (2020b), and Ranchhod and Daniels (2020a) show that job losses
were more severe for those in the informal sector, for unregulated workers within the formal sector, and
for those with a historically weak attachment to the labour market. These job losses often resulted in a
descent into poverty (Jain et al. 2020a).
Similar findings were obtained by studies conducted in other sub-Saharan African countries. For exam-
ple, Lakuma and Nathan (2020) find that micro and small enterprises in Uganda experienced a larger
decline in activity during the lockdown than medium and large enterprises. Similarly, real-time survey
data collected in Senegal, Mali, and Burkina Faso suggest that informal workers faced higher risk dur-
11ing the pandemic, as they generally rely on daily sales for their earnings, lack mechanisms for collective
bargaining, and tend to be in activities that are contact intensive—such as restaurants, tourism, small
retail shops, hairdressers, and taxi drivers—and thus particularly affected by government response mea-
sures (Balde et al. 2020). This is confirmed by Schotte et al. (2021), who detect a persistent nationwide
impact of the COVID-19 pandemic on labour market outcomes in Ghana, particularly jeopardizing the
livelihoods of small business owners operating in the informal economy.
4.3 Early signs of recovery from the shock
Figure 6 gives an indication of the extent to which economic pressures on South African households have
eased since the most rigid lockdown restrictions were lifted and grant relief measures came into effect
(see Section 2). We find that, between April and June 2020, the average share running out of money to
buy food dropped by ten percentage points. Importantly, it was not necessarily the same respondents
who reported experiencing this event. Out of those who had run out of money to buy food in April, 43
per cent said they were able to cover their food expenditures in June. This may be attributable to a rise
in available economic resources, but could also be explained by adjustments in consumption patterns or
support received through social networks. At the same time, out of those who had been able to cover
their food needs in April, 19 per cent reported running out of money for food in June (Figure 6a).
Matching these patterns, the incidence of hunger was six percentage points lower in July/August com-
pared to May/June 2020 (Figure 6b). Again, we observe substantial fluctuation in the respondents
who report this event. Out of those living in households where at least one member had gone hun-
gry in May/June, 52 per cent did not report hunger in July/August. At the same time, nine per cent
of respondents who had not experienced hunger in the household in May/June reported hunger in
July/August.
Figure 6: Changes in event prevalence
Note: estimates for weighted NIDS-CRAM adult population. HH abbreviates household.
Source: authors’ compilation based on NIDS wave 5 and NIDS-CRAM wave 1 and wave 2.
On the one hand, these findings indicate a moderate recovery in household economic welfare in the
second half of 2020. On the other hand, our findings also suggest that some households that appeared
to be able to buffer the immediate shock had subsequently succumbed to the economic pressure in later
periods. Both these observations resonate with the findings by other studies using NIDS-CRAM data
(Jain et al. 2020b; Köhler and Bhorat 2020; Ranchhod and Daniels 2020b).
125 The impact of the pandemic on livelihoods: a deep qualitative assessment
As Section 4 has shown, the COVID-19 pandemic and related policy measures—particularly through the
immediate shock to labour markets—had important implications for household welfare. Our qualitative
evidence confirms this. Figure 7 gives an overview of the perceived livelihood dynamics reported by
respondents (see Section 3.1 on how these are derived and interpreted).
Figure 7: Patterns of livelihood dynamics
Note: respondents were assigned numbers to anonymize data. R = respondent, f = female, m = male.
Source: authors’ graphical presentation based on qualitative research data.
Out of 15 participants, 14 reported having experienced a decline in household welfare between February
and June 2020 (Figure 7). Among these 14, only one (R5) saw no change in labour earnings (being
a public school teacher) but instead reported a fall in rental income as her tenant had lost her job at a
hotel and left the city. In the remaining 13 cases, a decline in labour income was experienced either by
respondents themselves, a household member, or a family member who had been supporting the house-
hold financially. Almost all (11/13) explicitly identified this negative labour market event as the driver
of downward mobility between February and June. In the one case where no decline was experienced
(R9), both household members were elderly and relied exclusively on the old-age pension grant.
13The patterns observed during the second study period from June to August 2020 are remarkably more
mixed: 4/15 reported a continued but attenuated deterioration in welfare (R1–R4), 5/15 a stagnation
(R5–R9), and 6/15 saw a full or partial recovery (R10–R15) (see Figure 7). This recovery was mainly
facilitated by respondents being able to return to work, as discussed in the next subsection.
Interestingly, we find no strong connection between the respondents’ pre-COVID welfare trajectories,
and the magnitude of the initial COVID-shock and near-term recovery. That is, respondents who experi-
enced higher volatility or downward mobility over their life course were not consistently more vulnerable
to the crisis. The impact mainly depended on their economic situation just before the crisis, especially
with regard to the sources of household income, attachment to the labour market, number of dependents,
and the existence of savings or other assets to buffer economic losses.
5.1 Economic losses in the labour market
Overall, in our sample, the labour market shock affected a population which does not have a particu-
larly strong attachment to the formal wage labour market, but who nevertheless remain heavily reliant
on labour income—often derived from informal work and generally shared within extended support
networks. In line with the quantitative evidence (Jain et al. 2020b), we find that a more robust labour
market recovery was experienced by those who had maintained an active employment relationship over
the lockdown—especially if this employment relationship was formal. However, as formal sector busi-
nesses were also affected by government regulations and the overall drop in demand, even formal jobs
were not necessarily secure and, in instances, experienced a partial informalization.
Out of four respondents (R5, R11, R13, R15) who had been in formal wage employment prior to the
pandemic, only one (R5) saw no change in labour earnings. As a government employed primary school
teacher, her salary remained unchanged even when schools were closed. Another respondent (R11),
an essential supermarket worker, continued working throughout the lockdown. Nonetheless, he expe-
rienced a decline in earnings due to shorter opening hours and shift-work schedules. The other two
respondents were on unpaid leave during the lockdown. Only one of them (R15) had received UIF
payments in the interim, after substantial delays, while the other was ineligible because of insufficient
tenure. By September, both had resumed work.
Even though all four formal wage employees were able to resume work in the post-lockdown period,
the pandemic did not leave these jobs unaffected. For example, R15 explained that the company he was
working for was experiencing severe financial difficulties since the onset of the pandemic and stated:
“I am noticing that after this coronavirus things are not stable [at the firm]. Even the bosses look weak
now because there are rumors that the company may be closed.” He also reported an informalization
of his previously formal employment relationship. Talking about himself and his coworkers, he said:
“We have just been de-registered from BIBC [Building Industry Bargaining Council] and there won’t
be any deductions now. You will be given your money and save it yourself. That is what worries me
now.”14 Increased job instability and the demotion of employee relationships left workers more vulner-
able to future shocks (see Section 5.2) and contributed an overall feeling of insecurity and consequent
psychological distress (see Section 5.3).
Those in informal work were yet more vulnerable to the labour market shock. Among the two respon-
dents (R7, R12) who had been in informal wage employment prior to the pandemic, R12 was able to
continue working at reduced hours during the lockdown. By September, she was still working a reduced
14 TheBuilding Industry Bargaining Council negotiates the terms of employment for the industry and administers the industry
pension, provident, medical aid, sick and holiday funds.
14number of days. The other, R7, had been laid off during the lockdown.15 Moreover, all four respondents
(R2, R4, R8, R10) who had been running informal enterprises prior to the pandemic had either termi-
nated or scaled back their activity by June, and only one (R10) had resumed operating at pre-lockdown
capacity by September. Respondents mentioned three main reasons to explain this break in business
activity: lockdown regulations, challenges in transportation and in procuring stock, and a fall in demand
as usual customers stayed away out of fear or because they themselves had been affected financially.
Regarding the latter, one of our key informants emphasized the interdependence between formal and
informal sector activities, arguing that informal businesses rely on the spending of those with incomes
from the formal economy—using his example: selling snacks on trains or at stations is not possible if
nobody is going to work. A recovery in the informal economy will thus depend on a prior recovery in
the formal labour market.
The shock to the labour market was even felt by those who were unemployed or outside of the labour
force. Four non-working sample members (R1, R3, R6, R14) reported in June that they no longer re-
ceived the same support from family members as before the pandemic, because their benefactors had lost
jobs or earnings. This highlights the importance of labour income in sustaining much broader networks
of support and informal insurance than a worker’s immediate household, and the vulnerability of this
mechanism of support and insurance to large, covariate labour market shocks (see Section 5.2).
Eventually, it is worth reflecting on the implications of the COVID-19 labour market shock on how
our sample members spoke about and valued informal earning opportunities. During the first phase
of the project in 2017, casual work and piece jobs were often not considered valuable or dignified by
respondents. They were characteristic of those who had to make ends meet, often referred to as an
indicator of belonging to ‘box 4’, the lowest socio-economic level in our schema. They were considered
‘second best’ options and as a way of ‘making do’ when times were tough. However, the lockdown
exposed how important these often volatile and comparatively undesirable jobs had been in sustaining
the livelihoods of those struggling to keep their heads above water. For example, one of the respondents
(R3), who used to rely on financial support from her children, reported slipping into deep poverty when
her daughter, who used to do piece work at a restaurant in Cape Town, was laid off at the beginning of
the lockdown. She had little hope for her daughter to resume work in the near future and also could not
draw on other informal support networks, saying “times are tough for everyone and everyone is stranded
with no way to hustle.” The lesson from this is both obvious and important—while the poor do not
cast a fond or aspirational gaze upon survivalist livelihood strategies, the availability of these strategies
remains an essential means of survival for South Africa’s poor. This view was shared by a key informant,
who claimed that “a lot of guys are in the informal sector, working piece jobs. [Now that] they don’t
have them, we have seen the value of [these jobs].”
5.2 Amplified vulnerabilities, risk factors, and resilience
As described in Sections 4.2 and 5.1, the shock of the pandemic exposed and deepened vulnerabilities
in the labour market. Going beyond these findings, our qualitative interviews highlight three additional
dimensions of amplified vulnerabilities and emerging risk factors. First, households with limited assets
to withstand a sudden economic loss responded to the crisis by running down savings and defaulting
on insurance payments, leaving them yet more vulnerable to future economic shocks. Second, school
closures posed a double burden to children from socio-economically disadvantaged backgrounds. The
absence of meals provided at schools posed risks exacerbating food insecurity; and many were lacking
the basic infrastructure to continue remote learning, reducing their chances of educational attainment and
future upward social mobility. Third, new risk factors emerged. New informal settlements mushroomed
15 While R7 did resume work following the relaxation of lockdown measures, health problems related to diabetes forced her
to stop working shortly after returning. She did not receive any compensation for the time that she was not working, neither
during the lockdown nor afterwards.
15in the shadow of the lockdown, which may exacerbate health risks and fuel social unrest. In addition, the
economic downturn appears to have been accompanied by a surge in opportunistic criminality as well as
organized crime. Local businesses and community institutions became targets of the latter, hampering
prospects for development.
Social security mechanisms
The success with which households were able to withstand the pandemic shock depended largely on
their ability to access formal or informal systems of social protection.
In face of the COVID-19 labour market shock, government grants provided an essential, stable stream
of income. At least 11/15 interviewees reported living in households with access to grant income. For
these households, the top-up to government grants, issued from May 2020 onward, provided some buffer
to the negative income shocks they experienced. In many cases, respondents and their households relied
primarily or even exclusively on social grants when labour incomes collapsed, and would have been
left destitute in their absence. However, many also complained that the top-up was insufficient, given
the economic challenges they faced, including rising prices for basic items (e.g., R1 said: “Things have
gone from bad to worse because I survive only on this social grant with three other people depending
on it. My children have not received jobs yet.”). While in most cases the grant income was used to
cover immediate consumption needs, we also found evidence of social grants being used as strategies
for accumulation and insurance. In several cases (R2, R4, R9, R14), grants were used to invest in durable
assets (like housing repairs or improvements) or as start-up capital for survivalist enterprises once the
economy had started re-opening in September.
In addition to public social welfare schemes, informal insurance mechanisms can provide protection
against the impact of economic shocks and earnings volatility. While the COVID-19 pandemic has
delivered such a shock, it undermined at the same time the present and future effectiveness of these
mechanisms. A strong example of this effect was given by one respondent (R11), who (together with
his wife) had been contributing to a stokvel—a rotating savings and credit association—prior to the
pandemic.16 R11 continued to work during the lockdown, though at reduced hours, and was worried
that his household or other members of the group would fail to pay their contributions, saying: “Now we
are not sure whether to continue [contributing] because of the current situation. There are [other stokvel
members] who work at a coffee shop [...] so they stopped working during the lockdown. [...] So it is
going to be difficult to fork out ZAR1,500 [semi-annual contribution].” This account is symptomatic of
informal financial instruments being effective in managing idiosyncratic risks—affecting individuals or
groups of individuals—while being less effective at dealing with large covariate shocks—simultaneously
affecting entire communities (Dercon 2002).
To buffer the loss in household income, several of our respondents were forced to run down savings
and/or to default on policy and insurance payments, leaving them vulnerable to future shocks—including
the health risks posed by the pandemic. To give an example, one respondent (R10) said: “Economically
and health-wise I am worried because if anything would happen I don’t know where I would go or
where to start. [...] Like if any of my family members were to die I am not sure how I would bury them
because I am not working and my policies lapsed ever since I stopped.” In this case, the relative stability
in observable living standards (see Figure 7) masks the increase in underlying economic vulnerability
that this respondent and similar people are exposed to. In short, cutting back on savings and insurances
to meet basic needs in the present may risk potential ruin in the future. Moreover, it may also block
avenues of social upward mobility, as the example of a young male respondent (R13) illustrates. Before
the pandemic hit and he was temporarily laid-off from work, he had been saving money to acquire a
16 Stokvels are common group savings schemes in South Africa, primarily used by low to middle income earners in urban
areas as a saving and informal social security mechanism.
16You can also read