COVID-19 Is Also a Reallocation Shock - Jose Maria Barrero, Nick Bloom, and Steven J. Davis - Becker Friedman ...
←
→
Page content transcription
If your browser does not render page correctly, please read the page content below
WORKING PAPER · NO. 2020-59

COVID-19 Is Also a Reallocation Shock
Jose Maria Barrero, Nick Bloom, and Steven J. Davis
MAY 2020

                                                      5757 S. University Ave.
                                                          Chicago, IL 60637
                                                         Main: 773.702.5599
                                                           bfi.uchicago.edu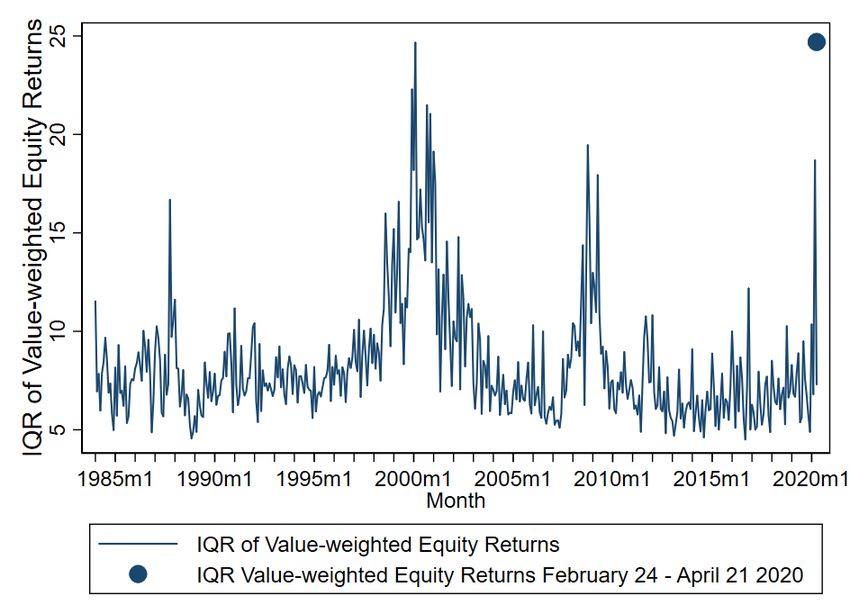
COVID-19 Is Also a Reallocation Shock

                  Jose Maria Barrero, Nick Bloom and Steven J. Davis

                                           5 May 2020

                                            Abstract

Drawing on firm-level expectations at a one-year forecast horizon in the Survey of Business
Uncertainty (SBU), we construct novel, forward-looking reallocation measures for jobs and sales.
These measures rise sharply after February 2020, reaching rates in April that are 2.4 (3.9) times
the pre-COVID average for jobs (sales). We also draw on special questions in the April SBU to
quantify the near-term impact of the COVID-19 shock on business staffing. We find 3 new hires
for every 10 layoffs caused by the shock and estimate that 42 percent of recent layoffs will result
in permanent job loss. Our survey evidence aligns well with anecdotal evidence of large pandemic-
induced demand increases at some firms, with contemporaneous evidence on gross business
formation, and with a sharp pandemic-induced rise in equity return dispersion across firms. After
developing the evidence, we consider implications of our evidence for the economic outlook and
for policy responses to the pandemic. Unemployment benefit levels that exceed worker earnings,
policies that subsidize employee retention, occupational licensing restrictions, and regulatory
barriers to business formation will impede reallocation responses to the COVID-19 shock.

JEL Numbers: D22, D84, E24, H12, H25, J21, J62, J63, J65

Keywords: COVID-19, coronavirus, reallocation shock, Survey of Business Uncertainty,
CARES Act

Acknowledgements: We thank the Federal Reserve Bank of Atlanta, the Sloan Foundation, and
the University of Chicago Booth School of Business for financial support.
The COVID-19 pandemic and efforts to contain the virus are exacting a staggering economic
toll in countries around the world. China’s economy shrank 6.8 percent in the first quarter of
2020 on a year-on-year basis, and Eurozone economies shrank at a14.8 percent annualized rate.
In the United States, nearly 28 million persons filed new claims for unemployment benefits over
the six-week period ending April 25.1 The U.S. economy shrank at an annualized rate of 4.8
percent in the first quarter of 2020, and many analysts project it will shrink at a rate of 25% or
more in the second quarter.2 Yet, even as much of the economy is shuttered, some firms are
expanding in response to pandemic-induced demand shifts. As noted in a recent Wall Street
Journal article, “The coronavirus pandemic is forcing the fastest reallocation of labor since
World War II, with companies and governments mobilizing an army of idled workers into new
activities that are urgently needed.”3 In other words, Covid-19 is also a major reallocation shock.
We develop evidence on the extent and character of this reallocation shock for the U.S.
economy. We start with anecdotal evidence, drawing on news reports and other sources.
Anecdotal evidence is useful for its immediacy, as a source of hypotheses, and for insights into
broader forces. Next, we turn to the Survey of Business Uncertainty (SBU) to construct novel,
forward-looking measures of expected sales and job reallocation across American firms at a one-
year look-ahead horizon. The SBU is a monthly panel survey developed and fielded by the
Federal Reserve Bank of Atlanta in cooperation with Chicago Booth and Stanford.
We use firm-level employment forecasts in the SBU to calculate the following quantity: the
gross expected job gains at firms that anticipate growing over the next year plus the gross
expected job losses at firms that anticipate shrinking minus the absolute value of the net change
obtained by summing over all the forecasts. We activity weight the firm-level forecasts in this
calculation and divide by aggregate employment to obtain the expected excess job reallocation
rate at a one-year look-ahead horizon. This statistic quantifies the volume of cross-firm job
reallocation in excess of the amount needed to accommodate the aggregate net change. It is the
1
The unemployment claims data are available at https://oui.doleta.gov/unemploy/claims_arch.asp.
2
As of 31 March, Goldman Sachs projects that U.S. GDP will fall 34 percent (annualized) in the second
quarter of 2020 (Carew, 2020). Baker, Bloom, Davis and Terry (2020) obtain a similar figure using the
estimates implied by an empirical model of disaster effects that Baker, Bloom and Terry (2020) fit to
historical data for 38 countries. According to Blue Chip Economic Indicators report of 10 April 2020, the
mean forecast for U.S. GDP is a 24.5 percent (annualized) drop in the second quarter of 2020.
3
The quotation is from Bender and Dalton (2020).
1forward-looking analog to the backward-looking measures of excess job reallocation examined
in Dunne, Roberts and Samuelson (1989) and Davis and Haltiwanger (1992).4
Our measure of the expected excess job reallocation rate rises from 1.5 percent of
employment in January 2020 to 5.4 percent in April. The April value is 2.4 times the pre-COVID
average and is, by far, the highest value in the short history of the series. We also use firm-level
sales forecasts in the SBU to compute the expected excess sales reallocation rate at a one-year
forecast horizon. Expected sales reallocation shows a similar time-series pattern, reaching values
in March and April that are four times the pre-pandemic average. Thus, our expected excess
reallocation rate measures support the view that COVID-19 is a major reallocation shock.
We also quantify the near-term reallocative impact of pandemic-related developments on
business staffing. For this purpose, we draw on two special questions fielded in the April 2020
SBU. One question asks (as of mid-April) about the coronavirus impact on own-company staffing
since 1 March 2020, and another asks about the anticipated impact over the ensuing four weeks.
Cumulating responses over firms and across these two questions, the data say that pandemic-
related developments caused near-term layoffs equal to 12.8 percent of March 1 employment and
new hires equal to 3.8 percent. In other words, the COVID-19 shock caused 3 new hires in the near
term for every 10 layoffs. These sizable new hires amidst a tremendous overall contraction align
well with our anecdotal evidence of large pandemic-induced increases in demand at certain firms.
Weekly statistics on gross business formation derived from U.S. administrative data also point to
creation and gross hiring activity, even in the near-term wake of the pandemic.
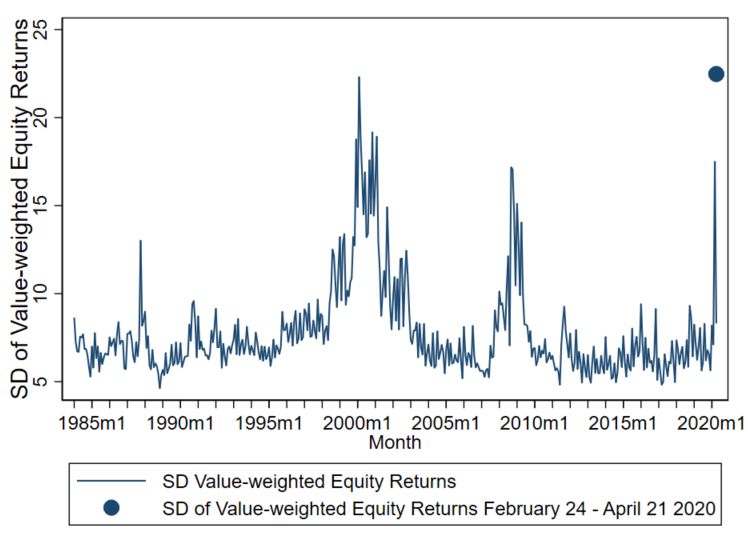
Next, we consider time-series evidence on the dispersion in monthly equity returns across
U.S.-listed firms. Return dispersion relates less directly to future reallocation activity, but its
availability over several decades helps us put the COVID-19 episode in perspective. Whether
measured by the interquartile range or the standard deviation of returns in the value-weighted
distribution, the dispersion in equity returns jumps sharply in March 2020, reaching levels last
4
Many later studies consider backward-looking job reallocation measures. See Davis and Haltiwanger
(1999) for a review. For applications of analogous backward-looking reallocation measures to other
outcomes, see Dell’Ariccia and Garibaldi (2005) and Craig and Haubrich (2013) on bank lending, Eisfeldt
and Rampini (2006) on physical capital, Davis et al. (2009) on sales, Broda and Weinstein (2010) on
consumer products, Iacovone and Jovorcik (2010) on export products, Herrera, Kolar and Minetti (2011)
on business credit, and Afonso and Lagos (2015) on the federal funds market.
2seen during the financial crisis of 2008-09 and the dot.com bust of the early 2000s. These three
episodes exhibit the highest return dispersion in our sample period, which starts in 1984.
After presenting the evidence, we consider implications for the economic outlook and for
policy responses to the pandemic. Even if medical advances or natural forces bring an early
resolution to the crisis, many pandemic-induced shifts in consumer demand and business
practices will persist. Thus, much of the near-term reallocative impact of the pandemic will also
persist, as indicated by our forward-looking reallocation measures. Drawing on our survey
evidence and historical evidence of how layoffs relate to recalls, we estimate that 42 percent of
recent pandemic-induced layoffs will result in permanent job loss. If the pandemic and partial
economic shutdown linger for many months, or if pandemics with serious health consequences
and high mortality rates become a recurring phenomenon, there will be profound, long-term
consequences for the reallocation of jobs, workers and capital across firms and locations.
Historically, creation responses to major reallocation shocks lag the destruction responses by
a year or more. Partly for this reason, we anticipate a drawn-out economic recovery from the
COVID-19 shock, even if the pandemic is largely controlled within a few months. Multiple
economic forces contribute to a delayed creation response, as we discuss. Policy responses to
major shocks and inherited features of the policy landscape can further stretch out the creation
response, slowing the recovery. In this regard, we discuss four aspects of U.S. policy that can
retard creation responses to the pandemic-induced reallocation shock: Unemployment benefit
levels that exceed earnings for many American workers under the Coronavirus Aid, Relief, and
Economic Security (CARES) Act, policies that subsidize employee retention irrespective of the
employer’s longer term outlook, occupational licensing restrictions the impede mobility across
occupations and states, and regulations that inhibit business formation and expansion.
I. Anecdotal Evidence
a. Hiring and job reallocation
Recent news stories highlight the millions of layoffs triggered by the pandemic and
lockdown. They also recount many examples of large-scale hiring. As of April 18, Walmart
hired 150,000 new employees in the span of a month and plans to hire 50,000 more (Nassauer,
2020). Likewise, Amazon hired 100,000 new employees in recent weeks and aims to hire
3another 75,000 (Koetsler, 2020). Dollar General plans to hire 50,000 new workers by the end of
April.5 Lowe’s, the home improvement chain, aims to hire 30,000 new employees this spring
(Tyko, 2020). As of late March, many takeout and delivery-oriented firms are scrambling to hire
workers. Instacart, for example, is adding 300,000 shoppers to its payroll, and Domino’s is
adding roughly 10,000 pizza delivery drivers (Bender and Dalton, 2020). Papa John’s plans to
hire 20,000 new employees to meet heightened demand for pizza delivery in the wake of the
pandemic (Bandolm, 2020). Outschool sought to hire 5,000 new teachers in the last two weeks of
March to offer more online classes in light of school closures.6
Some companies are forming partnerships that exploit the reallocative nature of the COVID-
19 shock to speed hiring. Supermarket chain Kroger created an exchange with Sodexo, Sysco
and Marriott International to hire workers laid off from food-service and hospitality firms. CVS
Healthcare is seeking to recruit 50,000 new staff by partnering with the Hilton hotel chain,
clothing retailer Gap, and Delta Airlines (Weber, 2020). Uber now lists job openings at 7-Eleven,
Amazon and McDonald’s and a dozen other companies for its unemployed drivers (Lee, 2020).
The near-term reallocative effects of the COVID-19 shock are also evident in consumer
spending patterns. The data analytics firm, Earnest Research, tracked credit card and debit card
purchases for nearly six million Americans to assess the impact of the COVID-19 shock on
consumer spending. For the week ending 1 April 2020, their data show that spending on airlines,
hotels, rental cars, taxis, ride sharing and movie theaters is down 75-95 percent relative to
spending in 2019 (Leatherby and Gelles, 2020). Spending on fast food, auto parts, and autos is
down 35 percent, and spending on apparel is down 70 percent. At the same time, spending on
home improvement, video streaming, gaming, food delivery, meal kits, and online grocers has
boomed. The bulk of these spending cuts and shifts will reverse when the pandemic recedes and
the lockdown ends, but some aspects of the shift are likely to persist.
5
See https://careers.dollargeneral.com. Accessed on 19 April 2020.
6
See https://blog.outschool.com/outschool-needs-5-000-teachers-to-start-offering-live-online-classes-
outschool-needs-5-000-teachers-to-start-offering-live-online-classes-in-the-next-2-weeks/. Accessed on
19 April 2020.
4b. Intra-Industry Reallocation
Perhaps because we often conceptualize the economy in terms of industries and regions,
one might guess that pandemic-induced reallocation will mainly involve cross-industry and
cross-region shifts. A large body of evidence suggests otherwise. Idiosyncratic, employer-
specific factors dominate gross job creation and destruction, while employment shifts between
industries and regions account for only a small share of excess job reallocation. For example,
when Davis and Haltiwanger (1992) split the U.S. manufacturing sector into about 450 four-digit
Standard Industrial Classifications, between-industry employment shifts account for only 13
percent of annual excess job reallocation during the 1970s and 1980s. When they split the
manufacturing sector into roughly a thousand groups defined by the cross product of states and
two-digit SICs, between-group shifts account for only 14 percent of excess job reallocation. This
type of finding has been replicated many times across countries, sectors and time periods.7
Hence, we expect the bulk of the pandemic-induced reallocation response to occur within
industries and regions.
The restaurant industry provides a salient example of intra-industry reallocation in the
current crisis. According to a survey conducted by the National Restaurant Association in late
March, 3 percent of restaurant owners and operators have permanently closed in response to
COVID-19, and another 11 percent anticipate permanently closing within the next 30 days
(Taylor, 2020). Applying these figures to the number of U.S. restaurants yields more than
100,000 permanent restaurant closures in the near-term wake of the COVID-19 shock. At the
same time, takeout and delivery-oriented chains are experiencing a huge demand boom, as
illustrated by the anecdotes for Domino’s Pizza and Papa John’s. Much of this immediate
reallocative impact will likely persist.
Turning to another salient example, an unsettled economy and uncertain outlook favor
large incumbents with deep pockets. As Cutter and Thomas (2020) write in the Wall Street
Journal: “The biggest players in tech are hoovering up talent in the midst of the coronavirus
pandemic. As some of Silicon Valley’s most-promising startups lay off workers and others
7
Davis and Haltiwanger (1999, Table 5) review evidence from studies that span thirteen countries.
Employment shifts between regions and industries account for less than 10 percent of excess job
reallocation in half the studies and 10 to 20 percent in the rest.
5freeze hiring, established companies including Apple Inc., Alphabet Inc.’s Google and
Amazon.com Inc. are pursuing software engineers, data scientists, product designers and others.
Facebook Inc. says usage has spiked during the coronavirus crisis and it is committed to policing
platforms ahead of the 2020 presidential election, so it will hire more than 10,000 people this
year for critical roles on its product and engineering teams. The current moment may give well-
capitalized tech companies a chance to poach skilled workers who until recently were gravitating
to smaller upstarts, veteran technology recruiters say.” These remarks suggest that the pandemic
will induce a reallocation from smaller, younger tech firms to larger, established ones. A similar
dynamic may play out in other industries as incumbents with deep pockets and established
markets attract workers with newly-heightened concerns about job security.
A third example highlights the role of new-found concerns about face-to-face interactions
as a driver of intra-industry reallocation. In a recent article in Medical Economics, a publication
aimed at healthcare professionals and business managers, Mann (2020) remarks that
telemedicine works “for most medication refills … urinary tract infections, colds and rashes,
diabetes and hypertension follow-ups, lab results, post-op visits, birth control and fertility, and
mental health.” Although a pandemic-induced shift to telemedicine may have little long-term
impact on the net demand for medical services, some physician practices and medical clinics will
respond adroitly to the shift, and many will not. Horn (2020) offers an insightful glimpse into the
commercial challenges presented by a partial shift to telemedicine. As his discussion suggests,
there is high potential for a large reallocation of customers, revenues and workers across
practices and clinics. A similar dynamic will play out in other professional, business, and
personal services: Some businesses will respond deftly to newly-intensified customer concerns
about face-to-face interactions, and many will not.
There are also well-documented examples of major past structural transformations that
took the form of intra-industry reallocation. Foster, Haltiwanger and Krizan (2006) attribute
large productivity gains in the U.S. retail sector in the 1990s mainly to a reallocation from small
retail outlets to larger, more productive stores operated by national chains. Walmart, Target,
Home Depot, Staples, Barnes & Noble and Best Buy played significant roles in this process,
expanding at the expense of rivals. Later, the rise of online shopping brought another major
reallocation. In this regard, it’s worth recalling that Amazon began as an online bookseller,
6eventually displacing rival booksellers who shifted online too little or too late. The coronavirus
pandemic is accelerating the shift to online shopping, as illustrated by some of our anecdotes.
II. Systematic Evidence
a. Constructing Forward-Looking Reallocation Measures
We construct forward-looking reallocation measures using data from the Survey of
Business Uncertainty (SBU), which samples senior executives in American firms at a monthly
frequency. The SBU covers all 50 states, every major nonfarm industry, and a range of firm sizes.
Core survey questions elicit subjective forecast distributions over own-firm future outcomes at a
one-year look-ahead horizon. (More precisely, the look-ahead horizon is twelve months for
employment and four quarters for sales.) The survey instrument also gathers data for current and
past outcomes. See Altig et al. (2020b) for more information.
Let E" #$,"&'( denote the expected level of employment in month ) + 12 at firm - implied
by its subjective forecast distribution at t. Define the corresponding month-t expected employment
growth rate at a 12-month look-ahead horizon as the arc percentage change,8
E" #$,"&'( − #$"
E" .$,"&'( = ,
0.54#$" + E" #$,"&'( 5
where all quantities on the right side derive from survey responses in month ). Denote the firm’s
activity weight as 7$" ≡ 0.54#$" + E" #$,"&'( 5 and the corresponding aggregate activity measure as
9" = ∑$ 7$" . Let ;"& and ;"< denote the sets of firms at ) with positive and negative values,
respectively, for E" .$,"&'( .
We compute the expected excess job reallocation rate in month t as
jobs 7$" 7$" 7$"
E" ="&'( = B C D E E" .$,"&'( E + B C D E" .$,"&'( − JB C D E" .$,"&'( J,
9" 9" 9"
$∈;GH I
$∈;G $
8
This growth rate measure is symmetric about zero, bounded between -2 and 2, and equal to log changes
up to a second-order Taylor series approximation. Growth rates computed in this manner aggregate exactly
when combined with suitable weights, given by the simple mean of initial and (expected) terminal levels.
This approach to growth rate measurement and aggregation has become standard in the literature on
business-level dynamics. See Davis and Haltiwanger (1999).
7where the first term on the right side is the expected gross job destruction rate over the 12-month
forecast horizon, the second term is the expected gross job creation rate, and the third term is the
absolute value of the expected net employment growth rate.9 We compute the expected excess
sales reallocation rate at a four-quarter forecast horizon in an analogous manner.10
Since we use SBU data to construct our forward-looking reallocation measures, we would
like some assurance that the underlying firm-level data contain meaningful forecasts. In this
regard, Altig et al. (2020b) and Barrero (2020) show that firm-level growth rate expectations in
the SBU data are highly predictive of realized growth rates. Using survey questions with the same
design as the SBU questions, a revision underway of Bloom et al. (2017) finds that plant-level
growth rate expectations in the Census Bureau’s Manufacturing and Organizational Practices
Survey are also highly predictive of realized outcomes. These studies give us confidence that our
forward-looking reallocation measures reflect meaningful forecasts of firm-level growth rates.
That said, there are good reasons to think that our SBU-derived measures understate the
expected reallocation rate on average, and that they also understate the rise in expected reallocation
activity in the wake of the coronavirus pandemic. First, the SBU under samples younger firms,
which have much higher reallocation rates than mature firms. See Altig et al. (2020b) for further
discussion of this point and references to the relevant literature. Second, highly stressed firms are
less likely to respond to surveys, which leads to an understatement of expected destruction
activity.11 Third, we cannot sample firms that will enter in the future, which leads to an
understatement of expected creation activity. Thus, we regard our estimates of forward-looking
reallocation rates as conservative in terms of both average levels and the pandemic-induced
response.
9
In practice, we winsorize the 7$" values at 500 and the E" .$,"&'( values at the 1st and 99th percentiles of
the distribution of expected employment growth rates in data pooled over the period from October 2014
to December 2018. These thresholds follow Altig et al. (2020b).
10
For sales, we winsorize 7$" at the 90th percentile of its distribution in the pooled sample from September
2016 to April 2020. We winsorize E" .$,"&'( at the 1st and 99th percentiles of the distribution of expected
sales growth rates in the pooled sample for the period from October 2014 to December 2018. See Altig et
al. (2020b) for an explanation of how we obtain arc percentage changes and implied levels of expected
future sales from SBU data on the forecast distribution over future sales growth rates.
11
In line with this remark, the survey response rates among active SBU panelists are 57% in January 2020
60% in February, 57% in March and 52% in April, where “active” panelists are those who responded to
the survey at least once in the previous six months.
8b. Expected Excess Reallocation Rates
Table 1 reports average expected growth rates and excess reallocation rates from
September 2016 to January 2020, before the Covid-19 pandemic impacted the U.S. economy.12
The expected excess reallocation rate averages 0.97 percent for sales and 2.23 percent for jobs.
Figure 1 displays the expected excess job reallocation rate from October 2016 to April
2020, alongside the expected employment growth rate for the same 12-month forecast horizon.
The expected excess reallocation rate rises from 1.54 percent in January 2020 to 5.39 percent in
April, which is 2.4 times the pre-COVID mean reported in Table 1. The upward jump from March
to April is the largest move in the short history of the series. Figure 2 shows a broadly similar
pattern for the expected sales reallocation rate, which jumps from 0.24 percent in January 2020 to
4.08 percent in March and 3.78 in April. These March and April values are also the highest in the
history of the series, and they are about four times the pre-COVID mean. In sum, our forward-
looking relocation measures confirm that the COVID-19 pandemic is a large reallocation shock.
Several other countries conduct surveys that could be used to construct forward-looking
reallocation measures like the ones shown in Figures 1 and 2. The U.K. Decision Maker Panel, a
monthly survey that began in August 2016, includes questions patterned after the ones in the SBU
(Bloom et al., 2018). Surveys in Germany, Italy and Japan also collect data on the expectations of
firm-level variables. See Guiso and Parigi (1999), Bachmann and Elstner (2015), Bachman et al.
(2018), Massenot and Pettinichi (2018), Tanaka et al. (2019) and Chen et al. (2019). Thus, it is
feasible to construct forward-looking excess reallocation time series for several countries, which
would be quite helpful in evaluating their predictive content and usefulness for policy makers.
c. Expected Growth Rates in the Wake of the Pandemic
Figures 1 and 2 also show the monthly paths of expected employment and sales growth
rates for the period covered by the SBU. Expected twelve-month employment growth fell about
2.2 percentage points from January to April 2020, and expected sales growth fell about 7.3
percentage points over the same period. While these statistics point to a sharp deterioration in the
U.S. economic outlook in the wake of the COVID-19 shock, they are milder than some projections.
12
The SBU first went to field in October 2014, but the early monthly samples were small and our
formulation of the look-ahead questions did not stabilize until September 2016.
9One possibility is that SBU firms expect a very large near-term hit from the pandemic and
lockdown in 2020 and a substantial, but partial recovery by April 2021.
To investigate that possibility, we turn to a special question fielded as part of the April
2020 SBU. The question reads as follows: “What is your best guess for the impact of coronavirus
developments on your firm’s sales revenue in 2020?” The response options are a respondent-
supplied percentage amount, up or down, and no effect. The results, summarized in Table 2, say
that firms expect the coronavirus pandemic to lower their sales by 18-19 percent in 2020. This is
an enormous negative shock, and it is more than twice as large as the fall from January to April
2020 in the average one-year sales forecast. Taken together, the evidence in Table 2 and Figure 2
says that firms in the SBU anticipate a huge negative shock to their sales in 2020 followed by a
considerable but highly incomplete bounce back by April 2021.
d. Gross Hiring and Business Formation in the Pandemic’s Immediate Wake
The top part of Table 3 presents two questions about the impact of COVID-19 on staffing
levels that appeared in the April 2020 SBU. One question asks about impact on own-company
staffing levels since 1 March 2020, and the other asks about the anticipated impact over the next
four weeks. For each question, the survey instrument allows responses in five categories: number
of permanent layoffs, with no expectation of recall; number of temporary layoffs and furloughs;
hires of new employees; cuts to the number of contractors and leased workers; and additions to
the number of contractors and leased workers. Cumulating the responses to these two questions
and aggregating over firms yields a near-term net contraction equal to 11.9 percent of March 1
employment.13 92 percent of this net contraction happened between March 1 and the mid-April
survey response period, and the rest is anticipated to happen over the ensuing four weeks.
Despite the large negative employment impact of the pandemic and lockdown over the
span of two-and-one-half months, the coronavirus shock also caused gross staffing gains: new
hires equal to 3.8 percent of March 1 employment, and new contractors and leased workers equal
13
Bartik et al. (2020) find a 40 percent employment contraction from 31 January to late March/early April
in their survey of American firms with fewer than 500 employees. The gap between their employment
contraction figure and ours is partly due to their focus on small firms. As they report in their Table 2,
smaller firms in their sample contract more sharply in this period. We also find sharper contractions
among the smallest firms in the SBU. However, the firm-size differential is too small to fully explain the
discrepancy between their estimated employment contraction and ours.
10to 0.2 percent. Echoing our remarks in Section II.a, the under sampling of young firms in the
SBU and the omission of new firms in our sample frame are sources of downward bias in the
estimated rate of gross staffing gains. Thus, we see our estimate as conservative.
The survey data also say the coronavirus shock caused gross staffing reductions equal to
14.9 percent of March 1 employment, mostly due to temporary layoffs and furloughs.14 Here as
well, we see our estimate of the gross staffing reduction impact as conservative for two reasons:
the SBU under samples younger firms, and highly stressed firms are less likely to respond to
surveys.
We can restate our results about gross staffing gains and losses in terms that are less
sensitive to these sources of bias. In particular, Table 3 implies that coronavirus-related
development caused about 3 new hires for every 10 layoffs. If we include contactors and leased
workers, the ratio is about 2.7 gross staffing gains for every 10 gross staffing reductions.
Weekly Census Bureau statistics on gross business formation also point to gross hiring
activity in the near-term wake of the pandemic, although at a much slower pace than pre-
COVID. These statistics derive from administrative data on applications for a new Employer
Identification Number (EIN) on IRS Form SS-4. Figure 3 reports statistics for “high-propensity”
applications, which are the subset of applications for a new EIN that the Census Bureau regards
as having a high propensity to hire paid employees. The figure makes two points. First, and not
surprisingly, gross business formation rates after mid-March are down 24 to 38 percent relative
to the same calendar week in the 2019. Second, and perhaps surprisingly, high-propensity
business applications continue at the pace of 20-30 thousand per week. In sum, new business
formation is greatly depressed in the wake of the COVID-19 shock, but it is not moribund.
The statistical evidence in Table 3 and Figure 3 align well with the anecdotal evidence in
Section I of large pandemic-induced demand increases at certain firms, even as layoffs in the
14
We can obtain a corresponding estimate of aggregate gross staffing reductions in the private sector as
follows: There were 152.5 million employees in the nonfarm private sector as of February 2020,
according to the BLS Current Employment Statistics. According to BLS (2017), independent contractors
are 6.9 percent of employment in the Current Population Survey. Multiplying the February 2020 CPS
employment figure by 6.9 percent yields an estimated 10.9 million contract workers. Finally, 14.9% of
163.4 (=152.5 + 10.9) million yields aggregate gross staffing reductions of 24.4 million. As we explain in
the text, we see this estimate as conservative.
11U.S. economy exceeded twenty million. At the risk of belaboring the obvious, it’s also worth
remarking on an important distinction between the evidence in Table 3 and Figure 3, on the one
hand, and the evidence in Figures 1 and 2 on the other. Table 3 speaks to the near-term
reallocative impact of the COVID-19 shock, and Figure 3 provides evidence that job-creating
business formation continues in the face of the pandemic and lockdown. In contrast, Figures 1
and 2 provide evidence that the shock is expected to trigger unusually large rates of job and sales
reallocation across firms over the next year. Thus, our evidence speaks to both near-term and
medium-term reallocative effects of the COVID-19 shock.
e. Dispersion in Equity Returns Across Firms
Tables 1-3 and Figures 1-3 draw on data sources with short histories. That makes it hard
to situate the evidence in a broad historical context. Thus, we turn now to time-series evidence
on the dispersion of returns across common equity securities for U.S.-listed firms.15 Specifically,
we compute the interquartile range and the standard deviation of the value-weighted return
distribution using closing market prices from the end of one month to the end of the next. We
consider return dispersion rather than the excess reallocation of equity value given the
predominant role of discount rate variation in aggregate stock market movements (e.g., Shiller,
1981, Campbell and Shiller, 1988, and Cochrane, 2011). If, for example, discount rates on risky
securities generally rose in the wake of the COVID-19 shock, an excess reallocation measure
would obscure heterogeneity in the shock’s impact on expected firm-level cash flows.16 In
contrast, this heterogeneity is reflected in return dispersion measures if the discount rate variation
itself is dominated by common factors.
Figure 4 displays the dispersion in monthly equity returns from January 1984 to April
2020. Three episodes stand out: the dot-com market bust in the early 2000s, the financial crisis of
2008-2009, and the market’s reaction to the COVID-19 shock in March 2020. The first two
episodes involve high return dispersion for more than a year and multiple peaks. It remains to be
15
We are hardly the first to use the dispersion in stock returns as a proxy for reallocative shocks. See, for
example, Loungani, Rush and Tave (1990), Brainard and Cutler (1993) and Davis, Loungani and
Mahidhara (1997). Unlike these earlier works, which focus on cross-industry return dispersion, we
consider the dispersion in value-weighted returns across firms.
16
Our supposition here on the rise in discount rates in reaction to the COVID-19 shock finds support in
Gormsen and Koijen (2020).
12seen whether the same pattern will play out this time. Nevertheless, Figure 4 suggests that the
COVID-19 shock triggered unusually large differences across firms in shocks to their expected
future cash flows. That is, the stock return data support the view that the COVID-19 shock had
large reallocative effects among publicly traded firms. When we consider the two-month interval
from 24 February to 21 April, the impact of the COVID-19 shock on the dispersion in returns is
greater yet, as shown by the large dots in Figure 4.17
A handful of recent studies provide evidence on the sources of heterogeneity in the
COVID-19 impact on publicly traded firms. Hassan et al. (2020) characterize and quantify the
concerns that senior executives express in corporate earnings conference calls. As the pandemic
spread from January to March, executives expressed increasing concern about negative demand
shifts, rising uncertainty, supply chain disruptions, capacity curtailments, and employee welfare.
The extent and nature of expressed concerns differ across industries and firms. Davis, Hansen
and Seminario (2020) and Ramelli and Wagner (2020) trace the heterogeneity in firm-level stock
price reactions to COVID-19 developments to specific risk exposure categories such as reliance
on global supply chains, exports to China, food and drug regulation, energy regulation, and
financial regulation. We see these studies as both confirming the heterogeneous impact of the
COVID-19 shock on the fortunes of publicly traded firms, and as providing granular evidence on
the sources of the heterogenous impact.
III. Implications for the Economic Outlook Gone for Good
a. Reasons to Anticipate a Slow Recovery
As of 26 April, confirmed cases of COVID-19 are approaching 3 million, with 206 thousand
persons known to have died from the disease.18 The death toll in the United States appears to
have peaked at about 2,000 per day, but there remains great uncertainty about the future course
of the pandemic and the duration, extent and effectiveness of economic lockdowns and voluntary
social distancing efforts. In particular, we do not know whether a gradual re-opening of the
17
We chose 24 February, because it is the first large daily move in the U.S. stock market that next-day
journalistic accounts attribute to the COVID-19 pandemic. See Baker et al. (2020).
18
See the Johns Hopkins Coronavirus Resource Center at https://coronavirus.jhu.edu/map.html.
13economy will lead to a major surge in new cases, prompting authorities to re-impose tight
restrictions on commercial activity. Obviously, if the pandemic and partial shutdown linger, the
economic recovery will be delayed. Thus, the future course of the pandemic and containment
efforts could lead to a delayed or sluggish recovery. If global pandemics with serious health
consequences become an oft-recurring phenomenon, they will undercut growth for many years.
Under an optimistic scenario, the pandemic recedes in the coming weeks, COVID-19
treatments improve, an effective vaccine becomes available and widely deployed in 12-18
months, and the economy gradually comes back on line over the next 2-3 months without serious
setbacks. Even in this scenario, we see several reasons to anticipate a lengthy recovery. U.S. real
GDP may not surpass its 2019 level until the latter half of 2021 or later, and the return path to
full employment is likely to take even longer. We turn to the reasons now.
The pandemic and lockdown will curtail current and near-term aggregate demand through
several channels. First, labor incomes and profits are severely depressed, and they will remain so
for the duration of the lockdown. Second, economic uncertainty is extraordinarily elevated,
which further depresses consumption expenditures and investment demand. Since uncertainties
about the course of the pandemic and the stringency of the lockdown are likely to abate over the
next several weeks and months, firms have especially strong incentives to defer investments that
are costly to reverse. Third, temporary disruptions on the supply side of the economy can cause
aggregate demand to fall more than one-for-one with the direct impact of the supply shock
(Guerrieri et al., 2020). Fourth, as we discuss momentarily, the COVID-19 shock has negative
effects on the economy’s productive potential in the future. That lowers expected future incomes,
which further depresses current spending demands by forward-looking agents.
The overall fall in aggregate demand is massive. While policymakers are aggressively
deploying fiscal and monetary tools to counter this fall, it seems unlikely that they will or can
achieve a full offset. Thus, we expect demand-side forces to depress employment and output for
several months or more.
We now turn to supply-side considerations, with a focus on developments that influence the
economy’s future productive potential. First, the cash-flow crunch caused by the lockdown,
uncertainty about the future course of the pandemic, concerns about slower growth in the near-
and medium-term, and uncertainty about the outlook for growth and product demand are all
14likely to depress capital investment expenditures for several months or more. Thus, the economy
will carry a smaller stock of productive capital into the future as a consequence of the COVID-19
shock. In addition, pandemic-induced demand shifts and continuing concerns about infectious
disease will undercut the production value of certain forms of capital such as large-scale
entertainment venues, high-density retail facilities, and restaurants with closely-packed patrons.
Second, universities, government labs, and commercial facilities have shuttered non-COVID
research projects. Schools have sent students home, and universities are making do with remote
classes. Barrero, Bloom and Wright (2017) and Bansal et al. (2019) provide evidence that R&D
investments are highly sensitive to uncertainty, because they are irreversible and riskier than
investments in physical capital. The same may hold for investments in worker training, strong
managerial practices, and other forms of intangible capital. Given the extraordinarily high levels
of economic uncertainty in the wake of the COVID-19 shock (Baker, Bloom, Davis and Terry,
2020), investment rates in these intangibles are likely to be at least temporarily depressed.
Immigration and trade, facilitators of innovation, have also shriveled. We expect these
developments to lower the trajectory of future productivity into 2021 and beyond.
The third reason we anticipate a slow recovery on the supply side leads us back to the
pandemic-induced reallocation shock and is the focus of the next section.
b. Creation Lags Destruction in the Response to Reallocation Shocks
Davis and Haltiwanger (2001) study the dynamic effects of oil price shocks in the 1970s
and 1980s on job creation and destruction activity in the U.S. manufacturing sector. They find
sizable reallocative effects of oil price shocks spread out over several years. A key message is
that the destruction side of reallocation precedes the creation side by 1-2 years. Employment and
output are depressed in the interim. Reasons for the delayed creation response include the time
needed to plan new enterprises and business activities, the time required to navigate regulatory
hurdles and permitting processes to start or expand businesses, time-to-build in capital formation,
uncertainties that lead to delays in making sunk investments, and search and matching frictions
in forming new relationships with suppliers, employees, distributors, and customers.
To appreciate why creation responses can lag months and years behind destruction
responses, consider the experience of the American auto industry in the wake of the 1973 oil
15price shock.19 As Bresnahan and Ramey (1993) document, the shock increased the demand for
small, fuel-efficient cars and simultaneously reduced the demand for larger cars. Capacity
utilization and output fell in the wake of the oil price shock, even though a handful of plants
equipped to produce small cars operated at peak capacity.
Several factors made it hard for the industry to respond rapidly to the increased demand
for small, fuel-efficient cars. First, much of the physical capital in the U.S. auto industry was
dedicated to the production of larger rather than smaller cars. Second, U.S. auto workers had
accumulated skills that were specialized in the production of particular models, and these tended
to be larger vehicles. Third, many auto workers laid off from large-car plants could not take up
employment at small-car plants without a costly relocation. Fourth, the dealership network and
salesforce of the U.S. auto industry had evolved under an era of thriving large-car sales, and they
were probably better suited to market and service larger cars. Fifth, the knowledge base and the
research and design personnel at U.S. auto companies were specialized in engineering larger
cars. The development of smaller, more fuel-efficient cars required a reorientation of the
knowledge base and the development of new skills by research and design personnel. Over time,
U.S. automakers adapted to the shift in demand for vehicle types, but much of the creation
response involved the entry and expansion of new facilities in the United States built and
operated by Japanese automakers (Mair, Florida and Kenny, 1988).
Let’s return to the broader reallocative consequences of the COVID-19 shock. Even with
a vaccine in hand, consumer and business spending won’t fully revert to pre-pandemic patterns.
Concerns about infectious disease will linger. Millions of households are learning how to
purchase almost anything online, and many will stick with it. Business people are learning how
to travel less. Much of the shift in spending patterns and business practices will persist. National
borders have been closed to most, often almost all, travel in countries around the world. Even
when the pandemic recedes, stricter border controls, health checks and travel restrictions will
likely remain in effect for years. However well advised, these policies will curtail international
travel for business, tourism and scientific conferences. In addition, the long expansion that
preceded the COVID-19 shock probably delayed the exit and contraction of marginal businesses,
19
This paragraph and the next borrow from Davis and Haltiwanger (2001).
16factories and product lines that were sliding toward obsolescence in any event. By depressing
demand now and for at least several months, the COVID-19 shock triggered a recession that is
likely to involve cleansing dynamics, as in the model of Caballero and Hammour (1994). These
are among the reasons to think that the reallocative effects of the COVID-19 shock will persist
long after the pandemic recedes.
c. Potential for Transformative Shifts
Jones et al. (2008) document the emergence of 335 new infectious diseases in human
populations from 1940 to 2004, with a rising incidence over time even after efforts to control for
reporting bias. Urbanization, long-distance travel, and cross-border commuting create the
potential for new disease outbreaks to spread rapidly and become global pandemics. If major
pandemics become a recurring phenomenon, we may see population shifts away from densely
populated cities. Even if those shifts are largely confined to retirees and the well off, it would
involve a massive reallocation of business, jobs, workers and capital. Persistent concerns about
disease transmission will also provide strong impetus for new products and new efforts to allay
customer concerns about infection risks. Driverless taxis that automatically disinfect interior
spaces after each passenger trip is but one possibility among many.
Shiva (2020) argues that countries around the world need large investments to upgrade
public health systems and healthcare capacity: hospitals, treatment capabilities, protective gear
for front-line healthcare workers, greatly enhanced testing capabilities, vaccine stocks, and
stockpiles of masks and equipment to control and monitor infection risks. In the wake of the
COVID-19 pandemic and its enormous economic toll, arguments for greater investments in
public health systems and healthcare capacity will have broad appeal. Thus, it seems a good bet
that many countries, including the United States, will indeed undertake large-scale investments
in public health systems, healthcare capacity, and medical research in the next several years.
IV. Messages for Policy
a. Many Lost Jobs Are Gone for Good
Many of the American jobs lost since early March will return in the coming weeks and
months as the pandemic and lockdown recede. According to Table 3, temporary layoffs and
17furloughs account for 77 percent of gross staffing reductions from March 1 to mid-May. Recall
that 27.9 million Americans filed new claims for unemployment benefits in the six weeks ending
on April 25. 23 percent of that number is 6.4 million permanently lost jobs. Of course, there
remains tremendous uncertainty about the economic outlook. For many firms, cash-flow
problems today will become insolvencies in the future, and “temporary” layoffs will become
permanent. The longer it takes to bring the economy back on line, the larger the fraction of
recent layoffs that will turn out to be permanent.
To get a sense for the fraction of layoffs that will lead to actual recalls, we turn to evidence
from Katz and Meyer (1990), who analyze a sample of UI recipients in Missouri and
Pennsylvania from 1979 to 1981. They find that 72 percent of UI recipients who initially
expected to be recalled were actually recalled. In addition, 13 percent of ex ante “permanent”
layoffs were, in fact, recalled. Applying these figures to statistics in the rightmost column of
Table 3 implies actual recalls equal to (0.72)[11.4⁄14.9] + 0.13[(1.6 + 2.1)⁄14.9] =
58 percent of gross staffing reductions. This calculation adjusts for “permanent” layoffs that
result in recalls and treats cuts in contractors and leased workers like permanent layoffs.
According to this calculation, 42 percent of the gross staffing reductions reflected in Table 3 will
result in permanent job losses. Applying the 42 percent figure to the 27.9 million new claims for
unemployment benefits in the six weeks ending on April 25 yields 11.6 million permanently lost
jobs. This number does not include future job losses caused by the COVID-19 shock.
Our earlier remarks on the potential for customer (and employee) concerns about infectious
disease transmission to alter retail formats, restaurant designs, and the delivery of many medical,
professional, personal and business services suggest that the reallocative consequences of the
COVID-19 pandemic will continue to play out for many months and years to come. The
evidence in Figures 1 and 2 also says that firms expect high rates of job and sales reallocation to
continue over at least the next twelve months. These remarks and statistical evidence point to
additional permanent job losses beyond the initial 11.6 million or so.
Broadly speaking, we anticipate permanent job losses in three buckets: jobs lost due to
COVID-induced demand shifts, jobs formerly at marginal firms that don’t survive the pandemic
and lockdown, and jobs lost due to the intra-industry reallocation triggered by the pandemic and
post-pandemic concerns about the transmission of infectious diseases. Sections I and II above
18draw on multiple sources of evidence, and a few historical experiences, to explain why we
anticipate a sizable number of permanently lost jobs in each bucket.
If we are correct that many of the lost jobs are gone for good, there are important
implications for policy. First, policy efforts to preserve all pre-COVID jobs and employment
relationships could prove quite costly, if pursued. They are analogous to policies that prop up
dying industries and failing firms. These policies are feasible, but the cost is high in terms of
resource misallocation and taxpayer burden. Second, there are potentially large benefits of
policies and policy reforms that facilitate a speedy reallocation of jobs, workers, and capital to
newly productive uses in the wake of the pandemic. Policies that deter or slow factor reallocation
are likely to further lengthen the lag of creation behind destruction, slowing the overall recovery
from the pandemic, the lockdown, and the pandemic-induced reallocation shock.
In the rest of the paper, we develop these themes in connection with specific policy
interventions and legacy features of the U.S. policy landscape. We focus on policies that directly
impact the economy’s reallocation response to the COVID-19 shock. Policies that facilitate
productive reallocation can also ease supply constraints and complement the role of fiscal and
monetary policy in stabilizing demand. In turn, aggregate demand stabilization and monetary
policy actions that ensure the smooth functioning of the financial system help set the stage for a
speedier reallocation of jobs, workers, and capital to their most efficient uses.
b. High Unemployment Benefits Encourage Layoffs, Discourage Work, and Delay
Productive Reallocation
President Trump signed the Coronavirus Aid, Relief, and Economic Security (CARES)
Act on 27 March 2020. As part of this relief bill, the federal government is supplementing
unemployment insurance (UI) benefit levels by $600 per week through the end of July 2020.20
Each UI recipient receives the extra $600 per week irrespective of previous earnings or their
20
The Federal Pandemic Unemployment Compensation provision of the CARES Act also expanded UI
eligibility to independent contractors, gig workers, self-employed persons and to certain persons who are
“unable or unavailable to work because of certain health or economic consequences of the COVID-19
pandemic,” extended the duration of unemployment benefits by up to 13 weeks, and relaxed job search
requirements. See the U.S. Department of Labor at https://www.dol.gov/coronavirus/unemployment-
insurance, accessed on 28 April 2020.
19potential earnings on a new job.21 For many workers, the extra $600 pushes total unemployment
benefits to levels that exceed their previous earnings.
According to an analysis of this provision in Williams (2020), “the average replacement
rate across states would increase to roughly 116 percent…. The expanded benefits exceed 90
percent of the average weekly wages in all states; they exceed 120 percent of average wages in
21 states and 130 percent in six states.” Similarly, the Council of Economic Advisers estimates
that 64 percent of workers (and at least 50 percent in every state except DC) would receive more
income from unemployment benefits than from working until the end of July when the $600
federal supplement expires. Industries like hospitality and retail have an even greater share of
workers for whom unemployment benefits exceed earnings.22
The newly generous unemployment benefit levels are not lost on employers. “When
Equinox had to start furloughing some employees at its chain of upscale fitness clubs, Executive
Chairman Harvey Spevak had a surprising message to stakeholders. ‘We believe most will be
better off receiving government assistance during our closure’.” This passage is from Thomas
and Cutter (2020), who also write: “Equinox joins a number of companies, including Macy’s ...
and [furniture maker] Steelcase ...that are citing the federal government’s beefed-up
unemployment benefits as they furlough or lay off staff amid the coronavirus pandemic. The
stimulus package is changing the calculus for some employers, which can now cut payroll costs
without feeling they are abandoning their employees.” Thomas and Cutter also report that some
workers in “essential businesses,” who would receive more income while unemployed are asking
to be laid off. These remarks suggest that federal supplemental unemployment benefits have
boosted layoffs and unemployment benefit claims in recent weeks.
The extra $600 per week in supplemental benefits is also likely to discourage many
unemployed persons from returning to work before August. Even at replacement rates in the
historical range of 40-50 percent of prior earnings, unemployment benefits discourage job search
by recipients. See, for example, the studies by Katz and Meyer (1990) and Krueger and Mueller
21
See the Department of Workforce Development at https://dwd.wisconsin.gov/uiben/fpuc/ for a
description of how the State of Wisconsin is implementing the supplemental UI benefits
22
This and the previous sentence reflect personal communications with CEA staff.
20(2010). Evidence is already emerging that today’s much higher replacement rates are
discouraging a return to work. Huffman (2020) and Kullgren (2020), for example, offer
anecdotal evidence from the restaurant industry. The problem will worsen as the economy
reopens and employers seek to recall laid-off employees or hire new ones. Some U.S.
Congressional leaders have proposed to extend supplemental unemployment benefits beyond
July (Touchberry, 2020), which would further discourage a return to work and slow the
economy’s response to the reallocative aspects of the COVID-19 shock.
Prang (2020) supplies an interesting example of how the $600 supplemental benefit is
affecting a cleaning company that employed 30 workers before the pandemic. The owner
received a $250,000 loan under the Paycheck Protection Program. Under the terms of the
program, the loan is forgivable if the company reopens within eight weeks and rehires its former
employees. The owner thinks it will take longer than eight weeks to reopen, and that it is
“unclear if his workers would want to stay at the firm over the next couple of months because
many of them stand to make more from the country’s expanded unemployment benefits. Mr.
Walsh [the owner] estimated he would have to raise the pay of certain employees by up to 40%
to compete with collecting unemployment.” Many owners and managers will confront similar
challenges as they seek to reopen their businesses in the near future.
c. Linking Firm Aid to Employee Retention Deters Productive Reallocation
The CARES Act also created the Paycheck Protection Program (PPP), an emergency
lending facility that extends loans to small businesses on favorable terms. Congress allocated
$349 billion to the PPP in the CARES Act and added another $321 million about a month later,
bringing the total to $670 billon (Boggs, 2020). As Letteiri and Lyons (2020) explain, the PPP
has two main goals: “1) help small businesses cover their near-term operating expenses during
the worst of the crisis, and 2) provide a strong incentive for employers to retain their employees.”
Loans are forgivable in an amount up to the borrower’s expenditures on payroll, rent, utilities,
and mortgage interest in the eight weeks after loan receipt, if the borrower maintains their pre-
crisis level of full-time equivalent employees. Otherwise, the amount forgiven falls in proportion
to the headcount reduction. (Payroll expenses must account for at least 75 percent of the forgiven
amount.) Thus, the loan becomes a grant if covered operating costs exceed the loan amount and
the borrower maintains headcount.
21You can also read