Scale, Disruption and Brexit - A new dawn for the UK food supply chains? - Barclays ...

Page created by Micheal Ramos
 
CONTINUE READING
Scale, Disruption and Brexit - A new dawn for the UK food supply chains? - Barclays ...
Scale, Disruption and Brexit
A new dawn for the UK food supply chains?
Scale, Disruption and Brexit - A new dawn for the UK food supply chains? - Barclays ...
Contents
3      Executive summary

4      Part 1: Societal shifts in how, when and where we shop

8      Part 2: Consolidation is the name of the game

13 Part 3: The Brexit effect

23 Case studies
       Groceries Code Adjudicator
       Harvey and Brockless
       SPAR

29 Checking out the shop landscape: Trends to watch

30 The tariff effect

31 Appendix

33 Further information

This report was researched, developed and produced by
Retail Economics in September 2018 for Barclays Corporate Banking.

                                                                     2 of 33
Scale, Disruption and Brexit - A new dawn for the UK food supply chains? - Barclays ...
Executive summary
It’s a momentous time for the UK food and grocery sector. New technology, increased
consumer choice, fiercer competition and game-changing industry consolidation have
all led to a big shift in power between wholesalers, retailers and consumers.

Disruption is now the new normal across the sector.                  closer to home, buy produce from local suppliers and be          For example, a hard or no-deal Brexit could mean:
To become more profitable and fit for the digital age,               more ethical with what they put in their basket. They’re also
                                                                                                                                      •    New tariffs* of £9.3bn per year imposed on food
retailers have had to keep up with customer demands and              looking for a wider, more pleasing shopping experience.
                                                                                                                                           and drink imports from the EU
expectations. This has led to innovative strategic partnerships
that no one thought possible just a few years ago.
                                                                     Playing out against the backdrop of these developments           •     new average tariff of 27% for food and drink supply
                                                                                                                                           A
                                                                     is the UK’s future relationship with the EU. How will British         chains compared to a 3– 4% non-food average tariff
                                                                     businesses trade with the rest of the world and at what
Technological innovation is driving                                                                                                   •    Every consignment of goods from the EU will require a
                                                                     cost? Companies need to be aware of how the challenges
                                                                                                                                           customs declaration which starts at a minimum of £50
increased consumer choice.                                           and opportunities for each scenario will impact on their
                                                                     business and put contingency plans in place.                     •    The average cost of complying with SPS (Sanitary and
The union of the UK’s largest retailer and wholesaler with                                                                                 Phytosanitary Rules) on imported food and drink from
Tesco’s £3.7bn acquisition of Booker started the ball rolling                                                                              the EU could be equivalent to an additional 8% duty.
in 2017. There’s also a potential £7.2bn merger between
Sainsbury’s and Asda up for approval from the CMA
                                                                     New tariffs* of                                                  No-one has a crystal ball when it comes to the future.
(Competition and Market Authority) though the CMA has
confirmed it requires further investigation. Add to the mix          £9.3bn                                     £                     But looking at the history of the food and grocery sector,
                                                                                                                                      it’s likely that it will continue to rise to the challenges of

                                                                     per year
Amazon’s foray into the online food market, plus the rise of                                                                          this fast-evolving landscape.
the discounters and it’s not surprising to see retailers taking
measures to adapt to these new market forces. At the time of
writing, the latest of these measures is Tesco’s launch of its new   could be imposed on food and
discount fascia, Jack’s. As retailers and wholesalers continue to
form closer partnerships, it’s likely that consolidation, and the
                                                                     drink imports from the EU
formation of strategic partnerships, will continue to ripple
                                                                     In this report, we’ve included an overview of the food and
through the sector, including down the supply chain.                                                                                                                  Ian Gilmartin
                                                                     grocery sector since the turn of the century in Part 1 and
                                                                                                                                                                      Head of Retail and Wholesale
Technological innovation is also driving increased                   looked at current trends in Part 2. Part 3 focuses on the
                                                                                                                                                                      Barclays Corporate Banking
consumer choice as takeaway and online options change                different Brexit outcomes and what this is likely to mean
the way people buy and consume food. Environmental                   for the industry when it comes to costs and tariffs over        *For details of individual product tariffs, and how this might affect your
considerations are also important as shoppers look to shop           the five-year post-Brexit period.                                 business or subsector, please see the appendices at the end of the report.

                                                                                                3 of 33
Scale, Disruption and Brexit - A new dawn for the UK food supply chains? - Barclays ...
Part 1: Societal shifts in how, when and where we shop
We have seen the shape of the grocery market shift considerably over the past 20 years,
matching the way we shop as consumers.

How did we get here?                                              Figure 1
                                                                  There was significant growth in the number of food stores throughout the UK
Since the early 2000s, the retail grocery market has been
dominated by the domestic expansion of the Big Four                                      10.0%
supermarkets – Tesco, Asda, Sainsbury’s and Morrisons.
Their market share increased from around two-thirds in 2000                              8.0%

to three-quarters in 2007-2012. They also increased store
                                                                                         6.0%
numbers by around 60% from 2005 to 2012.1 Along with the

                                                                 % change year-on-year
expansion of these large stores in out-of-town retail parks,                             4.0%
the Big Four added more non-food products to their range,
such as clothing and electricals. They also branched out to                              2.0%
banking, insurance and restaurant services. Thanks to digital
technology, retailers were able to offer customers more                                  0.0%

sophisticated shopping options, including online click and
                                                                                         -2.0%
collect and home delivery services.                                                                                                                                                              Source: Company reports
                                                                                                                                                                                                 (Tesco, Sainsbury’s, Morrisons),
                                                                                         -4.0%                                                                                                   Retail Economics analysis.
This growth was underpinned by substantial investment in
                                                                                                 2007

                                                                                                        2008

                                                                                                               2009

                                                                                                                      2010

                                                                                                                             2011

                                                                                                                                    2012

                                                                                                                                           2013

                                                                                                                                                  2014

                                                                                                                                                         2015

                                                                                                                                                                    2016

                                                                                                                                                                           2017

                                                                                                                                                                                  2018
new stores and regional distribution centres, as well as the
IT infrastructure behind e-commerce and smarter logistics.
                                                                    Despite modest sales volume growth across the food and                                      What’s behind these changes?
In part, this rapid change in market structure was led by
                                                                    grocery sector from 2007 to 2014, capacity across the Big
demand. Increasingly affluent consumers wanted more                                                                                                             Many of the trends that emerged from 2004 to 2014 have
                                                                    Four supermarkets is estimated to have gone up by 45%.
choice, convenience and shopping options. This in turn                                                                                                          since been reversed. After the financial crisis, households
                                                                    As a result, sales densities declined dramatically, falling in
changed how retailers served their customers.                                                                                                                   saw their disposable incomes go down.
                                                                    real terms by around 32% over this period.
All of this led to fierce competition among the major                                                                                                           And right when consumers started looking for cheaper
                                                                    Meanwhile, discounters Aldi and Lidl have increased their
players for new sites, fuelling a sharp rise in the density of                                                                                                  alternatives, new technology was enabling retailers to be
                                                                    store base, built a stronger proposition and created a loyal
urban supermarkets. Indeed, the growth in supermarket                                                                                                           more transparent around pricing, service and quality. This
                                                                    customer base. As a result, their market share has increased
floor space outpaced sales for much of this period,                                                                                                             gave discounters a much firmer foothold in the market.
                                                                    from under 5% to over 7% during this period.
eating into sales densities and damaging productivity
for many years.                                                                                                                                                 1
                                                                                                                                                                Company annual reports.

                                                                                                                  4 of 33
Scale, Disruption and Brexit - A new dawn for the UK food supply chains? - Barclays ...
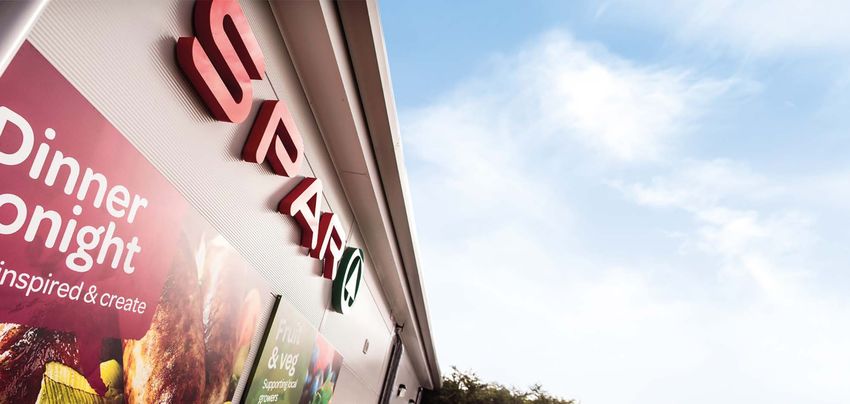
Multiple choice                                                    Figure 2
Consumers tend to buy food more often, from a wider range          Sales volumes per square foot of retail space
of outlets. Busier lifestyles, shifting preferences among
younger buyers, and the popularity of ‘en-route’ shopping
have seen a move away from supermarkets. From 2014 to
                                                                                         4.0%
2017, their share of the market fell from 62.9% to 55.4%.
                                                                                         2.0%

                                                                % change year-on-year
Instead, shoppers are embracing convenience, online and                                  0.0%
discount stores. The number of trips to bricks and mortar                               -2.0%
shops went up by 14.3% from 2013 to 2018. This came at                                  -4.0%
the expense of the average spend, which fell by 8.5% in real
                                                                                        -6.0%
terms during this period.2 As households no longer needed                                                                                                                                                                                                       Source: Company reports
                                                                                        -8.0%
to store a lot of food, food waste also fell by 12% between                                                                                                                                                                                                     (Tesco, Sainsbury’s, Morrisons),
                                                                                        -10.0%                                                                                                                                                                  Retail Economics analysis.
2015 and 2017.3

                                                                                                 2007

                                                                                                               2008

                                                                                                                              2009

                                                                                                                                          2010

                                                                                                                                                       2011

                                                                                                                                                                    2012

                                                                                                                                                                                  2013

                                                                                                                                                                                                2014

                                                                                                                                                                                                              2015

                                                                                                                                                                                                                            2016

                                                                                                                                                                                                                                       2017

                                                                                                                                                                                                                                                    2018
This has led to convenience stores becoming the fastest
growing physical channel within the traditional supermarket
channel. The convenience sector was estimated to be worth
£40bn in 2018, growing by 10% over the last four years,
compared to 7.1% for the overall industry.4                       Figure 3
                                                                  A reduction in real household disposable income growth put a sharp focus on value
Convenience stores have become the
fastest growing segment within the
                                                                                          10.0
                                                                                                                                                 3%
traditional supermarket channel.
                                                                                           8.0
                                                                                                                                              Avg. real 
                                                                                                                                         disposable income                                                                                0.4%
                                                                                                                                              growth                                                                                      Avg. real 
Ease and convenience                                                                                                                                                                                                                 disposable income
                                                                                           6.0
                                                                % growth year-on-year

Two main digital shifts have emerged to affect the structural                                                                                                                                                                             growth
composition of the sector. People are increasingly going                                   4.0

online to order staples, such as cereals and pasta, and more                               2.0
bulky items before ‘topping up’ their shopping from
                                                                                           0.0
convenience stores. This is behind the fast-paced growth of
the online food market, which has increased by 12% on                                     -2.0
average each year since 2010. Valued at £10bn, it is by far                               -4.0
the fastest growing channel for the major supermarkets,
                                                                                          -6.0
accounting for almost 7% of total food sales in 2017.5
                                                                                                 1996

                                                                                                        1997

                                                                                                                1998

                                                                                                                       1999

                                                                                                                                2000

                                                                                                                                       2001

                                                                                                                                              2002

                                                                                                                                                     2003

                                                                                                                                                            2004

                                                                                                                                                                   2005

                                                                                                                                                                           2006

                                                                                                                                                                                  2007

                                                                                                                                                                                         2008

                                                                                                                                                                                                2009

                                                                                                                                                                                                       2010

                                                                                                                                                                                                              2011

                                                                                                                                                                                                                     2012

                                                                                                                                                                                                                             2013

                                                                                                                                                                                                                                    2014

                                                                                                                                                                                                                                           2015

                                                                                                                                                                                                                                                  2016

                                                                                                                                                                                                                                                         2017
2
Nielsen Homescan 3DEFRA. 4,5Retail Economics.                                                                                                                                                                                                                   Source: ONS.

                                                                                                                               5 of 33
Scale, Disruption and Brexit - A new dawn for the UK food supply chains? - Barclays ...
The popularity of casual dining platforms like Uber Eats,                     Figure 4
Deliveroo and Just Eat, has also led to a boom in the range,                  The move away from supermarkets has been fast
quality, convenience and competitiveness of takeaway food.
                                                                                                                                        5.4%                                                    6.4%
Estimated to be worth £10bn in 2017, the takeaway market                    100%
                                                                             90%                                      4.4%                                                    5.6%
has grown by 34% since 2009, almost twice the rate of                                                                                           6.2%
                                                                                                                                                                                                       10.8%
                                                                             80%
the retail food sector over this period.6 It now accounts for                70%
                                                                                                                                                                                                                                                       Other
                                                                                                                      21.0%
                                                                                                                                                                              21.7%                                                                    Online
around 5% of total spend on food and drink (including                        60%
                                                                             50%                                                                                                                                                                       Discount
eating out), with a large part of this growth coming at the
                                                                             40%
expense of the traditional grocery market.                                                                                                                                                                                                             Convenience
                                                                             30%                                                                62.9%                                                  55.4%
                                                                             20%                                                                                                                                                                       Supermarket
                                                                             10%
Worth £10bn in 2017, the takeaway                                             0%                                                                                                                                                                   Source: IGD.
                                                                                                                                      2014                                               2017
market has grown by 34% since 2009.7
The sector has embraced new technologies such as online                       Figure 5
and smartphone apps. Investment in the development of                         More visits to the shop has reduced average basket values
ordering functionality on Facebook Messenger, Amazon                                                                Annual food shopping trips per buyer                          Average basket values per trip (£)
Alexa and Xbox, has also helped disrupt the food sector.                                                                                                                                                    8.5%
                                                                                                                                                                                                       reduction in average
                                                                                                                                                                                                         basket volumes
More for less                                                               2018                                                                         179
Given the pressure on household finances, consumers
                                                                                                                                                                                  £21.18                                                           Source: Nielsen Homescan
have prioritised value-for-money over choice. This reduced                                                                                                                                                     £19.37                              (2013 – 52 weeks to 4 January
loyalty to retailers and brands has led to a sharp rise in the
                                                                            2013                                          157                          +14.3%                                                                                      2014 and 2018 – 52 weeks to
                                                                                                                                                  more shopping trips
                                                                                                                                                                                                                                                   11 August 2018). Includes grocery
discounter market share. As a result, the Big Four’s market                                                                                                                                                                                        multiples and discounters.
share declined to 68% in 2018 from its peak of just over 77%                                        130       140        150            160        170         180      190           2013                       2018
in 2011.7 By contrast, Aldi and Lidl have more than doubled
their share of the market over the same period while being                    Figure 6
consistently more price-competitive than the Big Four.                        Online food sales have more than doubled from 2010 to 2017
It’s estimated that almost two-thirds of consumers visit Aldi                                        15,000                                                                            6.9%                      8.0%
or Lidl as part of their overall shop.8 The combined market                                          13,000                                                                                                      7.0%
                                                                           Online food sales (£m)

                                                                                                                                                                                                                          % of food sales online
share of the discounters is almost £1 for every £8 spent in                                          11,000
                                                                                                                                                            4.4%
                                                                                                                                                                                                                 6.0%
supermarkets, compared to £1 in every £25 just 10 years                                               9,000                   3.5%                                                                               5.0%

ago.9 Offering value over range has resonated across all                                              7,000                                                                                                      4.0%
                                                                                                      5,000                                                                                                      3.0%
social groups. It’s thought that a third of shoppers at the                                                                                                                                                                                            Online food (£m) LHS
                                                                                                      3,000                                                                                                      2.0%
discounters come from the most affluent households.10                                                                         4,416                         6,103                      10,032                                                          Penetration online food
                                                                                                      1,000                                                                                                      1.0%                                  (%) RHS
                                                                                                     -1,000                                                                                                      0.0%
6
The Takeaway Economy Report 2017. 7,8,9Kantar World Panel. 10The Grocer.                                                      2010                           2013                       2017                                                       Source: Retail Economics.

                                                                                                                                      6 of 33
Scale, Disruption and Brexit - A new dawn for the UK food supply chains? - Barclays ...
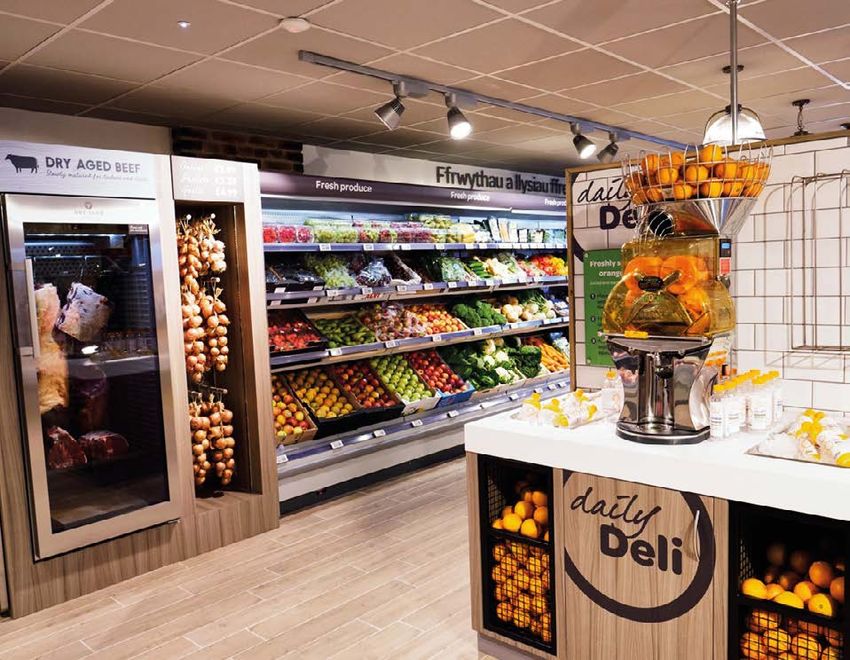
Healthier lifestyle choices                                                                                                                                                                                                              Shopping as an experience
    The growth in food volume is under pressure, as evidence                                                                                             on their health and the environment. Increased visibility                           The Retail Experience Economy touches all parts of the
    suggests that people are consuming fewer calories than                                                                                               of nutrition and ‘traffic light’ labelling from supermarkets                        industry, from beautifully designed supermarkets that invite
    they did in previous decades. Average calorie consumption                                                                                            and suppliers has also raised calorie consciousness.                                people to relax and socialise, to omnichannel services that
    started declining in 2001 and has fallen by more than 8%                                                                                                                                                                                 offer same-day delivery on products they’ve ordered on
    over the last 10 years.11                                                                                                                            Another factor worth noting is that calorie consumption                             their phone or tablet.
                                                                                                                                                         falls as people get older. The median age in the UK was
                                                                                                                                                         37.6 years in 2000, which rose to 40.2 years in 2015.12                             Meaningful experiences are becoming such an important
    There’s growing evidence that consumers                                                                                                              Meanwhile, the percentage of the population aged over                               deciding factor for consumers that, in some spheres, it
    are more interested in what they eat, as                                                                                                             65 is expected to rise from 17.7% in 2014 to 23.3% within                           has led to a polarised market. At one end of the spectrum,
    well as the impact this has on their health                                                                                                          two decades. A reduction in calorie consumption also                                convenience and value have driven consumption of everyday
                                                                                                                                                         explains why food volume growth is failing to keep up with                          consumables. At the other, free coffee and sushi bars appeal
    and the environment.                                                                                                                                                                                                                     to consumers who value the environmental, entertainment
                                                                                                                                                         population growth. If free movement were to end when
                                                                                                                                                         the UK leaves the EU, this would put further downward                               and educational side of their experiences.
    This trend towards the consumption of fewer calories                                                                                                 pressure on population growth in the coming years.
    is likely to have been driven by the popularity of healthy                                                                                                                                                                               Broadly, the proportion of household income spent on
    living. There’s growing evidence that consumers are more                                                                                                                                                                                 recreation and culture, eating out, holidays and more general
    interested in what they eat, as well as the impact this has                                                                                      11
                                                                                                                                                                             DEFRA. 12ONS.                                                   leisure pursuits has risen as consumers prioritise these activities.

 Figure 7                                                                                                                                               Figure 8                                                                             Figure 9
 Comparisons of market share shift – Big Four vs Discounters                                                                                            Average daily calorie intake is on the decline                                       Food volume growth has not matched population growth

                                14                                                                             78                                                                              2450                                                                     0.80%
                                                                                                                                                                                                      PER DAY
                                12                                                                             76                                                                              2400                                                                     0.60%

                                                                                                                                                                                                                                         Average annual growth rate %
Market Share of discounts (%)

                                                                                                                    Market Share of Big Four (%)

                                                                                                                                                   Average calorie intake per day per capita

                                                                                                                                                                                               2350                                                                     0.40%
                                10                                                                             74                                                                                     2,409
                                                                                                                                                                                               2300    kcal          PER DAY                                            0.20%
                                8                                                                              72
                                                                                                                                                                                               2250                                                                     0.00%
                                6                                                                              70
                                                                                                                                                                                               2200                  2,276                                              -0.20%
                                4                                                                              68                                                                                                     kcal     PER DAY                                  -0.40%
                                                                                                                                                                                               2150
                                2                                                                              66                                                                                                                                                       -0.60%
                                                                                                                                                                                               2100

                                0                                                                              64
                                                                                                                                                                                                                               2,131                                    -0.80%
                                                                                                                                                                                               2050                             kcal
                                 2008

                                        2009

                                               2010

                                                      2011

                                                             2012

                                                                    2013

                                                                           2014

                                                                                   2015

                                                                                          2016

                                                                                                 2017

                                                                                                        2018

                                                                                                                                                                                                                                                                            Avg. annual population growth (2005-2007)
                                                                                                                                                                                               2000
                                                                                                                                                                                                                                                                            Avg. UK daily average calories consumed per capita (2005-2007)
                                                      Aldi and Lidl               Big Four                                                                                                     1950
                                                                                                                                                                                                      2001           2008      2017                                         Avg. annual UK food volume growth (2005-2007)

      Source: Kantar Worldpanel.                                                                                                                           Source: DEFRA.                                                                      Source: ONS, DEFRA, Retail Economics analysis.

                                                                                                                                                                                                           7 of 33
Scale, Disruption and Brexit - A new dawn for the UK food supply chains? - Barclays ...
Part 2: Consolidation is the name of the game
The seismic shifts in the UK grocery landscape have had a profound impact on retailers and
their suppliers. A decade of rapid physical expansion and a shift in consumer preferences
have also led to a disconnect between business models and consumer needs.

Retailers have shifted their strategies to become more           Figure 10
competitive and productive, and to secure future growth.         Simplified food supply chain model
As a result, the line between wholesaler and retailer has                                                               65.6 million people
become increasingly blurred.                                                                                                      UK population

The flow chart shows a simplified food supply chain,
                                                                                                                                     £220bn
highlighting the area under the greatest amount of                                                                         Total consumer expenditure
                                                                                                                           on food, drink and catering
pressure for consolidation.
                                                                                   £96.2bn                                                                                            £124.2bn
                                                                             Consumer expenditure                                                                             Household expenditure
Rebalancing costs                                                               catering services                                                                                food and drink
Operating costs for retailers rose by 2.9% in 2017, outpacing
industry sales growth and putting margins under intense
                                                                                    Caterers                                                                                  Food and drink retailers
pressure. Part of this rise was driven by the National                        (restaurants, cafes)
Living Wage, National Minimum Wage, business rates, the                 Gross Value Added – £32.4bn                                                                         Gross Value Added – £29.8bn

Apprenticeship Levy, utilities and other central costs. From                 Employees – 1,680,000                                Consolidation
                                                                                                                                                                               Employees – 1,120,000

2008 to 2016, total employment costs rose by 30% for food                     Enterprises – 120,903                                                                              Enterprises – 53,233
                                                                                  Sites – 458,314                                                                                     Sites – 86,332
wholesalers and 29% for retailers. And when import costs
went up in 2016 after the post-Brexit currency dip, so did
sourcing costs.                                                                                                             Food and drink wholesalers

                                                                                                                      £12bn            230,000           15,938
Despite these pressures on operating margins, consumers                                                          Gross Value Added      Employees      Enterprises
haven’t been impacted too much. Historically, the extent to
which retailers have passed through costs is closely linked
                                                                                                                          Food and drink manufacturing
to loss of market share and share price drops. The last time
                                                                                        Includes everything from primary processing (milling, malting, slaughtering) to complex prepared foods
UK shoppers faced a 5% price rise in their food shopping
bills was in 2011. This marked the start of a five-year period                                £28.8bn                     390,000                     9,844                11,296
                                                                                          Gross Value Added                Employees                 Enterprises              Sites
where the Big Four grocers lost around five-percentage
points of their market share to discounters.                                                                              Farmers and primary producers
                                                                 Source: DEFRA.

                                                                                                    8 of 33
Scale, Disruption and Brexit - A new dawn for the UK food supply chains? - Barclays ...
As a result, retailers have been forced to sacrifice margins                     Jack’s, Tesco’s answer to Aldi and Lidl, is expected to open over                                                               Labour cuts
and seek cost reductions in their own businesses and from                        10 stores in a variety of locations, including underperforming                                                                  Refocusing on the core food business has led to more
suppliers to remain price-competitive. In turn, suppliers have                   stores and new sites, by the second quarter of 2019. Like its                                                                   streamlined management structures. This has meant
been under similar pressure to cut costs and become more                         competitors, it will offer both own-brand and familiar grocery                                                                  fewer head office jobs, and a reduction in overall headcount,
efficient. Both retailers and wholesalers have reshaped their                    brands, with a range of general merchandise available on a                                                                      which has lowered costs at store level. In essence, a simpler
operating cost base in three main areas: space reduction,                        ‘while stocks last’ basis.                                                                                                      business model needs fewer people.
simplifying the product range and cutting staff numbers.
                                                                                 The unique mix of private label, premium quality and general                                                                    Store wars
Space to fill                                                                    merchandise products, typical of hard discounters, allows                                                                       Achieving market growth for the Big Four has become a
Stores are reducing or simplifying space, or repurposing excess                  them to sell at low prices while maintaining high margins.                                                                      zero-sum game, with one retailer’s market growth coming
capacity. The number of stores across the Big Four consistently                                                                                                                                                  at the direct expense of the others. Retailers have kept
fell between 2012 and 2016. Equally, the rapid expansion of                      Back to basics                                                                                                                  cutting prices to close the gap with their competitors,
discounters has also slowed as suitable locations become                         Retailers have also been simplifying their range by working                                                                     while also investing in differentiating their brand and
harder to find. Since 2015, overall space has declined by 1.5%,                  more strategically with fewer suppliers over a longer period                                                                    services to regain customer loyalty. While this might be
although Aldi and Lidl continue to expand, even if it’s at a                     of time. This has reduced the number of product lines,                                                                          less destructive than an all-out price war with discounters,
slower rate. The German giants will have to continue adapting                    introduced clearer price architectures and cut the end-to-end                                                                   it has led to increasingly smaller margins. When each
how they operate as they face more direct competition from                       cost of goods. Retailers are under pressure to simplify the                                                                     retailer invests in lower prices to protect market share,
retailers like Tesco, which has already taken steps to regain                    offer for consumers, dedicating more shelf space to more                                                                        profit margins go down for the whole sector.
market share.                                                                    popular items.

Figure 11                                                                           Figure 12                                                                                                                    Figure 13
Total employment costs facing food wholesalers                                      Operating costs facing food retailers have risen                                                                             Comparisons of net store changes across
and retailers have been closely aligned                                             faster than sales growth                                                                                                     discounters and supermarkets
135                                                                                                          3.0                                                                                                                      350
                                                                                                                                                                                                                                            298    2012                297
130                                                                                                                                                                                                                                   300
                                                                                                                   2.9%

                                                                                                                                                                                                                                                          233                    233
                                                                                                             2.5
                                                                             Percentage point contribution

                                                                                                                                                                                                                                      250

                                                                                                                                                                                                               Net change in stores
125
                                                                                                                                                                                                                                      200                                                   162
                                                                                                             2.0
120
                                                                                                                                                                                                                                      150   100                                                    91
                                                                                                                                                                                                                                                          84
115                                                                                                          1.5                                                                                                                      100
                                                                                                                   Total operating cost

                                                                                                                                                                                                                                                                       39
110                                                                                                                                                                                                                                   50                                          7                16
                                                                                                             1.0                                                                                                                                                                            -8
                                                                                                                                                                                                                                       0
105
                                                                                                             0.5                                                                                                                      -50
100

                                                                                                                                                                                                                                            2012

                                                                                                                                                                                                                                                          2013

                                                                                                                                                                                                                                                                       2014

                                                                                                                                                                                                                                                                                 2015

                                                                                                                                                                                                                                                                                            2016

                                                                                                                                                                                                                                                                                                   2017
95                                                                                                           0.0
                                                                                                                                                                                                                                                                 Big Four     Discounters
                                                                                                                                          Labour

                                                                                                                                                           Distribution

                                                                                                                                                                                   Advertising
                                                                                                                                                                                   and central
                                                                                                                                            costs

                                                                                                                                                    Rent

                                                                                                                                                               and fuel

                                                                                                                                                                           Rates

                                                                                                                                                                                        costs

                                                                                                                                                                                                   Utilities
      2008

               2009

                      2010

                                 2011

                                        2012

                                               2013

                                                       2014

                                                               2015

                                                                      2016

                                                                                                                                                                                                                 Source: LDC. (Note discounters include Aldi, Lidl, Iceland, Poundland,
                                                                                                                                                                                                                 99p stores (sold in 2016 to Poundland), Poundstretcher, Poundworld,
Source: ONS.                 Food wholesale      Food retail                        Source: Retail Economics analysis.                                                                                           Home Bargains, B&M Bargains and Farmfood).

                                                                                                                                                     9 of 33
Scale, Disruption and Brexit - A new dawn for the UK food supply chains? - Barclays ...
With such big overlap between competitors, the Big Four                                    They also supply restaurant chains such as Wagamama,                        If the CMA does approve the potential £7.2bn merger between
    are fighting to maintain excess capacity despite diminishing                               Carluccio’s and Loch Fyne. The foodservice market was                       Sainsbury’s and Asda, the deal would create the largest
    returns. In other words, retailers would rather keep a                                     estimated to be worth £10bn in 2017, with Booker’s                          grocery retailer in the UK, with a combined market share of
    marginally profitable store open because closing it would                                  market share around 18%, despite being the market                           over 30%.13 In the quest for scale and enhanced profitability,
    gift market share to competitors.                                                          leader. The vertical acquisition combines both the                          the deal would generate combined cost-saving synergies
                                                                                               largest retailer and wholesaler in the UK with synergies                    of at least £500m. These would be realised through shared
    Store closures can also be incredibly expensive if leases are
                                                                                               between the two worth around £200m (0.3% of                                 capabilities, supplier cost harmonisation and operational
    long and inflexible. That means that marginal stores need
                                                                                               combined sales).                                                            efficiencies. Sainsbury’s has suggested that the merger could
    to experience heavy losses before there’s a commercial
    justification for closing them. Against this backdrop, grocers                                                                                                         lower prices by around 10% across many core products,
                                                                                               The merger is likely to drive further revenue from existing                 further closing the gap between them and the discounters.
    are turning to more innovative solutions such as acquisitions
                                                                                               Booker customers because of the enlarged distribution
    and strategic partnerships to secure their future growth.
                                                                                               network, improved access to products, increased brand                       However, increased scale across the combined group would
    Diversifying to grow                                                                       recognition and competitive pricing. The deal has been                      almost certainly lead to pricing pressure on their suppliers.
    When Tesco announced the £3.7bn acquisition of Booker                                      the catalyst for further consolidation in the UK wholesale                  The 10% price reduction across core products depends on
    in 2017, it set the tone for the scale of disruption facing the                            and symbol industry. Soon after the Tesco/Booker                            the harmonisation of sourcing costs between the two retailers.
    industry. Booker owns the Premier, Londis and Budgens                                      announcement, Sainsbury’s looked to acquire NISA but                        So, where there is a price difference from the same supplier,
    brands, and is the main cash and carry wholesaler to                                       didn’t go ahead. This cleared the way for the Co-op to                      the price would fall to the lowest common denominator –
    hundreds of independent convenience grocery stores.                                        acquire NISA in a £143m takeover in May 2018.                               or at least, that’s the basis of their calculation.

                                                                                                                                                                                                                        13
    Figure 14                                                                                                                              Figure 15                                                                     Kantar – August 2018.

    Tesco, Sainsbury’s and Morrisons have reduced their workforce for the last three years                                                 Grocery market by channel

                        3.0%                                                                                                              100%
                                                                                                                                                           5.4%                              6.4%                        5.7%
                                                                                                                                           90%             4.4%                              5.6%                        7.5%
                                                                                                                                                           6.2%
                        2.0%                                                                                                                                                             10.8%
                                                                                                                                           80%                                                                          14.1%
                                2.6%                                                                                                                       21.0%
% change year-on-year

                                         2.0%                                  2.0%                                                        70%
                        1.0%                      1.8%     1.8%      1.6%                                                                                                                21.7%
                                                                                                      0.9%                                                                                                              22.1%
                                                                                        1.1%                                               60%

                        0.0%                                                                                                               50%

                                                                                                       -0.4%                               40%
                        -1.0%                                                                                       -0.5%                                  62.9%
                                                                                                                                           30%                                           55.4%                          50.5%
                                                                                                                             -2.4%         20%
                        -2.0%
                                                                                                                                           10%
                        -3.0%                                                                                                                0%
                                                                                                                                                           2014                              2017                       2022F
                                2008

                                       2009

                                                2010

                                                         2011

                                                                  2012

                                                                            2013

                                                                                      2014

                                                                                               2015

                                                                                                             2016

                                                                                                                      2017

                                                                                                                                 2018

    Source: Company reports, ONS, Retail Economics analysis.                                                                               Source: IGD.      Supermarket       Convenience          Discount   Online    Other

                                                                                                                                     10 of 33
Amazon: Hungry for more                                              Figure 16                                                                                                                (CSG) network of 2,200 Costcutter, Mace, Simply Fresh,
Given their potential to disrupt the market, Amazon’s                Average area per store – Big Four estimate                                                                               Supershop and kwiksave convenience stores. The deal
acquisition of Whole Foods in 2017 has raised eyebrows.                                                                                                                                       also gives CSG’s independent retailers the opportunity
                                                                                       105.0
Although the company’s UK market share for food remains                                                                                                                                       to become Co-op franchises, although a bid by Co-op to
modest, it’s clear that they see the food sector as a significant                      100.0                                                                                                  acquire Costcutter outright in 2018 was rejected.
opportunity. After all, Amazon has successfully transitioned

                                                                    Index 2006=100
across numerous retail verticals; moving from books and
                                                                                        95.0                                                                                                  Supermarkets are also finding other ways to use excess
media to consumer electronics to household goods to                                                                                                                                           capacity by forming tie-ups with other businesses, including
                                                                                        90.0
apparel. It’s likely that food and consumer packaged goods                                                                                                                                    fashion retailers Next and Arcadia, Dixons Carphone, Holland
will experience further disruption as Amazon makes headway                              85.0                                                                                                  and Barrett and food and beverage company Crussh.
into the market. The merger of Today’s Group and Landmark
                                                                                        80.0                                                                                                  These ‘store-in-store’ concepts offer an arrangement
to create Unitas Wholesale with a joint turnover of over £1bn

                                                                                               2006

                                                                                                      2007

                                                                                                             2008

                                                                                                                     2009

                                                                                                                            2010

                                                                                                                                   2011

                                                                                                                                          2012

                                                                                                                                                 2013

                                                                                                                                                         2014

                                                                                                                                                                2015

                                                                                                                                                                        2016

                                                                                                                                                                                2017

                                                                                                                                                                                       2018
                                                                                                                                                                                              that suits both sides. The supermarket can sweat their
is a sign of further consolidation in the wholesale sector. It
                                                                                                                                                                                              assets more effectively, while the partner typically benefits
will create a more sustainable wholesale business, driven by         Source: Company reports, Retail Economics analysis.
                                                                                                                                                                                              from increased footfall and an improved network of
enhanced scale, relevance and capability.
                                                                                                                                                                                              click-and-collect destinations. This trend is expected
Overall, the relentless drive towards improving operational                                                                                                                                   to continue. Across borders, the strategic relationship
                                                                      Figure 17
efficiencies, particularly in logistics and improved buying                                                                                                                                   announced in July 2018 by Tesco and the French retailer
                                                                      The convenience market has become much more
capability, supports the rationale for further consolidation                                                                                                                                  Carrefour highlights the opportunity to achieve scale
                                                                      competitive as multiples grow market share
in both the retail and wholesale markets.                                                                                                                                                     without acquisition. While there are considerable
                                                                                         50,000                                                                                               complexities with this approach, it won’t stop suppliers
All joined up                                                                            45,000                     2,277                                                                     fearing a further erosion of their margins.
                                                                                                                                           +11%                        2,535
The lines between retailers, wholesalers and suppliers are                               40,000
                                                                                                                    3,756                  +32%                        4,940
becoming increasingly blurred as retailers form partnerships                                                                                 +3%                                              Behavioural shifts
                                                                                         35,000                     8,377
which span sectors, transcend supply chains and cross                                                                                                                  8,593                  Changing consumer behaviour is behind the most
                                                                                         30,000
borders. Morrisons’ 2017 supply agreement with McColl’s                                                                                      -9%
                                                                                                                                                                                              disruptive industry changes as retailers prioritise their
                                                                                         25,000
                                                                    Number of stores

opened the door for the supermarket to supply McColl’s                                                              13,538                                                                    investment in convenience stores and online capabilities.
                                                                                         20,000                                                                        12,378
1,300 convenience stores and 350 newsagents. It has also
resurrected the Safeway brand as a wholesale label offered                               45,000                                                                                               The distribution of grocery sales by channel shows that
                                                                                                                                             -7%
exclusively to McColl’s for a limited period. And Morrisons’                             15,000                                                                                               supermarkets still account for the majority of sales.
high-profile agreement to supply Amazon, along with its                                  10,000                     18,826
                                                                                                                                                                                              However, the rapid fall in supermarket sales is expected
                                                                                                                                                                       17,816
tie-up with Rontec and Sandpiper, is expected to take the                                                                                                                                     to further decline as online, convenience and discounters
                                                                                          5,000
company’s wholesale operations past £700m in 2018 with                                                                                                                                        increase their share of the grocery market.
                                                                                                 0
a target of £1bn by 2020.                                                                                           2013                                               2018
                                                                                                                                                                                              As a result, the incumbent retailers are restructuring to
                                                                                                                    Independent             Symbol Group                 Forecourt
In November 2017, following the administration of Palmer                                                                                                                                      capture this shift in sales. While overall store numbers have
                                                                                                                             Multiple                   Co-Operative
and Harvey, the Co-operative Group became the exclusive                                                                                                                                       plateaued across the Big Four, average store size has fallen
wholesale supplier to Costcutter Supermarkets Group’s                 Source: ACS, Retail Economics analysis.                                                                                 by over 15% since 2006.

                                                                                                                              11 of 33
This suggests that retailers are downsizing fast. Additionally,   offers an almost unlimited magnitude of stock-keeping                 Own-labels the key to boosting margins
Aldi and Lidl don’t offer full ecommerce propositions,            units (SKUs), the real estate on desktop and mobile screens           Given the intense pressure on profitability, retailers are likely to
and their operating model is unsuited to expand into the          is limited. They might have more choice, but consumers will           promote their own-brand products rather than branded goods.
convenience market. This gives the incumbent retailers            still be viewing things through a narrow lens.                        This could have far-reaching consequences for the wholesale
a significant competitive advantage.                                                                                                    and supplier markets. Exclusive, strong own-label and focused
                                                                  We expect online will continue to support greater growth in           premium brands not only stand out from the competition; they
With the convenience sector becoming a more important             the takeaway market through increased use of aggregator               also have higher margins. Retailers have also enhanced their value
route to market for retailers, competition within the channel     platforms, such as Just Eat, and hard platforms such as               range to compete with discounters. In some categories, own-label
has intensified. The look of this offering is changing too,       Deliveroo and Uber Eats. Although still in their infancy,             products now account for over 50%17 of the grocery market as
with many facias being retrofitted like mini-supermarkets.        dark kitchens (purpose-built kitchens that house multiple             they continue to be one of the fastest growth categories; their
As well as a range of chilled foods, fresh produce and            eateries that are not open to the public) which purely                growth outstripped that of branded products from May 2015 to
alcohol, these stores are increasingly selling ‘food-to-go’.      service takeaway orders, have the potential to disrupt                August 2018.18 In 2018, Tesco announced that they are about a
                                                                  particularly the convenience sector. Restaurants don’t                quarter of the way through launching 10,000 own brand products.
This has put independents and symbol groups (wholesaler           need to use their high rent, customer-facing kitchens to              They’re also cutting back on the number of suppliers they work
facias) under pressure. While the overall number of outlets       prepare takeaway food; instead they can effectively use dark          with to simplify the business, putting further pressure on suppliers.
has remained fairly static since 2013 (declining by 1.2%),        kitchens. Deliveroo is pioneering this model in partnership
in 2018 the value of the sector went up from £36bn to over        with Wagamama, one of 80 restaurants located across                   What’s next for the industry?
£40bn.14 A significant proportion of this growth has been         11 dark kitchen sites throughout the UK.
driven by the larger presence of the multiples. They increased                                                                          The food and grocery sector is going through a period of painful
their store numbers by 32% from 2013 to 2018 while the                                                                                  readjustment. The relentless focus on structural transformation
                                                                  Figure 18                                                             through a programme of cost reduction has been central to
number of independent outlets and franchisees, for example
Spar, fell by 7% and 9% respectively during this period.
                                                                  The penetration of own-label is                                       the recovery of profitability, accompanied by improvements in

                                                                                                                                 74%
                                                                  significant across key categories                                     industry-level productivity. The spotlight is now on the changing

                                                                                                                  67%
Moving online                                                                                                                           supply chain dynamics as consolidation and collaboration
Meanwhile, the online food market grew by over 17% in                                                                                   continues, driven by the need to scale. We expect to see more
                                                                   55%

                                                                                        55%

                                                                                                     55%
2017 compared with the previous year.15 By 2022, online                                                                                 conversations between retailers and wholesalers, wholesalers
                                                                         45%

                                                                                  45%

                                                                                               45%
food sales are expected to rise by 48% as consumers                                                                                     and symbols groups, and even large-scale logistics companies.
continue to become more comfortable buying online.16
                                                                                                                                        Overall, the industry has a renewed, laser-like focus on customer’s
                                                                                                            33%
What’s more, Gen Z and millennials will also become

                                                                                                                           26%
                                                                                                                                        needs in the context of wider market developments. Retailers are
more commercially important.
                                                                                                                                        now more agile and fit-for-purpose than at any point over the last
Technological innovation will also accelerate transformational                                                                          decade. With stronger balance sheets, renewed focus and firmer
change in the sector. Artificial intelligence will power the                                                                            strategies in mind, the pace of structural change is likely to
uptake of subscription purchasing models and automated                                                                                  accelerate. Nevertheless, business investment is based on
ordering, and offer consumers more convenience. Customer                                                                                certainty. And with Brexit looming, there may be reasons to
preference can also be more personalised online. But as a         Chilled food   Frozen food     Dairy     Canned food   Ambient food
                                                                                                                                        pause for thought before re-engaging in the battle.
higher proportion of food sales moves online, supply chains                                                                             14
                                                                                                                                         ACS and Retail Economics. 15Retail Economics. 16IGD.
could narrow further. And while the online grocery model          Source: The Grocer.                        Brands        Own label    17
                                                                                                                                         The Grocer. 18Kantar Worldpanel.

                                                                                               12 of 33
Part 3: The Brexit effect
In 2017, the UK imported £48bn worth of food and drink, approximately 40% of
the total UK market. Of these, 71% originating from within the EU entered the UK
free of customs duties and other trade costs.19

Following Brexit, food and drink supply chains could face an      What would be the impact of a hard, or no-deal, Brexit?        Meanwhile, discounters at the lower end of the market,
average tariff of 27%, significantly higher than the average                                                                     trading in meat, dairy, cereals and wine, will experience a
non-food tariff of 3-4% in other sectors.20 While these new       The outcome of a hard, or no-deal Brexit (where the UK and     heavier tariff burden compared with companies operating
levies could be severely disruptive in terms of rising costs,     EU apply their standard tariffs to each other’s trade) would   at the upper end of the market. In essence, a large
there could be opportunities to reduce these tariff costs in a    impose the highest quantum of new costs. Based on import       proportion of the tariff burden is based on the weight
scenario that saw the UK outside the Customs Union. The           statistics in the 12 months leading up to May 2018, this       of the imported produce, meaning it does not discriminate
government could decide to reduce tariffs quickly, especially     would amount to new tariffs of £9.3bn per year on food         against quality.
across products where a tariff would serve no useful purpose.     and drink imports from the EU.21
                                                                                                                                 Our analysis shows evidence of ‘tariff escalation’ across
Either way, UK retailers and wholesalers are entering a period    Food and drink tariff rates will be higher than those in       food and drink product supply chains, with finished
of heightened uncertainty. Any outcome other than a full          any other supply chain. All stages within the food supply      products attracting a higher rate of duty than primary
Customs Union will see additional costs imposed on the overall    chain will experience increased costs, with retailers hit      and semi-processed goods. This will have a much bigger
food supply chain. However, the government has proposed           disproportionately as processed goods attract higher duties    impact on retailers than suppliers, and go further down
measures to minimise the worst effects of the new tariffs, some   than raw materials and semi-processed goods. Wholesalers       the supply chain.
of which could come into immediate effect when the UK leaves      will also experience significant cost increases, but to a
the EU, scheduled, at the time of writing, for March 2019.        lesser degree.                                                 19,20,21
                                                                                                                                        WTO, HMRC, Retail Economics analysis.

Figure 19
Average weighted tariff for food and drink is considerably higher than other industries

                                                                                                                                 Food and drink tariff rates will be
      4%                                        10%                        11%                              27%                  higher than those in any other
                                                                                                                                 supply chain.

    Non food                                    Cars                       Apparel                      Food and drink
Source: WTO, HMRC, Retail Economics analysis.

                                                                                           13 of 33
These tariffs will apply to most oil seeds. They’re exempt            Figure 20                                                                                 Other costs on food and drink imports
of duty in their raw state, but attract a rate of up to 9.6% when     Food and drink tariffs rise as they move further                                          Under a hard Brexit, each and every consignment of goods
converted to usable oils. In specific cases, duty rates are higher    down supply chain                                                                         from the EU will need a customs declaration, which will cost
for goods that are packaged for retail than for bulk-packed                                                                                                     at least £50.
                                                                                                35%
goods, for example milk, green tea, palm oil and tinned fruit.
                                                                                                                                                                Food and drink marketed within the EU must satisfy
Again, this imposes a higher tariff burden for retailers and                                    30%
                                                                                                                                                                stringent regulations designed to protect humans, animals
others operating at the end of the supply chain.

                                                                     MFN as % of impact value
                                                                                                25%                                                             and plants in a country from risks associated with additives,
Higher costs for lower value products                                                                                                                           contaminants, toxins, pests and diseases. These are known
‘Specific duties’ is the term applied to food and drink tariffs                                 20%                                                             as SPS (Sanitary and Phytosanitary Rules). Under a hard
when expressed as a fixed amount of money per weight or                                                                                                         Brexit, all products of animal origin will require veterinary
                                                                                                15%
volume of product. Nearly all meat products, dairy, cereals,                                                                                                    checks at the border.
olive oil, wines and sugar-based foods would be subject to                                      10%
these specific duties.                                                                                                                                          The UK imported £13.8bn worth
                                                                                                5%
                                                                                                                                                                of food and drink from outside the
A hard Brexit would add disproportionate                                                        0%
                                                                                                                                                                EU in 2017.
                                                                                                      Primary products/     Semi-processed    Fully processed
cost pressures on discounters.                                                                           raw materials       food and drink   food and drink

                                                                        Source: WTO, HMRC, Retail Economics analysis.
                                                                                                                                                                Industry bodies, the Food & Drink Federation and the
By nature, specific duties impose a relatively heavier burden                                                                                                   Agricultural and Horticultural Development Board, estimate
on lower value transactions. A hard Brexit outcome would                                                                                                        that the average cost of complying with SPS rules on
                                                                        Lower costs for some products
mean companies operating in supply chains with large                                                                                                            imported food and drink from the EU would be equivalent
                                                                        The government has announced that in the event of a
numbers of specific tariffs will find that when trading                                                                                                         to paying an extra 8% in duty.
                                                                        no-deal Brexit, the UK’s MFN tariff rates could differ from
with the EU, the lower the value of their goods, the higher the
                                                                        rates imposed by the EU. Although this might simply be                                  Imports from outside the EU
proportion of their overall tariff burden. Duties, particularly on
                                                                        acknowledging that the UK will be free to set its own                                   The UK imported £13.8bn worth of food and drink from
meat products, can be significant. For retailers, a hard Brexit
                                                                        tariffs, it’s a departure from the previous narrative which                             outside the EU in 2017. The cost of sourcing may change for
would add disproportionate cost pressures on discounters
                                                                        suggested the UK would mirror the EU’s MFN tariffs after                                those countries that currently enjoy lower tariffs as a result
and the value ranges, given the way duties are applied.
                                                                        Brexit. This might not signal a wholesale change to tariff                              of lower bilateral trade deals that the EU has negotiated.
For instance, the products that will be hardest hit are likely          rates, but suggests the government might take a more                                    This would include South Korea, Mexico, Chile, South Africa
to be meat products, sugar, milk powder and cooked or                   targeted approach, focused on reducing high tariffs on                                  and Canada. Tariff rates on food from existing MFN
preserved mushrooms.                                                    products where there is no domestic alternative. There are                              suppliers, for example the United States, Thailand, New
                                                                        already a few examples of this with food and drink products                             Zealand, China and Brazil, are unlikely to change.
There is no broad-brush approach to tariff setting on food              such as olive oil, citrus products and tuna.
and drink. Some products have a MFN (most favoured                                                                                                              Meanwhile, tariffs on food from developing countries like
nation) tariff of 0%. This means that even in the case of a             Outside of a Customs Union, the UK would be free,                                       India will remain low, as the UK Government has already
hard Brexit, tariffs will not apply to these imports. This              whenever it wishes, to reduce its MFN tariffs for products                              committed to continue a scheme of tariff preferences for
would include almost all spirits, beer, spices and oil seeds.           where a tariff would serve no useful purpose.                                           developing countries.

                                                                                                                          14 of 33
What will happen to Tariff Rate Quotas?                                        Identifying what TRQs are available, and                      What would be the impact of a free
TRQs (Tariff Rate Quotas) are specified amounts of                                                                                           trade agreement?
particular products that can be imported into the EU at
                                                                               understanding how they can be accessed,
a lower duty than the MFN rate. Vast amounts of TRQs                           will be crucial for companies trying to                       For ease and practicality, we’ve defined a free trade agreement
                                                                                                                                             (FTA) as: ‘any agreement between separate customs territories
operate within the EU for different food and drink products                    minimise the burden of new tariff costs
and significant quantities of these are imported into the                                                                                    which grants preferential terms of access (lower/no tariffs)
                                                                               post-Brexit.                                                  to each other’s market’. This definition takes in relatively
UK under the lower TRQ rates. Select TRQs are specific to
individual supplier countries, while others are available to                                                                                 restricted agreements, such as the one between the EU and
any supplier country.
                                                                               What would a full customs union mean for                      Chile, as well as more sophisticated arrangements which
                                                                               the industry?                                                 include co-operation in a wide range of non-trade areas,
It’s unclear what TRQs the UK would adopt post-Brexit. But                                                                                   like the EU’s EEA (European Economic Area) agreement
                                                                               Although the government has ruled out a full customs
identifying what TRQs are available, and understanding how                                                                                   with Norway.
                                                                               union between the UK and the EU, widespread support
they can be accessed, will be crucial for companies trying to
                                                                               exists for this option within parliament and the business     A UK-EU free trade agreement would avoid some, but not all,
minimise the burden of new tariff costs post-Brexit.
                                                                               community. Because the EU has said that a customs             of the costs that would arise from a hard Brexit. In particular,
                                                                               union with the UK could be possible, looking at the effects   an FTA could avoid all tariffs on trade between the UK and the EU.
                                                                               of this outcome is essential for a thorough post-Brexit
Figure 21                                                                                                                                    However, it’s worth noting that:
                                                                               trade assessment.
Evidence of tariff escalation on a sample of imports                                                                                         •    one of the EU’s existing free trade agreements remove
                                                                                                                                                 N
                                                                               In terms of tariff and trade costs, a customs union is the        all tariffs for food and drink. For example, the EU-Norway
                         Imports           Total value       MFN tariff as    ‘no change option’. A full customs union could avoid almost       agreement excludes food and drink altogether, applying
                        f rom EU        of MFN tariff    percentage of     all the costs associated with a hard Brexit including:
                            (£m)               (£m)          import value                                                                       significant tariffs in both directions. It’s possible that any
                                                                               •   No tariffs on trade between the UK and the EU                 future UK-EU free trade agreement might still keep
                                                                                                                                                 some tariffs
Primary products/
                                                                               •   No change to tariffs on imports from outside
                          5,650                 547              9.7%                                                                        •    roducts, including food and drink, would need to
                                                                                                                                                 P
raw materials                                                                     the EU
                                                                                                                                                 satisfy stringent rules of origin to benefit from lower
                                                                               •   Potentially no customs declarations for trade
                                                                                                                                                 tariffs. Non-compliance to these rules would lead to
                                                                                   with the EU
                                                                                                                                                 goods being subject to the MFN rate of duty
Semi-processed
                          6,523                 1,922           29.5%          •   Continued access to EU-wide TRQs
food and drink                                                                                                                              •   Customs declarations would be required for all consignments
                                                                               However, a solitary customs union agreement would only        •    ariffs might rise for imports from non-EU countries
                                                                                                                                                 T
                                                                               cover customs regulations. There would still be SPS checks        where the government hasn’t been able to extend
                                                                               at the border unless the UK remains within the EU system          existing free trade agreements
Fully-processed 
                         15,490                 4,803           31.0%          for SPS issues.
food and drink                                                                                                                               •    PS checks would apply at the border unless the UK
                                                                                                                                                 S
                                                                               But remaining in a customs union would mean the UK                remained within the EU SPS system
                                                                               would be bound by EU trade policy and unable to strike        •    UK-EU free trade agreement would allow the UK
                                                                                                                                                 A
Source: WTO, HMRC, Retail Economics analysis.                                  preferential trade agreements with other countries.               Government to strike deals with other countries.

                                                                                                        15 of 33
What would be the impact of the                              What would Brexit mean for exports?                             UK food and drink exports to non-EU countries
Chequers plan?                                                                                                               Brexit is unlikely to have an impact on tariff rates in most of
                                                             Food and drink exports form a critical part of the overall      the UK’s Top 10 food and drink markets, seeing as they
In July 2018, the UK Government published a White Paper      economic value of the UK’s food supply chain. For exports       already trade with the UK on standard MFN terms. This won’t
(the ‘Chequers plan’) outlining its own proposals for a      to the EU, actual costs would depend on the Brexit terms.       change when the UK leaves the EU. MFN markets include the
post-Brexit trading relationship with the EU. The proposal   A hard Brexit would lead to the UK facing new tariffs on        US, China, Hong Kong, Australia, UAE and Taiwan, but the
appears fairly complex, but essentially it is a policy       sales to the EU. At the other end of the spectrum, a            agreements are slightly different for each country.
hybridisation – a Customs Union/Free Trade Agreement         customs union with the EU would mean no new tariff
that’s aligned to SPS rules.                                 costs. In other markets, leaving the EU might mean new          The US
                                                             tariffs on UK exports, but what Brexit ends up looking like     This is by far the largest export market for UK food and
The main features are:                                       will have no bearing on the level of these tariffs.             drink outside the EU, and alcoholic beverages dominate
•   No tariffs on trade between the UK and EU                                                                                the top 10 UK export categories. Whisky alone accounts
                                                                                                                             for 40% of UK food and drink exports to the US, along with
•   No rules of origin on trade between the UK and           In the event of a hard Brexit, restrictions                     significant amounts of gin, vodka, other spirits and beer.
    the EU
                                                             on UK goods entering the EU would mirror                        The standard US MFN rate for all these products is 0%,
•   No customs declarations                                                                                                  meaning that well over half of UK food and drink exports
                                                             those for EU goods entering the UK.
•   UK tariff levels set independently                                                                                       to the US will continue to enjoy duty free access to the US
                                                                                                                             regardless of Brexit.
•    K to operate a dual tariff system, collecting duties
    U                                                        EU tariffs
    at the UK rate (for goods destined for the UK) and       60% of UK exports go to the EU.22 In the event of a hard        The US operates TRQs for some food and drink products
    the EU rate (for goods destined for the EU)              Brexit, these goods would face the EU’s standard MFN tariffs,   but as none of these are specifically reserved for trade with
•   UK alignment with EU SPS rules – avoiding SPS           along with a need for customs declarations and veterinary       the EU, the UK will be able to access these quotas as before.
    checks at the border.                                    checks at the border. So restrictions on UK goods entering
                                                                                                                             China
                                                             the EU would mirror those for EU goods entering the UK.
                                                                                                                             Salmon is the UK’s top export to China, closely followed by
The Chequers plan proposal appears                           Even with a hard Brexit outcome, some UK food and drink         whisky. Other significant items include powdered milk and
fairly complex but essentially it is a                       products would avoid standard MFN tariffs by exporting          pork products. Scotch whisky exports are set to benefit
                                                             through generally available Tariff Rate Quotas (TRQs) which     regardless of Brexit – in 2017, China reduced its MFN rate on
policy hybridisation.                                        offer lower duty rates.                                         whisky from 10% to 5%.

Theoretically, the Chequers plan will provide two main       Scotch whisky exports to the EU, valued at £1.38bn in           China operates TRQs for some food and drink products, but
benefits: UK traders would avoid all new costs on trade      2017/18, (11.6% of the total UK food and drink sales to the     as none of these are specifically reserved for trade with the
with the EU, and the UK would be able to pursue new trade    EU) would be unaffected by tariffs in any event, as the EU’s    EU, the UK will be able to access these quotas as before.
deals with other countries. However, the plan is seen by     MFN rate of duty is already 0%.23 Zero tariffs would also
many commentators as highly unrealistic due to a number      apply to other important beverage exports including
of factors.                                                  gin/genever and beer.                                           22,23
                                                                                                                                 Source: WTO, HMRC, Retail Economics analysis.

                                                                                       16 of 33
Figure 22                                                  Hong Kong and Singapore                                             Taiwan
Top 10 export destinations for food and drink              These free ports don’t levy tariffs on imports. So, Brexit will     The average tariff for food and drink is 14.66% although
                                                           have no effect on the cost of UK food and drink exports to          the MFN rate for whisky is only 5%. Taiwan has TRQs on

  £11,830m                                                 these markets. Singapore acts as a hub for Scotch whisky
                                                           distribution throughout Asia. It imported £291m of Scotch
                                                                                                                               a number of categories of fish and agricultural products.
                                                                                                                               Most of these TRQs are available globally with none
                                                           whisky in 2017/18, accounting for 75% of total UK food              reserved for the EU alone. The UK will still have access
                                                           and drink exports to the market.                                    to these TRQs.

                                                           Australia                                                           Non-MFN markets
                                                           The country’s tariff rates on food and drink are generally          South Korea and Canada have preferential trade deals with
                                                           lower than those applied by the EU, although the rate               the EU. This means lower tariffs on goods from the UK at the
                                                           applied to whisky is relatively high, at 5% + AUS$60.92/litre       moment. However, under all of the Brexit scenarios, UK food
                                                           of alcohol.                                                         and drink exporters will face standard MFN tariffs unless a
                                                                                                                               specific agreement is reached between the UK and the
                                                           Australia is at the early stages of negotiating a free trade        countries in question.
                                                           agreement with the EU, but this will not be in place
                                                           before the UK leaves the EU. Australia has agreed to negotiate      Canada
                                                           a trade agreement with the UK when it’s free to do so.              The EU’s free trade agreement with Canada CETA
                                                                                                                               (Comprehensive Economic and Trade Agreement) will
                                                           UAE                                                                 reduce Canadian tariffs on imports of food and drink from
                                                           There’s an across-the-board tariff of 5% on most products,          the EU, excluding poultry and eggs. CETA removes all
                                                           although alcohol is subject to a 50% duty. In 2017/18, Scotch       Canadian tariffs on seafood and reduces tariff rates on fruit
                                                           whisky sales were worth £130m, accounting for 38% of total          and vegetables, and processed foods. A new dedicated TRQ
                          £2,182m                          food and drink exports to the UAE.                                  for EU cheese will also be established.

                                                £517m    £455m              £384m                 £342m                £339m            £305m                £273m               £203m

European Union           United States          China   Hong Kong          Singapore             Australia               UAE            Canada            South Korea           Taiwan

Source: WTO, HMRC, Retail Economics analysis.

                                                                                      17 of 33
Failure to agree on an extension of CETA to the UK would       This section outlines what we think the UK Government          Potential candidates might include food and drink
mean that UK sales would revert back to MFN terms in           could realistically achieve over a five-year period. These     categories with high duties associated with insufficient
Canada. However, the UK’s main export categories, whisky,      options are mainly focused on a hard Brexit outcome but        domestic production, for instance, olive oil and citrus fruits.
gin and beer, all have zero-rated tariffs.                     could equally apply to a UK-EU free trade agreement.           The UK Government could deliver these tariff reductions in
                                                                                                                              a number of ways, ranging from introducing permanent (or
South Korea                                                    Within one year                                                time-limited) reductions to the MFN rate, to bringing in
Although the country has high MFN tariffs, averaging                                                                          tariff rate quotas for specified amounts of certain products.
                                                               Unilateral tariff rate reductions
35% for agricultural products, the EU/Korea FTA will see
                                                               In any Brexit scenario, other than a customs union, the        Any such unilateral reductions to tariff rates could be made
progressive reductions in these rates for EU goods. This
                                                               UK would be free to set its own tariff rates. To start with,   available to imports from any source, not just the EU, and
includes the phased removal of the 20% tariff on whisky.
                                                               the Government says it would mirror the EU’s tariff rates,     the government could put measures in place whenever it
The post-Brexit timeline                                       although its customs and trade bills give it the power to      wanted to.
                                                               permanently or temporarily vary tariff rates. As yet, there
Depending on the outcome, some changes to costs and            are no details regarding functionality, but it’s likely that   Within two years
tariffs will come into force immediately, while others might   the Government would introduce a process whereby
take longer to implement.                                                                                                     Lower tariffs on imports from larger developing countries
                                                               businesses could apply for tariff rate reductions.
                                                                                                                              After the UK leaves the EU, it will be free to set lower tariff rates
For instance, a hard Brexit will mean significant and                                                                         for imports from developing countries. Under the EU’s existing
immediate additional costs for the food supply chain in the                                                                   GSP (generalised system of preferences) programme, imports
form of new tariffs and non-tariff costs on EU trade. In       Immediate period:

                                                                                                          £
                                                                                                                              from larger developing countries, like India and Pakistan,
some cases, food and drink operators will be able to avoid     Some changes to                                                get only modest discounts to the standard rate of duties for
these new costs by switching to domestic or non-EU
                                                               costs and tariffs                                              some food and drink imports. Post-Brexit, the UK Government
sourcing. However, this may not always be straightforward.                                                                    has promised that it will provide at least the same level of
When it comes to UK sourcing, there will be capacity                                                                          preference for imports from developing countries and improve
constraints in some sectors.                                                                                                  access where possible. Relatively simple changes to the GSP
For example, the UK only produces approximately 10% of
the fruit it consumes. For non-EU sourcing, many supplier
                                                                                  £               Within one year:
                                                                                                                              scheme would allow some food and drink products to benefit
                                                                                                                              from lower duty rates, such as rice from India and Pakistan.
countries are subject to MFN rates and some of them won’t                                     UK free to set its own          More countries could sell food and drink to the UK
have SPS approval to sell their goods to the UK.                                                          tariff rates        Before specific products, such as meat, can be legally
To give suppliers access to food and drink at competitive                                                                     imported into the EU, they first need veterinary approval at
prices, the Government will want to agree to lower tariff                                                                     a country level. For example, in the case of pig meat, only a
rates through new trade deals. In some cases, they might                                                                      handful of countries have veterinary approval to sell to the EU.
                                                               Within two years:
even unilaterally reduce tariff rates.                                                                                        After a hard Brexit, even if the UK keeps the same SPS rules
                                                               Lower tariffs on
                                                                                                                              as the EU, it would be free to authorise other countries that
                                                               imports from larger                                            also conform with those rules to sell to the UK. This would
                                                               developing countries                                           widen the choice of supply.

                                                                                         18 of 33
Within three years                                               Within five years (and beyond)                                       Going for the Chequers plan
SPS rules could change                                           New trade deals
                                                                                                                                      The UK would be free to develop most of its trading
The UK Government has consistently committed itself to           The government has identified the US, Australia and New
                                                                                                                                      arrangements in the same ways it would after a hard Brexit,
maintaining the highest standards for animal welfare,            Zealand as priorities for new free trade agreements (as an
                                                                                                                                      including the freedom to vary its MFN tariff rates, establish
consumer protection, food and product safety. However,           alternative to an agreement with these countries through
                                                                                                                                      its own TRQs and strike trade deals with other countries.
it has not ruled out changing SPS rules to allow imports,        CPATPP). All three are major suppliers of food and drink,
from a wider range of countries, of some products that are       including beef and dairy, sheep meat, wine, fruit, vegetables        Nevertheless, the Chequers plan would tie the UK to the
currently disqualified.                                          and cereals. However, imports are currently subject to               EU’s SPS rules and in all likelihood the EU’s system for
                                                                 MFN tariffs. Striking trade agreements is a lengthy process,         giving other countries approval to trade certain food
Terms with the EU’s existing FTA partners could improve          so it’s highly unlikely that brand new deals with these              products. This would mean that the UK wouldn’t be able
The UK Government already has an informal arrangement            countries could be put in place in less than five years.             to independently approve other countries for food and
with a number of countries to extend their existing deals                                                                             drink exports to the UK, reducing the scope to diversify
with the EU to the UK after Brexit. However, some countries      Staying in a customs union
                                                                                                                                      its sources of animal products.
want to improve the terms of these agreements. Changes           The UK would have to follow all EU tariff rates, and probably
to these FTAs could be secured relatively quickly, in less       all SPS rules. This means it would have limited, or no scope,        UK food and drink exports
than three years, as the bulk of the agreements are already      to reach different trading arrangements with other countries
                                                                 and wouldn’t be able to unilaterally reduce tariff rates.            In general, these will face the same type of treatment
in place. Further reductions to food and drink tariffs will be
                                                                                                                                      as goods from those countries we import from.
a priority for Canada and South Africa.
                                                                 Nevertheless, it’s possible to anticipate some tariff rate           The implications include:
Trade with a number of other countries could become easier       changes for imports from non-EU countries as a result of
                                                                 new trade agreements the EU is negotiating. These include:           •   In a hard Brexit scenario, UK food and drink exports to
This includes Canada, Mexico, Australia, New Zealand, Japan,
                                                                                                                                           the EU will face the same tariff rates as imports of those
Korea, Vietnam and other Asian countries. Earlier this year,     •    rogressive reduction in tariffs on imports of food and drink
                                                                     P
                                                                                                                                           same goods from the EU to the UK
a group of 11 countries with Pacific sea borders signed the          from Vietnam. Tariffs on seafood, poultry meat and meat
CPATPP (Comprehensive and Progressive Agreement for                  preparations will be reduced to 0% over a period of three        •    ariff rates for UK exports to markets where the UK
                                                                                                                                          T
Trans-Pacific Partnership). This significantly reduces trade         to seven years as a result of the new EU/Vietnam deal                already trades on MFN terms will remain unchanged
barriers between the signatories. The US was party to this
                                                                 •    ew trade agreements with New Zealand and Australia
                                                                     N                                                                •    nder all Brexit scenarios, tariffs might increase for UK
                                                                                                                                          U
agreement until President Trump decided to withdraw from
                                                                     should lead to significantly lower tariffs on a wide                 food and drink exports to any market which has an FTA
the process. Amongst other things, CPATPP will abolish all
                                                                     range of food and drink. As negotiations on the trade                with the EU, and to countries where the UK Government
tariffs on wine, seafood and sheep meat between the
                                                                     agreement are yet to start, it’s unlikely that any new               is unable to secure an extension of that agreement
participating nations.
                                                                     FTA will be operational before 2023                                  to the UK.
In the Chequers plan, the government stated that it would        •   In July 2018, the EU and US committed to working
explore the likelihood of joining the CPATPP. Although the            together to lower trade barriers. It’s unclear what form
UK has no Pacific sea border, this doesn’t appear to be a             any trade agreement may take, and there appears to be a
barrier. Joining CPATPP would be quicker than negotiating             difference of opinion on whether any negotiations would
a new trade deal because the bulk of the deal has already             include food and drink. The US is suggesting it should be
been agreed between the various countries.                            included, while the EU is suggesting it shouldn’t.

                                                                                            19 of 33
You can also read