Master Thesis An analysis of lessons learned with bidding/tender for the promotion of Renewable Energy Technologies in selected countries worldwide
←
→
Page content transcription
If your browser does not render page correctly, please read the page content below
Master Thesis

 An analysis of lessons learned with bidding/tender
for the promotion of Renewable Energy Technologies
          in selected countries worldwide

                  Technical University of Vienna
                                &
           Vienna University of Economics and Business

                             Author

                          Sabrina Ropp

                          supervised by

              Univ.Prof. Dipl.Ing. Dr. Reinhard Haas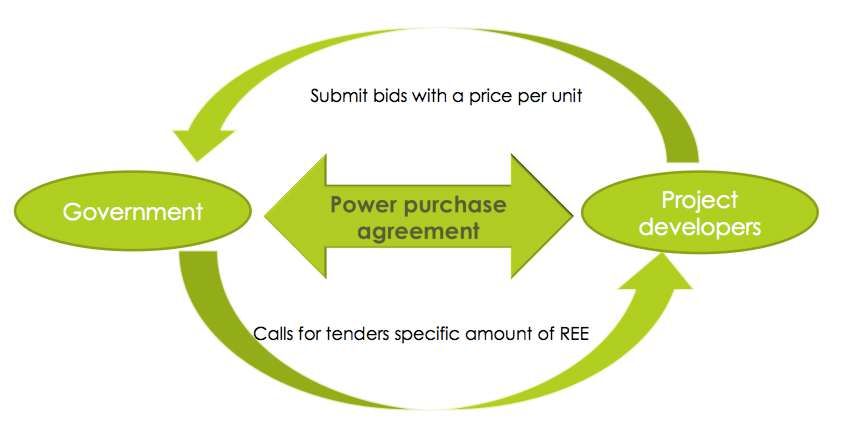
Index
INDEX ................................................................................................................ 1

ABBREVIATIONS ................................................................................................ 3

ABSTRACT .......................................................................................................... 4

1     INTRODUCTION .......................................................................................... 5

2     RENEWABLE ENERGY SUPPORT SCHEMES ................................................... 7

    2.1     PRICE DRIVEN ............................................................................................ 9
    2.2     QUANTITY DRIVEN...................................................................................... 10

3     TENDERING SYSTEMS FOR THE PROMOTION OF RE SOURCES ................... 13

    3.1     MECHANISM............................................................................................. 13
    3.2     AUCTION DESIGNS ..................................................................................... 15
      3.2.1 Organisational pattern ......................................................................... 16
      3.2.2 Conceptional options ........................................................................... 23
    3.3     ADVANTAGES AND DISADVANTAGES ................................................................. 27
      3.3.1 Advantages ....................................................................................... 27
      3.3.2 Disadvantages ................................................................................... 28

4     TECHNOLOGY TRENDS WORLDWIDE ......................................................... 31

    4.1     SUPPORTED TECHNOLOGIES .......................................................................... 31
    4.2     TECHNOLOGY DRIVEN PRICE DEVELOPMENT ......................................................... 35

5     COUNTRY SPECIFIC ANALYSIS .................................................................. 39

    5.1     ACCOMPLISHMENTS .................................................................................... 39
      5.1.1 Low auction prices through international participation (INDIA) .................. 39
      5.1.2 Win of subsidy-free bid (LITHUANIA) ..................................................... 41
      5.1.3 Flexible PPA-contract duration (GUATEMALA) ......................................... 42
      5.1.4 Penalties (RUSSIA) ............................................................................. 43
      5.1.5 Multiple local requirements (URUGUAY) ................................................. 46
      5.1.6 Different weights of criteria (BELIZE & SOUTH AFRICA) ........................... 46
      5.1.7 Involvement of international organizations (EGYPT, ETHIOPIA & NIGERIA) . 47
    5.2     CHALLENGES ............................................................................................ 48
      5.2.1 Low number of participants (KAZAKHSTAN) ........................................... 48
      5.2.2 Resource restrictions and grid constraints (JORDAN, JAPAN & ITALY) ......... 50
      5.2.3 Auction manipulation (GREECE) ............................................................ 51
      5.2.4 Contract execution and delays (PANAMA)............................................... 52
      5.2.5 Underbuilding (BRAZIL) ....................................................................... 53

                                                                                                                Page 1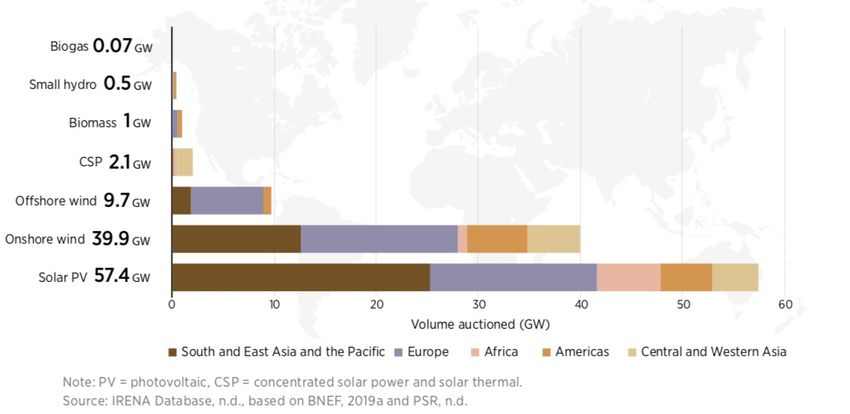
5.2.6 Non-disclosed price caps (PERU) ........................................................... 54
      5.2.7 Coherence with national law (INDONESIA) ............................................. 55
    5.3     SUMMARY OF FINDINGS ............................................................................... 56

6     LEARNINGS ............................................................................................... 57

7     CONCLUSION ............................................................................................ 60

LIST OF FIGURES ............................................................................................. 62

LIST OF TABLES ............................................................................................... 63

REFERENCES .................................................................................................... 64

                                                                                                          Page 2
Abbreviations

APAMSI   Indonesian Solar Panel Manufacturing Association
IPP      Independent Power Producer
kWh      Kilowatt-hour
MC       Marginal production costs
MWh      Megawatt-hour
MEMR     Ministry of Energy and Mineral Resources Indonesia
P        Price
Q        Quantity
PPA      Power Purchase Agreement
PV       Photovoltaic
RE       Renewable Energy
RES-E    Electricity from Renewable Energy Sources

                                                              Page 3
Abstract
Renewable energy generation systems gained international popularity in the last
decade, due to the increasing demand for energy. On top the pressing climate
change issue and the related urgency and awareness for the need of clean energy
production systems further enhanced the requirement. The Paris Agreement,
which was signed in 2015 by 196 countries, set a common ground for the
implementation of new energy policy strategies and led to a renaissance of RES-E
within a broad international community (UNFCCC, 2016).
The main question, which has to be answered in the context of renewable energy
promotion, is related to acceptance and efficiency of different policy instruments.
This paper is taking a closer look on quantity-driven bidding and tender systems,
which were often neglected in policy discussions and literature, but recently
experienced popularity. This is demonstrated by technology reviews of renewable
energy auctions worldwide. The theory is then illustrated with selected country
analyses to derive lessons and policy implications at the global level.
Page 41 Introduction
After decades of ignorance and stagnation in environmental concerns the Paris
Agreement finally brought the global community on track with the pressing issue
of climate change. To meet the Paris Agreement long-term temperature limit of up
to 2 degrees Celsius, there is still a long way to go. One reason is that the extent
of the agreement varies from country to country and some partner countries have
not put it into force at all (UNFCCC, 2016).
One crucial step to contain climate change, is decarbonization of global energy
systems and therefore reduce carbon emissions by supporting environmentally
friendly energy production. This can only be successful if we analyse existing policy
measures that promote sustainable energy sources. The goal is to support those
which fit the geographical, economic and social environment best (Chen et al.,
2008).
An example of well-intended policy, that was also capable but suffered from
insufficient calibration to the economic dynamic, are CO2 certificates. Instead of
the expected slow increase of costs for emitting CO2 that would have allowed
businesses to adapt, prices for CO2 dropped. Thus, the dominant trigger for price
changes was not the increasingly higher demand for certificates but rather the
poor economic performance of industries during the financial crisis (Chen et al.,
2008).
Since the majority of renewable energy production was triggered through fixed
payment schemes, whereas quantity-driven support did not find its way to
popularity (Lucas et al., 2013), this paper aims to examine the importance of
bidding and tender schemes in the promotion process of renewable energy
systems. Auction schemes have been broadly dismissed in academics as well as in
policy practice for decades (del Rı́o & Linares, 2014). While authoring this paper,
more research has been done in this area (IRENA, 2019; Anatolitis et al., 2021),
and auction schemes have been rising rapidly over the last few years (Anatolitis
et al., 2021). Growing global experience with multiple rounds of auctions in
different countries, provide a learning opportunity to policymakers. This knowhow
can help optimizing future auction designs to efficiently adapt to local conditions
and requirements (Dobrotkova et al., 2018). The core objective of this work is
Page 5therefore to analyse which tender programmes exist worldwide for RE and to
connect country specific lessons learned effecting RES in electricity generation.
Therefore, the effectiveness and efficiency of renewable energy auctions is
analysed. Thus, this work takes a closer look on existing literature and link it to
learnings from accomplishments and challenges of renewable energy auctions
worldwide.
First this paper will give a theoretical overview of renewable energy support
schemes, to understand different promotion strategies. Then a deep dive into most
common price and quantity driven support schemes will follow, whereby a focus is
put on advantages and disadvantages of quantity driven tender policies. Onwards,
this work further concentrates on renewable energy auctions, looking at their
mechanisms and design elements. In chapter 4 global trends of renewable energy
tenders are assessed, looking at technology and price tendencies. Chapter 5
highlights selected country case studies illustrating accomplishments and
challenges on a more specific level. Finally, the practical learnings are
contextualized with advantages and disadvantages, to get a holistic view on the
promotion of renewables through quantity driven tender schemes.
Page 62 Renewable Energy support schemes
This chapter is intended to provide the basis for understanding various renewable
energy support policies. To get a feeling for how the supporting mechanisms
behind these price and quantity driven policy instruments work, section 2.1 and
2.2 will outline the theoretical background on it. Since this paper is further focusing
on quantity driven RE auctions, it will additionally give an overview of benefits and
drawbacks of quantity driven instruments.
One of the reasons for a relatively slow dissemination of renewable energy
technologies is insufficient renewable energy subsidy (Atalay et al., 2017). A study
of Zhao et al. (2013), which compares different renewable electricity policies in a
panel data set of 122 countries, shows that investment incentives are positively
correlated with renewable energy production and therefore play a key role in
boosting the diffusion of renewable energy technologies.
Nevertheless, the promotion of renewable energy based electricity generation is
connected to several barriers originating from economical as well as non-economic
backgrounds. When non-economic barriers like grid access, network capacities and
authorization procedures are overcome, economic barriers like high costs of capital
and low electricity prices can still embody severe entry restrictions. Furthermore,
barriers are divergent and dependent on country specific conditions, market
maturity as well as general technological progress of renewable energy systems
(Lucas et al., 2013). This will become more tangible in chapter 5, where country
specific analyses exhibit some of the mentioned obstacles.
Countries have a variety of different incentives and supporting tools for renewable
energy generation (Carley, 2009). In Table 1 you see an overview of possible
policy measures clustered by different supporting channels promoting clean forms
of energy production. In order to achieve an effective multiplication of the use of
renewable technologies, the variants can also be combined to stimulate different
channels simultaneously (IRENA, 2017).
Page 7Table 1: Overview of policies promoting RE
Source: (IRENA, 2017)
Looking at the row of regulatory instruments, many different methods are listed.
In literature an overwhelming focus was put on Feed-in-tariffs, quotas and
certificate systems, as the effects of this specific policies on the renewable energy
market have been studied most extensively (Baldwin et al., 2017). To get a deeper
insight on the different approaches, see Haas et al. (2011a) or IRENA (2018a),
who give an overview and Zhao et al. (2013), Haas et al. (2011b), Kitzing et al
(2016), Baldwin et al. (2017), Mihaylov et al. (2019) or Polzin et al (2019), who
are comparing different instruments and their effectiveness.
In general, regulatory instruments can be clustered in price and quantity driven
strategies, seen in Table 2 by Haas et al. (2004). On the one hand there are price
driven policies like feed-in schemes, on the other hand quantity driven policy
instruments like public tendering schemes (Lucas et al., 2013). To get a feeling
for how the supporting mechanisms behind these price and quantity driven policy
instruments work, section 2.1 and 2.2 will outline the theoretical background on
it.
Page 8Table 2 Fundamental types of regulatory strategies
Source: Haas et al., 2004
2.1 Price driven
The most common price driven policy instruments are tariff-based support
mechanisms. These provide electricity generators with subsidies per kW of
installed capacity or per kWh of produced energy. Financial support strategies, to
push renewable energy generation, can be granted through feed-in tariffs or feed-
in premiums. If policy makers decide to provide feed-in-tariffs, generators obtain
fixed payments per generated kWh independent from generation costs or
electricity prices. Whereas in premium schemes, generators receive a fixed
amount additional to the electricity price. As a result of volatile electricity prices,
feed-in premiums bear more insecurity compared to feed-in-tariffs being
independent from the market prices (Haas et al., 2011a).
Figure 1: price driven support mechanism
Source: (Menanteau et al., 2003)
Figure 1 shows the Feed-in-tariff scheme, where the quantity produced is
determined by the tariff which is guaranteed for a specified period of time.
Page 9Renewable energy producers are incentivized to generate energy until the
marginal costs (MC) equal the guaranteed feed-in-tariff Pin. The electricity output
varies between the different projects, as the marginal cost curve is not the same
for every renewable technology or generator (Menanteau et al., 2003).
One of the main downsides of price-driven support schemes is the hardship of
predicting the total amount of remuneration of RES-E projects, since prices or
premiums for RES-E are usually guaranteed without a restriction on total support
costs (del Rı́o, 2017). This makes budget control for authorities quite difficult,
which is not the case for quantity driven schemes (IRENA & CEM, 2015), which we
will look at in the following section 2.2. Further discussion on this benefit is then
picked up in section 3.3 where advantages and disadvantages of the methods are
outlined.
2.2 Quantity driven
In terms of financial predictability quantity driven approaches can be a more
assessable support choice. In comparison to its price driven opposite, the focus of
quantity driven policies lays on a preferred quantity of generated electricity.
Thereby the amount of generated electricity is set by the regulators, to stimulate
or encourage market penetration. The final price within this support system is not
determined by individual generators, but through the competition process from
energy producers (Haas et al., 2011b). This competition amongst energy
generators is created by the regulating authority, which organizes a bidding
procedure that is specified by a restricted market for electricity of renewable
energy due to the appointed quantity (Menanteau et al., 2003). Typical examples
for quantity-driven instruments are public tendering schemes as auctions (Haas et
al., 2011a). In chapter 3 the process of auctions will be described in more detail.
To first master the mechanism behind this policy method, you can see in Figure 2
, that the price is determined by the quantity. The quantity (Qin) of the demanded
renewable energy electricity is predefined by the regulator, and the output price
(Pout) depends on the offers of the participating parties as well as on the selection
criteria of the regulators. The final subsidy assigned to each generator depends on
the design of the tender scheme. But in most cases, it equals the difference
Page 10between the bid price and the wholesale market price (Menanteau et al., 2003).
Both selection criteria and auction design, will be elaborated on in chapter 3.
Figure 2: Quantity driven support mechanism
Source: (Menanteau et al., 2003)
The idea of this system, in comparison to price driven mechanisms, is to expose
the marginal production costs (MC) during the tender process, as generators offer
low bids to get awarded. These bids should ideally correspond to the marginal
costs, to be profitable. Unfortunately, the exact trend of the marginal cost curve
is often unknown, whereby the overall costs to reach the aim get frequently
underrated (Kitzing et al., 2016).
In general, uncertainty about marginal costs plays an important role in the choice
of price or quantity driven instruments as inaccurate price or quota signals can
affect the outcome. Quantity driven schemes often have a relatively flat marginal
cost curve in comparison to price schemes and therefore are to favour (Kitzing et
al., 2016).
Summarizing price as well as quantity driven RES support mechanisms share some
benefits, as both ensure a reliable long-term income for RE generators and clarity
of support levels for regulators. Regarding the certainty of support levels, auctions
give the regulator not only certainty about prices but also about quantity, which
makes them even more predictable (del Rı́o, 2017).
Page 11To get a deeper understanding of the benefits and drawbacks of quantity driven
schemes, the following chapter 3 outlines the procedure, design options as well as
giving an overview of advantages and disadvantages related to auctions.
Page 123 Tendering systems for the promotion of RE sources
To get a deeper understanding of quantitative driven policies, the following
sections outline the procedure as well as auction design possibilities. In part 3.1,
the mechanism of bidding schemas to further RE sources within the energy mix of
a country will be explained. Followed by part 3.2, which describes different
characteristics of bidding schemes and their effect on the resulting RE provision.
As the previous section 2.2 touched on, characteristics and design elements have
different effects on effectiveness and efficiency of the RES-E tenders and therefore
result in advantages and disadvantages (del Rı́o, 2017). Finally in part 3.3 these
benefits and drawbacks of quantity driven policy instruments like tender schemes
are summarized. This chapter is going to build the core for the following
evaluations and analyses in chapter 4, 5 and 6.
3.1 Mechanism
Like introduced, this part will emphasize on the process of renewable energy
tenders to explain the functions of the auction mechanism. Figure 3 shows the
main features of an auction scheme. In general, the government calls for tenders
referring to the installation of a certain capacity of electricity generated by
renewable energy sources under predetermined conditions. To successfully
participate in the auction process, project developers must fulfil specific
requirements defined by the government. Possible criteria are the used
technology, proof of financial security, environmental license, local production
approaches, etc. (more details on design elements are described in the section
3.2). Energy companies then enter the auction by submitting a bit with a per unit
price of electricity, which they should ideally be able to implement the project with.
After a submitting deadline, the government assesses the offers under
consideration of the specific requirements and signs a “Power Purchasing
Agreement” (PPA). With this contract the winning bidders are provided with a fixed
price over a specified period as well as a guarantee for the purchase of generated
electricity (Atalay et al., 2017; Lucas et al., 2013).
Page 13Figure 3: Auction scheme mechanism
Source: Own illustration, based on (Lucas et al., 2013; Atalay et al., 2017; IRENA, 2018b)
According to Maurer & Barroso (2011) there are certain elements that are
necessary for an auction to be successful:
• Ensuring competition
Competition must be ensured through a regulatory environment that attracts
competition and opposes collusive behaviour, to obtain real price discovery.
• Solid institutions and independent regulators
In order to facilitate and implement successful auctions, it is important to have
reliable institutions bidders can trust in. Therefore, a country should also have
a trustworthy rule of law and judicial system.
• Framework for tariffs
A legal or policy framework should ensure cost-reflective tariffs, to attract
efficient and sufficient investments of buyers.
• Creditworthiness
Buyers should be creditworthy, or the government should have guarantees in
place for insolvency.
• Good design
The auction must be well designed, so bidders are aware of the conditions and
offer distinct propositions.
Page 14• Clear rules of bidding process
Explicit rules for the auction and bidding process should be specified and made
transparent. So, auctioneer and bidders are on the same page regarding
timelines, revealed information, the code of conduct, selection process and
penalties for violating rules.
• Publication of auction
The auction should be published through several channels to attract sufficient
interest from participants including target bidding groups.
If regulators do not consider these elements, it is very likely that auctions are not
leading to the aimed effect and turn out to be trivial or ineffective (Maurer &
Barroso, 2011), going to be described in section 3.3.2.
Depending on the country and the bidding process, auctions can vary referring to
the technology focus, the auction format, pricing rules, pre-qualifications criteria
and other design elements (Mora et al., 2017). These are now discussed in section
3.2 and illustrated with example in chapter 4 and 5.
3.2 Auction Designs
Design elements are aspects of the auction that the regulator can design by choice
when introducing a tender. The success of bidding systems, like for almost every
policy instrument, depends on the ability of its design elements to understand and
tackle shortcomings of the market. To accomplish a sustainable and fitting
promotion of renewable energy electricity production, auction schemes must be
designed to capture specific market conditions (Mora et al., 2017).
Besides capturing market condition, auction design elements can also affect the
size of the impact, whereby current literature is evaluating the trade-off between
efficiency and effectiveness from different designing elements (Matthäus, 2020).
The following subsections are going to look at specific design options, influencing
the effectiveness.
Page 153.2.1 Organisational pattern
There are different formats of auction procedures regarding the awarding structure
and pricing rules. Figure 4 shows the different organisational pattern options,
whereby the most common types are sealed-bid and descending clock auctions
(Lucas et al., 2013).
RE Auctions
STATIC DYNAMIC HYBRID
sealed bids information on sealed and open
bids
First-price sealed Descending Descending +
static
Multi-Product Ascending
Pay-as-bid First-price sealed
bid + descending
Unifrom
Median
Average
Figure 4: RE auctions organisational pattern options
Source: Own illustration (Lucas, et al. 2013; Atalay, et al., 2017; Mora, et al., 2017; del Rı́o & Linares, 2014;
Matthäus, 2020)
Static Auction design
The sealed-bid auction is a static form, where the bidders submit their bids
simultaneously and therefore do not know the prices offered by their competitors.
Offers that meet the determined requirements are ranked and get awarded until
the auctioned volume is met. Within this auction design there is also differentiation
between the units of the allocated products, whereas a first-price sealed bid
Page 16auction is allocating the volume of one product to one project developer and a
pay-as-bid auction is allocating multiple units of the same product with different
prices to several project developers (Lucas et al., 2013; Atalay et al., 2017; Mora
et al., 2017). Particularly in the praxis most countries use pay-as-bid auctions, as
the structure allows to spread the risk of not producing enough energy to meet
the demand, if single projects get delayed or are not able to deliver the submitted
tender (Lucas et al., 2013).
The prices awarded often vary in the different designs. Some countries choose
uniform pricing, where all winning projects receive a clearing price, based on the
last bid accepted to fulfil the quota (del Rı́o & Linares, 2014; Matthäus, 2020).
Moreover, relevant system operators also call for median or average price bids,
where the awarding price refers to the median price of all price bids submitted, or
successful tenders receive an average weighted price of successful bids (del Rı́o &
Linares, 2014). In China there were also auctions held where the closest offer to
the average bid price were awarded (Mora et al., 2017).
In Table 3 the different pricing models are summarized to get an overview.
Literature is on strife when it comes to effectiveness and impact of the two most
popular pricing rules, pay-as-bid and uniform pricing. Matthäus (2020) outlined
the different perspectives, whereby some researchers like Anatolitis & Welisch
(2017) find on average higher profits for developers by uniform pricing, which
leads to more viable projects and therefore an increase in effectiveness. While
other researchers like Kreiss et al. (2017) or Mora et al. (2017) argue that higher
award prices under a pay-as-bid pricing rule favours realization and therefore
effectiveness. Looking at the empirical evidence provided by Matthäus (2020),
auctions with a pay-as bid pricing rule have a higher realization rate and seems to
be more effective.
Page 17Overview Pricing
Table 3: Overview on pricing models
Pricing Model Description
Pay-as-bid pricing Discriminatory pricing, where several winning projects
receive payments according to their submitted bid.
Uniform pricing All winning projects receive same price based on e.g.
last accepted offer.
Median pricing The awarding price refers to the median price of all
bids submitted.
Average pricing Winning tenders receive an average weighted price of
all successful bids.
Source: own illustration (Lucas et al., 2013; del Rı́o & Linares, 2014 ; Atalay et al., 2017; Kreiss et al., 2017;
Mora et al., 2017; Matthäus 2020)
Dynamic auction design
In comparison a descending clock auction is a more dynamic approach in which
the price is determined throughout multi-round bids in the auction process. Within
this system the bidders discover the prices and quantities offered by all
participants, throughout the bidding rounds (Maurer & Barroso, 2011). Figure 5
shows the price adaption process in a descending auction. The government starts
to auction at a high price to reach an excess supply of produced electricity from
renewable energy generators. To meet the aimed supply the auctioneer lowers the
price in following rounds and tenders adapt to this price reduction with lower
quantities. This process continues until the supply meets demand and the offered
quantity matches the quantity that can be produced by the electricity generators.
Within this design model there is no ranking of the bids as the auction result is
determined by the price and the adjusted quantities (Maurer & Barroso, 2011;
Lucas et al., 2013). An ascending clock auction is the equivalent, where the
price increases throughout the auction and the auctioneer sells the product
(Maurer & Barroso, 2011).
Page 18A very common tool within dynamic auction designs is the simultaneous
approach. Here the products that are procured are not identical, e.g. baseload and
peak-load contracts, but the bidding starts at the same time. The different price
reduction, whereby only prices for products with excess supply are reduced, allows
bidders to shift the supply between the products (Maurer & Barroso, 2011).
Descending Auction Dynamic
Figure 5: Price adaption process descending auction
Source: (Maurer & Barroso, 2011)
Hybrid auction model
Very occasionally, countries use a hybrid auction structure, which combines the
benefits of the described static and dynamic auction designs. It can be split in two
stages, where the first stage can be a dynamic descending clock auction with
multiple offers and the second stage is a static auction where the winners from the
first stage make a single offer. With this approach governments try to discover
real prices in the first round and try to avoid collusion in the second one (Lucas et
al., 2013; Mora et al., 2017). But there is also the possibility of first holding a
sealed-bid auction with undisclosed bids and then secondly a multi-round
descending clock auction to progressively lower the offered prices (Atalay et al.,
2017).
Page 19Table 4 gives a well-structured overview of the different key auction designs,
including advantages and disadvantages of the options. It is based on a World
Bank Study by Maurer & Barroso (2011).
Table 4: Overview of different organizational patterns
Auction Design Advantage Disadvantage
First price sealed bid • simplicity • no price discovery
(single product) • easy to implement
• handles weak
competition
Pay-as-bid auction • simplicity • no price discovery
(multiple units of same • easy to implement
product) • handles weak
competition
Uniform price auction • simplicity • no price discovery
(multiple units of same • easy to implement • possibly high political
product) • handles weak costs
competition
• viewed as fair
• attracts small bidders
Descending clock auction • easy to implement • possibility of collusion
(single or simultaneous • good price discovery • higher complexity
auctions) • suitable for multiple
products
• less vulnerable to
corruption
• viewed as fair
• attracts small bidders
Ascending clock auction • easy to implement • possibility of collusion
(single or simultaneous • good price discovery • higher complexity
auctions) • suitable for multiple
products
• less vulnerable to
corruption
Page 20• viewed as fair
• attracts small bidders
Hybrid auctions (mix of • speeds auction With multiple products:
descending clock phase convergence • difficult to implement
followed by a static design • handles weak • exposure problem
phase) competition
• good price discovery
Source: own illustration (Maurer & Barroso, 2011) and author´s findings
The main advantages of the static approaches are the simplicity of the model and
the easy implementation. The big advantage of the dynamic auction model is that
the adjustment of the bidders, through more information, improves the efficiency.
If policy makers choose this auction design, they should also be aware that a lack
of competition can lead to a coordination of bidding (collusion), which increases
the final price (Maurer & Barroso, 2011).
Below in Table 5 you can see examples for countries, which implemented different
forms of awarding strategies in their auction design. The vast majority of countries
is using static pay-as-bid auction formats as mentioned above, whereby especially
European countries tend to have uniform pricing. Moreover, there are some
countries that try to diversify their auction programmes by offering different
awarding strategies like China, France, Uruguay etc. The visible outliers are the
Netherlands and Brazil, which are not using the typical energy auction
mechanisms. The Netherlands use dynamic auction structures and Brazil the above
explained hybrid version.
Page 21Table 5: Auction awarding structures by country
Static Dynamic Hybrid
Pay-as-bid Ireland Descending clock auction Netherlands Hybrid Brazil
United Kingdom Spain
France Columbia
Denmark USA
Lithuania Ascending clock auction France
Netherlands Spain
India USA
USA Canada
Canada
Argentina
Peru
South Africa
Kazakhstan
Germany
Ethiopia
El Salvador
Israel
Poland
Mexico
Egypt
Uruguay
Indonesia
Russia
Panama
Belize
Japan
Guatemala
Brazil
Costa Rica
First price sealed bid Morocco
China
Uruguay
Iraq
Indonesia
Zambia
Vietnam
Peru
Uniform Pricing France
United Kingdom
Spain
Lithuania
USA
Average pricing Uruguay
China
Source: Own illustration (Maurer & Barroso, 2011; IEA, n.d.; RES Legal, 2018)
Page 22According to Polzin et al. (2019) variable conceptional options of tenders like the
bidding process, the contract duration, the technological alignment or the different
pricing should be uniformed throughout the auctions to favour industry learning
and therefore increase the effectiveness of the policy. This conceptional options
depend on the various characteristics of bidding systems, which will be further
described in the next section.
3.2.2 Conceptional options
Regulators have to consider various characteristics concerning their renewable
energy auction, which can influence competition, technology, bid range or winner
selection (Matthäus, 2020). Therefore, they can choose from a variety of
conceptional options like price ceilings, entry barriers, local requirements,
penalties and incentive mechanisms, which will be explored in this section.
Ceiling price
If several companies join forces and offer extraordinarily high prices, a maximum
price can protect against market-distorting agreements. An introduced price ceiling
should maintain the prices below the set limit and gives energy policymakers
certainty about expenditures (IRENA & CEM, 2015; USAID, 2019). The auctioneer
needs to decide upfront publishing the auction, if the ceiling price should be
disclosed. Even though the publication of the ceiling price increases the
transparency, policy makers must be aware that filed bids will be close to the limit.
In this case the intended goals of low prices as well as price discovery will not be
achieved (IRENA & CEM, 2015; IRENA, 2017). Undisclosed ceiling prices on the
other hand can disqualify participants offering slightly higher prices than the
maximum price and result in not contracting the desired auction volume (IRENA &
CEM, 2015). This was the case in Peru, where authorities failed to communicate
maximum prices and disqualified submittals for anticipated power requirements
(see section 5.2.6).
Page 23Project size and duration
Another factor, which greatly affects an auction is the contract duration of PPAs,
which influence the profitability of investors depending on the timespan. It is a
common practice to reconcile the duration to a renewable energy plants useful
lifespan. Thereby regulators can try to reduce the inflation risk. Additionally, the
defined project size is an organisational benchmark for bidders to know what
minimum or maximum project size is required. This helps bidders to submit
suitable projects, that are more likely to be rewarded in the end. An upper limit
can also help smaller players to take part, as generation levels can be met easier,
which promotes competition and hamper the default rates. Furthermore, the limit
can also be a useful tool to spread risks in dealing with grid constraints or
diversifying the geographic project distribution (del Rı́o & Linares, 2014; IRENA,
2017). In Guatemala, the flexible duration was a useful tool to react on volatile
energy demand, as well as attracting different project sizes, see section 5.1.3.
Technology banding
Another design element that affects the market is the decidedly support of specific
technologies. With technology banding regulators try to promote certain RE
technologies to diversify energy sources. They can therefore publish an auction
that requires one or more determined technologies, they want to further (del Rı́o
& Linares, 2014). Chapter 4 will pick on this element and show, what technology
banding means for the market maturity and prices on a global scale.
Local content requirement
There is no consistent design of renewable energy auctions, as every country
constructs it differently according to their desired policy target. Governments often
use auctions to not only follow the original support purpose of promoting
renewable energy production, but also to target other development benefits
related to it, e.g., economic growth, increasing regional employment or supporting
local ownership. It therefore serves as multiple use instrument, which can be
conceptualized with a set of characteristics that trigger diverse socio-economic
benefits (IRENA, 2019). Listing one design element that affects other policy areas
Page 24than mainly the renewable energy supply, is the inclusion of local content
requirements in a RE auction.
Local content requirements are a design element, which obliges bidders to use
domestically manufactured products, equipment and services, depending on the
applied rule (Atalay, et al., 2017). The implementation of this kind of qualification
criteria can develop local industries, boost domestic job creation or enhance
community benefits (IRENA, 2019). Nevertheless, according to Hansen et al.
(2020) it is hard to assess the true impact of local content requirements as other
legal, economic and technological factors also may be affecting the aimed output.
Furthermore, the promised benefits have to be balanced with the exclusion of
potential international bidders, who usually have less access to local resources and
thus, are either excluded or have to consider additional costs including local
suppliers, which results in higher prices (IRENA, 2017). These higher prices may
be driven by longer project duration, project risks or coordination effort as foreign
generators face language gaps, or are not familiar to domestic supply chain
process providing the equipment. To advance the effectiveness of local content
requirements it is recommendable for regulators to ensure a stable market
(Hansen et al., 2020). Also, penalties can help to assure the achievement of the
use of local services or requirements (Atalay, et al., 2017).
Penalties
Penalties are a belated financial punishment, if the electricity generation is not
implemented to the advertised deadline. Penalties can be either modulated by the
delay or also be a fixed amount like the pre-qualification deposit, whereby
penalties are harder to collect than pre-qualification payments e.g., when the
bidder goes bankrupt. But they both have the same incentive structure to realize
the submitted offer (del Rı́o & Linares, 2014; Matthäus, 2020).
In general, penalties can be set for all defined requirements and are a leading
instrument to ensure the accomplishment of the project. It can encourage a
detailed analysis forehand to align the priorities of the regulators with the bidders.
For example, if there is a penalty on the contracted production amount, the
investors will pay more attention to accurate production possibilities. Therefore,
Page 25aggressive bidding and underbuilding can be avoided (Atalay et al., 2017;
Matthäus, 2020). Examples of implementing penalties are illustrated in section
5.1.4, by Russia and Turkey.
Entry barriers
Criteria regarding the participants can also be set in advance, in form of an entry
barrier to take part in the bidding process, or as selection criterion for the winning
bid (IRENA, 2017). The design trait entry barriers can be clustered into physical
and financial pre-qualification. Physical pre-qualifications are non-financial
criteria that enable a participation and can e.g. be premises regarding the
construction like building permits, land property, conduction or feasibility studies
etc., which indicate the capability and determination of seriously deliver the offered
bid. Financial pre-qualifications require upfront payments from the bidder to
the auctioneer, to generate a liability of realization, as the deposit is not refunded
if the offered outcome is not delivered (Matthäus, 2020; del Rı́o & Linares, 2014).
Additional financial and technical support
Other supporting mechanisms or complementary policy measurements can be
additional financial support for auction participants like soft loans, where bidders
are granted a loan to fulfil their project. Especially in developing countries
international organizations and financial institutions like the World Bank play a
significant role in financing costs or providing technical support, to reduce
participation risks and increase the competition level (del Rı́o, 2017). This is going
to be exemplified in section 5.1.7, by international organizations supporting
countries like Ethiopia, Egypt or Nigeria.
With the presentation of the functional process and the possible design elements,
the following section 3.3 will summarize the benefits and drawbacks of auction
schemes.
Page 263.3 Advantages and disadvantages
Given the choice between the fundamental different approaches, introduced in
section 2, there are some trade-offs that need to be considered when choosing a
support scheme. A few aims of an auction are for example transparency, low prices
or the strengthening of regional energy markets. Whereas underbuilding,
underbidding and delays can lead to ineffectiveness (IRENA, 2017). The following
section will give an overview of the main advantages and disadvantages of quantity
driven auction schemes, clustered by stakeholders.
3.3.1 Advantages
As already mentioned in section 2, the main advantage of quantity driven support
systems is the certainty regarding the quantity that is supported (del Rı́o & Linares,
2014). This benefits the regulator, who has direct control over the volume of
energy as well as the costs that are subject to support by the auctions.
Additionally, penalties for not fulfilling a power purchase agreement, can further
help to increase the certainty of supply (IRENA & CEM, 2015). But the volume
control is not only crucial for energy security, but also for creating a competitive
market, which is not overcompensated as it can occur in price-driven schemes (del
Rı́o & Linares, 2014).
Furthermore, tenders can create transparency in a field that is dominated by
asymmetrical information, as real costs and prices can be discovered through the
bids (del Rı́o & Linares, 2014). The flexible design helps reducing the information
gap between project developer and regulator, which helps adapting in such a
dynamic market driven by technology cost decreases and a maturing industry
(IRENA & CEM, 2015). Due to the price competition among the participants, cost
efficiency can be improved as industry costs will become visible. Nevertheless,
bidders may also take advantage of a competitive position and add an extra charge
on the price which is still competitive but does not represent the real development
costs (IRENA, 2017). Anyhow here regulators are taking the role of a public
information source, that provides data on the auction and the market. This input
can help improve the sector, as asymmetric information is reduced (del Rı́o &
Linares, 2014).
Page 27The described benefits were mainly concentrated on the regulator and the market,
but also renewable energy producers profit from the instrument. The regulated
framework of auctions offers, with PPAs, guaranteed revenues over a certain time
for renewable energy producers. This reduces the financial risks for the investors
and gives them certainty regarding prices independent form changing market
conditions or policy landscapes (IRENA & CEM, 2015). Through the specific design
elements and rules of an auction, it is a very secure support mechanism as
renewable energy producers know the conditions for the defined contract duration
(Dobrotkova et al., 2018).
3.3.2 Disadvantages
As every policy mechanism, which facilitates renewable energy development,
auction schemes also bare disadvantages and require a competitive market and
well-developed RES technology with enough resources to be effective (Kitzing et
al., 2016).
As regulator there is an incentive that not only the tender process is successful,
but also the implementation of the renewable energy production. Therefore, it is
necessary to prevent negative effects of the bidding process to prevent falling
short on the aim of producing renewable energy. Researchers like Barroso, Kreiss
et al, del Rio and Linares and Matthäus found a variety of reasons that cause
ineffectiveness of auctions. Main reasons for not achieving the desired objectives
are complex auction processes, negligible participation, aggressive market entry
strategies and unreliable bids (Maurer & Barroso, 2011; del Rı́o & Linares, 2014;
Kreiss et al., 2017; Matthäus, 2020). Especially unreliable bids and underbidding
affect the desired goal of real price discovery, causing significant delays or
underbuilding of projects (IRENA, 2017). Underbidding occurs when an auction
participant submits very low bids, which do not allow a realization of the project.
This lack of realization is also named underbuilding, as the financial resources
granted through the auction are not sufficient for the completion (Shrimali et al.,
2016; Ocker et al., 2018).
Page 28Another argument against auctions from a regulators point of view, is that RE
producers are not getting the right market signals as operational efficiency is not
addressed through this policy mechanism. For example, producing more RE energy
in peak times or maintaining machines in lower demand seasons are not covered
in a direct manner within auctions (del Rı́o & Linares, 2014).
If we look at the energy producers, the main complaint about auctions is the high
level of bureaucracy. The complexity of the tender procedure and the bureaucratic
requirements induce higher transaction costs, which can detain possible bidders
from participating. Especially smaller companies, which do not have experience in
this field, are hesitant to take part. This could hamper the competition and is also
giving a small number of participants a high opportunity for market power (del Rı́o
& Linares, 2014). Moreover, long-term power purchase agreements are criticised
for the long duration between tenders as well as the high competition level, which
does not provide market stability or economic viability (Lewis & Wiser, 2007).
Table 6 summarizes the addressed advantages and disadvantages, clustered by
stakeholders. As the table shows, there are more benefits for the regulator, who
represents society and especially consumers. Del Rio & Linares (2014) argue that
other industrial market players like developers, investors or producers are not
necessarily better off with this policy measure and are therefore not in favour of
it. Since these groups have a better lobby with a higher bargaining power to
prevent the implementation of auction schemes, this could be a reason why it was
not that common over the years (del Rı́o & Linares, 2014).
Table 6: Overview on advantages and disadvantages for stakeholders
Stakeholder Advantages Disadvantages
Regulator • Secure energy supply • Higher transaction costs
• Budget control • Market power in case of
• Real price discovery few participants
• Adaption to market • Low efficiency of RE
development production and
• Active shaping of the maintenance
power market
Page 29RE energy producer • Price certainty over a • Low profitability through
fixed time period low prices
• Market information • Complex and bureaucratic
• Investment risk reduction mechanisms
Source: own illustration (Lewis & Wiser, 2007; Maurer & Barroso, 2011; del Rı́o & Linares, 2014; IRENA & CEM,
2015; Kreiss et al., 2017; Matthäus, 2020)
Summarized it can be said that quantity driven support schemes help make the
volatile electricity supply from renewable energy resources more predictable and
provide a certain budget control through a regulated setting and uncovered market
information (IRENA & CEM, 2015). But it can also miss the policy goal, through
complex processes and low competition (del Rı́o & Linares, 2014).
Concluding this chapter, it can be seen that policy makers have a vast toolbox on
creating an auction, that fits the local market. The difficult task here is to find the
right level of design elements. If the requirements are too high or too complicated,
one protects oneself against many eventualities, but also reduces the number of
participants; if the requirements are too low or too lax, it leads to high competition
and low prices, but carries the risk of underbuilding and delays. Regulators have
the challenging task of assembling regulatory options in a way that adapts to
domestic conditions and optimally stimulates the market. To investigate global
trends of renewable energy auctions worldwide, the next chapter 4 is providing a
market review to look at the development of the support scheme on a global scale.
Chapter 5 will than outline specific country cases contextualizing addressed design
elements and global trends on a granular level.
Page 304 Technology trends worldwide
There are different types of auctions, depending on the aims of the support
mechanism as well as on the design elements of the tender. The most common
differentiation between auctions is made through a focus on a certain type of
technology (technology-specific) or a particular generation area (site-specific)
from renewable energy sources (Atalay et al., 2017). The previous chapter 3
already outlined technology banding as an auction element, concentrating on
supporting specific renewable energy systems (del Rı́o & Linares, 2014). Now the
focus will be on the praxis, analysing global trends regarding to technology.
4.1 Supported technologies
On a global scale, most countries have implemented technology specific auctions,
as they can provide room for the parallel development of various technologies
(Mora et al., 2017). Haas et al. (2004), go even further and argue that technology
specific designs are crucial for the success of the policy, as market realities and
technological life cycles are addressed. Nevertheless, some countries are also
opening the tender for multiple sources in one tender, to foster competition among
different renewable resource technologies (Mora et al., 2017). Following scholar
Matthäus (2020), in auctions open to all sources mature technologies can
outperform others and receive most of the auctioned volume. This was one of the
reasons why in Italy from auctioned 500 MW only 5 MW were awarded to solar
power (Bellini, 2020b), see also section 5.2.2.
Having a look on various policy databases (IEA, n.d.; RES Legal, 2018) and
published papers (del Rı́o, 2017; Kruger et al., 2018), Table 7 gives an overview
on countries worldwide, that employed auctions, which are specific to various RE
sources. The last column additionally shows countries having experience in holding
auctions for more than one specific RE source and technology in one tender.
Overall, the table shows, that solar technologies are supported most frequently by
auctions, whereas there is yet no prominent focus set on geothermal technologies.
Page 31Table 7: Technology specific support in different countries
MULTIPLE RE
SOLAR WIND GEOTHERMAL BIOMASS HYDRO
SOURCES
Albania Albania El Salvador Argentina Brazil Argentina
Argentina Argentina Indonesia Brazil El Salvador Belize
Belize Belize Japan El Salvador Finland Brazil
Denmark Brazil Poland Finland France Costa Rica
Egypt Denmark Turkey France Guatemala Egypt
El Salvador Egypt Germany Japan El Salvador
Finland El Salvador Guatemala Lithuania Estonia
France Finland Japan Panama France
Germany France Lithuania Peru Germany
Greece Germany Moldova Poland Guatemala
Guatemala Greece Panama South Africa Honduras
India Guatemala Poland United Kingdom India
Indonesia India South Africa Uruguay Italy
Iraq Japan Spain Lithuania
Israel Kazakhstan United Kingdom Mexico
Italy Lithuania Netherlands
Japan Malta Panama
Kazakhstan Morocco Peru
Lithuania Netherlands Poland
Luxembourg Panama Russia
Malta Peru Slovenia
Morocco Poland South Africa
Nigeria South Africa Spain
Panama Spain Turkey
Peru Turkey United Kingdom
Poland Uruguay Uruguay
South Africa
Turkey
Uruguay
Zambia
Page 32Source: Own illustration referring to (IEA, n.d.; RES Legal, 2018; del Rı́o, 2017; Kruger et al., 2018)
Interestingly, there is only a small number of countries worldwide that offer
technology neutral renewable energy auctions (see Table 8), and are therefore
open to all renewable, and sometimes even non-renewable, energy producers. The
most interesting finding thereby is, that all of these countries are located in
Europe.
Table 8: Countries with technology neutral bidding regimes
technology neutral
Estonia
Finland
Lithuania
Moldova
Poland
Slovenia
Greece
Malta
Source: Own illustration referring to (IEA, n.d.; RES Legal, 2018; del Rı́o, 2017; Kruger et al., 2018)
Kitzing et al. (2016) relate the rare practice to the different market as well as
natural conditions of RES technologies within a country. They argue that supply
costs vary substantially between the technologies, and therefore do not back
technology neutral support systems (Kitzing et al., 2016).
In comparison Mora et al. (2017) also highlight the attractiveness of the
technology-neutral auctions for a higher number of participating bidders, which
increases the competition not only within one technology but across all RES-E
production. But they also state, that the related disadvantage to this kind of
auction method is, that only the most competitive or even mature technology will
win the bid. Taking this argumentation one step further, could also give less
mature technologies the incentive to advance and ultimately compete with others.
Nevertheless, this method is seen to be a future outlook in supporting
mechanisms, since Lithuania reached a zero bid (EUR 0/MWh) due to this approach
and is already planning on another similar auction (see also section 5.1.2).
Page 33To further derive geographical trends, Table 7 is categorized by continents, seen
in Figure 6. It illustrates the most popular technologies supported are solar and
wind energy. Wind is very popular in Europe, whereas Asian and African countries
have a clear focus on solar energy. Additionally, especially European countries put
an emphasis on the support of Biomass. According to IRENA (2017) the interest
on contracting bioelectricity capacity stems from its potential to contribute to base-
load electricity generation, rural economic development and waste management.
Moreover, it is also interesting that in comparison to other regions, countries in
Asia are also focusing on supporting geothermal technology systems with
renewable energy auctions, which could be a result of the natural resources (e.g.,
volcanic landscape in Japan and Indonesia). In terms of diversity and promoting
different kinds of renewable energy technologies America is a front runner as a
diverse set of technologies is supported simultaneously (IEA, n.d.; RES Legal,
2018; del Rı́o, 2017; Kruger et al., 2018).
Countries using technology specific RE auctions
Number of countries
16
14
12
10
8
6
4
2
0
Africa
Africa
Africa
Africa
Africa
Europe
Europe
Europe
Europe
Europe
Europe
America
Asia
Oceania
America
Asia
Oceania
America
Asia
America
Asia
America
Asia
America
Asia
Solar Wind Geothermal Biomass Hydro Multiple RE
Sources
Figure 6: Countries using technology specific renewable energy auctions
Source: Own illustration referring to (IEA, n.d.; RES Legal, 2018; del Rı́o, 2017; Kruger et al., 2018)
IRENA (2019) looks in Figure 7 at the global volume of 110,6 GW auctioned
between January 2017 and December 2018 and finds similar technology
preferences within these years. There is a clear global focus on the support of solar
PV (57,4 GW) and wind energy (49,6 GW), whereby solar PV and onshore wind
are promoted throughout all regions. The support of Biomass technologies is only
common in Europe and America, which can be linked to the complexity of the
underlying technology route and the used feedstock (IRENA, 2017). Interesting to
Page 34You can also read