Brave new world: quantifying the new instabilities and risks arising in subsecond algorithmic trading - Driver Review DR27
←
→
Page content transcription
If your browser does not render page correctly, please read the page content below
Brave new world:
quantifying the new
instabilities and risks
arising in subsecond
algorithmic trading

                 Driver Review DR27

              Foresight, Government Office for Science
Brave new world: quantifying the new instabilities and risks arising in subsecond
                                                                              algorithmic trading

Contents

1. Introduction .......................................................................................................................................3
2. Technological advances drive market behaviour into a new regime ................................................ 4
3. Typical financial market dynamics .................................................................................................... 6
4. Large subsecond changes with variable duration ........................................................................... 10
5. The new world of subsecond black swans ...................................................................................... 12
6. A new model for the ecology of subsecond markets ...................................................................... 23
7. Phase transition within model consistent with behaviour observed for subsecond black swans .... 29
8. Quantitative description of the extreme behaviour in the crowded algorithm regime ..................... 35
9. Consequences for next-generation risk management .................................................................... 38
10. Summary and outlook ................................................................................................................... 40
References ............................................................................................................................................42

                                                                          1
Brave new world: quantifying the new instabilities and risks arising in subsecond
                                                                          algorithmic trading

       Brave new world: quantifying the new
     instabilities and risks arising in subsecond
                  algorithmic trading
                              Neil Johnson and Guannan Zhao 1

    This review has been commissioned as part of the UK Government’s Foresight
       Project, The Future of Computer Trading in Financial Markets. The views
      expressed do not represent the policy of any Government or organisation.

1
  NFJ gratefully acknowledges the support of the UK Foresight program in preparing this document. He is also
grateful to Pak Ming Hui, Brian Tivnan, Eric Hunsader of Nanex and Paul Jefferies for a long-term research
collaboration on financial complexity, which provides the basis for the discussions in this paper.

                                             2
Brave new world: quantifying the new instabilities and risks arising in subsecond
                                                                         algorithmic trading

    1. Introduction
Looking to the next decade, there can be little doubt that computers will become increasingly
involved in the functioning of financial markets at all levels – from new smart-phone apps
aimed at individual investors, through to the mechanics of accounting and information transfer
in exchanges and financial institutions. The most dramatic impact is likely to arise at the
ultrafast, subsecond timescale: Operating beyond human response times, even relatively
modest computer trading platforms can already digest information that they have been fed,
take buy or sell decisions based on the internal algorithms that they have been given, and then
execute these trades, all before a human has had a chance to draw breath. It is this new world
that we explore in the present report.

This report shows that the behaviour of market prices within this subsecond world in which
computers can trade freely in real-time – but humans cannot -- is fundamentally new, and that
its understanding will require new sets of tools, new theoretical results, and new ‘rules of
thumb’ for both practitioners and regulators. One might counter-argue that since financial
markets have always tended to use the latest technologies, they have always been ‘fast’
compared to many other aspects of human life, and hence the subsecond world will just be a
faster version of the everyday market phenomena which we already know. However this report
shows that this statement is false. One might suggest that standard mathematical results
concerning risk calculations can simply be re-applied at this shorter timescale. Again this is
false. One might declare that financial instabilities on ultrafast timescales are not new -- after
all, the Flash Crash of 6 May 2010 indeed happened very quickly, being over within a few
minutes. However, such fast crashes are still in principle slow enough for humans to be directly
involved with the trading in real time. Given a big enough ‘stop’ button, a human operator could
in principle step in and stop such rapid buying or selling - even if it took place on the scale of a
few seconds. By stark contrast, the subsecond regime on which we focus here, lies beyond the
limits of human response times. Looking at detailed and reliable millisecond data recorded by
our collaborators at the US company Nanex (www.nanex.net), we instead show that new
breeds of extreme behaviour can – and have already started to -- emerge on the subsecond
scale, at timescales where no human can physically react, let alone think strategically. We
examine the properties of this new breed of behaviours, and use it to develop a broader
theoretical picture of what is likely to emerge over the next decade on the subsecond
timescale, and how such behaviours might be described theoretically using relatively simple
mathematical analyses. In addition to providing a quantitative interpretation of the subsecond
price behaviour to date, our proposed theoretical framework suggests that this new subsecond
machine regime can be usefully seen as an ecology of competitive trading machines, fighting it
out on the millisecond scale, and hence is entirely consistent with the ecological perspective of
Farmer and Skouras (2011). Our findings are also remarkably consistent with the detailed and
careful studies of Cliff and co-workers (De Luca et al. (2011). Our model framework is also
fairly consistent with the idea of financial instability proposed by May and Haldane (2011),
though not in substance and on a completely different timescale.

The main implication of this report’s findings, in addition to the specific technical deliverable of
a framework for understanding and even estimating future behaviours as a function of the
algorithmic diversity etc., is that the behaviour at these subsecond timescales is not simply a
faster version of what is happening on timescales above one second. This in itself is surprising
since the approximate self-similar nature of financial market price movements on larger
timescales is now well-established: To a reasonable approximation, the patterns observed over
                                          3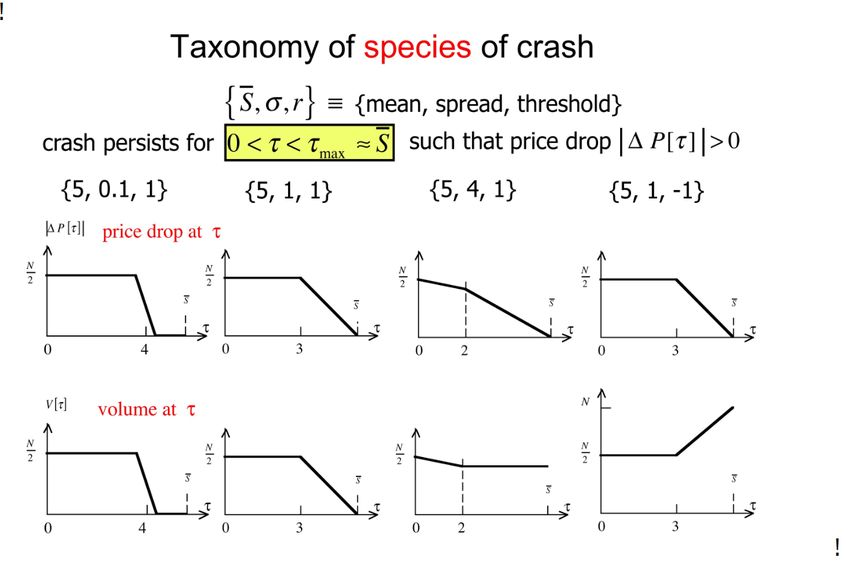
Brave new world: quantifying the new instabilities and risks arising in subsecond
                                                                         algorithmic trading

months are similar to those over weeks, which are similar to those over days etc. We find that
this is not the case as one moves through the subsecond time barrier beyond which only
machines can operate. The self-similarity stops abruptly, with a fundamental system-wide
transition arising near the limits of human response times (approximately 600-800 milliseconds,
Liukkonen (2009) and Saariluoma (1995)). Indeed, instead of simply postulating the ‘rise of the
robots’, we are able to actually observe the signatures of this fundamental transition in the
data.

The accompanying model that we present is simple in form – indeed it is a deliberately
oversimplified representation of what is effectively the world’s largest technosocial system. Yet
its ability to reproduce a fundamental transition akin to the one we uncover in subsecond price
behaviour, suggests that it is capturing some essential ingredients of the complexity arising in
populations of machine-like trading objects, as they operate on very short timescales without
direct human intervention. We show that the emergent properties of this model system (e.g.
price volatility) are relatively simple to formulate mathematically, and yet offer concrete
quantitative predictions of how instabilities will likely develop as a function of the physical
variables in the system – from the intrinsic memory of the machines through to their diversity in
terms of trading algorithms. It is this quantitative picture of an ecology of machines which we
believe will prove useful to both regulators and participants over the next decade, and which
can provide a solid platform for a new generation of financial derivative and risk models. We
outline how this can be done in the penultimate section of this report.

    2. Technological advances drive market behaviour into a new
       regime
The potential benefits to a financial entity of having an advantage over a competitor are so
large, and worth so much money, that competition within the financial markets alone should
drive technological developments quickly toward the microsecond and even nanosecond
operating timescale over the next decade (Haldane (2011), Perez (2011)). Such competition-
driven speed-up did arise in the past – however, what is remarkable now is that these
technologies are set to push hard up against the physical limitations of the laws of nature in
terms of the ultimate speed limit, which is the speed of light, and the laws of quantum physics
in terms of the physical switching of logic gates or transistors. For example, a new dedicated
transatlantic cable is being built just to shave 5 milliseconds off transatlantic communication
times between US and UK traders (Popular Mechanics (2012)) while a new purpose-built chip
iX-eCute is being launched which prepares trades in 740 nanoseconds (Wall Street Journal
(2011)).

But perhaps most interesting as a sign of things to come, are the new hybrid ventures
beginning to spring to life, involving collaborations between traders, engineers and basic
scientists, with the aim of pushing both the financial and physical boundaries for trading. This
includes the re-emergence of traders and fund managers who were themselves previously
doing cutting-edge research in electromagnetic theory for signal propagation. One U.S.
example is a new venture (see http://www.mckay-brothers.com/about-us/) co-founded by Dr.
Bob Meade, a Harvard PhD in theoretical physics who previously did internationally leading
research at MIT into the speed of electromagnetic radiation in particular types of smart media,
producing several patents before switching to a career in finance. After heading the derivative
research group at JPMorgan and then quant-trading Fleet Bank’s Robertson Stephens
investment bank, he ran a High Frequency Trading group at Ronin Capital before co-founding
McKay Brothers. The McKay Brothers initiative aims to link the stock market trading in Chicago
and New York using electromagnetic technology in the microwave spectrum, operating at
                                         4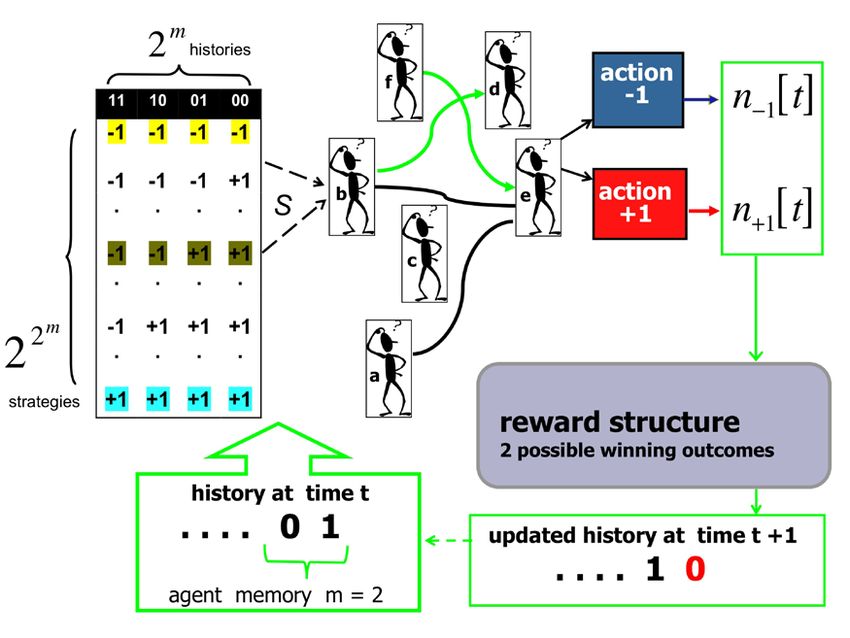
Brave new world: quantifying the new instabilities and risks arising in subsecond
                                                                         algorithmic trading

speeds faster than fiber optic transmission can deliver. Their main competitor, Spread
Networks, operates fiber optic links and is reported to have spent 300 million dollars developing
a low latency connection, which will soon be outstripped by McKay Brothers’ microwave
routing. This type of initiative, which manages to simultaneously be creative financially and
scientifically, is likely to become the norm over the next decade rather than the exception, with
other such hybrid examples arising across the globe. In the end, the pressure to succeed will
drive speeds down toward their physical temporal limits in the same way that Moore’s Law
drove processor sizes down to their physical spatial limits. Since it ultimately only requires the
presence of machines, not people, to profit from these reductions in latency, this trend toward
increasingly fast and increasingly automated systems will likely continue unbounded (Haldane
(2011)).

These technological developments raise important questions about the future added value of
existing financial centers such as London. From a purely technological point of view, it would
make perfect sense to site hubs of microwave information flow (as required in the McKay
Brothers proposal) at isolated sites with little electromagnetic interference, and hence away
from major cities -- particularly if the information is being transferred through microwaves in the
open air. Dense co-location hubs built around optic fiber communications, such as those
recently built in Essex so that they are close to London’s East End financial area, would also
become redundant because of optic fiber slowness compared to a raw microwave link.
Regardless of the eventual winning technology for establishing fast communication links
between computers, it is clear from the above discussion that as communications become
faster, so too will the competition between companies to develop faster trading machines. As
this competition to build faster machines hots up, the relevant timescale for significant volumes
of trade will move beyond the millisecond scale toward the microsecond and even nanosecond
scale.

Looking to the future, however, one might also argue that while the number and speed of
subsecond scale trading machines is set to increase rapidly, the diversity and complexity of
their trading algorithms may not necessarily match this rapid increase. On ultrafast subsecond
timescales, the information concerning recent price movements needs to be assimilated quickly
by the machine, then the trading algorithm run, then the trading decision implemented. Hence
there may end up being a practical limit to the amount of complexity that a trading algorithm
can have. Given the short timescale requirement for a trade to be made, one could argue that
the number of lines of code, as well as the number of data look-ups, matrix manipulations,
iterative loops etc., will be restricted in order that the code can run quickly, efficiently and yet
remain manageable and explainable – in other words, a complex code that takes too long to
run, debug, and explain to the company’s risk manager, may simply be impractical. This would
act as a natural restriction in diversity which – when combined with the fact that similar ‘hot’
ideas can proliferate throughout trading circles at any one time as a result of a common pool of
employment, similar background training and trade magazines, as well as attendance at the
same conferences -- suggests that the same type of trading algorithm (or even the exact same
algorithm) could inadvertently become part of the trading repertoire of a significant number of
otherwise unconnected trading institutions. Given the natural secrecy of financial institutions,
such inadvertent posession of similar strategies would go unnoticed and uncorrected. Should
conditions then become favourable for use of a given algorithm, a significant fraction of all
market participants would switch to it around the same time. The resulting ‘crowd’ effect, by
which the trading algorithms of many trading institutions suddenly become similar or even
identical, will (as we show later in this report) produce large movements in the market on the
subsecond timescale. Moreover this will likely continue to happen in a way that is not seen at
longer timescales where humans become actively involved in real-time trading, and hence

                                          5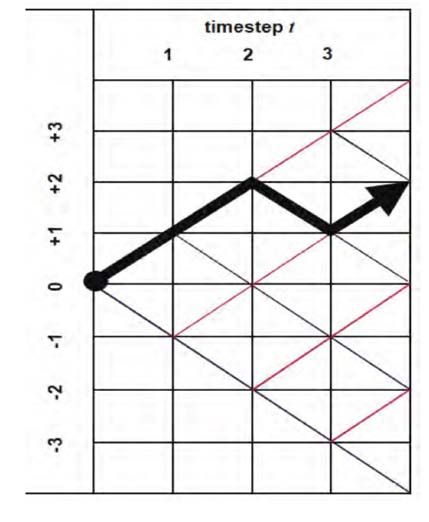
Brave new world: quantifying the new instabilities and risks arising in subsecond
                                                                         algorithmic trading

where the natural diversity of human decision-making and ‘free will’ will tend to greatly expand
the space of possible strategies, thereby diluting any such crowding around a given
deterministic (algorithmic) trading strategy.

This report provides evidence to suggest that such algorithmic crowding is already happening
on the subsecond scale, and our accompanying model provides a theoretical description of the
likely knock-on effects on price volatility. Specifically, we develop a quantitative expression for
how market fluctuations are likely to vary according to future computer algorithm diversity. We
also present quantitative results for the market volatility that is likely to emerge under such
crowded conditions, i.e. where multiple algorithms with essentially the same composition are all
in use at the same time. We look at how the resulting market behaviour takes the system well
away from the typical regime of a near-random walk (see Fig. 1) characterized by a near-
Gaussian, albeit fat-tailed, distribution (see Figs. 2 and 3) and hence nearly perfectly hedgable
derivative contracts following a Black-Scholes type risk analysis (Bouchaud and Potters (2003),
Johnson et al. (2003)). Instead it launches the market toward a new regime in which a new
class of risk calculation must be developed. We suggest an alternative measure of the risk for
this new subsecond, machine-driven regime in the presence of finite latency. Our empirical
evidence and support comes in the form of subsecond extreme events in the stock time-series
across stock and exchanges between 2006 and 2011, with the total number of such events
undergoing a huge increase through the period of global market instability in the latter part of
2008.

    3. Typical financial market dynamics
In order to differentiate these new market price dynamics which arise in the subsecond regime,
we need to briefly review the ‘usual’ dynamics of financial markets on longer timescales. There
are of course many hundreds, or even thousands, of econometric reports concerning the
properties of stock price movements (see, for example, Campbell et al. (1996) and references
within, as well as Bouchaud and Potters (2003) and Johnson et al. (2003)). Indeed, the goal of
characterizing the movements of financial markets on the scale of years, months, weeks, days
- and most recently, hours, minutes and seconds -- has been the long-term focus of academics
and practitioners for many decades. It is a basic truth of science that in order to observe, and
hence ultimately understand the nature of, objects of a certain size, a microscope is required
with a resolution which is at least one order of magnitude greater -- in order to be able to
distinguish detail from the blur. This principle applies not only to objects which are small in
terms of spatial size, but also for events that only last a small amount of time. A sports
photographer looking to capture a picture of a football flying into a goal, requires a shutter
speed many times faster than the time-of-flight of the football. The finite resolution on which we
examine a system, necessarily restricts the range of phenomena that we might see, and
automatically rules out the part of the spectrum of behaviours for which the analysis method is
too slow. The same applies to financial market behaviour: It is only as data become recorded in
an accurate way on increasingly small timecales – from weeks to days, to hours, minutes and
seconds – that increasing insight can be gained. Indeed, it is the ability of the company Nanex
to capture and reliably store time-stamped stock price data on the millisecond scale, that has
made the present study possible (see www.nanex.net).

Although the passage of time from years to months, to weeks and days, differentiates between
many human activities (e.g. annual vacation rest as opposed to nightly sleep), it turns out that
financial market trading patterns – at least to a reasonable approximation – show a remarkable
degree of self-similarity in terms of their price behaviour (e.g. Bouchaud and Potters (2003),
Mantegna et al. (1995), Johnson et al. (2003), Gabaix et al. (2003)). More recent analysis has
                                          6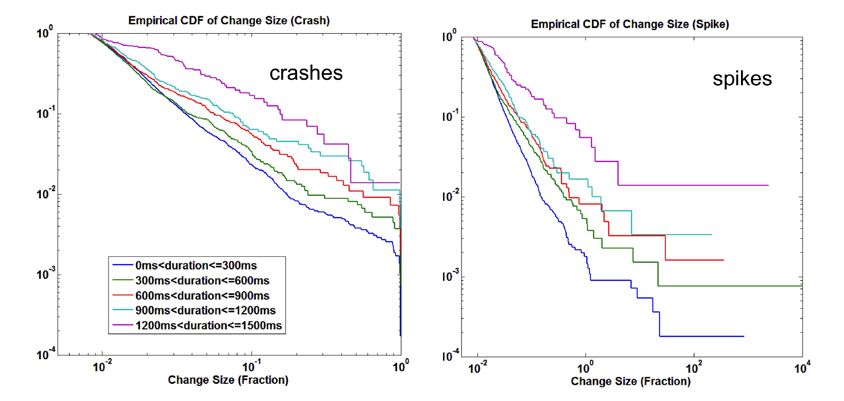
Brave new world: quantifying the new instabilities and risks arising in subsecond
                                                                          algorithmic trading

shown that the price series is actually even more subtle than this simple self-similar view, and
instead exhibits multifractal characteristics -- however, in order to explain the concept, we stick
with the simpler fractal version here. If one looks at the price chart of a typical liquid stock,
stripped of its time units on the horizontal axis and price units on the vertical axis, it is difficult to
tell by eye whether the chart referred to price-changes by month, by week, or by day. Recent
work by Preis and Stanley has shown that this approximate self-similarity in price charts can
also exist on shorter timescales, down to the typical second scale (Preis et al. (2011)), although
we note that more recent work by Filimonov and Sornette casts doubt on these authors’
analysis (see http://arxiv.org/abs/1112.3868 for details of this debate). The broad feature
whereby scale does not seem to matter, is called a statistical fractal and means that the pattern
of price movements is approximately scale independent in the same way that the coastline of
Britain is scale independent, as well as a whole set of other phenomena from the natural world
(Bouchaud and Potters (2003)). In reality, no perfect fractal exists due to finite size effects, e.g.
eventually the coastline of Britain is bounded by the size of the island itself -- but the point is
that this self-similarity holds approximately over a wide range of scales, from months to weeks
to days etc. The resulting distribution of price-changes then tends to be fat-tailed. This means it
is not Gaussian as one would expect for a random walk as in Figs. 1 and 2, however nor is it a
perfect power-law, as in the specific case of the Lorentzian in Fig. 2. Instead, it tends to lie
between the two, as shown explicitly for the Shanghai stock index in Fig. 3. Other stock
markets produce data with distributions that are remarkably similar (Bouchaud and Potters
(2003)).

Figure 1. Random walk model of financial price movements, with price on the vertical
axis and time on the horizontal axis. Although this coin-toss incarnation or price
movements is far simpler than many versions used in practice, it illustrates the basic
principle of markets being described by ongoing stochastic changes in the price as
opposed to some more microscopic, yet physically realistic model, comprising a
population of trading agents. The price changes here all occur for a given pre-
determined time-interval (i.e. one timestep may be 1 hour, or 1 day etc.).

                                             7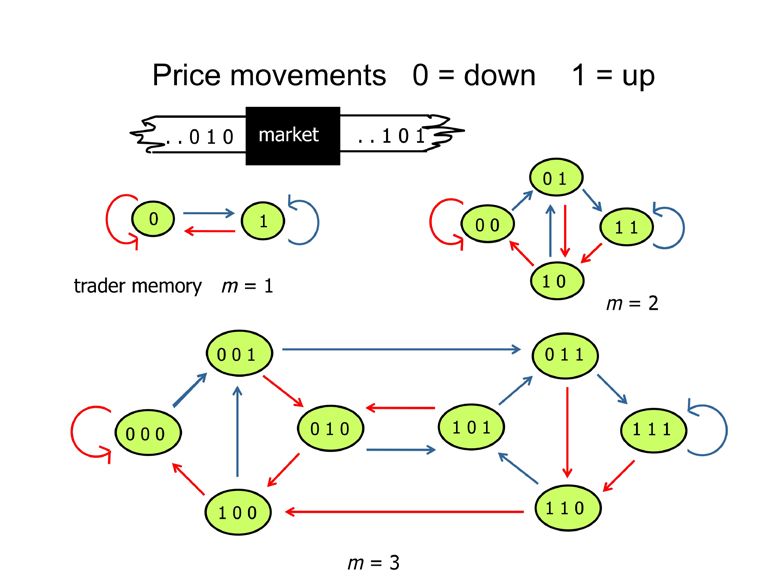
Brave new world: quantifying the new instabilities and risks arising in subsecond
                                                                          algorithmic trading

Figure 2. Gaussian vs . Lorentzian distribution for price-changes in a financial market,
i.e. returns. The Lorentzian, as shown, behaves like a power-law in its tail (i.e. as x
becomes large) since it varies as the inverse square of x and hence has an exponent of
value -2. It is therefore referred to as a ‘fat-tailed’ distribution, whereas the Gaussian is
not since it decays exponentially and hence far quicker as x increases.

In addition to traditional studies of market prices, sophisticated quantitative descriptions have
emerged recently from the new field of ‘econophysics’ (see www.unifr.ch/econophysics)
although such efforts have met with some resistance from encumbant finance researchers.
Economists studying financial market fluctuations might rightly point to the detailed GARCH-
type models and generalizations that have already been developed outside the econophysics
field (Campbell et al. (1996)). They might also complain of the new invaders’ frequent lack of
detailed referencing to past economics papers. Financial mathematicians might themselves
claim huge strides in the development of complex stochastic models aimed at describing the
pricing of risk associated with the burgeoning derivatives markets. Exotic options have for
some time been priced using elegant mathematics, which may involve complicated jump
processes and also memory in the time-series itself.

In their defense, econophysicists -- who are literally physicists trained in the theoretical tools of
statistical mechanics in physical systems -- might in turn claim that they do indeed reference
existing finance papers when they are relevant, but that they are actually trying to focus on
aspects of market complexity which are not addressed by economists or by financial
mathematicians (Bouchaud and Potters (2003)). They have a point: the domain of the physicist
is one in which real-world data takes center-stage as representing the best ‘measurement’ of
the system, and hence the best indicator of what is actually going on inside the system -- and
hence the goal of any market study should be to analyze the properties of the data, identify any
generic common patterns, and then build a model which is consistent with these observed
features. This approach, which has after all worked well for physics since the time of Sir Isaac
Newton, involves a continual iteration between more refined measurements, model
development, output prediction and model adjustment. In the econophysics domain, the

                                          8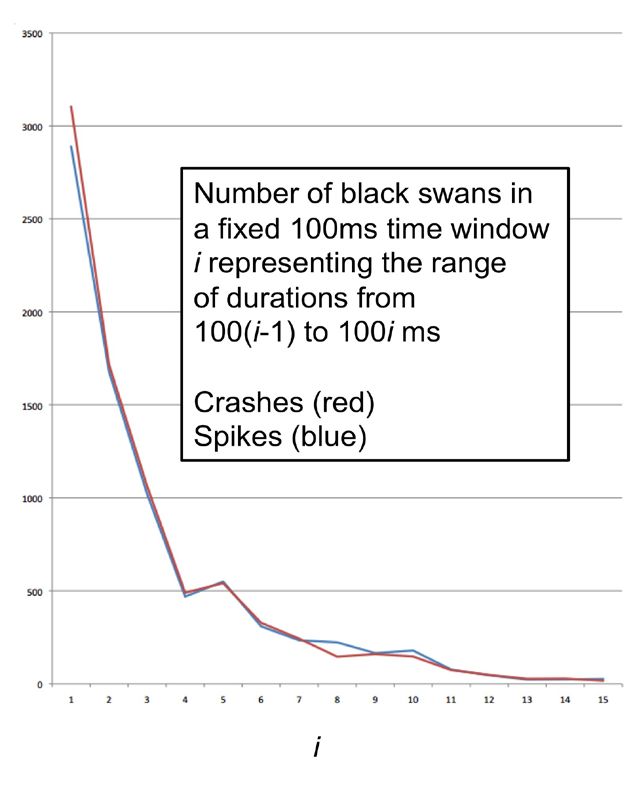
Brave new world: quantifying the new instabilities and risks arising in subsecond
                                                                         algorithmic trading

resulting ‘model’ tends to comprise a population of physical pieces which would include both
humans and machines in principle – as opposed to some statistical ‘model’ based on a uni- or
multivariate description in which the parameters have no clear meaning in terms of the
microscopic workings of the system. Going further, the econophysicists would argue that a
sensible approach to understanding markets is to observe the data, deduce the characteristics
of the data that are explicable and those that are surprising and/or inexplicable, and then
develop a model with minimal parameters and details but maximal insight, through a process of
model modification and iterative comparison with the data. A paper plane hence becomes a
good model to explain flight, while a child’s plastic model (which has seats, and dolls as
passengers) cannot fly and hence is not. Since the future behaviour of financial markets in the
presence of computer trading, is essentially unknown and yet data is now available, we tend to
adopt the econophysicist philosophy in this review, i.e. we seek to analyze the subsecond data
in order to deduce some stylized facts. Then we develop a minimal model which has a
plausible micro-level interpretation, in order to reproduce these stylized facts, and hence infer a
reasonable scenario for what might actually be going on in the market on this timescale.

Figure 3. Distribution of price returns z for Shanghai market data, for timescale ∆t =1
seconds (i.e. second-by-second price-changes). Also shown is a power-law (so-called
Levy) distribution for comparison purposes. The agreement is very good over the main
central portion, with deviations for large z . We show two attempts to fit a Gaussian: The
wider Gaussian is chosen to have the same standard deviation as the empirical data,
however the peak in the data is much narrower and higher than this Gaussian and the
tails are fatter. The narrower Gaussian is chosen to fit the central portion. However the
standard deviation is now too small. The data has tails that are much fatter and
furthermore have a non-Gaussian functional dependence.

                           −1
                         10
                                                                    Shanghai index
                                                                    Levy distribution
                                                                    Gaussian distribution
                                                                    Gaussian distribution
                           −2
                         10
                  p[z]

                         10−3

                           −4
                         10

                           −5
                         10
                          −0.0003   −0.0002   −0.0001      0       0.0001     0.0002        0.0003
                                                        return z

Most studies of stock market movements look at a time-series of price changes, and then chart
the distribution or correlations for a fixed time increment (e.g. price-change from day to day).
By contrast the study of extreme behaviours and events – which we turn to in the next section -
- has been more traditionally the domain of the insurance and risk field. More recently, there
                                           9
Brave new world: quantifying the new instabilities and risks arising in subsecond
algorithmic trading
has been a move to correct this: e.g. works by Sornette (2009) and co-workers as well as
multiple studies in the area of Extreme Value Theory (Bouchaud and Potters (2003)). However,
very little of this work looks for a mechanistic explanation of what is going on prior to, and
during, such extreme events. This might be somewhat acceptable if one takes the stance that
such events are so rare that they are not worth worrying about – however this is not the case
since their effects can be long-lasting. Indeed, the extreme behaviours that we show in the rest
of this report as arising in the subsecond regime beyond human response, are rare on the
scale of milliseconds -- however, there are so many millisecond intervals during a day that we
end up finding approximately ten such extreme behaviours per day in the data.
4. Large subsecond changes with variable duration
The problem with many studies of financial price changes – such as those outlined above and
shown in Fig. 3 -- is that they adopt a fixed, pre-determined time increment over which to
determine price changes (e.g. 1 day). A fixed time increment is unable to capture the wide
variety of shapes and durations of extreme behaviours exhibited by financial markets. This is
particularly true of the subsecond extreme events discussed in the rest of the article, and
shown explicitly in Figs. 4(a) and 4(b). Indeed, extreme behaviours are often referred to as
extreme ‘events’ on the assumption that they have a well-defined change (e.g. price-
change) in some macroscopically measurable quantity x (e.g. stock price) occurring at a
particular point in space (e.g. Dow Jones) and time (e.g. at 10am), over a specific time-
interval (e.g. 1 hour). If this idealization is indeed the case, then histograms can be obtained
using historical data and approximate point probabilities deduced. However, as emphasized by
Sornette (2009) extreme behaviors in principle invoke an entirely different layer of difficulty,
because (1) they do not have a well-defined duration ∆t , and hence may be missed when
evaluating histograms of changes for a particular fixed, pre-defined time increment (e.g. 1
minute, 1hour or 1day); and (2) even if their duration and maximum size are well defined,
they can take on an effectively infinite number of possible temporal profiles during that period,
i.e. has its own characteristic time-dependence during ∆t . Hence for a given maximum drop
size and duration ∆t , there are a priori myriad possible temporal forms of versus . Such
extreme behavior represents a fascinating departure from ‘typical’ behavior, and helps highlight
the failings of mean-field theories upon which most of our quantitative descriptions of financial
and natural systems are currently built.
A quick consideration of what makes a system complex, provides insight into the properties of
a system which enable it to exhibit extreme behavior of the type observed on the subsecond
scale in the markets in Fig. 4. Consider the outcome from tossing N coins. Assigning 1 as
heads and -1 as tails, the famous Central Limit Theorem (CLT) guarantees that the net
outcome value approaches a normal (i.e. Gaussian) distribution as . Such a normal
distribution has an infinitesimally small probability of showing any extreme behavior (i.e.
99.73% of outcomes lie within three standard deviations from the mean), hence there is
negligible likelihood of approximately N heads appearing as N → ∞ .
By contrast, real-world extremes, such as market crashes larger than three standard
deviations, are far more common (Bouchaud and Potters (2003)). This relative abundance of
extreme behavior in the real world (e.g. stock crashes) as opposed to a coin-toss world,
suggests that real-world systems represent the effective opposite of a collection of independent
stochastic processes. Indeed, current thinking within the scientific community suggests that for
extreme behaviors to arise with appreciable frequency, the system needs to exhibit collective
behavior – for example, crowd effects in a system comprising a population of N interacting
10Brave new world: quantifying the new instabilities and risks arising in subsecond
algorithmic trading
objects which may adapt to past outcomes using the feedback of information, while continually
competing to win. It is this idea that we will develop into a fuller model of the crowding of
computer algorithms later in this review.
Figure 4. Traded price during black swan events. (a) Spike. Stock symbol is SMCI. Date
is 10/01/2010. Number of sequential up ticks is 31. Price change is +2.75. Duration is
25ms (i.e. 0.025 seconds). Percentage price change upwards is 26% (i.e. spike
magnitude is 26%). Dots in price chart are sized accordingly to size of trade. (b) Crash.
Stock symbol is ABK. Date is 11/04/2009. Number of sequential down ticks is 20. Price
change is -0.22. Duration is 25ms (i.e. 0.025 seconds). Percentage price change
downwards is 14% (i.e.crash magnitude is 14%). (c) Cumu;ative number of crashes (red)
and spikes (blue) compared to overall stock market index (Standard & Poor’s 500)in
black, showing daily close data from 3 Jan 2006 until 3 Feb 2011.
11Brave new world: quantifying the new instabilities and risks arising in subsecond
algorithmic trading
5. The new world of subsecond black swans
We now discuss the emergence of a fundamentally different regime of financial market
behaviour on the subsecond scale. Our findings are surprising since one might have imagined
that a move to subsecond timescales would simply reveal faster versions of the same
phenomena that one observed at larger timescales. In particular, given that markets are known
to have an approximate self-similar structure, in that the movements on the scale of months
look like an expanded version of the movements on the scale of weeks, and the movements on
the scale of weeks look like an expanded version of the movements on the scale of days, and
so on, one might think we would simply get more of what we already now – it might just come
and go more quickly, and possibly be accompanied by an increase or decrease in intensity
depending on details of the system. However the subsecond timescale is different for a
fundamental reason: At every timescale above a second or greater, a human trader – if
sufficiently attentive – can in principle intervene in an automated trading system, no matter how
complicated, by hitting a ‘stop’ button on the trading machine or even cutting the power.
However, this does not hold for the subsecond timscale: Instead it takes a chess grandmaster
approximately 650 milliseconds just to realize that she is in trouble (i.e. her king is in
checkmate), without any physical action (Saariluoma (1995), Liukkonen (2009)). In many other
areas of human activity, the quickest that someone can notice such a cue and physically react,
is approximately 1000 milliseconds (1 second). The relevance of this subsecond timescale in
financial markets would be relatively minor if it were not for the fact that this regime is already
populated by computers which can operate this fast, even though the human participants
cannot.
For reasons given in the previous section, it does not make sense to analyze extreme
behaviours in this new ultrafast machine regime in terms of price-changes for a given fixed time
increment. Instead we will analyze the size and duration of the extreme events themselves
(see Fig. 4). Specifically, our collaborators at Nanex undertook a search for ultrafast extreme
events in a high-throughput millisecond-resolution stream of prices for multiple stocks across
multiple exchanges between 2006-2011. This data includes all financial and non-financial
company stock, and looks across all major exchanges such as Nasdaq Exchange (NQEX),
New York Stock Exchange (NYSE), American Stock Exchange (AMEX), Boston Stock/Options
Exchange (BOST), Chicago Stock Exchange (CHIC), through to the Winnipeg Commodity
Exchange (WCE) and the London Stock Exchange (FTSE). We refer to the documentation at
www.nanex.net for details of specific extreme events within individual markets and stock. As
shown by Fig. 5, there is a rapid explosion in the total number of subsecond events within a
given duration range, as we move to smaller durations.
Figure 5. Number of black swan events with duration within a given 100ms time-window,
as a function of the time-window label. For example, the first (i=1) entry on the horizontal
axis shows approximately 3000 black swans with durations which lie between 100(i-
1)=0ms and 100i=100ms. Likewise, the second (i=2) entry on the horizontal axis shows
approximately 2000 black swans with durations which lie between 100(i-1)=100ms and
100i=200ms, etc. The number of black swans within each bin decreases rapidly as the
bin index i (and hence the black swan duration) increases. The number of black swans
with small durations (e.g. 200ms) is therefore much larger than the number with larger
durations (e.g. 1200ms). The duration of the black swan crash or spike, is simply the
length of time (i.e. clock time) during which the price ticked down or up respectively.
12Brave new world: quantifying the new instabilities and risks arising in subsecond
algorithmic trading
Since the clock time between ticks varies, the duration of a crash or spike with the same
number of ticks can vary considerably, as shown.
13Brave new world: quantifying the new instabilities and risks arising in subsecond
algorithmic trading
For convenience, we use the popular term ‘black swan’ (Taleb (2010)) for each extreme event.
We might also usefully refer to them as ‘fractures’ given their visual similarity to microscopic
fractures in a material. For a large price drop to qualify as an extreme event (i.e. black swan
crash) the stock price had to tick down at least ten times before ticking up and the price change
had to exceed 0.8%. For a large price rise to qualify as an extreme event (i.e. black swan
spike) the stock had to tick up at least ten times before ticking down and the price change had
to exceed 0.8%. The duration of the black swan crash or spike, is simply the length of time (i.e.
clock time) during which the price ticked down or up respectively. Since the clock time between
ticks can vary considerably according to issues such as liquidity, the duration of a crash or
spike can also vary considerably, even if the number of down or up ticks is fixed.
In order to explore timescales which go beyond typical human reaction times, we focus on
black swans with durations less than 1500 milliseconds. We uncovered 18,520 such black
swan events, which surprisingly is approximately ten per trading day on average. Figure 4
illustrates a spike (Fig. 4(a)) and crash (Fig. 4(b)) from our dataset, both with duration 25
milliseconds (0.025s), while Fig. 4(c) suggests a systemic coupling between these sub-second
black swan events in individual stock (blue and red curves) and long-term market-wide
instability on the scale of weeks, months and even years (black curve) – in particular, in relation
to the global financial crisis starting in 2008. Each black swan feature in Figs. 4(a) and 4(b) is
huge compared to the size of the fluctuations either immediately before or after it, while the
quick recovery from the initial drop or rise probably results from an automatically triggered
exchange response or predatory computer trades. The coupling in Fig. 4(c) across such vastly
different timescales is made even more intriguing by the fact that the ten stock with highest
incidences of ultrafast black swans are all financial institutions -- and yet it is financial
institutions that have been most strongly connected with the late 2000’s global financial
collapse (e.g. Lehmann Brothers filing for Chapter 11 bankruptcy protection on 15 September
2008). This suggests an analogy to engineering systems where it is well known that a
prevalence of micro-fractures can accompany, and even precede, large changes in a
mechanical structure (e.g. tiny cracks in a piece of plane fuselage which then eventually breaks
off). As shown in Fig. 5, our dataset shows a far greater tendency for these financial fractures
to occur, within a given duration time-window, as we move to smaller timescales, e.g. 100-
200ms has approximately ten times more than 900-1000ms. The fact that the instantaneous
rate of occurrence of spikes and crashes is similar (i.e. blue and red curves are almost identical
in Fig. 4(c)) suggests that these ultrafast black swans are not simply the product of some
pathological regulatory rule for crashes. An immediate implication of these observation in Fig.
4(c) for regulators is that extreme behaviors on very short (i.e. s) and long timescales (e.g. 1
year, or s) cannot a priori be separated: In particular, a large change in the behaviour on
the monthly scale as in Fig. 4 can be accompanied by an explosion in the number of
subsecond instabilities (black swans) on the subsecond scale (see Fig. 4(c)). This coupling
between long and short timescales means that rules targeted solely at controlling ultrafast (e.g.
subsecond) fluctuations can induce unexpected feedback effects at the scale of months or
years – likewise, rules targeted solely at calming markets on the scale of months or years, can
induce unexpected feedback on the intraday or even subsecond scale.
As shown in Fig. 6, there is a general tendency for the number of these black swans to
increase as the overall market volatility increases, however one is not simply a mirror of the
other. Likewise, Fig. 7 confirms that the size and frequency of the black swans are not trivially
inter-related.
14Brave new world: quantifying the new instabilities and risks arising in subsecond
algorithmic trading
Figure 6: Number of separate spikes (blue) and crashes (red) in individual months, as a
function of the volatility in that month. As can be seen, there is some support for a
coupling between the number of ultrafast black swans (i.e. spikes and crashes) and the
overall volatility of the market on much longer timescales (i.e. months).
Figure 7. Fractional size vs. the duration for all subsecond black swans including both
crashes and spikes. For the sake of clarity in the plot, we truncate events with size
larger than 100%, i.e. we have truncated the plot at 100 on the vertical scale. As can be
seen, there is no well-defined relationship between spike/crash size and duration. The
fact that size and duration are not trivially linked helps confirm the surprising nature of
our findings.
15Brave new world: quantifying the new instabilities and risks arising in subsecond
algorithmic trading
Figure 8. Distribution of subsecond black swan sizes for fixed, consecutive, non-
overlapping time-windows for the duration (e.g. durations between 400-500ms, 500-
600ms etc.). The colours (with values indicated) show the results of the Kolmogorov-
Smirnov two-sample test to check the similarity of the different distributions within 15
different time-windows. The fact that there is little similarity between distributions on the
longer timescale (> 1 second) and ones a few hundred milliseconds below, is consistent
with the claim that black swan events of duration below about 800-900ms are
fundamentally different from those above, i.e. there is a phase transition. We also
carried out the power law test on these same consecutive, non-overlapping time-
windows for the duration (e.g. power-law test on durations between 400-500ms, 500-
600ms etc.). Only the time-windows containing long duration black swans pass the p-
value test, which is consistent with our claim of a fundamental phase transition just
below the human response time.
Figure 8 analyzes how the distribution of the sizes of subsecond black swan events changes
as a function of the timescale. The low values for the similarity between distributions above and
below 1 second in Fig. 8, combined with the rapid increase observed in Fig. 5 for the number of
black swans below 1 second, suggests that a phase transition might arise at subsecond
timescales. Figures 9-15 provide even stronger evidence to support the existence of such a
transition, by showing a number of properties that undergo a visibly abrupt change as we move
through the timescales at which humans become too slow to intervene and act.
16Brave new world: quantifying the new instabilities and risks arising in subsecond
algorithmic trading
Figure 9. Left panels show the average size of black swans within a given window of
duration as a function of the upper value of the duration for this window. The windows
of duration are fixed, consecutive, non-overlapping with each one having a size of
approximately 150 ms (there are 10 windows in total). Right panels show the standard
deviation of the size of the black swans within a window. Again, the subsecond regime
appears fundamentally different from the regime of >1 second. The mean size is seen to
increase dramatically as the duration moves above 1 second, and yet the mean number
is also decreasing dramatically as shown earlier in Fig. 5. Although there are fewer black
swans at larger durations, the mean size of them is larger simply because they have
more time to develop and grow. The fact the size increases so abruptly is another
indication that the underlying distribution has changed. The emergence of a power-law-
like distribution above 1 second will generate a large mean for durations >1 second, as
expected for such a fat-tailed distribution -- in stark contrast, non-power-law
distributions below 1 second will generate a smaller average, exactly as observed.
To remove any suspicion that our results could be seen more trivially, we also analyzed our
dataset using more conventional techniques available in typical pre-packaged statistical
software products. We found that the distribution of durations failed to match any of the
standard distributions, including Normal, Lognormal, Weibull, Exponentional, Logistic, Smallest
extreme value, and other multi-parameter variations of these distributions.
17Brave new world: quantifying the new instabilities and risks arising in subsecond
algorithmic trading
Figure 10. Average and standard deviation in the number of transactions making up the
individual black swans which lie within a given duration window (e.g. top left panel
shows average number of transactions per crash). This again supports the claim that
there is a fundamental difference between the black swans in the subsecond and >1
second regimes. In particular, in the lower panels, the standard deviation appears to
diverge for black swans with durations just below 1 second. Such divergent behaviour
is typical of a phase transition in a physical system, where the scale of the fluctuations
diverges at the transition point.
18Brave new world: quantifying the new instabilities and risks arising in subsecond
algorithmic trading
Figure 11. Lognormal distribution (straight dashed line) fit to complementary
distribution function for black swan durations. The large deviation from the straight line,
where the straight line represents a lognormal distribution, provides evidence
supporting our claim of a transition point for durations around 1000 milliseconds (i.e. 1
second).
19Brave new world: quantifying the new instabilities and risks arising in subsecond
algorithmic trading
Figure 12. Extent to which the cumulative distribution for all crashes follows a power-
law (top), and the subset with durations less than 1 second (lower left panel) and greater
than 1 second (lower right panel). For crashes with durations more than 1 second, there
is strong evidence for a power-law (p-value is 0.974). The appearance of a power-law for
timescales larger than 1 second is consistent with the appearance of power-laws for the
distribution of financial price-changes in the many studies in the literature for which
increments of time larger than 1 second are chosen. By stark contrast, for crashes with
durations less than 1 second, there is no evidence for a power-law – which offers
support for the notion that subsecond black swans represent a new class of extreme
event behavior.
20Brave new world: quantifying the new instabilities and risks arising in subsecond
algorithmic trading
Figure 13. Extent to which the cumulative distribution for all spikes follows a power-law
(top), and the subset with durations less than 1 second (lower left panel) and greater
than 1 second (lower right panel). For spikes with durations more than 1 second, as for
crashes in Figure 12, there is strong evidence for a power-law (p-value is 0.912). The
appearance of a power-law for timescales larger than 1 second is consistent with the
appearance of power-laws for the distribution of financial price-changes in the many
studies in the literature for which increments of time larger than 1 second are chosen.
By stark contrast, for spikes with durations less than 1 second, there is no evidence for
a power-law – which again offers support for our claim that subsecond black swans
represent a new class of extreme event behavior.
21Brave new world: quantifying the new instabilities and risks arising in subsecond
algorithmic trading
Figure 14. Reverse cumulative distribution function (CDF) for the fraction of crashes
(left) and spikes (right) with durations within a given millisecond range, having a change
size which is at least as big as the fraction shown on the horizontal axis. There is a
gradual shifting of these curves with the change of duration range – which is again
consistent with our claim that there is a different distribution for subsecond black
swans as compared to black swans that have duration larger than 1 second.
Figure 15. Empirical transition in size distribution for black swans with duration above
duration threshold , as function of . Plots show results of the best-fit power-law
exponent (black) and goodness-of-fit (blue) to the distributions for size of crashes and
spikes separately. These plots show a visible transition for both the spikes and crashes.
22Brave new world: quantifying the new instabilities and risks arising in subsecond
algorithmic trading
6. A new model for the ecology of subsecond markets
The results of the data analysis in the previous section provide evidence of an unexpected, yet
fundamental phase transition arising below the one second timescale, to a regime where large
jumps in the price are frequent. Given that a market is a collection of autonomous human and
machine (i.e. computer algorithm) agents watching the latest prices before their next move, and
yet human beings have limitations on how fast they can notice a particular situation and act on
it, it is reasonable to try to relate this observed transition to the decreasing ability of human
beings to influence price movements at smaller timescales.
Many models have been proposed to mimic real-world complex systems, however the famous
‘El Farol’ problem – upon which our model is based -- has long been considered archetypal
(Arthur (1999), Johnson (2003)). Here we analyze a binary version of this model, which mimics
how heterogenous agents (human or machine) use strategies and information about the recent
past, to determine trading actions. While a suitable starting-point for populations of humans
and/or computers, the machine-like binary nature of the model makes it ideally suited to
discuss the subsecond regime dominated by computer trading algorithms – and indeed, the
transition to this regime from the second-scale where machines and humans co-exist.
Our model comprises a population of N agents repeatedly competing for some limited resource
(e.g. seating L) in a potentially crowded place (e.g. bar). They make decisions as to whether to
attend on a given night based on the limited number of strategies s that they each have at their
disposal, together with some limited information µ about the m most recent global outcomes. If
the bar was undercrowded two nights ago, and overcrowded yesterday, this implies that there
was an under-demand two days ago (i.e. excess demand which we denote as 0), and an
over-demand yesterday (i.e. excess demand which we denote as 1). We make the
reasonable approximation that the price is proportional to the excess demand, and that the
excess demand is proportional to the number of buyers minus sellers. Hence at each
timestep, there is either an upward ( ) or downward ( ) pressure on the price.
Translating this to our example in Figure 16, this means the price went down two days ago (i.e.
outcome is 0 since there were more sellers than buyers) and up yesterday (i.e. outcome is 1
since there were more buyers than sellers). This down-up pattern is shown in Figure 16 as
. The agents then make a decision as to whether to buy or sell today, with each agent
using his own highest-scoring strategy chosen from his own set of s strategies. As shown in
Figure 16, the result is that the next day’s outcome is a price fall (i.e. the outome is 0 since
there are more sellers than buyers). This produces an updated bit-string for the price-change
history for the next timestep. To ensure an unbiased market we set the bar seating
capacity , thereby turning the El Farol problem into a Minority Game in which the
agents effectively compete to be in a minority group – below we discuss the financial relevance
of the minority mechanism. This Minority Game has been studied extensively in the literature
(Johnson et al. (2003)). In order to more closely mimic the real market in our model, we add an
additional ‘Grand Canonical’ modification which means that any agent with poorly performing
strategies at a given timestep (i.e. score over the previous T timesteps is below some threshold
value r), does not play at that timestep. It is this feature that generates fluctuations in the
‘volume’ V of agents actively trading at a given timestep. This so-called Grand Canonical
Minority Game, has been shown to reproduce the well-known stylized facts of financial markets
(Johnson et al. (2003)).
23Brave new world: quantifying the new instabilities and risks arising in subsecond
algorithmic trading
Figure 16. The iterative decision-making process forming the core of our model. In this
example, the length of the price history bit-string is m=2. Agents may be humans or
machines, and are heterogeneous since they each have their own s strategies pulled
from the space of available strategies (i.e. the strategy space). The information input at
the beginning of each timestep is the current price history bit-string which lists the
signs of the price-changes over the previous m=2 timesteps, e.g. down-up is encoded in
binary form as as shown, where 1 means up and 0 means down. At each
timestep each agent adopts his/her own current best (i.e. highest-scoring) strategy from
his/her own set of s strategies. The strategy space is shown as a table, with the top row
being the possible price-history bit-strings for m=2, and the entries in each subsequent
row comprise actions +1 (i.e. buy) and -1 (sell). Hence each row represents a single
strategy, i.e. it gives a well-defined response for each possible and hence each
possible situation. At a given timestep, each agent chooses his best performing strategy
and hence follows the action shown in the entry under column . All the agents follow
this same procedure: They choose their own best strategy and receive its
recommendation, i.e. buy (+1) or sell (-1). In the example timestep shown, more agents
sell (-1) than buy (+1). The new price-change, given by an excess demand, is downward,
i.e. it gets added to the price history as a 0. Therefore the new m=2 price history
bitstring for the next timestep is as shown. This process then iterates in the
same manner for all timesteps.
24Brave new world: quantifying the new instabilities and risks arising in subsecond
algorithmic trading
Tables 1 and 2 show explicitly why the goal of choosing the minority group (i.e. being a buyer
when there is an excess of sellers, or vice versa) is a sensible goal for financial market agents
– be they humans or machines -- with short-term, high-frequency trading goals. For example,
an agent could be an automated trading platform with s being the number of algorithms that
this platform manages. We define a notional wealth Wi of an agent i at time as follows:
Wi [t ] φi [t ] x [t ] + Ci [t ]
=
where φi is the number of assets that it holds at time , Ci is the amount of cash it holds at
time , and is the asset price at time . Since an exchange of cash for assets does not
W [t ]
affect the agents’ overall wealth at that moment, i is a notional wealth. The real measure of
wealth is Ci , which is the amount of capital that the agent has available to spend. An agent has
to do a ‘round trip’ (i.e. buy (sell) an asset then sell (buy) it back) to discover whether a real
profit has been made.
Table 1. Trading with the minority mechanism. For the buy action, the agent (human or
machine) is a buyer when the majority are sellers. Because of the negative market
impact of an excess of sellers, the price at which the trade is finally executed is
below the advertised price (i.e. it is executed at in our example and
hence only costs the trader 9 units of cash). For the sell action, the trader is a seller
when the majority are buyers, hence the price at which the trade is finally executed
is above the advertised price (i.e. it is executed at in our example).
Hence the agent ends up with 101 units of cash, having started with only 100. The agent
has therefore made a profit of 1 unit of cash after the round-trip, simply by trading in the
minority group, hence providing support for our model’s mechanism of agents trying to
trade in the minority.
t Action a [t ] Ci [t ] φi [t ] x [t ] Wi [t ]
1 submit buy order 100 0 10 100
2 buy…, submit sell order 91 1 9 100
3 sell 101 0 10 101
25You can also read