6 Retail energy markets - Australian Energy Regulator
←
→
Page content transcription
If your browser does not render page correctly, please read the page content below

6               Source: shutterstock

Retail energy
markets
6.1              Retail products and services
Most energy customers source their electricity and gas through a retailer that buys energy in wholesale markets and
packages it with network services to sell as a bundled product. Retailers monitor and bill customers for the energy
they use and manage the risk of price volatility in wholesale markets.

But advances in technology (particularly in the electricity market), high energy prices and environmental concerns
are driving customers to be more active in the market and take greater control over their energy use (figure 6.1).
Technologies that are opening markets for new types of energy services include:
›   smart meters, which provide information on energy use that gives retailers scope to offer more innovative
    products and for new sellers to offer ‘add-on’ energy management services
›   rooftop solar photovoltaic (PV) systems, which enable energy customers to self-generate electricity and sell any
    excess back to their retailer or a third party
›   batteries, load control devices and similar technologies, which allow customers greater control over their
    electricity use and the ability to engage in the market in new ways (for example, by storing electricity and entering
    demand response contracts)
›   electric vehicles, which may significantly increase customer electricity demand but can also offer electricity stored
    in the battery back into the market.

Established energy retailers and new entrant businesses are driving market opportunities for new services.

A small but growing base of customers are bypassing the traditional energy supply model, going ‘off-grid’ through
self-sufficient solar PV generation and battery storage, community based standalone systems or microgrids.

Figure 6.1       An evolving retail energy market

          Energy retail interface

              Alternative energy providers                      Authorised or licensed                Energy onsellers
                                                                   energy retailers
             Install solar panels and batteries at                                                     Buy energy from
             a customer's premises, and sell                      Buy electricity from                 authorised retailers and
             output to the customer. May also                     generators and sell it to            onsell it to customers in
                                                                  energy users.                        embedded networks.
             support demand response.

          Energy customers

          Microgrids                   Households                 Households with             Large retail              Embedded network
                                    (no solar installed)          solar panels and            customers                    customers
                                                                     batteries
    Are largely self-sufficient                                                                                             e.g. Apartment
    through small scale                                         May sell excess energy                                 buildings, caravan parks
    generation and                                              back to their retailer or
    storage, but may trade
    small amounts of                                              demand response.
    energy with retailers.

STATE OF THE ENERGY MARKET 2021                  Retail energy markets                                                                        242
Box 6.1 The AER’s role in retail energy markets
The Australian Energy Regulator (AER) regulates retail energy markets so that energy customers (particularly
residential and small business customers) can participate confidently and effectively in those markets; and to
protect those unable to safeguard their own interests. We undertake this work for Queensland, New South Wales
(NSW), South Australia, Tasmania and the Australian Capital Territory (ACT).
We aim to empower customers to make informed decisions on their energy use and protect them when problems
arise. As part of this work, we:
› set a price cap on standing offers for electricity in south east Queensland, NSW and South Australia. This cap
also acts as a reference price for market offers
› maintain an energy price comparator website (www.energymadeeasy.gov.au) to help residential and small
business customers understand the range of offers in the market, make better choices about those offers and
be aware of their rights and responsibilities when dealing with energy providers
› monitor and enforce compliance (by retailers and distributors) with obligations in the National Energy Retail
Law, Rules and Regulations
› oversee retail market entry and exit by assessing applications from businesses looking to become energy
retailers; granting exemptions from the requirement to hold a retailer authorisation; and administering a
national retailer of last resort scheme to protect consumers and the market if a retailer fails
› report on the performance of the market and energy businesses (including information on energy affordability)
› develop hardship guidelines and approve customer hardship policies that energy retailers offer to customers
who are facing financial hardship and seeking help to manage their bills.
6.2 Energy market regulation
Five jurisdictions – Queensland, New South Wales (NSW), South Australia, Tasmania and the Australian Capital
Territory (ACT) – apply a common national framework for regulating retail energy markets. The framework applies to
electricity retailing in all 5 of those jurisdictions and to gas retailing in Queensland, NSW, South Australia and the ACT.
Victoria does not apply the national framework, but its regulatory arrangements are broadly consistent with it.1
The National Energy Retail Law (Retail Law) confers wide-ranging regulatory responsibilities on the Australian Energy
Regulator (AER) (box 6.1). This chapter focuses on the 5 jurisdictions where the AER has regulatory responsibilities
and also covers the Victorian market where possible. Western Australia and the Northern Territory apply separate
regulatory arrangements and are not covered in this chapter.
The Retail Law operates alongside the Australian Consumer Law to protect small energy customers in their electricity
and gas supply arrangements. It sets out protections for residential customers and small businesses consuming
fewer than 100 megawatt hours (MWh) of electricity or 1 terajoule (TJ) of gas per year.2
Small customers make up over 99% of electricity and gas connections, although they account for less than 50% of
energy sales by volume.
The Retail Law and equivalent arrangements in Victoria focus on customer protections related to the traditional
retailer–customer relationship. Protections are generally stronger for customers supplied through an authorised
retailer than, for example, customers in embedded networks or entering solar power purchase agreements.
State and territory governments regulate electricity prices in Victoria, the ACT, Tasmania and regional Queensland.
Since 1 July 2019 the AER sets caps on ‘standing offer’ prices3 for electricity in jurisdictions without state-based price
regulation (section 6.6).
1 Recent changes to the Victorian framework, including recommendations adopted from the Thwaites Independent review into the electricity & gas retail
markets in Victoria (August 2017), have seen greater divergence between the Victorian and national frameworks.
2 For electricity, some jurisdictions have different consumption thresholds from that specified in the Retail Law. In South Australia, for example, small electricity
customers are those consuming fewer than 160 MWh per year. In Tasmania, the threshold is 150 MWh per year.
3 Standing offers apply where a customer does not enter a market contract. The terms and conditions of standing offers are prescribed in the National Energy
Retail Rules and include consumer protections not required in market retail contracts, such as access to paper billing, minimum periods before bill payment is
due, a set period for reminder notices, and no more than one price change every 6 months.
STATE OF THE ENERGY MARKET 2021 Retail energy markets 2436.3 Energy retailers
Energy sellers include:
› those authorised as retailers under the Retail Law
› those exempt from the requirement to be authorised4
› those offering energy products and services beyond the scope of the Retail Law – such as energy management
services, solar and storage products and off-grid energy systems.
Only customers of authorised retailers enjoy the full protections in the Retail Law.
6.3.1 Authorised energy retailers
Authorised energy retailers must comply with consumer protection and other obligations under the Retail Law. An
authorisation covers energy sales to customers in all 5 participating jurisdictions.
In April 2021, 98 businesses held authorisations to retail electricity and 37 businesses held authorisations to retail
gas.5 Since the start of 2020, 11 new retailers have been authorised to retail electricity and 2 have been authorised
to retail gas. Victoria has 55 licensed electricity retailers and 29 licensed gas retailers, including 5 electricity retailers
and 3 gas retailers that are not authorised to provide energy services in other regions.
The number of authorised retailers may differ from the number of brands a customer sees in the market. Not
all authorised retailers are active in the market at any time. Some businesses hold multiple authorisations for
commercial purposes despite operating under a single brand. In other cases, multiple brands may operate under
one authorisation. There has been an increase in ‘white-label’ retailing – for example, where a business offers energy
services under its own name but partners with an authorised retailer to provide the services. Section 6.4 notes recent
changes in retailers (brands) active in the market.
While many retailers offer energy services to all customers, some target specific market segments. A retailer may
focus on large commercial customers, for example, or those in embedded networks. Some retailers target users with
certain characteristics, such as those with swimming pools, solar PV or battery systems, or those with flexibility in
when they use energy.
In choosing which markets to enter, retailers consider factors such as price (and broader market) regulation, market
scale, competition, the ability to source hedging contracts to manage risk, and (in gas) whether wholesale contracts
and pipeline access are available.
Forty-five retail brands sell energy to residential or small business customers in southern and eastern Australia
(table 6.1). Twenty of those brands offer both electricity and gas in at least one jurisdiction. Most other brands offer
only electricity, but one retailer specialises in gas. A small number of authorised retailers (not listed in table 6.1) only
offer electricity retail services to customers in embedded networks.
Twenty-five retail brands offer energy in all 4 of the largest markets – south east Queensland, NSW, Victoria and
South Australia. NSW has the largest number of active electricity retailers (40), followed by Queensland (38),
Victoria (31) and South Australia (29). Victoria has lower participation, despite it having the most active market
on other measures. This outcome may reflect Victoria having its own licensing regime that requires a separate
application for authorisation and imposes different regulatory obligations from other jurisdictions.
In gas, however, Victoria has significantly more brands (17) than other regions (7–12). This contrast reflects the
importance of gas as a fuel among Victorian households and businesses; and customer preferences for a single
retailer across both fuels.
The ACT, Tasmania and regional Queensland have less competitive energy markets, reflecting the relatively small
scale of those markets and a continuous history of price regulation. But competition is rising in the ACT, with
10 electricity retailers and 4 gas retailers active in 2021.
4 In Victoria, where the Retail Law does not apply, retailers must hold a licence issued by the Essential Services Commission or seek an exemption from
this requirement.
5 Details of all businesses that hold electricity or gas authorisations can be found in the public register of authorised retailers on the AER website.
STATE OF THE ENERGY MARKET 2021 Retail energy markets 244Table 6.1 Retailers offering energy contracts to small customers
R E TA I L E R OWNERSHIP QLD NSW VIC SA TA S AC T
1st Energy 1st Energy
ActewAGL Retail AGL Energy, ACT Govt
AGL Energy AGL Energy
Alinta Energy Alinta Energy
Amber Electric Amber Electric
Aurora Energy Aurora Energy (Tas Govt)
Blue NRG Blue NRG
Bright Spark Power Bright Spark Power
CovaU TPC
DC Power Co1 DCP Company
Diamond Energy Diamond Energy
Discover Energy Discover Energy
Dodo Power and Gas M2 Energy
Electricity in a Box Electricity in a Box
Elysian Energy Elysian Energy
Energy Locals Energy Locals
EnergyAustralia CLP Group
Enova Energy Enova Community Energy
Ergon Energy Qld Govt
ERM Power Shell Energy
Future X Power Future X Power
Globird Energy Globird Energy
Glow Power Glow Power
Kogan Energy 1
Kogan
Locality Planning Energy Locality Planning Energy
Lumo Energy Snowy Hydro
Mojo Power Mojo Power
Momentum Energy Hydro Tasmania (Tas Govt)
Nectr Energy Hanwha Energy Retail
Next Business Energy Next Business Energy
Origin Energy Origin Energy
OVO Energy OVO Energy
People Energy People Energy
Pooled Energy Efficiency Filters
Powerclub Powerclub
Powerdirect AGL Energy
Powershop Meridian Energy
Qenergy Qenergy
Radian Energy Radian Energy
ReAmped Energy ReAmped Energy
Red Energy Snowy Hydro
Simply Energy ENGIE
Sumo Power Sumo Power
State Power Investment
Tango Energy
Corporation
Tas Gas Retail Brookfield Infrastructure
Total Gas retailers 7 7 12 11 17 15 10 10 2 2 4 4
Electricity retailers 35 31 37 33 28 25 26 25 4 5 8 9
= Residential = Small business
1. DC Power and Kogan Energy offer energy contracts through partnerships with Powershop.
Note: Includes retailers with generally available offers at February 2021. Retailers servicing only embedded network customers are excluded.
Source: Energy Made Easy website (www.energymadeeasy.gov.au); Victorian Energy Compare website (compare.energy.vic.gov.au).
STATE OF THE ENERGY MARKET 2021 Retail energy markets 2456.3.2 Exempt energy sellers
An energy seller may apply to the AER for an exemption from authorisation if it intends to supply energy services only:
› to a limited customer group (for example, at a specific site or incidentally through a relationship such as a
body corporate)
› to supplement its customers’ primary energy connection.
At April 2021 over 3,500 businesses held exemptions, typically to on-sell energy within an embedded network (that is,
a small private network whose owner sells electricity to other parties connected to the network). Hospitals, retirement
villages, caravan parks and apartment complexes are examples of entities that might run an embedded network.
Solar power purchase agreement providers are also covered by the exemptions framework.
The Australian Energy Market Commission (AEMC) cited stakeholder estimates that up to 500,000 customers
purchase energy through embedded networks.6 Those customers do not enjoy the full set of protections in the Retail
Law and have fewer avenues for dispute resolution.7 But energy ombudsman schemes have been widened so that
customers of exempt sellers can lodge complaints (section 6.8).
6.4 Competition in retail energy markets
Electricity markets in south east Queensland, NSW, Victoria and South Australia have several competitive
characteristics, including a diversity of sellers making offers, intensive marketing activity and customer switching.
Barriers to entry are low, as evidenced by regular new entry (although weaker contract market liquidity in South
Australia means barriers are higher in that market).8 Standalone retailers have identified access to competitively
priced hedging as a barrier to entry and expansion that impacts them more than it does retailers which own
generation.9
Competition is less effective in electricity retail markets in the ACT, Tasmania and regional Queensland. The scale of
these markets and continued price regulation may have deterred entry by some retailers. In regional Queensland a
subsidy paid to Ergon Energy through the Queensland Government’s Uniform Tariff Policy (which other retailers are
not able to access) also deters new entry.
Gas markets are generally less competitive than electricity markets, given their smaller scale and issues in sourcing
gas and pipeline services in some regions. Gas markets in all regions are more concentrated than electricity markets.
Positive market trends across electricity and gas include:
› decreasing market concentration, with smaller retailers growing their customer base in established markets and
expanding into new markets
› retailers winding back confusing discounting practices
› retailers offering a wider range of products and services, including simpler and more stable pricing products; and
products leveraging off solar PV and battery technology.
Customer satisfaction with competition in energy retail markets improved in recent years. In December 2020, 59% of
consumers across the National Electricity Market (NEM) were satisfied with the state of competition. Consumer trust,
or confidence that the market is working in consumers’ interests, is lower but improving. In December 2020, 38% of
residential customers expressed confidence in the market – this is up from 21% in December 2017.10
Regulatory reforms since 2018 aim to address concerns that competition has not delivered sufficient benefit to
consumers. The reforms seek to encourage customers to engage more closely with the market and make it easier to
compare retail offers (sections 6.4.4 and 6.4.7).
6 AEMC, Updating the regulatory frameworks for embedded networks, information sheet, June 2019, p 1.
7 The AER’s exemption guideline sets out the classes of exemption. The AER sets customer protections under each class. Details of all businesses that hold a
registered or individual exemption can be found in the public register of exemptions on the AER website.
8 AEMC, 2019 retail energy competition review, final report, June 2019.
9 AEMC, 2020 retail energy competition review, final report, June 2020.
10 ECA, Energy consumer sentiment survey, December 2020, p 12.
STATE OF THE ENERGY MARKET 2021 Retail energy markets 246Despite the reforms, not all customers can access the benefits of competition. Embedded network customers, for
example, often lack retail choice and cannot switch away from a supplier that fails to meet their needs. In June 2019
the AEMC proposed new arrangements that would shift embedded networks into the national regime, improving
protections and access to retail market competition for their customers.11
In December 2019 the AEMC received a rule change request from Energy Consumers Australia (ECA) which would
require retailers to provide information to enable more effective competition assessments. The rule change process
had not commenced at May 2021.
6.4.1 Market concentration
Forty-five retail brands supply small energy customers in southern and eastern Australia (table 6.1). Of these, the
retail brands of 3 businesses – AGL Energy, Origin Energy and EnergyAustralia (the ‘big 3’) – supply 64% of small
electricity customers and 73% of small gas customers (figure 6.2). Those businesses own at least 2 of the 3 largest
retailers in every region except Tasmania. The market share of these businesses has gradually declined over the past
decade, but Origin Energy and AGL Energy recorded net growth in electricity customer numbers over 2020. AGL
Energy’s customer numbers were boosted by its acquisition of amaysim’s energy business (including Click Energy) in
September 2020.
Three ‘tier 2’ retailers have significant market share in some regions:
› Snowy Hydro (owned by the Australian Government and trading as Red Energy and Lumo Energy) supplies around
7% of electricity customers and 9% of gas customers – its market share is highest in Victoria, supplying 13% of
electricity customers and 14% of gas customers.
› Alinta Energy supplies 5% of electricity customers and 3% of gas customers – its market share is highest in
Queensland (where it is the third largest retailer in the south east of the state, with 9% of electricity customers and
1% of gas customers) and South Australia (6% of electricity customers and 5% of gas customers).
› Simply Energy (owned by ENGIE) supplies 4% of electricity customers and 6% of gas customers, including 9–10%
of customers in Victoria and South Australia. It is the third largest energy retailer in South Australia.
Smaller retailers have also gained market share in recent years, increasing from 5% of small electricity customers
in 2016 to 8% in 2020. This overall market share remained steady in 2020, despite AGL Energy acquiring amaysim.
In gas, smaller retailers accounted for 5.9% of small customers in 2020, up from 4.4% in 2019. Smaller retailers
have made more inroads in Victoria than elsewhere, supplying 15% of small electricity customers and 10% of small
gas customers.
Retail markets tend to be more concentrated in gas than electricity, in part because the markets are smaller in scale.
In NSW, for example, the ‘big 3’ account for 89% of retail gas customers. In Queensland, Origin Energy and AGL
Energy account for 92% of retail gas customers.
The ACT, Tasmania and regional Queensland – which have had continuous price regulation –are even more
concentrated. The dominant retailers in these regions are typically government-owned (or part-owned) businesses
with little activity outside their home region:
› ActewAGL (a joint venture between the ACT Government and AGL Energy) supplies 78% of ACT electricity and
gas customers. Origin Energy (16% of small customers) and EnergyAustralia (5% of small customers) are the other
large market players.
› In Tasmania, Aurora Energy (Tasmanian Government owned) was until recently the only retailer offering electricity
to households. Since 2019, 4 retailers have begun retailing electricity, and by 2020 they had acquired around 2%
of small customers.
› Ergon Energy (Queensland Government owned) supplies electricity to most small customers in
regional Queensland.
NSW is the most concentrated of the major electricity markets. The ‘big 3’ account for 81% of NSW electricity
customers. Snowy Hydro accounts for another 7% of customers. The other 26 retailers in NSW share 12% of the
market.12
11 AEMC, Updating the regulatory frameworks for embedded networks, final report, June 2019.
12 Use of statewide data masks levels of market concentration within some parts of regions with multiple distribution zones (Queensland, NSW and Victoria).
Market concentration is likely to be higher in regional NSW than in Sydney, for example.
STATE OF THE ENERGY MARKET 2021 Retail energy markets 247Figure 6.2 Energy retail market share (small customers)
Electricity
4.0
3.5
3%
3.0 7%
Number of customers (millions)
2.5 26% 3%
9%
5%
2.0 9%
13%
1.5 32% 25%
15%
5%
1.0
18% 25%
10%
0.5 30%
42%
28% 18%
27% 98% 78%
0
Queensland NSW Victoria South Australia Tasmania ACT
Gas
2.5
2.0
4%
4%
Number of customers (millions)
10%
1.5
14%
5%
25% 17%
1.0
43% 28%
0.5
10%
9%
29%
39% 21% 17% Aurora 33%
43% Tas Gas 67% 78%
0
54%
Queensland NSW Victoria South Australia Tasmania ACT
Origin Energy AGL Energy EnergyAustralia Snowy Hydro Ergon Energy Alinta Energy Tas Gas
Simply Energy Aurora Energy ActewAGL Momentum Energy Powershop M2 Energy Other
Note: Includes residential and small business customers. All data at December 2020, except Victoria (electricity and gas, June 2020) and Tasmania
(gas, June 2020).
Source: AER, Retail markets quarterly, Q2 2020–21, April 2021; ESC, Victorian energy market report 2019–20, December 2020; Office of the Tasmanian
Economic Regulator, Energy in Tasmania report 2019–20, December 2020.
STATE OF THE ENERGY MARKET 2021 Retail energy markets 248While most retailers operate across multiple regions, less than half of electricity retailers operating in south east Queensland, NSW, Victoria and South Australia operate in all 4 regions. The gas market is even more segregated, with most retailers concentrating on the Victorian market, followed by the NSW and South Australian markets. In the year to March 2021, 5 new electricity retail brands entered the small customer market: › Bright Spark Power › Electricity in a Box › Glow Power › Radian Energy › Social Energy. Additionally, 13 existing retailers expanded electricity retailing into another jurisdiction, and 6 commenced or expanded gas retailing into another jurisdiction. Four retail brands exited the market in the year to March 2021. AGL acquired the customers of amaysim (branded as amaysim and Click Energy) in September 2020. M2 Energy retired its business customer focused Commander Power and Gas brand but continues to retail as Dodo Power and Gas. 6.4.2 Vertical integration In the 1990s governments structurally separated the energy supply industry into separate wholesale, network and retail businesses. In electricity, however, many generators and retailers have since integrated to become ‘gentailers’. Vertical integration allows retailers and energy producers to manage price volatility in wholesale markets, with less need to hedge their positions in futures (derivatives) markets. This strategy may be efficient for the business but can reduce liquidity in derivatives markets, posing a barrier to entry or expansion for retailers that are not vertically integrated. The ‘big 3’ retailers – AGL Energy, Origin Energy and EnergyAustralia – each have significant market share in generation across NSW, Victoria and South Australia (figure 6.3).13 Most other retailers with a significant retail customer base are also aligned with an electricity generation business – Snowy Hydro (retailing as Red Energy and Lumo Energy), ENGIE (Simply Energy), Alinta Energy, Hydro Tasmania (Momentum Energy), ERM Power, Meridian Energy (Powershop) and Pacific Hydro (Tango). In 2020 the 4 largest vertically integrated participants in each region (the big 3 plus the next largest gentailer based on generation output) accounted for the majority of generation output and at least half of all retail load: › In NSW they accounted for 79% of generation output and 65% of load. › In Victoria they accounted for 83% of generation output and 50% of load. › In South Australia they accounted for 69% of generation output and 63% of load. In Queensland, state government owned businesses (CS Energy, Stanwell, CleanCo and Ergon Energy) accounted for 68% of generation output and 56% of load. In Tasmania, state government owned businesses (Hydro Tasmania and Aurora Energy) accounted for 95% of generation output and 62% of load. Despite collectively owning more generation than needed to service their retail load, the profile of gentailers varies significantly. Among the 6 largest businesses, on average AGL Energy and Alinta Energy tend to have larger generation portfolios, while EnergyAustralia and ENGIE have relatively more balanced portfolios. Origin Energy and Snowy Hydro need to service a larger retail load than their generation fleet accounts for but have significant flexible generation in their portfolios, which allows them to manage the risk of high prices. The NEM’s largest standalone electricity retailer to small customers is M2 Energy (trading as Dodo Power and Gas) with less than 1% of small customers across the NEM. Vertical integration also occurs in gas, but to a lesser extent. Interests in upstream gas production or storage can complement gas retailing or gas powered electricity generation. 13 In March 2021 AGL Energy announced plans to reduce its level of vertical integration by separating out its coal fired generators into a separate business – PrimeCo. STATE OF THE ENERGY MARKET 2021 Retail energy markets 249
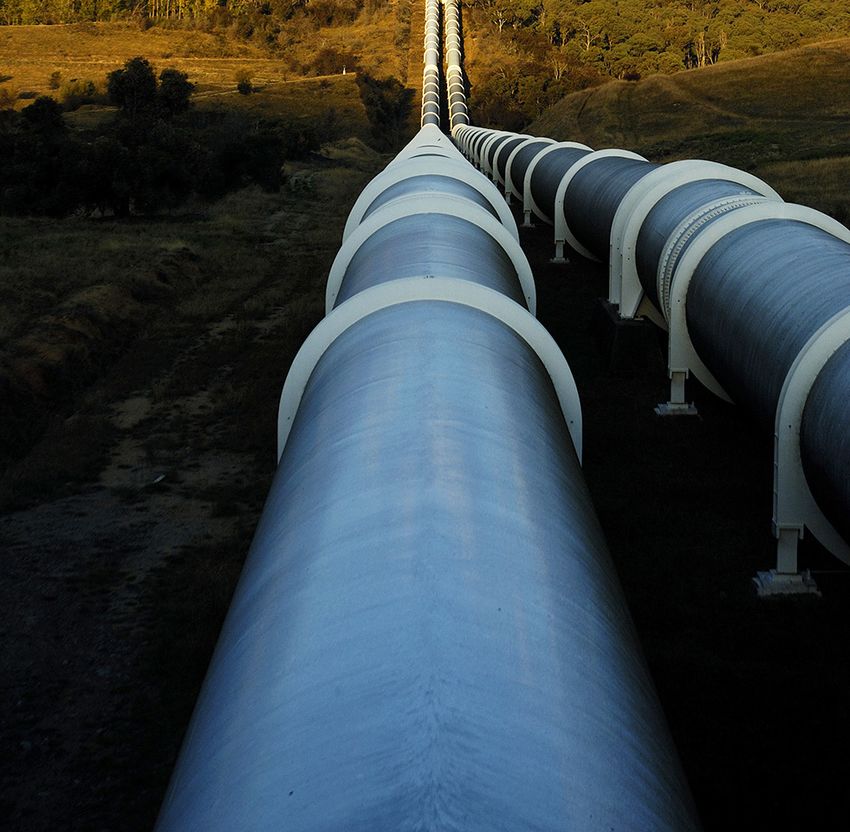
Figure 6.3       Vertical integration in National Energy Market jurisdictions
          Queensland                                                                   NSW & ACT
100%                                                                          100%

 80%                                                                           80%

 60%                                                                           60%

 40%                                                                           40%

 20%                                                                           20%

  0%                                                                            0%
               Electricity generation            Electricity retail                          Electricity generation             Electricity retail

          Victoria                                                                     South Australia
100%                                                                          100%

 80%                                                                           80%

 60%                                                                           60%

 40%                                                                           40%

 20%                                                                           20%

  0%                                                                            0%
               Electricity generation            Electricity retail                          Electricity generation             Electricity retail

          Tasmania
100%
                                                                                          AGL Energy                      Origin Energy

                                                                                          EnergyAustralia                 Snowy Hydro
 80%
                                                                                          Alinta Energy                   ENGIE

                                                                                          Stanwell                        CS Energy
 60%
                                                                                          CleanCo                         Ergon Energy

                                                                                          Hydro Tasmania                  Aurora Energy
 40%
                                                                                          Other vertically integrated     Not vertically integrated

 20%

  0%
               Electricity generation            Electricity retail

Note:       Electricity generation market shares are based on generation output in 2020. Retail market shares are based on market load in 2020.
Source:     AER, AEMO.

STATE OF THE ENERGY MARKET 2021                Retail energy markets                                                                                  250
6.4.3 Customers with market contracts Most energy consumers can enter a market contract with their retailer of choice.14 Market contracts allow retailers to tailor their energy products, offering different tariff structures, discounted prices, carbon offsets, non-price incentives, billing options, fixed or variable terms and other features. Contracts may be subject to fees and charges, such as establishment or exit fees. Retailers must obtain a customer’s explicit informed consent before entering them into a market contract. Customers without a market contract are placed on a standing offer with the retailer that most recently supplied energy at their premises (or, for new connections, with the retailer designated for that area). Standing offers provide a safety net for customers unable or unwilling to engage in the market, with prescribed terms and conditions and a suite of customer protections that the retailer cannot change. Standing offer prices are generally higher than those offered under market retail contracts and are either set annually under regulation or can be changed no more than once every 6 months. Since 1 July 2019 standing offer electricity prices are set or capped by independent regulators in all jurisdictions (section 6.6.3). Retailers set their own standing offer gas prices, which are not regulated. While customers on market contracts pay less on average than those on standing offers, market customers do not necessarily receive the best price available. Contracts with expired benefits may be priced close to the standing offer. Primary regional retailers – ActewAGL, Aurora and Ergon Energy – account for over 60% of all electricity standing offer customers. These (part) government owned retailers maintain dominant market positions in regions with limited retail competition. In the other regions, most electricity and gas standing offer customers have contracts with a ‘big 3’ retailer. This reflects the position of these retailers as incumbents when retail contestability was introduced, allowing them to retain customers that never took up a market contract. Victoria – the first state to fully deregulate its energy market – has the highest proportion of energy customers on market contracts, at around 94% (figure 6.4). South Australia has 91% of customers on market offers, which may reflect customers searching for cheaper deals, given the relatively high price of electricity in the state. NSW and south east Queensland recorded a shift towards market contracts after electricity prices were deregulated in those regions in 2014 and 2016 respectively. The rate of customers shifting to market contracts has since slowed. At January 2021 around 88% of customers were on market contracts in NSW. South east Queensland had similar levels of electricity customers on market contracts (87%), but the level was lower in gas (79% of customers). Nearly all small energy customers in regional Queensland are on standing offers. In January 2020, 67% of ACT customers were on market contracts compared with 38% in 2018. The increase follows strong participation by Origin Energy in the market. In Tasmania, new entrant retailers have offered market contracts to residential customers since early 2019. Despite this entry, the proportion of customers on market contracts dropped significantly over 2019 after the Tasmanian Government set standing offer prices that attracted Aurora’s market customers to switch back to the standing offer. At January 2021 only 3% of Tasmanian electricity customers were on a market offer. Financially vulnerable customers are less likely than other customers to be on a standing contract – less than 2% of customers on a hardship program or payment plan compared with over 8% of all customers.15 This likely reflects reforms requiring retailers to identify the best offer for customers in hardship (section 6.7.2). 14 While full retail contestability applies in all regions, not all customers can access offers from a retailer other than their host retailer. Further, many customers within embedded networks are still limited to energy supply through their embedded network operator. 15 ACCC, Inquiry into the National Electricity Market, September 2020 report, September 2020. STATE OF THE ENERGY MARKET 2021 Retail energy markets 251
Figure 6.4                                                Small customers on market and standing contracts
                                              100%

                                              90%
Proportion of customers on market contracts

                                              80%

                                              70%

                                              60%

                                              50%

                                              40%

                                              30%

                                              20%

                                              10%

                                               0%
                                                       Electricity   Gas       Electricity   Gas        Electricity    Gas       Electricity   Gas       Electricity      Gas    Electricity

                                                           South east                  NSW                      Victoria          South Australia                 ACT            Tasmania
                                                           Queensland

Note:                                                Standing and market offer shares are based on the number of small customers at January 2021 except Victoria (June 2020). Queensland
                                                     electricity numbers exclude customers in regional Queensland, who largely remain on standing offers.
Source:                                              AER, Retail markets quarterly, Q2 2020–21, April 2021; ESC, Victorian energy market report 2019–20, December 2020.

6.4.4                                                     Customer awareness and engagement
Retail competition can drive innovation to bring a wider range of products and services to satisfy different customer
preferences and demands. But competition can also increase complexity. For example, customers have found it
difficult to compare retail offers, and this sometimes causes them to disengage from the market. Retailers have
added to this complexity by adopting marketing strategies that make it difficult for customers to compare offers.
Customer surveys regularly report that customers find the market difficult to navigate. These difficulties impose
transaction costs (including time) that customers face when comparing offers, reinforcing a lack of trust and
contributing to low levels of engagement.

Reforms in 2019 sought to make it easier for customers to compare offers by simplifying and standardising how
retailers must present offers. The reforms require marketed discounts to be quoted against a ‘reference bill’, being the
default market offer set by the AER (section 6.6.3). Some retailers also introduced simpler pricing structures. These
changes followed reforms in 2018 requiring retailers to provide customers with advance notice of any change in their
energy price or benefits.

Some retailers argue these reforms may lead to customers becoming less engaged. For example, customers may
consider there is less value in looking for a better offer if discounts are advertised off a lower baseline or they may
take comfort from being on a government-regulated offer.16

More recent reforms aim to simplify customer bills.17 Under new arrangements effective from August 2022,
prescriptive billing provisions will be replaced with a guideline to be developed by the AER that offers retailers
more flexibility in how they present information to customers. This flexibility will allow retailers to develop tools
for their customers to access the key information needed to effectively engage in the market, including through
digital platforms.

While these reforms may improve customer engagement, other barriers for some customers remain: language
barriers; cultural issues; disabilities; low levels of literacy in energy markets, concepts and terms; and status quo bias
for consumers to stay with their default retailer or plan.

16 AEMC, 2020 retail energy competition review, final report, June 2020.
17 AEMC, Bill contents and billing requirements, final determination, March 2021.

STATE OF THE ENERGY MARKET 2021                                                         Retail energy markets                                                                              252
Customer understanding of the market Customer confidence in being able to navigate the energy retail market increased slightly across most regions in 2020. A positive response of 70% on this measure was the highest recorded in the 4 years that surveys have been undertaken by ECA.18 NSW was the only region to record a fall on this measure in 2020, down 7% to a 65% positive response rate. Between 2017 and 2019 there was an increase in customer confidence in the availability of easily understood information. This may partly reflect reforms over that period to help customers make informed decisions. Outcomes in 2020 varied, with confidence in Queensland rising by 8% (to 66%) but falling slightly in most other states. Tasmania recorded the largest drop (down 6% to 48%). Market developments – including the rollout of smart metering and cost-reflective tariffs –will add new layers of complexity to the market, potentially making it harder for consumers to confidently engage. But this added complexity will be offset by better tools for comparing offers. Customers are more widely using price comparator websites, for example. For residential customers looking to switch retailers, use of a comparator website to find a better offer ranged from 25% of customers in Queensland to 38% of customers in Victoria.19 Enhancements to the AER’s comparator website – Energy Made Easy (www.energymadeeasy.com.au) – in 2020 aimed to simplify the user experience and increase the site’s capability to compare innovative offers. Commercial switching websites and services also allow customers to access better offers with minimal engagement. But there are risks to consumers in relying on commercial services to navigate energy retail markets (section 6.4.7). The Australian Government (Treasury) is progressing work to implement a national Consumer Data Right for energy, which will allow consumers’ data to be shared with trusted third parties. Increasing the availability of and access to electricity data (such as a household’s current energy deal and consumption patterns) should support customer decision making by enabling more personalised and precise comparisons of offers. The Consumer Data Right framework for energy is expected to be finalised in 2021.20 Customer satisfaction Customers’ satisfaction with retail energy markets depends on factors including price, value for money, reliability, the customer service of their retailers, confidence in engaging with the market, technology uptake and ability to switch. Around 78% of residential customers were satisfied with their energy supply arrangements in NEM jurisdictions in 2020 (up from 74% in 2019). This result was driven by large improvements in Queensland (up 11% to 83%) and the ACT (up 13% to 80%). South Australia also recorded an increase in overall satisfaction (up 6% to 80%).21 Satisfaction eased slightly in NSW and Victoria, to 75% and 76% respectively. Satisfaction with value for money in electricity rose to 57% of household consumers, up 4% over the past year and up 22% since 2017. Satisfaction rates are higher for gas than for electricity (68% in 2020). Satisfaction with both fuels is at the highest or equal highest level since ECA commenced surveys in 2016, reflecting falling or stable energy prices in most regions. But satisfaction with value for money for energy trails services including mobile phone, internet, insurance, water and banking, and this gap widened in 2020. Customer satisfaction with competition in national energy retail markets improved in recent years. Consumer trust, or confidence that the market is working in consumers’ interests, has risen steadily since 2017 but remains low – 38% of residential customers expressed confidence in the market at December 2020, up from 21% in December 2017.22 Consumer satisfaction with the level of competition in energy markets remained steady over 2020 in all markets except south east Queensland, which recorded an increase in satisfaction to 69% of customers (up from 56% in 2019). On average across the NEM, 58% of consumers were satisfied with competition in their area. Customer satisfaction was lowest in Tasmania at 26%. 18 ECA, Energy consumer sentiment survey December 2020, December 2020. 19 ECA, Energy consumer sentiment survey December 2020, December 2020. 20 ACCC, Energy rules framework, consultation paper, July 2020. 21 ECA, Energy consumer sentiment survey December 2020, December 2020. 22 ECA, Energy consumer sentiment survey, December 2020, p 12. STATE OF THE ENERGY MARKET 2021 Retail energy markets 253
Customer switching
The rate at which customers switch retailers can indicate their level of engagement in the market. But these statistics
should be interpreted with care – switching may be low in a competitive market if retailers deliver good quality, low
priced service that gives customers no reason to change, for example. Switching data fails to capture customer
movements to new contracts with the same retailer, so it understates customer activity in the market. Conversely,
switching data captures when a customer moves house and signs a new contract, even if it is with the same
retailer (thus overstating customer activity). Victorian data for 2019–20 indicates that over half of all switches reflect
customers moving properties or setting up new connections.23

Reforms introduced in December 2019 make it easier for customers to switch retailer by allowing them to transfer
within 2 days of a cooling-off period expiring.24 This new process limits retailer ‘save’ activity (retailers contacting
customers who try to switch retailer and giving them a better offer to encourage them to stay) and allow customers
faster access to prices and products they want.

Small customer switching decreased in 2020 in all regions for electricity customers. NSW, Victoria and South
Australia recorded their lowest annual switching rates over the past decade (figure 6.5). Gas switching rates fell in
Victoria, South Australia and the ACT but rose slightly in Queensland and NSW. Customer switching rates peaked
in 2018 following the introduction of initiatives to encourage customer engagement. Subsequent easing of energy
prices, along with the reintroduction of price caps on electricity standing offers, may have contributed to lower
switching rates more recently, as customers consider there is less financial gain from changing retailer.

Victoria remains the most active region, with 21% of electricity customers and 19% of gas customers switching in
2020. This outcome occurred despite price spreads in energy offers narrowing significantly in Victoria since 2019,
meaning potential savings from switching in 2020 tended to be lower in Victoria than in other regions.

The ACT continues to have the lowest switching rates, with 10% of customers switching retailer in 2020.

Switching rates are typically lower in gas than in electricity. This may reflect fewer retailers participating in gas,
meaning less choice and fewer potential customer savings. Gas, as a secondary fuel, is also typically a lower cost for
customers, so it may not receive the same attention.

Residential customers were most likely to consider switching retailer because they were dissatisfied with value
for money (around one-third of customers who considered switching). Other key drivers of customers considering
switching included receiving notice of an energy price change, being approached by another retailer and moving
properties.25

While overall switching activity indicates relatively engaged customers, over a third of customers reported having
never switched retailer or energy plan.26 Those customers may lack confidence in making decisions – nearly half
of consumers in some regions were still not confident that they have access to easily understood information, for
example.27 Alternatively, those customers may be satisfied with their current supplier or unaware they can switch.

Victoria had the smallest proportion of customers who reported having never switched energy company or plan
(29%), followed by South Australia (32%), NSW and south east Queensland (each 37%), the ACT (43%) and Tasmania
(71%).28 These outcomes are consistent with other measures of customer engagement.

In many markets, engagement by even a limited number of customers can drive lower prices and product
improvements that benefit all consumers. This is less true for energy markets, where retailers can easily identify and
price discriminate against inactive customers. Many market offers include benefits that expire after one or 2 years,
and customers who do not switch regularly may find themselves paying higher prices than necessary.

23 ESC, Victorian energy market report 2019–20, December 2020, p 26.
24 AEMC, National Energy Retail (Reducing Customers’ Switching Times) Rule 2019, rule determination, 19 December 2019.
25 ECA, Energy consumer sentiment survey December 2020, December 2020.
26 ECA, Energy consumer sentiment survey December 2020, December 2020.
27 ECA, Energy consumer sentiment survey December 2020, December 2020.
28 ECA, Energy consumer sentiment survey December 2020, December 2020.

STATE OF THE ENERGY MARKET 2021               Retail energy markets                                                      254
Figure 6.5                           Small customer switching activity
                                Electricity                                                                                  Gas
                          35%                                                                                          35%

                          30%                                                                                          30%
Proportion of customers

                                                                                             Proportion of customers
                          25%                                                                                          25%

                          20%                                                                                          20%

                          15%                                                                                          15%

                          10%                                                                                          10%

                          5%                                                                                           5%

                          0%                                                                                           0%
                                  2015        2016    2017      2018         2019   2020                                          2015    2016       2017   2018   2019   2020

                                                     South east Queensland          NSW                                Victoria          South Australia     ACT

Note:                           Total annual customer switches in a year divided by average customer numbers. Queensland data excludes customers in regional Queensland,
                                who have limited access to competitive market offers.
Source:                         Customer switches: AEMO, NEM monthly retail transfer statistics, December 2020; AEMO, Gas retail market monthly statistics,
                                December 2020. Customer numbers: estimates from AER, Retail markets quarterly, Q2 2020–21, April 2021; ESC, Victorian energy market
                                report 2019–20, December 2020.

The National Retail Energy Rules require retailers to notify small electricity and gas customers before any change in
their benefits and provide advance notice of any price change.29 In Victoria, retailers must also prominently display
their ‘best offer’ on customers’ bills (every 3 months for electricity and every 4 months for gas), along with advice on
how to access it.

Additionally, at the end of a fixed-term contract, retailers must inform customers in writing about their options, such
as setting up a new contract or moving to another retailer. Importantly, retailers must ensure consumers are aware
that they will be put onto a standing offer if they choose not to enter a new market contract with their current retailer.

6.4.5                                Retailer activity
Changes in retailer marketing activity can affect the level of customer switching. Consumer approaches by retailers
appear to have been relatively steady over the past 4 years, with around 20% of customers indicating an approach
from a retailer prompted their most recent engagement in the energy market.30 A peak of 53% of residential
customers were directly approached by a retailer in 2014. Enforcement around door-to-door selling by larger retailers
has since reduced this activity.31 But the use of digital acquisition channels, including retailers’ websites and price
comparison websites, has grown (section 6.4.7).

Low retailer activity in some markets may reflect barriers to entry or expansion. Retailers cited the reintroduction
of standing offer price caps (section 6.6.3) as a barrier to activity. Limited access to competitive risk management
contracts was also cited as a barrier to entry or expansion in South Australia, with almost half of all retailers in 2020
considering that contact market liquidity in South Australia was too low.32

The duplication of regulatory frameworks – notably in Victoria, which has a separate Energy Retail Code – was
another barrier due to the compliance costs this imposes. Retailers considered the divergence of Victorian
regulations from other regions has widened since 2019.33

29 AEMC, National Energy Retail Amendment (Notification of the End of a Fixed Benefit Period) Rule 2017, rule determination, 7 November 2017; AEMC, National
   Energy Retail Amendment (Advance Notice of Price Changes) Rule, rule determination, 27 September 2018.
30 ECA, Energy consumer sentiment survey December 2020, December 2020.
31 AEMC, 2018 retail energy competition review, final report, June 2018, p 89.
32 AEMC, 2020 retail energy competition review, final report, June 2020.
33 AEMC, 2020 retail energy competition review, final report, June 2020.

STATE OF THE ENERGY MARKET 2021                                   Retail energy markets                                                                                      255
In gas, retailers in the past identified access to reasonably priced gas and pipeline capacity as barriers to entry and expansion, especially in Victoria. Reforms in 2018 and 2019 sought to reduce these barriers by increasing transparency in the gas market and improving access to unused pipeline capacity through a day-ahead auction (chapter 4). 6.4.6 Product differentiation In a competitive market, retailers offer a range of products and services to attract and retain customers. Energy retailers compete primarily on price. But with the introduction of standing offer price caps and restrictions around discounting (section 6.6.3), retailers are looking to differentiate their products in other ways. Retailers can differentiate products by offering more price certainty; rewarding customers with flexibility in how and when they use energy; or using technology such as batteries or electric vehicles. Some products offer energy management services, including as part of virtual power plants (section 1.2.2). Some retailers offer other incentives, such as carbon offsets, sign-up discounts and product add-ons and rewards; or they partner with other businesses. Bundling of products such as phone and internet alongside energy has also increased. Conditional discounts Until recently, price competition between energy retailers tended to play out through ‘headline’ discounts, often requiring the customer to meet conditions such as paying on time, e-billing, or paying by direct debit. The size of a ‘discount’ was often misleading, as retailers applied discounts off a range of price bases. Customers were also exposed to much higher prices if the conditions were not met. In 2020 around 11% of residential customers on offers with conditional discounts did not meet the conditions required to receive the discounted price.34 Customers in financial difficulty were more likely to miss out on the discounts, with 18% of hardship customers and 17% of customers on payment plans not meeting the required conditions. Reforms in 2019 require retailers to base any discount advertising off the default price and prohibits them from including conditional discounts in their most prominent advertised price for a market offer. The reform covered retailers in NSW, South Australia and south east Queensland.35 Equivalent provisions apply in Victoria. Further reforms in 2020 cap conditional discounts at a level reflecting the reasonable cost savings a retailer would expect if a consumer satisfies the conditions attached to the discount. Since the reforms, the proportion of electricity offers with guaranteed prices (no conditional discounts) rose significantly. At February 2021 around 90% of offers in Queensland, NSW and South Australia (and all offers in the ACT) had guaranteed prices (up from 44–60% in 2019). The shift was less pronounced in Victoria, where offers with guaranteed prices comprised around 83% of offers at February 2021. The size of offered discounts also reduced over this period. Most discounts in 2019 offered at least 10% off the original bill, with some offering up to 40% off (figure 6.6). In February 2021, conditional discounts typically offered less than 10% of the original bill, with few discounts offered above 20%. While the reforms only apply to electricity, discounting practices in gas have also changed. At February 2021 over 90% of gas offers in Queensland, NSW, South Australia and the ACT had a guaranteed price. In Victoria, 65% of offers had a guaranteed price. 34 ACCC, Inquiry into the National Electricity Market, May 2020 report, June 2020. 35 Competition and Consumer (Industry Code – Electricity Retail) Regulations 2019. STATE OF THE ENERGY MARKET 2021 Retail energy markets 256
Figure 6.6                                 Conditional discounts for residential energy market offers
                                     Electricity
                              100%

                              90%

                              80%
Proportion of market offers

                              70%

                              60%

                              50%

                              40%

                              30%

                              20%

                              10%

                               0%
                                       Jun     Jun     Feb     Jun     Jun       Feb     Jun     Jun       Feb    Jun    Jun    Feb    Jun    Jun    Feb    Jun    Jun    Feb
                                      2019    2020    2021    2019    2020      2021    2019    2020      2021   2019   2020   2021   2019   2020   2021   2019   2020   2021

                                           Queensland                NSW                       Victoria            South Australia           ACT                  NEM

                                     Gas
                              100%

                              90%

                              80%
Proportion of market offers

                              70%

                              60%

                              50%

                              40%

                              30%

                              20%

                              10%

                               0%
                                       Jun     Jun     Feb     Jun     Jun       Feb     Jun     Jun       Feb    Jun    Jun    Feb    Jun    Jun    Feb    Jun    Jun    Feb
                                      2019    2020    2021    2019    2020      2021    2019    2020      2021   2019   2020   2021   2019   2020   2021   2019   2020   2021

                                           Queensland                NSW                       Victoria            South Australia           ACT                  NEM

                                                                  No discount          0–10%        10–20%         20–30%        30–40%       Above 40%

Note:                                Discounts are advertised conditional discounts in generally available market offers at February 2021.
Source:                              Energy Made Easy website (www.energymadeeasy.gov.au); Victorian Energy Compare website (compare.energy.vic.gov.au).

Offer structures
Retailers typically use one of 3 types of tariff structures in their electricity offers:36
›                             single-rate or ‘flat’ tariffs, which apply a daily (fixed) supply charge plus a simple usage charge for the electricity
                              that a customer uses
›                             time-of-use tariffs, which apply different pricing to electricity use at peak and off-peak times. Lower prices at off-
                              peak times encourage customers to shift their energy use to those times
›                             demand tariffs, which charge a customer based on their maximum point-in-time demand at peak times.
                              Customers can reduce their energy costs by shifting demand to off-peak periods. But even one day of high use at
                              peak times will lead to higher charges for the whole billing period.

36 Gas offers have less variability in tariff structure, with flat tariffs typically applied. Usage charges may vary based on the overall volume of gas consumed and
   the time of year.

STATE OF THE ENERGY MARKET 2021                                          Retail energy markets                                                                             257
Retailers vary the level of fixed and variable tariff components to appeal to different customers. For example, customers with low energy use may prefer an offer with a low fixed charge but higher usage charges, while a customer with flexibility around when they use energy may prefer an offer with low off-peak charges or free weekend energy use. Some retailers are trialling other price structures. Fixed-price or subscription tariffs, where customers pay a (yearly or monthly) fee based on their typical electricity use, focus on simplicity and bill certainty. At the other end of the pricing spectrum, tariffs that pass through wholesale market spot prices allow customers to dynamically interact with the wholesale market. These tariffs are best suited to customers with battery storage who can adjust their use of grid- supplied electricity during high price periods. New dynamic products are emerging as battery storage systems and electric vehicles become more affordable and as accessibility to consumer energy data improves. Some of these products have a time-of-use pricing structure but with rates set to encourage charging/discharging of batteries or electric vehicles at specific times. These products may also come with ‘add-on’ services, such as automated systems that learn customers’ electricity use patterns and charge/discharge batteries to maximise value. Some offers allow customers to become part of a virtual power plant that aggregates multiple household solar and battery systems to provide power for network support or frequency control ancillary services or to engage in wholesale price arbitrage (section 1.2.2). Non-price competition In addition to competing on price and tariff structure, many retailers offer financial or non-financial incentives to entice customers. Financial incentives may include credit for continuing with a plan for a minimum period, for signing up online or through a partnering business or for referring a friend to the retailer. A number of retailers offer reward schemes that provide deals and discounts on a range of products and services. Non-financial benefits include carbon offsets for electricity use and product add-ons such as digital subscriptions. Retailers sometimes partner with another business to provide these additional benefits (Alinta Energy partnered with Kayo Sports to provide an energy and streaming offer in 2020, for example; and Origin Energy partnered with Woolworths’ Everyday Rewards program). Retailers increasingly offer products or services alongside electricity and gas to appeal to customers looking for the convenience of a single service provider. Internet and phone services, as well as solar PV and battery products, are offered by a number of energy retailers. AGL Energy also offers an electric vehicle subscription service. 6.4.7 Price comparison websites and switching services The variety of product structures, discounts and other inducements makes it difficult for energy customers to compare retail offers. Some customers use comparator websites to manage the complexity and range of offers in the market. The AER operates an online price comparator – Energy Made Easy (www.energymadeeasy.com.au) – to help small customers compare retail offerings. The website shows all generally available offers and has a benchmarking tool allowing customers to compare their electricity use with similar sized households in their area. The website is available to customers in jurisdictions that have implemented the Retail Law (Queensland, NSW, South Australia, Tasmania and the ACT). The Victorian Government operates a similar website allowing Victorian customers to compare market offers – Victorian Energy Compare (compare.energy.vic.gov.au). The NSW Government also operates a switching service, Energy Switch, which provides a comparison of offers, helps arrange a switch and provides a reminder when it is time to review a plan. Various private entities also offer online price comparison services. The AEMC identified 19 separate comparison websites in 2018.37 Brokers are also active in the market for larger customers. 37 AEMC, 2019 retail energy competition review, final report, June 2019, p 102. STATE OF THE ENERGY MARKET 2021 Retail energy markets 258
You can also read