RETAIL Second Half 2017 - Research and Forecast Report - Colliers International
←
→
Page content transcription
If your browser does not render page correctly, please read the page content below
Research and
Forecast Report

                      Accelerating success.

   RETAIL
   Second Half 2017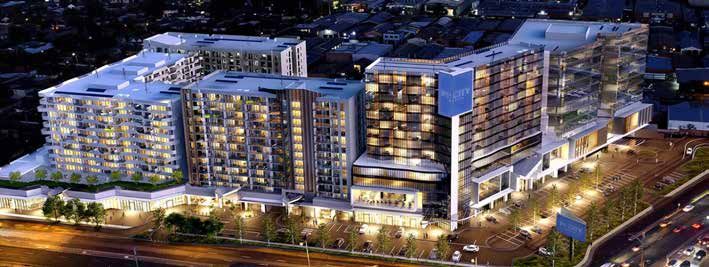
EXPERTS
IN PROPERTY DATA & INSIGHTS
Colliers Edge is a subscription service developed by our in-house
property research specialists, drawing on the expertise of our
national network of operators.

  DEEPER INSIGHTS               LIMITLESS SUPPORT         FAIRER PRICING
   Largest data set             Analyst not operators   Tailored to your needs
   on market today

Want better insights, faster? Talk to a Colliers Edge expert today
         Anneke Thompson
         National Director | Research
         +61 412 581 647
         anneke.thompson@colliers.com
         colliers.com.au/colliersedge

                                                              Accelerating success.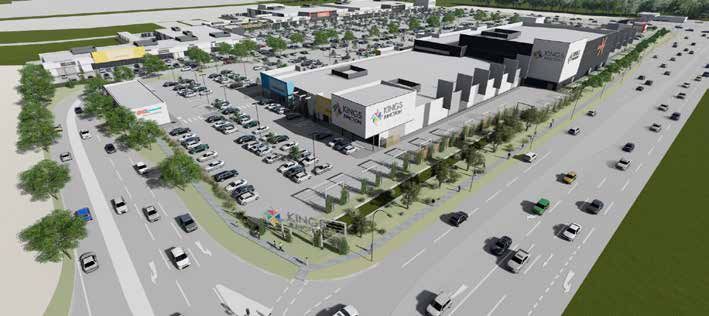
CONTENTS
Retail snapshot                                                                 4

National overview		                                                             5

New Zealand                                                                     8

Sydney CBD                                                                     10

Melbourne CBD                                                                  12

Brisbane CBD & Gold Coast                                                      14

Adelaide CBD                                                                   16

Perth CBD                                                                      18

Centres                                                                        20

Large Format Retail                                                            24

Our experience – Retail                                                        26

                      Retail | Research & Forecast Report | Second Half 2017    3
RETAIL
SNAPSHOT
AVERAGE YIELDS
                                          CBD                            REGIONAL                 SUB REGIONAL                 NEIGHBOURHOOD      LARGE FORMAT RETAIL

                                 3Q17              3Q18             3Q17        3Q18               3Q17              3Q18        3Q17    3Q18      3Q17        3Q18

SYDNEY                           5.19%            5.06%            5.25%        5.19%             6.13%          6.00%          6.00%    6.00%    6.50%        6.50%

MELBOURNE                       4.94%             4.85%            5.10%        5.09%             6.00%          6.00%          5.73%    5.73%    7.50%        7.50%

BRISBANE                         6.13%            6.06%            5.63%        5.54%             6.25%          6.25%          6.38%    6.38%     7.88%       7.88%

PERTH                            5.18%            5.18%            5.88%        5.80%             6.38%          6.38%          6.75%    6.75%    7.50%        7.50%

ADELAIDE                        5.63%             5.63%            5.88%        5.80%             6.75%          6.75%          7.25%    7.25%     7.75%       7.75%

AVERAGE GROSS FACE RENTS
                                          CBD                            REGIONAL                 SUB REGIONAL                 NEIGHBOURHOOD      LARGE FORMAT RETAIL

                                 3Q17              3Q18             3Q17        3Q18               3Q17              3Q18        3Q17    3Q18      3Q17        3Q18

SYDNEY                          $12,253           $12,537          $1,850       $1,886            $1,355             $1,381     $1,075   $1,096    $480        $489

MELBOURNE                        $7,375           $7,509           $1,800       $1,828            $1,060         $1,077          $765    $777      $270        $274

BRISBANE                        $4,700            $4,762           $1,657       $1,680            $1,108             $1,123      $800     $811     $348        $352

PERTH                           $3,430            $3,447            $995        $1,002             $778              $783        $493    $496      $203        $204

ADELAIDE                        $2,800            $2,817           $1,446       $1,455             $760              $765        $530    $533      $235        $236

                                                                                  RETAIL SUPPLY
RETAIL VACANCY                                                                          2018         2019       2020

    CBD                      Neighbourhood
                                                                                    251,529 WA
    Regional                 LFR
                                                                                    125,855
    Sub-regional                                                                    156,783                                                                QLD 500,806
                                                                     4.50%                                                                                      534,411
                                                                4.30%
             4.10%                                                                                                                                              350,691
                     3.80%
 3.50%                                                    3.50%
                                          3.30%

     1.50%                                        1.60%
                             0.90%

             NSW                                          VIC
                             9.10%
                                                                                                                                                                        NSW
                                                                        8.50%
                                                                                                                                                                        633,196
                                                                                                                            156,039 SA                                  838,927
                                                                                7.80%                                                                                   374,108
                                                                                                                             118,179
5.50%                                                                                                                        30,632
                     5.40%                                                                           5.90%
                                          4.70%
                                                                4.10%                           4.20%                                    109,919 VIC
        2.70%
             3.50%                                                                                                                       169,551
                                                                                                             2.50%
                                                          2.20%                                                                          251,429
                                                                                        1.10%
                                                  0.70%

             QLD                                          WA                                    SA
Source: Colliers Edge, PCA
NATIONAL
OVERVIEW
By Daniel Lees
Director | Research Wages vs Labour
daniel.lees@colliers.com 5.0 4
4.5 5
Retail market drivers 4.0
3.5
6
The Australian retail sector is facing a number of well-documented 3.0
7
challenges. Consumption is being hampered by subdued levels 2.5
8
of wage growth, rising utility costs and out of cycle interest rate 2.0 9
increases – a trend that has become evident within headline 1.5 10
national retail sales growth figures. Meanwhile, high profile retail 1999 2000 2001 2002 2003 2004 2005 2006 2007 2008 2009 2010 2011 2012 2013 2014 2015 2016 2017
Wages (% growth YoY) (s.a) Unemployment rate (rhs inv) Underemployment rate (rhs inv)
administrations, together with anticipation of further disruption Source: ABS
in the retail sector is creating discomfort for many incumbent
domestic players. Employment change (‘000)
60 5 5 .27
5 3.05
49 .63
However, the retail sector is not completely devoid of tailwinds. 50 47.02
42.10
Australia’s labour market has witnessed a prolonged period of 40
31.24
30
strength with net employment gains surging for 11 consecutive 17.60
21.89
19 .76
20 16.63
months. Pleasingly this recent uplift has been driven by the full-time 10 6.74
10.5 5
sector, and rolling 12-month employment growth has rebounded 0
firmly to sit well above the long run average. The outlook for -10
more job growth remains positive, supported by elevated business -20
-24.80
conditions and job vacancies, particularly along the nation’s eastern -30
Sep-16 Oct-16 Nov-16 Dec-16 Jan-17 Feb-17 Mar-17 Apr-17 May-17 Jun-17 Jul-17 Aug-17 Sep-17
seaboard. Furthermore, Australia’s population which is weighted
Source: ABS
to the south-eastern states has increased its rate of growth to 1.61
per cent, up 10 bps on pcp. New South Wales boasts the highest Interstate migration (rolling 12 month)
25,000
populous, although both Queensland and Victoria are experiencing 20,000
net interstate migration levels not witnessed since pre-GFC. 15,000
10,000
Pain points
5,000
0
-5,000
-10,000
Colliers International have recorded 33 high profile retail failures -15,000
-20,000
since 2012, creating initial backfill of over 1 million square meters -25,000
in aggregate. Over half of these businesses were from the apparel -30,000
2007 2008 2009 2010 2011 2012 2013 2014 2015 2016 2017
category, although they accounted for just 1.3 per cent of floorspace
NSW VIC QLD SA WA
backfill. Only eight businesses were related to household goods and Source: ABS
electrical, although in terms of floor space, these two categories
accounted for over 83 per cent of backfill space due to the size of ASIC - Insolvency cases per quarter
the organisations involved. 3,100 240
2,900 220
After a period of steady decline from late 2015, ASIC insolvency 2,700
200
data has reported an uptick in retail related companies entering 2,500
180
external administration, lifting from a low of 124 in December
2,300
160
2,100
2016, to 155 in the latest June 2017 release. Although adding some 1,900
140
context to this data, the number of administrations across the 1,700 120
broader index has also lifted, and retail as a proportion of the total 1,500 100
Jul-14
Jul-15
Jul-16
Sep-13
May-14
Sep-14
May-15
Sep-15
May-16
Sep-16
May-17
Mar-14
Mar-15
Mar-16
Mar-17
Nov-13
Nov-14
Nov-16
Nov-15
Jan-14
Jan-15
Jan-16
Jan-17
has remained fairly constant over time, oscillating between 8.75 and
Total Retail trade (RHS)
6.50 per cent (currently seven per cent). Source: ASIC
Retail | Research & Forecast Report | Second Half 2017 5
Retail spending patterns are Leasing demand supports
changing high occupancy
There are a multitude of factors to consider when trying to Despite the disruption and challenges faced, the demand for
determine why domestic retailers face challenges or even fail, retail space within the Australian market remains near all-time
however one of the key trends becoming evident in the national highs, in part due to the number of new market entrants setting
retail sales data is the divergence between discretionary and up operations on our shores. Colliers International is currently
non-discretionary spending patterns. Annual national retail sales tracking over one million sqm of outstanding demand, comprised
have grown 40 per cent on pre-GFC levels however this growth of supermarkets (36 per cent), mini-majors (18 per cent), large
has been skewed overwhelmingly to food, up 46 per cent, and format retail (18 per cent), specialty (11 per cent), department
hospitality related spending, up 66 per cent. Discretionary sectors stores (11 per cent) and food & beverage (6 per cent). The
such as apparel and department stores have not fared so well, majority of these tenants are seeking placement within super
up 33 per cent and two per cent respectively. After factoring prime assets along the eastern seaboard where retail drivers are
in population growth over the period, the drag on discretionary most favourable. We have also witnessed increasing demand from
spending becomes more pronounced, with apparel sales up just 14 premium brands seeking a presence within outlet centres which
per cent and department stores sales falling 12 per cent on a per are trading particularly well. Outlet centres have cherry picked
capita basis. Meanwhile food and hospitality sectors increased 25 some of the high performing specialty and mini major retailers and
and 43 per cent respectively on a per capita basis. curated a value offering at a time when discretionary spending is
becoming more challenged. This theme accounts for some of the
This has occurred because consumers have altered their spending
success being experienced by off-price retailers such as TK Maxx,
allocations over the past 10 years. While the bulk of Australia’s
and is one of the reasons behind Myer’s development of the Myer
total retail spending has always been attributed to food, this has
Clearance strategy.
increased from 38.7 per cent to 40.3 per cent of total (+160bps)
while hospitality related spending has lifted from 11.9 per cent High levels of demand will assist in supporting the occupancy
to 14.2 per cent (+220bps). This has come at the expense of levels across both listed and unlisted retail portfolio assets. In
department stores (-220bps to 6 per cent), household goods the FYE2017 reporting season, listed retail landlords disclosed
(-160bps to 17.5 per cent) and apparel (-40bps to 7.8 per cent). occupancy levels ranging from 98 per cent to 99.5 per cent.
Vacancy levels across broader retail asset classes remain low;
These trends are also evident in listed landlord reporting, where
CBD (4.96 per cent), regional shopping centres (1.52 per cent),
average MAT across the supermarket category lifted 1.27 per cent
sub regional shopping centres (3.5 per cent) and neighbourhood
in FYE2017, while department stores and discount department
shopping centres (4.7 per cent).
stores slipped -2.38 per cent and -3.00 per cent on average
respectively. It is interesting to note that growth is also shifting to
the mini-major category (+5.65 per cent on average) where there
is a high concentration of new market entrants.
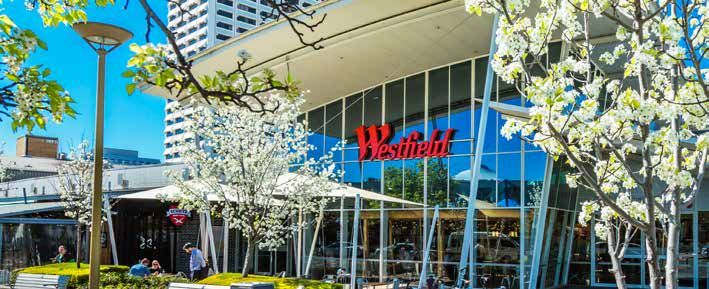
Westfield Woden Philip, ACT
Sold on behalf of GPT Wholesale Shopping Centre Fund No.1 (GWSCF)
6
Resilient eastern                                                          Change in retail spending allocation (pre-GFC vs 2017)

seabords rents
                                                                           Cafes & Rest                                                                                                       2.2%

                                                                                     Other                                                                  0.4%

Colliers International data indicates that rents within eastern             Dept Stores -2.2%
seaboard retail assets have demonstrated remarkable resilience
                                                                                Apparel                                           -0.4%
through cycles, with annual growth rates averaging between 3.11
per cent and 3.57 per cent over a 20-year period. Re-leasing                  HH Goods                     -1.6%

spreads across listed landlords have remained broadly positive
                                                                                     Food                                                                                          1.6%
according to FYE2017 earnings results, although we note that
                                                                                              -2.5%      -2.0%     -1.5%   -1.0%        -0.5%      0.0%   0.5%      1.0%     1.5%     2.0%     2.5%
rents and lease spreads can be disrupted periodically through
                                                                           Source: ABS
development activity. Listed landlords also reported that many
existing lease structures are linked to contractual rent increases.
                                                                           Outstanding retail leasing demand (sqm)
Analysis of historical total returns across various commercial             400,000

property asset classes over the past 15 years to June 2017,                350,000

suggests that retail assets score highly on a risk adjusted basis.         300,000

Regional shopping centres in particular rank well relative to other        250,000

                                                                           200,000
commercial property asset classes, including industrial distribution
                                                                            150,000
centres and CBD office buildings. The outperformance of regional
                                                                            100,000
centres reflects the resilient yields on offer, a result of the
                                                                            50,000
diversified consumer offering, high foot traffic and excess tenant
                                                                                -
demand.                                                                                      Specialty     Supermarket     Mini major           F&B       Department store   LFR             Auto

                                                                           Source: Colliers International

Investment demand not                                                      Average REIT releasing spreads

tempered                                                                    2.20%

                                                                            2.10%                                                         2.06%
                                                                                                                                                                    2.11%

                                                                            2.00%

While overall retail sales volumes declined 13% in FYE2017 to               1.90%

$6.64 billion, the weight of capital seeking placement within               1.80%                                                                                                          1.77%

                                                                            1.70%                                1.67%
the direct retail asset class has grown. This is occurring due to
                                                                            1.60%
increasing global pension and superannuation fund flows, against            1.50%
                                                                                     1.43%
a global interest rate backdrop that remains low relative to long           1.40%

term historical standards. As the market continues to digest the            1.30%

                                                                            1.20%
implications of new retail entrants and the associated disruption,                  Jun-15                       Dec-15                   Jun-16                   Dec-16                 Jun-17

it is reasonable to assume that new capital will become more               Source: Company Reporting

selective, targeting tier one or super prime assets that are ranked
                                                                           Property sector Sharpe ratios
highly within their respective catchments.
                                                                             Super regional SC

Despite these super prime assets being highly sought after, the                     Regional SC

frequency in which they come to market is low, meaning that                         Industrial DC

book value yields are often higher than what on-market pricing                Sub regional SC

would achieve. As such, the spread on offer between asset class                     Metro office

book values and risk-free rates is wider that long term historical         Industrial warehouse

averages, implying further scope for yield compression.                     Tech business park

                                                                             Neighbourhood SC
In the listed sector, the combination of; post divestment liquidity,
                                                                                     CBD office
acceptable gearing and low cost of debt suggests that capital
                                                                               Industrial estate
management measures will continue. Forward dividend yields of                                       0.0 0.1 0.2 0.3 0.4 0.5 0.6 0.7 0.8 0.9 1.0 1.1 1.2 1.3 1.4 1.5 1.6 1.7 1.8 1.9 2.0 2.1 2.2

~6 per cent during FYE2017 reporting season led to share-buy
                                                                           Source: IPD, Colliers International
backs being initiated, while stabilised development yields of ~7 per
cent together with development IRRs of 12-15 per cent justify the
substantial number of redevelopment opportunities within retained
core assets.

                                                                       Retail | Research & Forecast Report | Second Half 2017                                                                         7
Research &
Forecast Report

NEW ZEALAND
Retail | Second Half 2017

By Leo Lee                                                            during the June 2017 quarter helped push the value of retail
Manager | Research & Consulting                                       sales up 6.4 per cent from a year ago. The biggest contributors
leo.lee@colliers.com                                                  were food and beverage up 11.3 per cent, and the accommodation
                                                                      sector, up 15.4 per cent from a year ago.

    MARKET HIGHLIGHTS
                                                                      Auckland holding firm
    Strong visitor numbers into New Zealand are helping boost         Overall strip retail vacancy in Auckland remains tight, having
    retail sales, especially the food and beverage sector.            reduced to 3.3 per cent in June 2017 (down 1.5 per cent from a
                                                                      year ago), now at levels not seen since mid-2015. The vacant
                                                                      space is largely made up of small shops. The ex-Topshop tenancy
    Tenant demand remains buoyant on the main CBD strips in
                                                                      provides a good opportunity for larger retailers to enter the
    Auckland and Wellington.
                                                                      market.

    The completion of new retail developments in central              Auckland CBD average net face rents have increased slightly
    Christchurch is taking shape, further strengthening the area.     reaching $2,850 per sqm in September 2017, from $2,800
                                                                      per sqm from a year ago. Retail rents in the CBD continue
                                                                      to command the highest rents highlighting the importance of
    The demise of some well-known retailers highlights the
                                                                      exposure to foot traffic.
    competitive nature of the retail market and threats from the
    growing emergence of e-commerce.                                  Outside of the prime CBD strip, the large shopping mall owners
                                                                      are continuing to actively develop their centres. Kiwi Property
                                                                      Group, the owner of one of New Zealand’s largest malls, Sylvia
Business confidence has turned                                        Park is a good example. A 10-level office tower is well underway,
The latest ANZ Business Confidence Index has turned negative,         in addition to a new dining lane, The Grove and a $200 million
falling to a net 10 per cent pessimistic about the year ahead. Most   galleria expansion, which will add an extra 20,000 sqm of retail
survey responses were received in the first half of October before    floor space planned. Other major shopping centres expansion
the final government coalition was decided. This survey primarily     projects including Westfield Newmarket and Westfield St Lukes all
reflects the uncertainty around the outcome and not the outcome       owned by Scentre Group are also expected.
itself.
                                                                      Wellington’s seismic reshuffle
Consumer confidence has showed some resilience despite recent
house price easing and political uncertainty post-election. ANZ-      Demand remains strong for retail space along Lambton Quay with
Roy Morgan Consumer Confidence Index dropped 4 points to              retail vacancy rate reducing to 3.3 per cent in June 2017, down
126.3 in October 2017 from 121.7 from six months ago, still highly    from 3.5 per cent from a year ago. The recent demise of Top
positive.                                                             Shop in New Zealand has seen an additional 1,300 sqm become
                                                                      available.
Food and beverage a rising star                                       Lambton Quay continues to be highly sought after, but the low
Food and beverage spending in New Zealand has grown                   vacancy is making it difficult to find suitable space. For those who
considerably, supported by the booming tourism market. Annual         can’t wait, Willis Street has been a popular option, with Mecca
international visitor arrivals hit 3.68 million for the September     Maxima taking close to 410 sqm of space, adding to a growing list
2017 year, up 9 per cent compared to a year ago. The influx of        of high end retailers in the street. Rents are forecast to rise in
visitors for the World Masters Games and the Lions rugby tour         these areas as a result.

8
A flurry of construction activity along Wellington’s ‘Golden Mile’ will ANZ-Roy Morgan Consumer Confidence Index
create more retail choices for businesses and shoppers. Retailers 145
around Lambton Quay, Manners Street and Cuba Street have begun 135
relocating as refurbishment work gets underway on a number of 125
buildings. Developments include a major new development on
115
Victoria Street and Lombard Lane, the strengthening of the former
Index
105
Farmers building on Cuba Street. Meanwhile, the strengthening
95
work, on space in Stewart Dawson’s corner, has displaced a
85
number of retailers including Rodd & Gunn who have relocated to
75
46 Willis Street on a new 11-year lease term.
Oct-07
Feb-11
Feb-16
Mar-08
Aug-13
Nov-09
Jun-14
Jan-09
Oct-17
Oct-12
Sep-15
Sep-10
Dec-16
Aug-08
Dec-11
Mar-13
Jun-09
May-12
Apr-15
May-17
Apr-10
Jul-11
Jul-16
Nov-14
Jan-14
Christchurch jigsaw nearing completion Source: ANZ-Roy Morgan, Colliers International Research
The pieces are coming together in the Christchurch CBD as the
completion of new office developments are bringing workers back New Zealand Retail Sales By Industry
Core - Retail
into the CBD. This has stimulated much needed foot traffic for Food and beverage services
retailers. Accommodation
Pharmaceutical and other store-based retailing
Electrical and electronic goods
The Crossing Shopping Centre on Cashel Street in central Clothing, footwear, and accessories
Christchurch opened its doors to shoppers in September 2017. Recreational goods
Hardware, building, and garden supplies
It features a 700-space car park and a high-end supermarket, Furniture, floor coverings, houseware, textiles
the FreshChoice City Market plus 55 retail tenancies. The third Department stores
Non-store and commission-based retailing
stage will include top fashion brands H&M, Country Road, Trenery, Liquor
Witchery, Seed and Rodd and Gunn. The Crossing is the largest Specialised food
Supermarket and grocery stores
privately-owned development in the CBD, covering some 44,000 Fuel
sqm. Two well-known fashion operators on other sites in the Motor vehicles and parts
Vehicl - Related
immediate vicinity will further strengthen the area. Source: StatsNZ, Colliers International Research
0% 5% 10% 15% 20%
*June quarter Annual % Change
A large number of retailers are yet to return to the CBD taking a
‘wait and see’ approach to see how the city evolves. Several new
developments are expected to be completed over the next 12 months
which will create further opportunity for retailers.
KFC, New CBD concept
Retail leasing on behalf of Restaurant Brands NZ
Retail | Research & Forecast Report | Second Half 2017 9
Research &
Forecast Report

SYDNEY CBD
Retail | Second Half 2017

By Daniel Lees                                                         Street. The move has led to the retailer paying half the rent while
Director | Research                                                    simultaneously tripling the available floorspace.
daniel.lees@colliers.com
                                                                       In other key George Street moves, Coles supermarket may seek
                                                                       an alternative location as Investa and Brookfield look to refurbish
  MARKET HIGHLIGHTS                                                    the commercial tower and sky lobby of IAG house, although
                                                                       Coles has significant WALE. Meanwhile, Factorie clothing at 395
  Pitt Street Mall continues to fetch the highest rents in             George Street is set to be replaced by Superdry, and Michael Hill
  Sydney CBD                                                           Jewellery has submitted a DA for the adjacent site at 395 George
                                                                       Street where Optus is now located. Development at 345 George is
  Some tenants seeking value through relocation to George              progressing, with lifestyle brands now secured for the prime CBD
  and Pitt Streets                                                     location.

  George Street rents expected to increase further post
                                                                       Pitt Street
  completion of the Sydney Light Rail project                          Our 3Q17 range for Pitt Street leasing is $2,520 - $4,500/sqm/pa
                                                                       on a gross face basis. While Pitt Street rents are the lowest within
                                                                       Sydney CBD, growth has been substantial, lifting 24.36 per cent
Leasing market and                                                     over the past year. This growth rate will increase next quarter

tenant activity
                                                                       with the most recent leasing deal being struck at a rate of $6,000/
                                                                       sqm/pa.

Sydney CBD commands the highest gross face rent of any retail          In tenant activity, Suit Supply will soon be arriving to the precinct
subsector across the nation. With an average gross face rent of        having secured a tenancy at 5 Martin Place, and it is rumoured
$12,253/sqm/pa that has increased 25.5 per cent over the year, it      that a replacement for Kit and Ace in the adjacent site has been
is Australia’s standout CBD retail market.                             secured. The recent acquisition of 20 Bridge Street by Early
                                                                       Light International Holdings will no doubt result in a remixing of
George Street                                                          the ground floor retail tenancy, previously occupied by HSBC.
                                                                       Following the compulsory acquisition of 39 Martin Place for
Our 3Q17 range for George Street leasing lies between $3,750
                                                                       the metro station development, Breitling has secured a site at
and $7,000/sqm/pa on a gross face basis. This marks an increase
                                                                       61 Market Street and Ripcurl, is in the process of finding a new
of 7.5 per cent over the year and is substantially higher than the
                                                                       home. Having made the successful transition from pop-up store,
$3,500 - $4,000/sqm/pa range recorded in late 2015. Despite
                                                                       Kids Stuff has relocated from a temporary site at 403 George
the significant levels of disruption associated with the Sydney
                                                                       Street to a new location at 250 Pitt Street.
Light Rail project, rents along George Street have lifted as tenants
pay ahead for access to what will soon become a pedestrianised
                                                                       Pitt Street Mall
thoroughfare. We anticipate that as the Sydney Light Rail project
approaches completion, the floor of our current rental range will      Pitt Street Mall continues to attract the highest gross face rents
lift further.                                                          within Sydney, with our 3Q17 range now $10,000 - $21,985/sqm/
                                                                       pa, up 20.83 per cent over the year. Rents here are supported
Some tenants have already taken advantage of the rent disparity
                                                                       by high foot traffic volumes, proximity to Westfield Sydney and
within Sydney CBD precinct - a prime example being the decision
                                                                       restricted availability of leasing stock. However, over recent
by General Pants to relocate from Pitt Street Mall to 413 George
                                                                       months there has been some churn in the market which will

10
present opportunities for new tenants. Within the Sydney Arcade, Sydney CBD Retail Yield
Woolworths has secured a basement tenancy previously occupied 10%
by Forever 21, providing more amenity to the local community,
and news of additional tenants within this precinct are yet to be 8%
confirmed. The Soul Pattison asset at 160 Pitt St Mall is currently
6%
for lease, and there may be additional opportunities for luxury
brands at 192 Pitt Street. 4%
King Street 2%
In 3Q17, our gross face rental range for King Street is $6,000 0%
- $12,750/sqm/pa, where it has remained steady since 1Q17.
-2%
Following the recent transactional activity within the MLC Centre,
2020
2000
2002
2004
2003
2005
2006
2008
2009
2007
2010
2012
2014
2013
2015
2016
2018
2019
2017
2001
1995
1996
1998
1999
2011
1997
there is a possibility that GPT will proceed with their premium Spread 10Y Bond Sydney CBD yield
and luxury strategy for King Street however this is unconfirmed. Source: Colliers International
Tiffany and Co has been secured as a pre-commitment for the 175
Pitt Street development and at 106 King Street, Le Creuset will be Sydney CBD Gross Face Rent ($/sqm/pa)
moving to make way for a new tenant, most likely from the luxury $18,000
$15 ,9 9 3
30%
$16,000
sector. $14,000
2 4.36 %
2 5 .5 4% 25%
$12 ,2 5 3
2 0.83%
$12,000 20%
Development and supply $10,000
$8,000
$9 ,375
15%
$6,000 $5 ,375 10%
The Sydney CBD retail market possesses a robust development $4,000
7.5 0% $3,5 10
5%
supply pipeline that grows from 16,168sqm in 2018 to 25,208sqm $2,000
0.00%
in 2019, and 63,078sqm in 2020, before peaking at 63,237sqm $0
George St Pitt St Pitt St Mall King St CBD
0%
in 2021. From here supply tapers rapidly to 14,979sqm in 2022. Ave Gros s Face Rents % growth YoY
Notable upcoming developments include; 55 Market Street and Source: Colliers International
To note: No prior data for King Street
60 Martin Place, with additional retail amenity at Barangaroo
South and AMP’s Quay Quarter Sydney masterplan (2019-21). Sydney CBD Retail Supply (m²)
The redevelopment of Mirvac’s Harbourside Shopping Centre is 80,000
estimated to bring 52,000sqm of retail, currently slated for 2020, 70,000
together with Wynyard Place (7,500sqm). The development of a 60,000
fourth tower at Darling Park together with retail amenity in Cockle 50,000
Bay could add up to 15,000sqm of additional retail floorspace in
40,000
2021.
30,000
Transactions and
20,000
10,000
investments -
2018 2019 2020 2021 2022
New Refurbishment
There have been no material Sydney CBD retail transactions since
Source: Colliers International/Cordell
the sale of 77 Market Street and 66 Hunter Street in August 2016.
Due to the lack of major retail transactions or revaluations, our
CBD yield ranges have remained fairly steady over the quarter
at 4.37 – 6 per cent, with the lower bound representing the most
recent valuation of Westfield Sydney. As discussed in our first half
report, we believe that Sydney CBD retail assets have scope for
further yield compression on the basis that the spread between
asset class yields and risk-free rates is 149 basis points wider
than long term historical averages.
Retail | Research & Forecast Report | Second Half 2017 11Research &
Forecast Report
MELBOURNE CBD
Retail | Second Half 2017
By Anika Wong Activity spikes in the western core
Manager | Research
anika.wong@colliers.com Off the back of the new developments in the Western Core of
the CBD, tight retail vacancy within the Paris-end and elevated
rents, we have seen increased demand and interest to occupy
MARKET HIGHLIGHTS space along the Western side of Collins Street. The development
of Collins Arch, One Melbourne Quarter, 664 Collins Street and
Melbourne’s population boom transforming retail culture
Collins Square to name a few, has spurred tenant interest to move
to non-traditional retail pockets such as the Western Core. Most
CBD retail market stretches West recently, Swiss watchmakers IWC and Panerai secured 75sqm at
360 Collins Street paying $2,000 to $2,200 per sqm. This is the
Mixed-use development is generating retail opportunities first time we are seeing luxury brands move so far down Collins
Street.
Tenants can occupy space in the Western core that offers a
Leasing market comparatively affordable rent base to the Eastern core where
rates are currently hovering around $4,500 to $5,000 per sqm
In the three months to September 2017, gross face rents in along the strip. This trend has broadened interest from different
Melbourne’s CBD grew 9.3 per cent, now averaging at $7,375 per luxury retail offerings. Mercedes Benz opened its first Australian
sqm within a wide band of $3,750 per sqm to $11,000 per sqm. ‘Mercedes Me’ flagship store at the Rialto Tower committing
This was generated by tenant commitments from numerous major across the first two floors, operating as a café as their new retail
retailers. Gross face rents for super prime space experienced a concept store enabling customers to interact and experience the
10 per cent increase, now averaging at $11,000 per sqm, where Mercedes Benz lifestyle and brand. Other car retailers; Tesla,
previously, the highest rate per sqm tenants paid was $10,000 per BMW, Porsche, Lexus and BMW are also hunting for space within
sqm since June 2016. This was underpinned by the biggest retail the Western Core.
leasing deal in Melbourne’s CBD this year where Danish jewellery As we see a change in the tenancy profile, landlords are looking to
retailer Pandora secured a seven-year lease on Bourke Street Mall target premium food operators mixed with service stores such as
at a rate of $11,000 per sqm, worth nearly $1 million in annual rent. financial services and medical centres. Tenants are also tweaking
Tenant leasing incentives remain static at 5.5 per cent over the six their exposure to incorporate office buildings in their portfolios. A
months to September 2017. This is the lowest incentive across the prime example is Grollo Group’s $200 million revamp of the Rialto
CBD’s and is reflective of positive demand in the food and beverage Towers securing top food operator, Rustica.
sector. Where there is a squeeze on space, we expect incentives to Further up Collins Street towards the retail core, the influx of
tighten which will result in positive net effective rental growth. high profile global brands continues to circle Collins Street sites.
The construction of the Metro Tunnel Project, anticipated to The refurbishment of Emirates House made way for Burberry’s
complete by 2026, has had an initial impact on retailers at City flagship site, The Hour Glass and first to market Tory Burch along
Square and along Swanston Street with operators seeking with the relocation of Brunetti’s café from Flinders Lane. Another
alternative premises along Bourke, Flinders and Elizabeth Streets. foreign retailer adding new material to the CBD is UK giant retailer
This has seen vacancy across the prime retail strips fall below 3.5 Debenhams. The multinational retailer opened its first Australian
per cent in the three months to September 2017. store in St Collins Lane operating a non-traditional department
12store through a smaller format layout on two floors across 3,600 Melbourne CBD Gross Face Rents
sqm, offering curated range of brands not available elsewhere in $9,000 7%
Australia. $8,000
6%
$7,000
5%
Tenant moves in the East End
$6,000
$5,000 4%
$4,000
Within the Paris-end of the CBD, streetwear retailer Culture Kings 3%
$3,000
secured a lease at 19-25 Russell Street, which sits behind the $2,000
2%
Forum Theatre, committing 600sqm. This is a relocation from its $1,000
1%
Flinders and Queens Street premises and is due to open early $0
Sep-10 Sep-11 Sep-12 Sep-13 Sep-14 Sep-15 Sep-16 Sep-17 Sep-18 Sep-19 Sep-20
0%
December 2017.Colliers International negotiated the deal on a CBD gross face rent ($/sqm/pa) Incentives
10-year lease ranging from $1,300 to $1,500 per sqm. This is Source: Colliers International
the first time we are seeing premium fashion brands operate in
non-traditional retail strips within the Paris-end of the CBD. Along Melbourne CBD Retail Yields
Collins Street, Melbourne’s gentlemen-only Athenaeum Club has 10%
leased 400sqm to Fendi’s first flagship store trading near Prada
8%
and Hermes. The long-term leasing deal has an annual rent
between $1.8 to $2 million and will replace Ashley Opal Jewellers 6%
and Watches of Switzerland’s Rolex boutique. Bottega Veneta has
4%
committed as a tenant at former KPMG office at T&G Building
leasing 387sqm. 2%
Investment market
0%
-2%
Sep-94
Sep-95
Sep-96
Sep-97
Sep-99
Sep-98
Sep-20
Sep-10
Sep-12
Sep-14
Sep-13
Sep-15
Sep-16
Sep-17
Sep-18
Sep-19
Sep-11
Sep-00
Sep-02
Sep-04
Sep-03
Sep-05
Sep-06
Sep-07
Sep-08
Sep-09
Sep-01
Melbourne is dominating Australia’s population growth for the
first time. With the CBD named the most densely populated region
Spread Melbourne CBD Yields
across the nation, Melbourne’s migration boom is transforming the
Source: Colliers International
city’s culture with more choice and a wider variety of retailers.
This is likely to lead to job gains and expectations for a stronger
retail trading and turnover.
Yields have remained relatively stable averaging at 4.94 per
Institutional investors are actively managing their portfolios and
cent for the last two quarters of 2017. The spread between the
are remaining competitive and investing in redevelopments of
risk-free rate and prime assets are sitting at 229 basis points
prime assets. This has translated into opportunities surfacing in
as at September 2017 suggesting there is still room for further
Melbourne’s CBD laneways with domestic and offshore investors
compression over the current cycle, given the historical average
taking greater interest on retail laneways with high-yielding
spread is 92 basis points.
opportunities compared with main-street retail assets.
M City Monash, Clayton VIC
Retail leasing on behalf of Schiavello and Saraceno Groups
Retail | Research & Forecast Report | Second Half 2017 13Research &
Forecast Report
BRISBANE CBD & GOLD COAST
Retail | Second Half 2017
By Helen Swanson steady over the quarter at an average of $4,700/sqm and
Manager | Research incentives at an average 12.5 per cent. Prime Grade high street
helen.swanson@colliers.com retail net face rents in Brisbane’s CBD have grown 5 per cent year
on year to Q3 2017.
MARKET HIGHLIGHTS
Queens Wharf set to shake things up
Queensland’s modest retail turnover of 0.23 per cent year Currently under construction, the Queens Wharf development
on year is reflecting the current state of play is set to rejuvenate retailing in Brisbane City. The development
however is set to create increased competition for the established
Queens Wharf development set to shake up the retail high-end luxury tenancies within the city’s centre.
leasing market in Brisbane’s CBD with the potential for Although the Queens Wharf Integrated Resort is not forecasted
landlords to come under pressure to retain high end luxury for completion until 2022 to 2024, the anticipation of its release
retailers is already placing pressure on the owners of Brisbane’s high-
end retail tenancies. Global high-end luxury brands considering
Caution over future interest rate rises see investors take a opening in Brisbane are now contemplating either putting plans
more cautious approach to retail investments on hold until space becomes available at Queens Wharf and/or
negotiating their renewal around the developments completion.
Additionally, landlords operating within this space such as the
Retail sales data reflecting state of play in emerging Edward Street precinct may come under pressure to
Brisbane CBD retail leasing market retain their existing tenants by offering either higher incentives,
Retail sales growth figures have been quite volatile in Queensland affordable rents, and/or a combination of both. A recent example
ever since Cyclone Debbie hit the data in March this year. The of this is the recent Hugo Boss deal which was struck at circa
most recent data from September saw sales move back into $5,000/sqm with a generous incentive. This recent deal may
positive territory, up 0.26 per cent month on month, equating to a set a precedent and see some landlords in the Edward Street
gain of 0.23 per cent year on year. This compares to the national precinct look to review their previous record $6,500/sqm retail
average of 1.44 per cent, New South Wales’ gain of 2.34 per cent rates. Furthermore, there is also the threat that the opening of the
and Victoria’s gain of 2.29 per cent over the year. Queens Wharf development may also redirect tourist foot traffic
from Queen Street Mall to the new development.
A reflection of these figures, CBD retail leasing remains
challenging particularly for secondary grade stock located in Long awaited Elizabeth Arcade set to
inferior locations. Retail turnover for Queensland’s cafés and re-open doors
restaurants recorded negative year on year growth in September
2017 at -4.33 per cent. Recent deals in food courts located on The previously bare tiled façade of the 1966 built Elizabeth Street
the periphery of the CBD are being transacted with incentives of arcade, is set to give way as construction begins on the new $145
between 12 and 20 per cent. On a more positive note, however, million two-tower student residence. The development will benefit
Queen Street Mall fronting tenancies continue to attract strong from street frontage on both Elizabeth and Charlotte Streets and
interest from global and national based retailers, rents remain include 2,340 student beds. Additionally, the development also
stable and vacancy remains relatively tight. Prime Grade high includes a full refurbishment of circa 1,000 sqm of the original
street net face retail rents for product sub 250 sqm remained retail offering, providing 14 food and beverage retail tenancy
14opportunities. Keeping with the previous offering it is anticipated QLD Retail Turnover
that the Asian flavour as well as other global delights will continue 20%
to permeate throughout the new development once complete. 15%
DJ’s to open in Fortitude Valley
10%
5%
Fortitude Valley retail is booming with Brisbane’s first boutique
0%
David Jones opening its doors earlier in the year in James Street.
Being the first Queensland store of its kind, it spills over four -5%
levels and 14,000 sqm at 10 James Street, previously home to -10%
Space Furniture. The opening of the new store has presented new
Food HH goods Apparel DS Other Cafes & rest
opportunities for existing and future retail tenancies in the area. Source: ABS
The shop offers a smaller sized footprint with a more customised
feel. The opening has further enhanced the retail scene across Brisbane CBD Gross Face Rents ($/sqm/pa)
Brisbane and with a selection of international luxury operators it $5,000 18%
$4,500
is likely to place James street on the national retail map. $4,000
16%
14%
$3,500
12%
Gold Coast retail remaining strong $3,000
$2,500
10%
8%
A strong tourism market coupled with above average population $2,000
6%
$1,500
growth rate and strong residential sector has helped support the $1,000 4%
2%
retail property market over the last year across the Gold Coast. $500
$0 0%
Major projects in the pipeline such as the light rail extension
Sep-08
Sep-09
Mar-08
Sep-07
Mar-09
Sep-10
Mar-10
Sep-12
Sep-16
Mar-12
Sep-14
Sep-13
Sep-15
Mar-14
Mar-16
Mar-13
Mar-15
Sep-17
Mar-17
Sep-11
Mar-11
to the main commuter rail, the $970 million Jewel by Dalian Rent $/sqm Incentive
Wanda Group, $1.4 billion integrated residential resort Ruby, the Source: Colliers International
completed upgrades and extensions to Pacific Fair Shopping
Centre and Robina Town Centre along with the transformation With a significant amount of cap rate compression having already
and future development at The Star Casino at Broadbeach is occurred, and the outlook for inflation and rates somewhat
encapsulating a rejuvenation of retail across the Coast. uncertain, investors are becoming more selective in terms of asset
Demand remains strong for Coles and Woolworths anchor based acquisitions, particularly those that are secondary in quality. As a
centres where the number of specialities remain at a minimum. result, we believe the outlook for further cap rate compression in
Investors are becoming more selective, especially where majority smaller secondary grade assets is muted and are likely to stabilise
of income is not sourced from a major. In short supply but over the coming year.
high demand however are prime grade retail shopping centres
possessing a strong leasing covenant located in regions displaying
strong population growth forecasts.
Robinson Road Marketplace Aspley, QLD
Retail leasing on behalf of Re-Grow Retail Property
Retail | Research & Forecast Report | Second Half 2017 15Research &
Forecast Report
ADELAIDE
Retail | Second Half 2017
By Kate Gray Vacancy falls in Rundle Mall
Director | Research
kate.gray@colliers.com Vacancy in Rundle Mall has continued to fall with a vacancy of
1.4 per cent down from 4.2 per cent in September 2016. This is
the lowest level of vacancy we have recorded since mid-2013.
MARKET HIGHLIGHTS There are several new tenants which have moved into Rundle
Mall over the last half which included Silk Laser Clinics and
Vacancy on Rundle Mall falls
Athletes Foot. Several tenants have moved to a different position
on Rundle Mall over the last half which included Jo Mercer, Roger
Sales activity driven by private investors David and Michael Hill. Bank SA and Swarovski have both signed
new leases in new locations and work s underway in their new
Kaufland purchase their first site accommodation. Bank SA has taken space in the nearly complete
11-13 Rundle Mall. French Connection have closed on the corner of
Rundle Mall and Gawler Place. Demand for retail space on Rundle
Kaufland choose Adelaide for their first Mall has lifted over the second half which has resulted in vacancy
Australian store falling. Clothing and footwear remains the key tenant type in
Rundle Mall which accounts for nearly 40 percent of the tenants
Kaufland have purchased the old Le Cornu site on Anzac Highway
in the precinct.
at Forestville for $25 million. This is a 36,000 sqm site and will be
home to the first hypermart that Kaufland operates in Australia. It Rents however have remained steady at this stage and fall within
is expected that they will construct a 20,000 sqm store which will a wide band of $1,800/sqm to $3,800/sqm. Incentives have
add further competition to the Adelaide grocery market. Kaufland remained stable at 15 per cent, but as vacancy tightens on Rundle
is part of the German based Schwarz Group which also owns the Mall, incentives could decline, resulting in net effective rental
Lidl supermarket brand. The Schwarz Group have been actively growth.
looking for sites on the east coast, but have taken the opportunity
to enter the Adelaide market. Adelaide has a traditionally strong Citi centre has sold
independent grocery market through the IGA and Foodland brands, A private local investor purchased Citi Centre for $41 million from
and Costco and Aldi are only relatively new entrants to the market. a Singaporean investor. Citi Centre, is on the corner of Rundle Mall
Both Aldi and Costco are much more established in the East Coast and Pulteney Street, is a mixed-use building which has ground
markets. floor retail (2,611 sqm) and office accommodation above (13,750
sqm) sold in June. This is a leasehold site rather than freehold
Retail sales start to slow which is unusual for the Adelaide market. Citi Centre has frontage
Following approximately 12 months of outperformance relative to both Rundle Mall and Pulteney Street and there are future
to national averages, South Australian retail sales have started to opportunities to reposition the retail component of this asset,
ease. In terms of category performance, spending at cafes and which is currently configured as retail space with a food court.
restaurants has experienced consistent strength over the past two Other major sales include Churchill Centre South which was
years, exceeding both state and national levels of growth. purchased by a private investor from Axiom for $22.35 million
16with an initial yield of 7.2 per cent. Also, Port Pirie Plaza was
purchased by Prime West from a local private investor for $32.05 Rundle Mall Vacancy
million with settlement in September. Total retail sales in Adelaide 5.0%
to September was $116.54 million which was above the 2016 4.5%
4.0%
sales volume of $87.55 million. The retail market in Adelaide is a
3.5%
tightly held private market and therefore sales volumes tend to be
3.0%
lower in this asset class. 2.5%
2.0%
Redevelopment of Central Market Arcade 1.5%
1.0%
The Adelaide Central Market Arcade which is located between 0.5%
the Central market and Victoria Square is seeking expressions 0.0%
of interest for a redevelopment with a joint venture partner.
This arcade was last redeveloped in the 1960s and was under Source: Colliers International
a 50-year leasehold which was held in private hands for this
time, with the lease expiring in September 2018. Once the lease SA Retail Sales – Sept 2017 (% change YoY)
expires, the Adelaide City Council will have control of the site and 12%
9 .86%
the expressions of interest for a JV partner is to be run by the 10%
council. The aim of the redevelopment is to cement this precinct 8%
as a showcase for South Australian food, but also maximise 6%
3.5 9 %
other uses including car-parking in the levels above this precinct. 4%
2.04% 1.48%
2%
Construction is expected to commence in 2020.
0%
Large new developments planned -2% -0.82%
-1.72%
-4%
Food HH Goods Cloth & Foot Dept Store Other Caf & Rest
There are several large new retail developments in planning
Annual growth % SA National
stages. The first is Kings Junction located at Salisbury South,
Source: ABS
which over several stages is expected to span 75,000 sqm, being
developed by GIC Australia. The first stage is in pre-lease with
Kmart and Coles secured as anchor tenants. Burnside Village space last year with a fresh food hall and additional Aldi anchor.
is also investigating the opportunities around a future extension This centre has been earmarked for several years for a major
which is likely to be over two levels and include entertainment, redevelopment, with the most recent announcement being the
dining and more specialty stores. Westfield Marion also added expansion of the cinema and restaurant precinct.
Kings Junction, Salisbury South SA
Retail leasing and Real Estate Management on behalf of behalf of GIC Australia
Retail | Research & Forecast Report | Second Half 2017 17Research &
Forecast Report
PERTH
Retail | Second Half 2017
By Misha White armageddon. Although, a June 2017 survey by the WA Chamber of
Manager | Research Commerce and Industry revealed that consumers are now feeling
misha.white@colliers.com more confident than they have been in previous years
MARKET HIGHLIGHTS Current retail market conditions
It is likely that WA must still forge through some rather sluggish
There are signs that the WA economy is recovering retail conditions, which continued over the month of September.
Seasonally adjusted real retail turnover for the three months
Growth in aggregate retail spend underperforming but to September 2017 saw growth of 0.61 per cent year on year.
improving incrementally However, in comparison retail growth for the nation sat at 2.6 per
cent during the same period.
Major future retail expansion planned in Perth For the 12 months to September 2017 retail turnover for ‘Cafes
and Restaurants’ experienced 8.1 per cent growth in comparison
to the previous year. Meanwhile food increased by 1.0 per cent.
Are we there yet? The changing landscape of the retail market has seen ‘Department
It’s no secret that the WA economy has been struggling for several Stores’ turnover continue to contract, declining -4.0 per cent
years and there has been much conjecture about whether the compared to the previous year end September. This aligned with
green shoots appearing will grow into something more substantial. the 3.2 per cent fall in ‘Clothing and Soft Goods’. ‘Household
Although Perth’s population growth is still weak, recent Goods’ also declined, falling 4.4 per cent.
improvements provide hope that the WA economy is starting to Population growth was a low 0.72 per cent in March 2017.
look up and that this will flow through to the retail market. Subdued wage growth and increases in non-retail costs such as
Seasonally adjusted State Final Demand, which is effectively the energy and some variable home loan interest rates have assisted
level of spending within WA, regardless of the origin of goods in keeping a cap on discretionary spend.
and services, has yet to record positive growth since June 2015. Retail spend per capita rose a lacklustre 0.45 per cent over the
However, after significant declines, there finally seems to be a year to $3,303 in March 2017. Even so, WA spend still manages to
light at the end of the tunnel with the last 3 quarters recording outshine the national average of $3,143 per person.
more stable conditions.
Retail employment was down for the September 2017 quarter,
Previously, consumers in WA have shied away from spending with the ABS reporting a 5.4 per cent year-on-year fall. This
due to; employment uncertainty, the residential property market, represents a loss of 7,300 retail positions, although the sector
and fear of a deeper mining downturn. Combine this with slowing still generates the third largest amount of jobs in WA.
wage growth, reduced confidence and a diminishing wealth base
Weak demand for retail space in Perth continues to create
(due to the decline in median house price), and this has meant
vacancies and impact rental growth. However, CBD mall rents
that consumers have had their hands firmly in their pockets for a
have begun to stabilise and were averaging $3,430/sqm/pa
protracted period.
for space ranging between 50sqm and 100sqm at the end of
Instead, WA households have been busy paying down debt September 2017. This is the same as it was at the end of June
and increasing savings to survive the perceived economic 2017.
18Neighbourhood centre rents also experienced some stability with WA State Final Demand
rents remaining at an average of $493/sqm/pa over both the June 18%
and September 2017 quarters.
16%
14%
12%
10%
Perth’s retail expansion 8%
6%
4%
Even with the explosion in online shopping, Perth’s retail footprint 2%
0%
is set to expand rapidly. Major suburban and CBD centre owners -2%
-4%
remain optimistic about Perth’s future, and are forging ahead with -6%
-8%
significant redevelopment and expansion plans. Recent changes -10%
-12%
to the WA town planning rules and the focus on the creation of
Feb-08
Feb-09
Feb-07
Feb-10
Feb-12
Feb-14
Jun-06
Feb-15
Feb-16
Jun-08
Jun-09
Feb-13
Jun-07
Feb-17
Jun-10
Jun-12
Jun-14
Jun-16
Jun-13
Jun-15
Feb-11
Jun-17
Jun-11
Oct-06
Oct-08
Oct-09
Oct-07
Oct-10
Oct-12
Oct-14
Oct-15
Oct-16
Oct-13
Oct-11
“activity centres” by the State Government have been the main QoQ YoY 10Y ave
precursor for this growth in centre sizes. Source: Colliers International
Some of this expansion has also be driven by a need to “keep
Perth CBD Gross Face Rents ($/sqm/pa)
up with the Joneses”. Major retail offerings that do not revamp
$4,500
and remain competitive run the risk of having their catchment
$4,000
cannibalised by other larger and more attractive centres nearby.
$3,500
This retail revitalisation includes the redevelopment of Raine
Square, Forrest Chase and Plaza Arcade in the CBD, as well as $3,000
the expansion of the existing suburban shopping centres Whitford
$2,500
City, Karrinyup, Garden City, Morley Galleria, Westfield Carousel,
$2,000
Westfield Innaloo and Midland Gate.
$1,500
The outlook 2005 2006 2007 2008 2009 2010 2011 2012 2013 2014 2015 2016 2017
Source: Colliers International
Robust demand continues for investment grade retail assets in
Perth and there are many signs that the WA economy has started Real Retail Turnover Growth Forecast
to stabilise. A recent survey by the Property Council recorded a 10%
9%
significant shift in business confidence for WA, jumping 24 points 8%
for the quarter – the highest rise of all the states. 7%
6%
5%
It still may take some time for the strengthening of key indicators 4%
in the WA economy to flow through and affect the retail sector. 3%
2%
Deloitte Access Economics is forecasting improving, but still soft 1%
retail conditions for WA for the remainder of 2017. However, 0%
-1%
expectations for 2019-20 are that turnover growth will rebound
and surpass the national growth rate. WA AU
Source: Deloitte Access Economics
Parnawarri Retail Centre Newman, WA
Retail Leasing on behalf of AMP Capital
Retail | Research & Forecast Report | Second Half 2017 19Research &
Forecast Report
CENTRES
Retail | Second Half 2017
By Daniel Lees related blogs together with thousands of images, social media
Director | Research posts and archives to understand trends and draw inspiration.
daniel.lees@colliers.com However, some forms of artificial intelligence allow fashion brands
to carry out this analysis in house, in real time. For example, IBM’s
Watson cognitive system has allowed some fashion designers to
MARKET HIGHLIGHTS
analyse ten years’ worth of fashion runway images and look books
in conjunction with real time analysis from Twitter, Instagram and
Technology will provide opportunities for retailers through
Pinterest. In these instances, not only did the utilisation of IBM’s
artificial intelligence and cognitive computing
Watson technology accelerate the information gathering phase by
600 per cent, the cognitive component of the technology predicted
Escalating utility prices will incentivise landlords to invest in a future shift in trends that could then be adopted by designers
cost mitigation solutions and boost sales. It’s important to note that these cognitive learning
technologies don’t completely replace processes, but rather
Leasing backdrop remains resilient despite soft retail market enhance and accelerate them, learning and anticipating patterns
sentiment along the way.
Cognitive computing and artificial intelligence can also help
retailers to better meet customer expectations. According to a
Retail trends recent study by Desk.com, more than 22 per cent of millennials
expect a response within 10 minutes of reaching out to a brand via
Retail tech social media, while 52 per cent will abandon an online purchase
if they can’t find a quick answer. For this reason, big brands are
With all the discussion surrounding Amazon and disruption that
increasingly turning to chatbots to better engage with millennial
has captured the market over the past 12 months, one could be
customers, offering a 24/7 service and answering queries as
forgiven for thinking that all things tech related are a threat to the
soon as they are received. The need for fast responses combined
retail sector. Disruption can be painful, however those entities able
with chatbot technology means that conversational commerce,
to harness technological change will be able to better anticipate
(the act of purchasing goods through online conversations) is
customer needs, tailor solutions, curate seamless purchase
set to expand rapidly, and this technology will be powered largely
experiences, exceed expectations and lower cost structures.
through artificial intelligence and cognitive computing. Chatbots
powered through artificial intelligence will arm businesses with
Cognitive computing and artificial intelligence
the ability to engage millennials via messaging apps. Using big
The utilisation of cognitive computing and artificial intelligence data and paired with advanced analytics – these platforms can
can complete retail related tasks in time frames that were once use purchasing and browsing history to offer personalised product
unimaginable, for a fraction of the cost. For example, fast fashion options perfectly matched to each individual. The stark reality of
retailers typically employ external trend analysis companies to tell consumer commerce is that chatbots are the only viable solution
them what the future fashion trends will be. Many brands will start to this emerging market space. The sheer volume of the audience
conceptualising and designing what their product ranges will look makes it almost impossible for businesses to hire the human
like a year prior to the actual selling season. Fashion houses and salesforce that can leverage this opportunity and still offer a
external trend analysis companies will study hundreds of fashion credible profit margin.
20The Internet of Things (IoT) creating a Regional Centres - 3Q17 Gross Face Rents ($/sqm/pa)
connected store or shopping centre $2,000
$1,800
10.0%
5.0%
While annual online sales growth has significantly outpaced that $1,600
$1,400
of bricks and mortar for the past three years, the overwhelming $1,200
0.0%
majority of retail transactions are still carried out in-store. $1,000 -5.0%
Furthermore, the trend for major online retail operators to broaden $800
-10.0%
$600
their sales capabilities into physical retail, means that in-store
$400
-15.0%
retail technology is advancing rapidly via online to offline (O2O) $200
strategies and application of IoT. With data from IoT, retail store $0 -20.0%
Sydney Melbourne Brisbane Perth Adelaide
operations can become vastly more efficient: Gross face rent % growth YoY
Source: Colliers International
• Food loss: temperature sensors within refrigeration sections
can trigger alerts if produce reaches unsafe temperatures to Sub regional Centres - 3Q17 Gross face rents ($/sqm/pa)
prevent spoilage. $1,600 4.0%
$1,400
• Energy use: data from occupancy sensors enable air 2.0%
$1,200
conditioning and lighting to automatically adjust to variations 0.0%
$1,000
of need between peak and off-peak hours.
$800 -2.0%
• Preventative maintenance: the analysis of equipment data $600
-4.0%
such as temperature, vibrations and consumption, so that $400
retailers and landlords can better predict when equipment $200
-6.0%
will fail and employ pre-emptive measures. $0 -8.0%
Sydney Melbourne Brisbane Perth Adelaide
• Queue management: using heatmaps of shopper density and Gross face rent % growth YoY
location, retailers and landlords can offer timely services and Source: Colliers International
reallocate staff to meet demand in real time.
• Shopper insights: insights from in-store behaviour, purchase Neighbourhood Centres - 3Q17 Gross face rents ($/sqm/pa)
$1,200 5.0%
history and social media activities can help retailers to
$1,000 0.0%
provide personalised offers and predict future trends.
$800 -5.0%
• Inventory management: Radio Frequency Identification
$600 -10.0%
(RFID) tags can capture data including GPS location,
temperature, pressure and other information, helping retailers $400 -15.0%
track inventory across the supply chain and restock shelves $200 -20.0%
or stores to meet demand and improve customer satisfaction. $0 -25.0%
Sydney Melbourne Brisbane Perth Adelaide
• Automated ordering and packing of supply: supermarket
Gross face rent % growth YoY
ordering can be automated through point of sales data
Source: Colliers International
rather than manual entry and sent directly to distribution or
fulfilment centres. These orders are then packed onto pallets
automatically via algorithms, so they can be unpacked in aisle Energy markets
sequence specific to a particular store.
Due to a raft of political and regulatory factors, Australia is
• Fleet management: GPS location and weather data provide
now facing a domestic energy crisis that is having far reaching
information about road and environmental conditions that
consequences. According to the Australian Energy Regulator,
enables better rout planning and ensure driver safety.
wholesale weighted average spot electricity prices have risen
• Fraud prevention: using real-time analytics to manage significantly, more than doubling in the three years to September
complex vendor networks, ensuring shipment, product quality 2017. The commercial property sector is now grappling with the
and pricing accuracy. fragility of the Australian energy market, a topic that was raised
frequently by landlords throughout the FYE2017 reporting season.
Taking a more optimistic outlook, our ability as a nation to embrace
new technology and change has the potential to place commercial
Retail | Research & Forecast Report | Second Half 2017 21You can also read