Darkest before dawn - Shariah perspective
←
→
Page content transcription
If your browser does not render page correctly, please read the page content below

Malaysia
July 29, 2021
Strategy
Darkest before dawn – Shariah perspective
by Ivy NG Lee Fang, CFA │ T: (60) 3 2261 9073 │ E: ivy.ng@cgs-cimb.com
This report delineates our 2H21F equity strategy outlook from a Shariah perspective.
The market was hit by a perfect storm in 1H21 with persistently high Covid-19 cases, multiple lockdowns, ESG
concerns and political uncertainty.
At the current run rate, we project Malaysia to be on track to inoculate around 70-80% of the population by 4Q21.
We expect recovery stocks to see renewed interest in 4Q and the market to re-rate to our KLCI target of 1,604 pts,
after an anticipated lacklustre 3Q21.
We provide six trading themes for 2H21F in this report; our top Shariah sector picks are Islamic banking,
healthcare, media, oil & gas, packaging, semiconductor, EMS, transport and utilities.
Our top three Shariah stock picks are Gamuda, Telekom Malaysia and Unisem.
IMPORTANT DISCLOSURES, INCLUDING ANY REQUIRED RESEARCH CERTIFICATIONS, ARE PROVIDED AT THE END OF THIS REPORT. IF THIS REPORT IS DISTRIBUTED IN THE UNITED STATES IT IS DISTRIBUTED BY CGS-CIMB SECURITIES (USA), INC. Powered by the EFA
AND IS CONSIDERED THIRD-PARTY AFFILIATED RESEARCH. Platform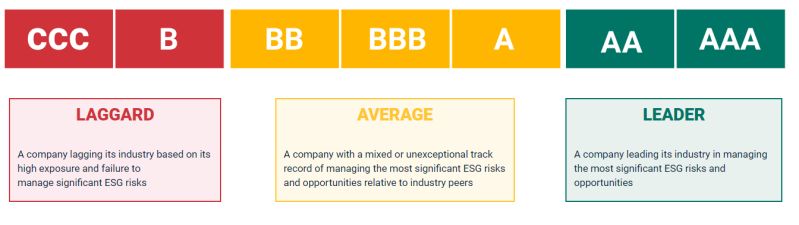
Malaysia │ Strategy │ July 29, 2021

Content Page
Key takeaways of our views on the outlook for 2H21F               3
Shariah-compliant investments                                     4
1H21 review                                                       6
Outlook                                                           17
Malaysian retail investors’ survey                                27
ESG ratings from F4GBM index perspective                          28
Key trading thematics                                             29
Risks                                                             37
Market valuations                                                 42
Economic outlook                                                  44
Technical analysis                                                49
Top picks and sector ratings                                      51

                                                              2
Malaysia │ Strategy │ July 29, 2021
Key takeaways of our views on the outlook for 2H21F
The market was hit by a perfect storm in 1H21 with persistently high Covid-19 cases, multiple lockdowns, ESG
concerns and political uncertainty.
We are of the view that market may be lacklustre in 3Q21 due to concerns over political uncertainty and ongoing
lockdown measures, which are likely to dent corporate earnings in 2Q21 and 3Q21.
Our analysis suggests that the government can achieve its target to fully vaccinate 70-80% of the population by 4Q
at the current daily vaccination run rate.
This would pave the way for the economy to fully reopen in 4Q, leading to stronger corporate earnings.
This could also coincide with the return of net buy flows from local institutional investors, leading the market to re-
rate in 4Q21.
Among the key events to watch in 2H21F are the tabling of the 12th Malaysia Plan and 2022 Budget on 20 Sep and
29 Oct, respectively. The 2Q earnings season in Aug and 3Q earnings season in Nov as well as political
developments and parliament meetings in Jul, Sep and Nov are also likely determinants of market direction.
The key concerns are emergence of Covid-19 variants that are vaccine-resistant, slower-than-expected vaccine
rollout, worsening political uncertainty and the sustainability of aggressive fiscal and monetary stimulus measures.
We expect KLCI earnings to rise 37.4% in 2021F and 1.9% in 2022F. We maintain our end-2021 KLCI target at
1,604 points based on P/E target of 14.2x (1.5 s.d. below 3-year mean P/E).
We advise investors to position themselves in recovery stocks in Aug/Sep ahead of the expected full reopening of
the economy in 4Q21F.
The six themes for 2H21 are: (1) laggard plays, (2) M&A/value plays, (3) high dividend yielders, (4) beneficiary of
OPR rate hikes, (5) recovery plays, and (6) ESG picks. Our top three picks are Gamuda, Telekom and Unisem.
Our preferred sectors are Islamic banks, oil and gas, media, healthcare, EMS, technology, packaging, transport and
utilities.
3Malaysia │ Strategy │ July 29, 2021
Shariah-compliant PLCs rising over the past years
Total securities in Bursa % of shariah-compliant
Main Market/Ace Market No. of shariah compliant securities Sectoral breakdown (%)
Malaysia securities within the sector
Industrial products & services 222 30% 266 83%
Consumer products & services 147 20% 197 75%
Property 88 12% 99 89%
Technology 85 11% 100 85%
Construction 55 7% 59 93%
Plantation 34 5% 43 79%
Transportation and logistics 27 4% 35 77%
Energy 28 4% 33 85%
Telecommunications & media 23 3% 32 72%
Healthcare 23 3% 24 96%
Utilities 11 1% 13 85%
Financial services 3 0% 33 9%
SPAC 1 na
Closed-end funds 1 na
Total 746 100% 936 80%
Data as at 24-May-21
SOURCES: CGS-CIMB RESEARCH, BURSA MALAYSIA , SECURITIES COMMISION
4Malaysia │ Strategy │ July 29, 2021
Increasing interest in Shariah investments
The total Islamic assets under management for the Malaysian fund management industry grew from 22% of total
assets in 2017 to 23.7% in May 2021.
The Islamic unit trust size expanded at a faster pace, accounting for 24.7% of the total net asset value of unit trusts
in May 2021 vs. 18.2% in 2017. Total Islamic assets under management stood at RM223.7bn at end-May 2021.
Islamic Assets under Management Islamic Assets under Management Islamic Unit Trust Net Asset Value Islamic Unit Trust Net Asset Value
Period
(RM bn) (% of total) (RM bn) (% of total)
Annual
2017 170.8 22.0 77.8 18.2
2018 158.8 21.4 83.5 19.6
2019 180.5 21.9 107.3 22.3
2020 216.8 23.9 128.5 24.7
Monthly
Jan-21 220.4 24.2 131.7 25.2
Feb-21 220.3 23.9 130.7 24.8
Mar-21 224.9 24.2 134.6 25.2
Apr-21 222.9 23.7 132.6 24.7
May-21 223.7 23.7 133.0 24.7
SOURCES: CGS-CIMB RESEARCH, SECURITIES COMISSION
5Malaysia │ Strategy │ July 29, 2021
Recap of market performance in 1H21
The KLCI fell 6% or 95 pts in 1H21 as the market was hit by a series of negative newsflows –
declaration of state of emergency in Jan to combat Covid-19, reinstatement of various Movement
Control Orders in 1H21, rise in Covid-19 cases and slow vaccination progress.
1H21 was a less volatile ride vs. 1H20 due to the availability of Covid-19 vaccines, high commodity
prices, strong exports in 1H21 and various stimulus measures announced by the government.
However, the market was not able to leverage the positive newsflow we had predicted in 1H21 as the
strong 1Q results season and liquidity from stimulus measures were offset by concerns over stricter
movement controls in 1H21, persistently high Covid-19 cases due partly to the emergence of new
Covid-19 variants, slow vaccination progress, and political uncertainty.
We are of the view that these, along with various ESG risks affecting Malaysian listed companies,
have led foreign investors to reduce their exposure to Malaysia, further dampening the Malaysian
stock market’s performance in 1H21.
The fund flows data showed foreign investors net sold RM4.2bn worth of Malaysian equities in 1H21
and foreign shareholdings in Malaysia fell 0.4%-pt from 20.7% as at end-Dec 2020 to 20.3% as at
end-Jun 2021.
6Malaysia │ Strategy │ July 29, 2021
Key market events in 1H21
11-Jan - TSMY announced that 18-Mar - Govt 29-Mar - US CBP finds Top 10-May - Whole of Malaysia to be 28-May - Malaysia to impose total
the MCO will be reinstated in introduced an Glove products manufactured placed under MCO from 12 May to 7 nationwide lockdown from June 1-
Penang, Selangor, Malacca, additional using convicts and forced labour Jun 14 under FMCO
1660 stimulus package 30-Mar - CMCO in Selangor, 11-May - Malaysia'a 1Q21 GDP 29-May - Covid-19 new cases
Johor, Sabah, as well as the
federal territories of Kuala PEMERKASA Kuala Lumpur, Johor, Kelantan, declined 0.5% yoy exceed 9,000 mark while new
Lumpur, Putrajaya, and Labuan worth RM20bn Penang and Sarawak has been 19-May - Covid-19 new cases deaths reach record high of 98
1640 starting 13 Jan for two weeks extended for another two weeks exceed 6,000, breaking previous 11-Jun - FMCO extended for
12-Jan - YDPA has consented 31-Mar - Govt introduces new record high of 5,728 on 30 Jan 2021 another 2 weeks until 28 June
to declaring a nationwide state of emergency law, allows approval 22-May - Malaysia imposes stricter 2021
emergency until Aug 1, 2021 to of additional spending without movement restrictions ,MCO3.0+ 15-Jun - TSMY unveiled the
1620 control the spread of Covid-19 going through Parliament which limits business operating hours National Recovery Plan
from 8am to 8pm comprising four phases of exit
strategy out of the Covid-19
pandemic
1600
27-Jun -
12-Apr - CMCO in Phase One of
16-Mar - CMCO for Selangor, Kuala the PPN will be
1580 Selangor, Kuala Lumpur, Penang, extended until
Lumpur, Penang, Johor and Kelantan the three key
Johor and Kelantan has been extended threshold value
has been extended for another two indicators are
1560 16-Jan - Malaysia new Covid-19 cases to 31 Mar weeks 28 Apr achieved
exceed 4,000 mark for the first time
18-Jan - Malaysia government unveiled 16-Feb - MCO in Selangor, KL, Johor and 28-Apr - Malaysia new daily COVID-19 cases exceed
an RM15bn PERMAI stimulus package Penang extended until 4 Mar. Other states 3,000 mark for the first time since 24 Feb 2021
1540 spread over 22 initiatives aimed at except Perlis will be placed under CMCO 4-May - Six districts in Selangor placed under MCO
combating the Covid-19 outbreak 24-Feb - Malaysia starts vaccination rollout, with for 2 weeks from 6 May
21-Jan - MCO implemented in six states TSMY and Health DG Noor Hisham among the 5-May- Kuala Lumpur and several districts in 28-Jun - TSMY unveiled Pakej
and three federal territories was first to receive first dose of Covid-19 vaccine Terengganu, Johor and Perak will be placed under Perlindungan Rakyat dan
1520 extended further until 4 Feb 2-Mar - MCO in Selangor, Kuala Lumpur Johor MCO for 2 weeks from 7 May. Pemulihan Ekonomi (PEMULIH)
2-Feb - MCO extended for all states until and Penang to be replaced with CMCO for 2 8-May - Nationwide ban on inter-district, inter-state worth RM150bn, inclusive of a fiscal
18 Feb except for Sarawak weeks starting 5 Mar travel from May 10 to 6 Jun injection of RM10bn
1500
Jan-21 Feb-21 Mar-21 Apr-21 May-21 Jun-21
FBMKLCI Index
MCO: Movement Control Order
CMCO: Conditional Movement Control Order
FMCO: Full Movement Control Order
TSMY: Tan Sri Mahiaddin Yassin, Prime Minister of Malaysia
YDPA: Malaysia’s King, Yang di-Pertuan Agong Al-Sultan Abdullah Ri’ayatuddin Al-Mustafa Billah Shah
Data up to 30-Jun-2021
SOURCES: CGS-CIMB RESEARCH, BLOOMBERG , VARIOUS NEWS ARTICLES
7Malaysia │ Strategy │ July 29, 2021
Comparing performances of FBM KLCI and FBM Hijrah index
The FBM KLCI comprises the 30 largest companies on Bursa Malaysia by market capitalisation that
meet the eligibility criteria of FTSE Bursa Malaysia Index Ground Rules.
FBM Hijrah Shariah Index outperformed the conventional FBM KLCI index in seven out of the past
ten years (2011-20).
A closer analysis reveals that one of the key determinants of the relative performance of KLCI vs.
Hijrah Shariah Index is the banking sector’s performance.
This is because six out of the 30 constituents in the KLCI index are banks that are non-Shariah
compliant; these formed around 35% of KLCI’s total weightage on 30 June 2021.
As at 30 June 2021, the key heavyweights in the Hijrah Shariah index were the telecommunications
(19.13% of total index weight), food and beverages (17.41%), healthcare (16.79%) and utilities
(14.81%) sectors.
The top three companies with the highest weightage in FBM Hijrah Shariah Index are Tenaga,
Petronas Chemical and Top Glove.
8Malaysia │ Strategy │ July 29, 2021
FBM Hijrah Shariah outperformed FBM KLCI in 7 out of the past 10 years
FBM Hijrah Shariah vs. FBM KLCI in 2020 FBM Hijrah Shariah vs. FBM KLCI in 1H21
120 106
115 104
110
102
105
100
100
95 98
90 96
85 94
80
92
75
70 90
Feb-21
Mar-21
Jan-21
Jan-21
Feb-21
Feb-21
Feb-21
Mar-21
Mar-21
Mar-21
Mar-21
Jun-21
Jun-21
Jan-21
Jan-21
Jun-21
Jun-21
Apr-21
Apr-21
Apr-21
Apr-21
May-21
May-21
May-21
May-21
May-21
FBMKLCI Index FBMHS Index FBMKLCI Index FBMHS Index
SOURCES: CGS-CIMB RESEARCH, BLOOMBERG
9Malaysia │ Strategy │ July 29, 2021
FBM KLCI vs. FBM Hijrah Shariah index
FBM KLCI Top 10 Constituents FBM Hijrah Shariah Top 10 Constituents
Constituent Weight (%) Constituent Weight (%)
Public Bank 13.09 Tenaga Nasional 12.03
Malayan Banking 10.01 Petronas Chemicals Group 7.15
Tenaga Nasional 7.88 Top Glove Corp 6.92
CIMB Group Holdings 6.62 Press Metal Aluminium Holdings 5.7
Petronas Chemicals Group 4.69 Axiata Group 5.44
Top Glove Corp 4.53 IHH Healthcare 5.11
Press Metal Aluminium Holdings 3.74 Digi.com 4.75
Axiata Group 3.56 Sime Darby Plantation 4.46
IHH Healthcare 3.35 Dialog Group 4.15
Digi.com 3.11 Maxis 3.78
Total 60.58 Total 59.49
FBMKLCI sector breakdown FBM Hijrah Shariah sector breakdown
Sector No. of constituents Weight (%) Sector No. of constituents Weight (%)
Telecommunications 4 11.6 Telecommunications 5 19.1
Food Beverage and Tobacco 5 11.5 Food Beverage and Tobacco 7 17.4
Health Care 3 10.2 Health Care 4 16.8
Utilities 2 9.7 Utilities 2 14.8
Chemicals 1 4.7 Chemicals 1 7.2
Energy 2 4.1 Energy 2 6.2
Basic Resources 1 3.7 Basic Resources 1 5.7
Industrial Goods and Services 3 5.0 Industrial Goods and Services 3 4.3
Retailers 1 0.7 Retailers 1 1.1
Travel and Leisure 2 3.9 Construction and Materials 2 4.0
Banks 6 34.8 Technology 2 3.4
Total 30 100.0 Total 30 100.0
Note : Data as at end-Jan 21
SOURCES: CGS-CIMB RESEARCH, FTSE RUSSELL BLOOMBERG
10Malaysia │ Strategy │ July 29, 2021
Shariah indices underperformed conventional indices in 1H21
The technology and transport sectors were the top performing sectors in 1H21.
The energy, plantation and healthcare sectors were the worst performing sectors in 1H21.
FBM Hijrah Shariah and FBM Emas Shariah indices underperformed the FBM KLCI indices in 1H21. This is due mainly to the
outperformance of the finance sector against the healthcare and utilities sectors in 1H21.
Index 2015 2016 2017 2018 2019 2020 1H21
% yoy % yoy % yoy % yoy % yoy % yoy % chg
Bursa Malaysia Technology 52.4% -13.3% 89.7% -29.9% 29.2% 83.9% 13.0%
Bursa Malaysia Transport 2.4% 0.2% 6.9% -32.1% 4.6% 4.7% 9.1%
FBM Fledgling 18.2% -4.5% 17.0% -23.3% 6.7% 30.3% 4.8%
Bursa Malaysia Industrial Production 21.6% -7.3% 21.1% -4.8% -7.9% 16.1% 4.6%
Bursa Malaysia Telecom -2.8% -7.3% -2.5% -39.0% 12.1% -2.0% 4.5%
FBM Small Cap 6.0% -7.7% 15.9% -33.7% 25.4% 9.9% -0.9%
Bursa Malaysia Finance -9.8% 1.6% 17.2% 2.6% -10.6% -1.0% -1.4%
Bursa Malaysia Consumer 5.8% -2.1% 12.1% 1.6% -0.3% -7.6% -2.0%
FBM Small Cap Shariah 9.5% -9.4% 11.1% -34.8% 26.9% 15.4% -2.1%
Bursa Malaysia REIT -0.9% 11.2% 4.8% -12.5% 4.1% -13.4% -2.5%
FBM Mid 70 0.5% -0.8% 23.4% -18.7% 8.7% 6.6% -4.4%
Bursa Malaysia Property -7.6% -5.0% 8.8% -28.6% -5.2% -11.5% -4.7%
FBM Emas -2.3% -2.8% 12.9% -10.9% -1.8% 3.9% -5.1%
FBM Top 100 -2.9% -2.5% 12.7% -9.3% -2.9% 3.5% -5.5%
FBM KLCI -3.9% -3.0% 9.4% -5.9% -6.0% 2.4% -5.8%
FBM Emas Shariah 2.3% -6.1% 10.7% -13.5% 3.9% 10.1% -7.5%
Bursa Malaysia Utilities 1.5% -5.0% -2.1% -5.4% 7.8% -1.6% -8.1%
Bursa Malaysia Construction -0.8% 3.0% 9.8% -50.2% 34.3% -10.8% -10.2%
FBM Hijrah Shariah -0.9% -6.3% 8.2% -9.8% 0.8% 8.5% -10.8%
Bursa Malaysia Energy -18.8% -18.9% 32.5% -36.6% 51.3% -27.8% -11.9%
Bursa Malaysia Plantation -3.4% 1.7% 2.0% -12.7% 12.0% -5.6% -12.3%
Bursa Malaysia Healthcare 60.9% -12.0% 18.5% 10.1% -4.2% 185.6% -19.2%
FBM Ace 13.0% -25.2% 38.1% -34.6% 21.1% 105.4% -35.3%
SOURCES: CGS-CIMB RESEARCH, BLOOMBERG
11Malaysia │ Strategy │ July 29, 2021
Performance of global and regional markets
Malaysia was the worst performer and the only market that posted negative returns among the MIST (Malaysia, Indonesia, Singapore
and Thailand) markets in 1H21. This could be due partly to profit-taking in glove sectors after its outperformance in 2020.
Global indexes 2015 2016 2017 2018 2019 2020 1H21
% yoy % yoy % yoy % yoy % yoy % yoy chg
Taiwan Taiex Index -10.4% 11.0% 15.0% -8.6% 23.3% 22.8% 20.5%
KOSPI Index 2.4% 3.3% 21.8% -17.3% 7.7% 30.8% 14.7%
Dow Jones Indus. Avg -2.2% 13.4% 25.1% -5.6% 22.3% 7.2% 12.7%
Nasdaq Composite Index 5.7% 7.5% 28.2% -3.9% 35.2% 43.6% 12.5%
S&P BSE Sensex Index -5.0% 1.9% 27.9% 5.9% 14.4% 15.8% 9.9%
FTSE 100 Index -4.9% 14.4% 7.6% -12.5% 12.1% -14.3% 8.9%
Hang Seng Index -7.2% 0.4% 36.0% -13.6% 9.1% -3.4% 5.9%
MSCI AC Asia x Japan -11.3% 2.9% 38.7% -16.4% 15.4% 22.5% 5.5%
Nikkei 225 9.1% 0.4% 19.1% -12.1% 18.2% 16.0% 4.9%
Shanghai SE Composite Index 9.4% -12.3% 6.6% -24.6% 22.3% 13.9% 3.4%
FTSE Bursa Malaysia KLCI -3.9% -3.0% 9.4% -5.9% -6.0% 2.4% -5.8%
FBM Hijrah Shariah -0.9% -6.3% 8.2% -9.8% 0.8% 8.5% -10.8%
Regional indexes 2015 2016 2017 2018 2019 2020 1H21
% yoy % yoy % yoy % yoy % yoy % yoy chg
Straits Times Index STI -14.3% -0.1% 18.1% -9.8% 5.0% -11.8% 10.1%
Thai Index -14.0% 19.8% 13.7% -10.8% 1.0% -8.3% 9.6%
Jakarta Composite Index -12.1% 15.3% 20.0% -2.5% 1.7% -5.1% 0.1%
PSEi - Philippine SE Index -3.9% -1.6% 25.1% -12.8% 4.7% -8.6% -3.3%
FBM KLCI -3.9% -3.0% 9.4% -5.9% -6.0% 2.4% -5.8%
FBM Hijrah Shariah -0.9% -6.3% 8.2% -9.8% 0.8% 8.5% -10.8%
SOURCES: CGS-CIMB RESEARCH, BLOOMBERG
12Malaysia │ Strategy │ July 29, 2021
Only 9 KLCI constituents delivered positive returns in 1H21
KLCI constituents 2015 2016 2017 2018 2019 2020 1H21
% yoy % yoy % yoy % yoy % yoy % yoy chg
Mr DIY Group - - - - - - 15.1%
Press Metal -16.2% 119.4% 245.3% -9.2% -2.6% 80.4% 13.9%
Telekom Malaysia -28.2% -1.4% 6.3% 2.1% -5.3% 41.9% 12.2%
Genting -16.9% 9.5% 17.5% -32.0% 2.2% -26.3% 10.5%
Petronas Chemicals 37.3% -1.6% 14.0% 24.7% -18.0% 1.1% 8.5%
CIMB Group -17.2% 4.5% 51.2% -9.3% -5.1% -16.5% 8.2%
Genting Malaysia Bhd 9.3% 6.3% 26.8% -44.3% 15.5% -18.2% 3.0%
Hong Leong Bank 2.4% 3.6% 29.7% 22.9% -12.8% 5.2% 2.9%
Axiata Group -5.8% -24.1% 18.1% -27.0% 7.8% -9.6% 0.0%
Digi.Com -8.7% -6.6% 9.7% -7.9% 3.1% -7.2% -0.2%
Public Bank Bhd 4.3% 9.8% 8.5% 22.5% -19.0% 6.0% -0.2%
Maybank -2.4% 3.7% 26.6% 2.8% -3.1% -2.1% -0.3%
IHH Healthcare 37.2% -3.0% -7.2% -7.6% 2.0% 0.6% -0.5%
RHB Bank -22.3% 11.3% 8.6% 9.3% 14.3% -5.7% -0.9%
PPB Group 12.9% 1.3% 10.3% 24.3% 8.8% -1.7% -1.2%
MISC 32.1% -18.5% 6.6% -5.4% 29.9% -17.7% -1.3%
Hong Leong Financial -11.7% 4.5% 28.5% 6.0% -6.8% 6.9% -1.4%
Nestle (Malaysia) 11.7% 10.4% 36.2% 45.6% 1.7% -5.5% -4.0%
Sime Darby Berhad -13.0% 8.1% 29.7% 11.9% -3.3% 4.1% -5.6%
Tenaga Nasional -1.4% 6.8% 14.4% -7.9% 1.5% -21.2% -5.7%
Hap Seng Consolidated 46.2% 43.0% 11.9% 6.9% 5.0% -13.8% -9.3%
Petronas Gas 5.1% -3.6% -15.0% 14.1% -9.6% 3.4% -9.8%
Maxis 3.9% -9.1% 3.8% -7.8% 3.2% -5.0% -13.1%
Petronas Dagangan 49.7% -1.8% 5.2% 13.4% -10.3% -7.4% -13.1%
Kuala Lumpur Kepong 2.8% 6.9% 6.3% 0.9% 2.2% -3.3% -14.0%
IOI Corp -5.1% 0.4% 5.3% 2.4% 5.5% -5.5% -14.2%
Dialog Group 8.2% -2.4% 65.0% 25.1% 12.2% 0.1% -16.2%
Sime Darby Plantations - - - -17.8% 14.9% -8.4% -19.9%
Top Glove Corp 210.1% -19.3% 53.3% 42.3% -13.8% 308.1% -32.0%
Hartalega 71.7% -17.2% 124.4% 16.5% -9.4% 125.1% -39.6%
Note : Light blue represents Shariah-compliant constituents
SOURCES: CGS-CIMB RESEARCH, BLOOMBERG
13Malaysia │ Strategy │ July 29, 2021
Foreigners were net sellers for all six months in 1H21
Foreign investors continued to be net sellers of Malaysian equities, with cumulative net selling of RM4.2bn in 1H21.
This was lower than the net outflow experienced in 1H20 of RM16.2bn (highest net foreign net outflows experienced by the Mala ysian
equity market since statistics were available in 2010 due to concerns over MCO 1.0, change of government and Covid-19) and
RM4.6bn foreign net outflow registered in 1H19.
The average monthly net foreign fund outflow 1H21 works out to be RM700m.
Foreign investors net fund outflows from Malaysia rose to a monthly high in 2021 in Jun to RM1.17bn due to concerns over the
potential impact from prolonged lockdowns on businesses, political uncertainties and a weaker ringgit.
RM bn Foreign net buys/sells of equities since 2019 RM bn Yearly/cumulative foreign net buys since early-2010 to 1H21
40.0
2.0 33.0
31.1
1.0 30.0 26.1
1.0
0.1 0.0 20.0 17.4
0.0 15.015.0 13.7 14.0
0.0 10.6
10.0 6.4
0.0 -0.2 2.4 2.0 3.4
-0.5 -0.6 2.1
-1.0 -0.8 -0.8
-0.5 -
-1.1 -0.7-1.0 -0.9 -1.1 -1.2
-1.5 -1.5 -1.5 -3.0 -4.2
-2.0 (10.0) -6.9
-1.6 -2.0
-2.0 -2.0 -11.0-8.9
-2.5 (20.0) -11.9
-3.0 -2.6
-2.7 -3.0 -19.7
-3.0 -24.5
(30.0)
-4.0
-33.4
(40.0) -37.6
-5.0
(50.0)
-… 2010 2011 2012 2013 2014 2015 2016 2017 2018 2019 2020 1H21
-6.0
Jan-19 Apr-19 Jul-19 Oct-19 Jan-20 Apr-20 Jul-20 Oct-20 Jan-21 Apr-21
Net foreign buying/(selling) Cumulative
SOURCES: CGS-CIMB RESEARCH, BURSA MALAYSIA
14Malaysia │ Strategy │ July 29, 2021
Retail investors interest remained strong in 1H21
Retail investors raised their participation in the Malaysian equity market after the government imposed a Movement Control Order
(MCO 1.0) on 18 Mar 2020.
Retail investors’ monthly share of daily trades on Bursa Malaysia rose from 20-27% (Jan 18 to Mar 20) to 35-44% (Apr 20-Dec 20).
In 1H21, we note that retail share of trades remained at 39% of total trades, from 36% in 2020.
We also note that local institutions' participation declined from 46% in 2020 to 44% of total trades in 1H21.
Foreign investors’ share of participation fell from 18% in 2020 to 17% in 1H21.
% Breakdown of local institutional, retail and foreign
60 Average daily trading participation of investor categories
participation since 2019 since 2011
51 100%
49
50 47 46 47 47 48 47 46 48 47 48 48 47 46 90% 18 17
45 45 45 45 44 45 45 45 44 45 44 25 25 26 24 26 26 21 26
44 43 43 29
42
80%
40 37
34 70% 20
33 22 25 19 16 36
30 30 29 26 22 23 39
30 29 60% 25
30 28 28
25 26 26 26 50%
21 20 19 40%
19 18
20 17 16 17
24 28 26 15 15 14 16 15 16
30%
27 26 13 12 55 58 59
20 21 28 36 40 38 49 53 52 51 51
27 47 46 44
22 28 25 37 39 20%
10 24 20 35 41 40
23 44 40
40 38 38 38 38 10%
0 0%
Jan-19 Apr-19 Jul-19 Oct-19 Jan-20 Apr-20 Jul-20 Oct-20 Jan-21 Apr-21 2011 2012 2013 2014 2015 2016 2017 2018 2019 2020 1H21
Local retail Local institution Foreign Local institution Local retail Foreign
SOURCES: CGS-CIMB RESEARCH, BURSA MALAYSIA
15Malaysia │ Strategy │ July 29, 2021
Local institutions and foreign investors were net sellers
In terms of fund flows, retail investors were the most significant net buyers in 1H21 with a net buy position of RM8.2bn, while local
nominees were the second-largest net buyers with a net buy of RM2.3bn in 1H21.
Local institutions were the most significant net sellers. They net sold RM6.2bn of equities in 1H21, followed by foreign investors, which
net sold RM4.2bn.
RM bn Net buys/sells by five investor groups RM bn Total trading value by five investor groups
15.0 300.0
9.0 8.2
10.0 7.9 250.0
6.4
4.2
5.0 3.7 1.6 2.3
1.8 200.0
0.8 0.8 0.6 0.2 0.2
- (0.1)
(0.8) (0.2) (0.2) (0.4)
150.0
(5.0) (4.2)
(4.6)
(6.2) (6.5)
100.0
(10.0) (8.3)
(15.0) 50.0
(16.3)
(20.0)
-
Net local Net local retail Local nominees Foreign Proprietary
Local institutional Local Retail Local Nominees Foreign Local PDT
instituition
1H19 2H19 1H20 2H20 1H21 1H19 2H19 1H20 2H20 1H21
Note: PDT stands for Proprietary Day Trading
SOURCES: CGS-CIMB RESEARCH, BURSA MALAYSIA DIBOTS
16Malaysia │ Strategy │ July 29, 2021
Market needs to navigate through earnings risks in 3Q21
The Full Movement Control Order (FMCO) imposed on all states in Jun 2021 and Enhanced Movement Control Order (EMCO) in the
Klang Valley in 1–16 Jul will pose corporate earnings risks in the 2Q and 3Q results season.
Analysts are likely to revise down their earnings projections during the 2Q earnings season in Aug to reflect the prolonged lockdown
and closure of businesses, following guidance from management. Sectors most affected by the movement restrictions are tourism-
related, gaming, property, auto, banks, construction and consumer sectors. Utilities, telco, and export-oriented industries are less
impacted by the movement restrictions.
We expect more companies to report weaker-than-expected earnings in the upcoming 2Q results season in Aug, as analysts may not
have reflected the impact of movement restrictions imposed since May, which was tightened nationwide in Jun, followed by the EMCO
imposed in the Klang Valley from 1 Jul until 16 Jul.
As such, the positive earnings revision ratio that Malaysian companies posted may have peaked in 1Q21 for most sectors except
plantation and petrochemical due to rising commodity prices. We expect the rubber glove sector, the star performer in 2021, to report
peak earnings in 2Q21 due to peak ASPs.
Ratio of underperformers could rise in
Quarterly earnings revisions for stocks under our coverage may have peaked
60% 57% 2Q21F and 3Q21F due to MCO 20.0%
53% 13.8%
51% 15.0%
50%
50% 50% 47%
7.4% 6.5%
10.0%
43% 44% 44%
43% 43% 5.1%
39% 40% 39% 40% 5.0%
38% 38% 38% 38% 1.1%
40% 36% 36% 36%35% 35% 0.0%
34% -0.5%
-1.8% -2.0%
31% -5.0% -3.0% -2.6%
30% 28% -1.7% -3.1% -0.6%
-4.4% -1.8%
25% 25% 24% -7.0% -7.2% -6.4%
-10.0%
-11.7%
20% 18% 18% 18% -15.0%
12% 13% -20.0%
11% 11% 10% -20.2%
10% 7% -25.0%
-25.9%
-30.0%
May-19 Aug-19 Nov-19 Feb-20 Jun-20 Aug-20 Nov-20 Mar-21 May-21
0%
1Q18 2Q18 3Q18 4Q18 1Q19 2Q19 3Q19 4Q19 1Q20 2Q20 3Q20 4Q20 1Q21
Companies beating expectations Companies meeting expectations Companies coming below expectations CY19 CY20 CY21F CY22F
SOURCES: CGS-CIMB RESEARCH
17Malaysia │ Strategy │ July 29, 2021
Political uncertainty is negative for the market
The United Malays National Organisation (UMNO), a key ally in the ruling coalition, officially withdrew support for Prime Minister (PM)
Tan Sri Muhyiddin Yassin, after its supreme council meeting on 7 Jul and called on him to resign for failing to manage the Covid-19
pandemic. This has led to concerns over Perikatan Nasional's (PN) ruling coalition parliamentary majority.
The decision by UMNO does not come as a surprise as the party had voiced its unhappiness with the PM since Sep 2020.
We gathered from political experts that some of the potential scenarios following UMNO’s decision are: 1) the PM resigns, 2) the PM
requests for parliament to dissolve, 3) the PM carries on as it cannot be proven that he does not have majority support, 4) the PM is
dismissed via a vote of no confidence (should the Speaker of the House accept such a motion), or 5) the king exercises his reserve
powers and calls for an interim PM before elections can be held due to the current Covid-19 situation. The current scenario is that the
PM carries on unless and until it is proven that he does not have majority MP support in parliament.
This development is negative for the market as it leads to further uncertainties about the future leadership and policy direction of the
country. This is likely to lead to further outflow of foreign funds from the Malaysian equity market and companies with high foreign
shareholding may be vulnerable due to potential selling.
Foreign shareholdings fell after GE14 in May 2018 due partly to concerns over political uncertainty
28.0%
May-07, 27.5%
27.0%
26.0%
25.0% May-13, 25.2%
Mar-18, 24.2%
24.0%
23.0%
22.0%
Dec-16, 22.3%
21.0%
May-10, 20.3% Jun-21, 20.3%
20.0%
Jan/07 Jan/08 Jan/09 Jan/10 Jan/11 Jan/12 Jan/13 Jan/14 Jan/15 Jan/16 Jan/17 Jan/18 Jan/19 Jan/20 Jan/21
SOURCES: CGS-CIMB RESEARCH, BURSA MALAYSIA
18Malaysia │ Strategy │ July 29, 2021
An amicable solution to leadership concerns would be positive
The parliamentary majority support required for the PN government to stay in power may not be tested when
Malaysia holds a special sitting for five days, i.e. from 26 to 29 Jul 2021 and on 2 Aug 2021, to allow
lawmakers to be briefed on the national recovery plan.
This is because the Dewan Rakyat speaker would have the final say on these matters during the session
even if members of parliament are allowed to debate and put forward questions during the on-going
Parliament sitting.
Given that it is a short session, there may not be time allocated for a no-confidence vote as recovery plans
take priority.
As such, the potential resolution of this issue could be pushed forward to the next two parliament sessions,
which are scheduled for (1) 15 days from 6 Sep to 30 Sep and (2) 32 days from 25 Oct to 16 Dec. These
are key dates to watch for potential changes to the political landscape.
We are of the view that there could be negotiations among the various political parties ahead of these
crucial parliament sessions to find a resolution to the leadership issue.
An amicable solution between various political parties, which could stabilise the government, is likely to
be viewed positively by the market.
19Malaysia │ Strategy │ July 29, 2021
Selling pressure by local institutional investors to subside
The prospect of net selling by local institutional investors in 4Q21 could subside as potential withdrawals by EPF members from the i-
Citra scheme of up to RM30bn is lower than potential withdrawal from schemes like i-Lestari and i–Sinar of RM120bn.
We gathered from EPF’s latest media statement that the total withdrawals from i-Lestari and i–Sinar schemes (part of one-off stimulus
measures announced by government) were around RM78.5bn as at 8 Jun, equating to a withdrawal rate of around 65%.
This is higher than the RM55bn-75bn gross contributions for reinvestment that EPF received before Covid-19, where some are
ploughed back to the domestic equity market in line with its Strategic Asset Allocation (SAA).
EPF paid the bulk of the withdrawal to its contributors in 1H21, which could partly explain the higher net selling by local institutional
investors of RM6.2bn in 1H21 vs. RM0.8bn in 2H20.
Barring any major changes to EPF’s SAA for the domestic equity market and assuming Malaysia recovers from Covid-19 in 2022F, we
expect the net annual contributions to EPF to rise, potentially reversing the current net selling by local institutional investors, which
would be positive for the market.
EPF investment assets and their breakdown (RM bn)
RM m Net fund flows of local institutional investors
6,000.0 vs. EPF withdrawal schemes
34% 36%
29% 28% 28% 30%
24% 25%
5,000.0 21%
4,000.0 i-Lestari (1 Apr 2020 to 31 Mar 21)
3,000.0
i-Sinar (21 Dec 2020 to 3 Jun 21) 79% 76% 75%
71% 72% 72% 70%
2,000.0 66% 64%
i-Citra (12 Jul 2021 to 30 Sep 2021)
1,000.0
466 486 511 521 569 601 644 659 631
-
(1,000.0)
48 65 66
37 33 43
13 24 13
(2,000.0)
2013 2014 2015 2016 2017 2018 2019 2020 1Q21
(3,000.0)
Money market instruments Domestic investments
Domestic exposure (%) Global exposure (%)
SOURCES: CGS-CIMB RESEARCH, EPF, BURSA MALAYSIA, DIBOTS
20Malaysia │ Strategy │ July 29, 2021
Malaysia's new Covid-19 cases are on the rise
The Malaysian market underperformed in 1H21 due partly to the slow national vaccine rollout.
The slower-than-expected rollout was due to the shortage of vaccine supply. We gathered that total vaccine supply
in Malaysia was only 8.6m doses in mid-Jun. The seven-day moving average of daily Covid-19 vaccinations in the
country was only 208,900 doses as at 30 Jun.
Daily Covid-19 cases jumped to a record 17,045 on 25 Jul from 6,824 cases as at 30 May, despite one month of
FMCO in Jun and two weeks of EMCO in the Klang Valley. Malaysia’s Covid-19 daily deaths continued to climb to a
record 207 as at 27 Jul and the positivity rate from Covid-19 as at 27 Jul was 10.89% based on 148,049 individuals
who were tested. The number of patients in the Intensive Care Unit (ICU) stood at 1,023 and the utilisation rate was
73.7% as at 27 Jul.
SOURCES: CGS-CIMB RESEARCH, MINISTRY OF HEALTH MALAYSIA
21Malaysia │ Strategy │ July 29, 2021
Scenario analysis on fully vaccinated population
We think that vaccination is the key to containing the Covid-19 pandemic. The speed of the vaccination rollout will
help determine how fast Malaysia can achieve some form of normalcy.
We see some positive signs emerging on this front. The seven-day moving average of daily Covid-19 vaccination
rate jumped by 96% from 208,900 on 30 Jun 2021 to 410,000 on 18 Jul 2021.
Assuming Malaysia is able to consistently achieve a daily vaccination rate of 200,000/100,000 for second doses for
the rest of the year, we estimate that 40% of the country’s population could be fully vaccinated by 29 Aug/12
Oct 2021.
Our sensitivity analysis also reveals that based on daily vaccination rate of 200,000/150,000 of daily first doses for
the rest of the year, around 70% of the country’s population will receive at least one dose of vaccines by 20
Sep/14 Oct 2021.
This is a positive development as based on the experience in Israel, the US and the UK, new daily Covid-19 cases
fell or were more manageable when around 30-40% of the population was fully vaccinated.
This suggests that the prospects of Malaysia containing the spread of Covid-19 should improve around Aug-Oct
2021.
Daily first Covid-19 doses vaccination achieved Daily second Covid-19 doses vaccination achieved
Population fully Population fully
100,000 150,000 200,000 250,000 100,000 150,000 200,000 250,000
vaccinated (one dose) vaccinated (two doses)
30.1% As at 18 July 2021 - 9,815,735 pax received one dose 13.9% As at 18 July 2021 - 4,531,550 pax received two doses
40.0% 20-Aug 9-Aug 3-Aug 31-Jul 20.0% 7-Aug 1-Aug 28-Jul 26-Jul
50.0% 22-Sep 31-Aug 19-Aug 13-Aug 30.0% 9-Sep 23-Aug 13-Aug 8-Aug
60.0% 25-Oct 22-Sep 4-Sep 26-Aug 40.0% 12-Oct 14-Sep 29-Aug 21-Aug
70.0% 27-Nov 14-Oct 20-Sep 8-Sep 50.0% 14-Nov 6-Oct 14-Sep 3-Sep
80.0% 30-Dec 5-Nov 6-Oct 21-Sep 60.0% 17-Dec 28-Oct 30-Sep 16-Sep
90.0% 1-Feb 27-Nov 22-Oct 4-Oct 70.0% 19-Jan 19-Nov 16-Oct 29-Sep
100.0% 6-Mar 19-Dec 7-Nov 17-Oct 80.0% 21-Feb 11-Dec 1-Nov 12-Oct
SOURCES: CGS-CIMB RESEARCH, MINISTRY OF HEALTH MALAYSIA
22Malaysia │ Strategy │ July 29, 2021
Total registration for Covid-19 vaccines as at 17 Jul and cumulative
vaccine doses administered as at 20 Jul 2021
Total population Total adult population
Registered Dose 1 Dose 2 Registered Dose 1 Dose 2 Registered Dose 1 Dose 2
Malaysia 18,885,523 10,301,905 4,769,909 58% 31.5% 14.6% 81% 44.0% 20.4%
States
WP Labuan 60,207 59,884 44,301 60% 60.1% 44.5% 88% 87.4% 64.7%
Sarawak 1,740,911 1,591,810 967,201 62% 56.5% 34.3% 85% 77.9% 47.3%
Perlis 150,655 90,187 66,078 59% 35.4% 25.9% 83% 49.8% 36.5%
Klang Valley (KL, Putrajaya and Selangor) 6,437,033 4,140,969 1,329,503 76% 49.2% 15.8% 104% 67.2% 21.6%
Negeri Sembilan 773,548 452,555 169,872 69% 40.1% 15.1% 95% 55.6% 20.9%
Melaka 595,504 248,224 125,553 64% 26.6% 13.5% 88% 36.6% 18.5%
Terengganu 575,222 273,309 144,364 46% 21.7% 11.5% 71% 33.8% 17.9%
Pahang 855,472 325,465 203,553 51% 19.4% 12.1% 73% 27.7% 17.3%
Kelantan 718,879 333,609 209,935 38% 17.5% 11.0% 58% 27.0% 17.0%
Pulau Pinang 1,169,578 532,427 224,051 66% 30.0% 12.6% 85% 38.9% 16.4%
Perak 1,359,451 585,969 304,730 54% 23.3% 12.1% 73% 31.5% 16.4%
Kedah 1,112,219 435,289 229,839 51% 19.9% 10.5% 72% 28.3% 14.9%
Johor 2,346,163 723,119 382,662 62% 19.1% 10.1% 93% 28.7% 15.2%
Sabah 990,681 509,089 368,267 25% 13.0% 9.4% 36% 18.5% 13.4%
SOURCES: CGS-CIMB RESEARCH, MINISTRY OF HEALTH MALAYSIA
23Malaysia │ Strategy │ July 29, 2021
Daily and cumulative vaccine doses
SOURCES: CGS-CIMB RESEARCH, MINISTRY OF HEALTH MALAYSIA
24Malaysia │ Strategy │ July 29, 2021
Covid-19 vaccine supplies and portfolio breakdown
Malaysia has ordered more than 76m doses of Covid-19 vaccines and expects to receive 12m doses in Jul.
According to the Prime Minister on 18 Jul, Malaysia received 20m of the doses it ordered and expects to receive
30m doses by the end of Jul, 40m doses by Aug, 53m doses by Sep and 58m doses by Oct. He added that the
capacity of the rate of vaccination would be increased to 500,000 doses daily.
The latest target set by the PM is to ensure that 100% of all adults in Malaysia receive two doses by Oct 2021.
The government also introduced “Operation Surge Capacity” on 16 Jul 2021 to ensure that every adult resident in
Kuala Lumpur and Selangor receives at least one dose of Covid-19 vaccine by 1 Aug.
Expected Covid-19 supplies in Vaccine supply (m Total orders (m Coverage (m) - 2 Total population
% coverage
Malaysia and coverage ratio doses) doses) doses per pax (m)
As at 18 Jul 20 76.1 10.0 32.657 31%
end-July 30 76.1 15.0 32.657 46%
end-Aug 40 76.1 20.0 32.657 61%
end-Sep 53 76.1 26.5 32.657 81%
end-Oct 58 76.1 29.0 32.657 89%
Breakdown of vaccine
Doses (m) Population coverage (m) Population in Malaysia (m) Population coverage (%)
portfolio for Malaysia
Pfizer 44.8 22.4 32.7 68.6%
Sinovac 12.0 6.0 32.7 18.4%
Astra Zenaca 6.4 3.2 32.7 9.8%
CanSino Biologics 3.5 3.5 32.7 10.7%
Covax initiative 6.4 3.2 32.7 9.8%
Gamaleya (Sputnik v) 6.4 3.2 32.7 9.8%
Total 79.5 41.5 32.7 127.1%
SOURCES: CGS-CIMB RESEARCH, MINISTRY OF HEALTH MALAYSIA
25Malaysia │ Strategy │ July 29, 2021
National Recovery Plan
On 15 Jun, the Prime Minister announced Malaysia’s National Recovery Plan (NRP), an exit strategy from the
Covid-19 pandemic comprising four phases. Each phase will have three main threshold indicators that need to be
met before progressing to the next phase.
Based on our analysis, we think these targets are achievable and we expect investors to shift their portfolios in
favour of recovery stocks in the period leading to Phase 3 of the recovery and Budget 2022.
Hence, our view is that the market may rebound in 4Q21 on expectations of a recovery in economic activities and
higher productivity in certain sectors to cater to backlog demand. Post recovery, Malaysia could hold elections in
Sarawak (due in Sep 21) and call for GE15, if the current political impasse is not resolved.
Phase 1 Phase 2 Phase 3 Phase 4
Target month Jun Jul-Aug Sep-Oct Nov-Dec
Economic sectors allowed to operate
at 80% capacity, capacity limits may
be lifted depending on vaccination
Economic sectors allowed to operate
All economic sectors allowed to All economic sectors allowed to
at 80% capacity
operated, expect high-risk sectors operate
and activities in Negative list (pubs,
Total MCO Expansion of Positive list
spas, beauty salons, conventions) More social activities permitted
What's allowed Only essential services permitted to - Cement manufacturing
operate - Retail: electronics and computers
Gradual reopening of the social Interstate travel permitted
sector, including education and
Social sector and interstate travel
certain sports Domestic tourism reopened
prohibited
Parliament to sit
Interstate travel prohibited
● < 4,000 daily Covid-19 cases ● < 2,000 daily Covid-19 cases ●Malaysia │ Strategy │ July 29, 2021
Malaysian retail investors’ survey
We conducted the second edition of our annual retail investor sentiment survey in May 2021. A total of 1,044
Malaysian retail investors responded to our survey request which was carried out from 20 Apr to 31 May 2021 (41-
day period).
A smaller proportion of respondents is investing directly in the stock market in 2021 vs. 2020 survey.
Respondents were less bullish compared to a year ago, with 51% of them expecting the market to return 0-10%
over the next three months.
The three biggest sources of funds deployed to invest in the stock market are (1) savings, (2) income from
employment and others, and (3) additional income from lower Employees Provident Fund (EPF) contributions
and withdrawals via I-Sinar and I-Lestari.
The three biggest concerns of respondents are (1) domestic economy/politics, (2) external factors (global stock
market performances, global economy), and (3) sharp falls in stocks/markets.
89% of the sample surveyed indicated that their current disposable incomes remained below pre-Covid-19
levels, with over half of the respondents reporting incomes at 60% or below pre-pandemic levels.
Benign inflation expectations may explain why 72% of those polled expected the Overnight Policy Rate (OPR)
to remain at or below the current level of 1.75% over the next 18 months. Just 24% expected monetary policy
normalisation to occur by end-2022.
A significant rise in OPR or availability of alternative investment products that offer higher returns may entice profit-
taking in the equity markets among the retail investors as most are deploying their savings to achieve higher
returns.
Key areas to track closely are domestic sentiment on the economy and political situations - if sentiment
worsens, retail investors could reduce their exposure to the domestic stock market.
The survey suggests that consumer sentiment remains relatively weak, though this observation is caveated by
our sample data which is skewed towards those earning incomes higher than the population average.
Kindly refer to our note for more details in the link here : 2021 CGS-CIMB Retail Investors’ Sentiment Survey
27Malaysia │ Strategy │ July 29, 2021
ESG ratings from F4GBM index perspective
We are of the view that the FTSE4Good Bursa Malaysia (F4GBM) could become more prominent over time with
increasing focus and scrutiny by asset managers in Malaysia on ESG practices of their investee companies.
It probably has the largest coverage in terms of ESG ratings for Malaysian listed companies among ESG rating
providers. Also, the methodology used by FTSE Russell to determine ESG practices in F4GBM is based on global
standards. We believe that the increased public disclosure of companies’ ESG rankings among their peers since
Jun 2020 has allowed investors to track ESG scores of companies and to follow the index more closely.
As at 30 Jun 2021, Malaysia’s weightage in the FTSE4Good Emerging Market (F4GEM) index was 2.72%, which is
higher than its index weight of 1.71% in the FTSE Emerging Market (FEM) index. This suggests that Malaysian
companies fared better in their ESG scores relative to some of its peers in the FEM index.
There are currently 76 constituents in the F4GBM index, following the latest Jun semi-annual review. This
represents a significant increase from the 24 members when the index was launched in 2014. This suggests that
more Malaysian-listed companies are improving their ESG transparency and scores, which is a positive sign.
Bursa Malaysia and FTSE Russell in July 2021 launched the FTSE4Good Bursa Malaysia Shariah (F4GBMS) index,
which is designed to track constituents in the F4GBM that are Shariah-compliant. The index has 54 constituents.
We found that the F4GBM index outperformed FBM Emas in two (2017 and 2018) of the past five years.
YTD 30 Jun, the F4GBM registered a negative return of -5.6%, underperforming the FBM Emas (-5.1%) but
outperforming FBMKLCI (-5.8%). This could be because Malaysia is still in the early stages of adopting ESG and
given the underperformance of banks and utilities, which have a high weightage in the F4GBM, in some years.
We suspect the exclusion of Top Glove and Nestle from the F4GBM Index could be due to controversies while
Dialog’s exclusion could be due to it not meeting the minimum climate change score threshold.
Companies that score well or demonstrate improvement in their ESG ratings or are part of the index could fetch
premium valuations vs. peers, in our view. However, Malaysian companies will need to improve their ESG practices
as the bar is likely to be raised over time. FTSE Russell recently introduced new climate performance standards at
its 8 Jun 2021 review.
Kindly refer to our note for more details in the link here: ESG ratings from F4GBM index perspective
28Malaysia │ Strategy │ July 29, 2021
Key trading themes: Laggard plays
We are of the view that the 5.8% correction in KLCI in 1H21 offers investors opportunities to buy on dips. In our first theme for 2H21,
we screened for laggard plays within our coverage.
Some of these stocks that were impacted by Covid-19 could re-rate after the economy reopens, supported by an earnings recovery
story driven by pent-up demand, resolution of labour shortage issues and improved economies of scale, in our view.
In view of the above, we screened for stocks based on the following criteria: (1) stocks currently under our coverage that are Shariah-
compliant, (2) share prices trading at more than 20% below their pre-Covid-19 levels or 31 Dec 2019 closing price, and (3) our research
team has an Add rating on these companies.
The top three stocks that are Shariah-compliant with Add calls and which have fallen the most since 31 Dec 2019 are Velesto Energy,
UEM Sunrise and HSS Engineers.
Bloomberg Share price Target Price Market Cap Perfomance since 31-Dec-19
Company Recom. Upside
Ticker (RM) (RM) (RM m) %
Velesto Energy Berhad VEB MK Add 0.15 0.19 31% 1,191 (61.8%)
UEM Sunrise Bhd UEMS MK Add 0.39 0.56 45% 1,948 (45.4%)
HSS Engineers HSS MK Add 0.53 0.89 69% 260 (37.9%)
WCT Holdings WCTHG MK Add 0.55 0.67 22% 779 (36.8%)
Genting Plantations GENP MK Add 6.71 10.40 55% 6,020 (36.6%)
Sime Darby Property Berhad SDPR MK Add 0.60 0.83 38% 4,081 (34.4%)
SP Setia SPSB MK Add 1.05 1.42 35% 4,271 (34.4%)
UMW Holdings UMWH MK Add 2.97 4.20 41% 3,470 (33.9%)
Gamuda GAM MK Add 2.76 4.00 45% 6,937 (29.2%)
Bermaz Auto Berhad BAUTO MK Add 1.49 1.90 28% 1,731 (29.0%)
Star Media Group Bhd STAR MK Add 0.35 0.50 43% 254 (27.8%)
Tenaga Nasional TNB MK Add 9.62 13.40 39% 55,085 (27.5%)
Syarikat Takaful Malaysia Keluarga STMB MK Add 4.28 5.80 36% 3,576 (24.9%)
Ta Ann TAH MK Add 2.65 3.47 31% 1,167 (24.3%)
Yinson Holdings Bhd YNS MK Add 4.99 6.18 24% 5,316 (23.0%)
Share price data as at 14-Jul-2021
SOURCES: CGS-CIMB RESEARCH, BLOOMBERG COMPANY REPORTS
29Malaysia │ Strategy │ July 29, 2021
Key trading themes: M&A theme/Value play
There were several large M&A deals involving listed companies in 1H21. These include but are not limited to KLK’s offer to buy a
controlling 56.2% stake in IJM Plantations from IJM Corp and the proposed merger of Celcom and Digi by its parent companies.
We maintain our view that M&A activities could pick up as the low interest rate environment and challenges faced by businesses and
conglomerates due to Covid-19 provide good opportunities for companies with strong balance sheets to look for potential acquisition
targets at attractive valuations.
In view of this, we update our screen of stocks under our universe based on several characteristics we have observed in histo rical
privatisation and takeover deals. We note that most of the stocks being taken over exhibited some of the following characteristics: (1)
low P/BV (30%) from the peak five years ago, (3) negative EPS CAGR over the past three
years (CY17-20), and (4) major shareholders having a significant stake (>30%) in the companies.
The top three stocks that are Shariah-compliant, rated Add by us, meet the above screening criteria and which have fallen the most
from their peak prices are Star Media, Velesto and UEM Sunrise.
Bloomberg Share price Target Price Share price chg 3 year EPS Largest shareholder's stake
Company Recom. P/BV (x) Largest Shareholder
Ticker (RM) (RM) from peak (%) CAGR (%) (%)
Bonia Corporation BON MK Add 0.87 1.00 (55%) 5% 0.49x Chiang Sang Sem 65%
DRB-Hicom DRB MK Hold 1.63 1.95 (46%) (7%) 0.42x Etika Strategi Sdn. Bhd 56%
LBS Bina Group LBS MK Add 0.44 0.56 (59%) 9% 0.54x Gaterich Sdn Bhd 42%
Lotte Chemical Titan TTNP MK Hold 2.77 2.92 (60%) na 0.51x Lotte Chemical Corporation 76%
Malaysian Resources Corp MRC MK Hold 0.40 0.44 (75%) (29%) 0.39x Employees Provident Fund 36%
MSM Malaysia Holdings MSM MK Hold 1.17 1.41 (76%) 49% 0.55x Fgv Holdings 51%
Sime Darby Property Berhad SDPR MK Add 0.60 0.83 (66%) 30% 0.45x Permodalan Nasional Berhad 55%
Star Media Group Bhd STAR MK Add 0.35 0.50 (86%) na 0.36x Malaysian Chinese Asssociation 42%
Success Transformer Corp STC MK Add 0.82 1.05 (61%) 11% 0.59x Omega Attraction Sdn 45%
UEM Sunrise Bhd UEMS MK Add 0.39 0.56 (71%) 10% 0.29x Khazanah Nasional Berhad 70%
UOA Development UOAD MK Hold 1.62 1.88 (41%) (28%) 0.64x UOA Holdings Sdn Bhd 70%
Velesto Energy Berhad VEB MK Add 0.15 0.19 (85%) na 0.54x Permodalan Nasional Berhad 37%
Share price data as at 14-Jul-2021
SOURCES: CGS-CIMB RESEARCH, BLOOMBERG, COMPANY REPORTS
30Malaysia │ Strategy │ July 29, 2021
Key trading themes: High dividend yielders
Investors continue to seek companies that offer high dividend-yielding stocks in view of the record-low interest rate environment in
Malaysia. The high dividend yield could also cap the downside risk of the stock. To recap, Malaysia cut its OPR rate by 125bp to a
record low of 1.75% in 2020.
As such, we continue to like stocks that offer high dividend yields, which we think will provide shelter in these uncertain times. We
screened for Shariah-compliant stocks in our universe with Add ratings that offer dividend yields above 4%.
The top three stocks that are Shariah-compliant with Add calls and which offer the highest dividend yields for CY21 are Kossan,
Hartalega and Taliworks.
Bloomberg Share price Target Price Market Cap Dividend yield (%)
Company Recom. Upside
Ticker (RM) (RM) (RM m) CY21F CY22F
Kossan Rubber Industries KRI MK Add 3.07 4.20 37% 7,833 19.1% 5.2%
Hartalega Holdings HART MK Add 7.26 8.50 17% 24,811 9.3% 5.4%
Taliworks Corporation TWK MK Add 0.86 0.93 8% 1,734 7.7% 7.7%
Freight Management Hldgs FMH MK Add 0.67 1.20 79% 374 7.5% 7.5%
Sime Darby Bhd SIME MK Add 2.16 2.80 29% 14,693 6.0% 6.0%
Wellcall Holdings WELL MK Add 1.00 1.22 22% 497 6.0% 6.8%
Ta Ann TAH MK Add 2.65 3.47 31% 1,167 5.7% 5.7%
Uchi Technologies UCHI MK Add 3.05 3.20 5% 1,381 5.6% 5.9%
Malakoff Corporation MLK MK Add 0.81 1.04 29% 3,934 5.6% 5.7%
Mah Sing Group MSGB MK Add 0.81 1.16 43% 1,966 5.6% 6.3%
Gas Malaysia Berhad GMB MK Add 2.65 2.97 12% 3,403 5.4% 5.5%
MISC Bhd MISC MK Add 6.88 7.95 16% 30,711 5.0% 5.0%
Tenaga Nasional TNB MK Add 9.62 13.40 39% 55,085 5.0% 5.1%
Syarikat Takaful Malaysia Keluarga STMB MK Add 4.28 5.80 36% 3,576 5.0% 5.2%
Bermaz Auto Berhad BAUTO MK Add 1.49 1.90 28% 1,731 4.8% 5.5%
Axis REIT AXRB MK Add 1.92 2.44 27% 2,777 4.8% 5.4%
Hap Seng Plantations HAPL MK Add 1.81 2.35 30% 1,447 4.7% 2.8%
Petronas Gas PTG MK Add 15.60 17.70 13% 30,868 4.6% 4.6%
EITA Resources Bhd EITA MK Add 0.80 1.86 133% 208 4.4% 4.4%
Share price data as at 14-Jul-2021
SOURCES: CGS-CIMB RESEARCH, BLOOMBERG, COMPANY REPORTS
31Malaysia │ Strategy │ July 29, 2021
Key trading themes: Beneficiaries of an OPR hike
Our economist expects BNM to dial back some monetary support with a 75bp hike in OPR in 2022F as economic activity returns to
normalcy and Covid-19 becomes less of a threat to the economy after 70% of the adult population is vaccinated.
A rate hike is positive for banks, as the upward repricing of lending rates has historically been higher than the increase in deposit rates,
leading to potential expansion in banks’ margins.
Among the Shariah-compliant banks under our coverage, we have an Add call on BIMB Holdings, and we project BIMB to see
earnings upside of 7.9% in FY22F for every 25bp hike in OPR rate.
Other potential beneficiaries of a rate hike are companies that have a large net cash position from higher interest income.
As such, we screened for Shariah-compliant companies under our coverage that have Add calls and net cash positions of at least 10%
of their market cap.
The top three stocks that are Shariah-compliant, rated Add by us and which have the highest net cash over their market caps are Star
Media, Success Transformer and AWC Berhad.
Bloomberg Share price Target Price Market Cap Net cash per share Net cash
Company Recom. Upside
Ticker (RM) (RM) (RM m) (RM) % of market cap
Star Media Group Bhd STAR MK Add 0.35 0.50 43% 254 0.46 132%
Success Transformer Corp STC MK Add 0.82 1.05 28% 188 0.35 43%
AWC Berhad AWCF MK Add 0.48 0.79 65% 152 0.16 34%
UMW Holdings UMWH MK Add 2.97 4.20 41% 3,470 0.68 23%
Media Chinese Int'l MCIL MK Add 0.19 0.21 14% 312 0.04 20%
EITA Resources Bhd EITA MK Add 0.80 1.86 133% 208 0.14 17%
Bermaz Auto Berhad BAUTO MK Add 1.49 1.90 28% 1,731 0.25 17%
Thong Guan Industries TGI MK Add 2.52 3.43 36% 955 0.38 15%
Petronas Chemicals Group PCHEM MK Add 8.03 9.05 13% 64,240 1.19 15%
Hap Seng Plantations HAPL MK Add 1.81 2.35 30% 1,447 0.25 14%
Petronas Dagangan Bhd PETD MK Add 19.04 20.17 6% 18,915 2.53 13%
Lee Swee Kiat Group LSKG MK Add 0.79 1.52 92% 128 0.09 12%
Pentamaster Corp Bhd PENT MK Add 5.36 5.85 9% 3,818 0.61 11%
Uchi Technologies UCHI MK Add 3.05 3.20 5% 1,381 0.35 11%
Wellcall Holdings WELL MK Add 1.00 1.22 22% 497 0.11 11%
Kawan Food KFB MK Add 1.87 3.00 60% 672 0.18 10%
Share price data as at 14-Jul-2021
SOURCES: CGS-CIMB RESEARCH, BLOOMBERG, COMPANY REPORTS
32Malaysia │ Strategy │ July 29, 2021
Key trading themes: Beneficiaries of an OPR hike (cont’d)
In addition, a rate hike is negative for companies with high gearing in ringgit borrowings as it will result in higher interest expense.
We screened the top 20 Shariah-compliant companies with the highest net gearing under our coverage with Add calls.
The top three companies under our coverage with the highest gearing are Berjaya Food, Pharmaniaga and Maxis.
Bloomberg Share price Target Price Market Cap Net debt Net gearing
Company Recom. Upside
Ticker (RM) (RM) (RM m) (RM m) (x)
Berjaya Food Berhad BFD MK Add 1.90 2.80 48% 676 642 1.92
Pharmaniaga Bhd PHRM MK Add 0.92 1.06 16% 1,199 631 1.78
Maxis Berhad MAXIS MK Hold 4.33 4.80 11% 33,888 9,028 1.28
Mr D.I.Y. Group (M) Bhd MRDIY MK Add 3.33 4.36 31% 20,901 1,107 1.26
KPJ Healthcare KPJ MK Add 1.01 1.10 9% 4,328 2,692 1.22
Tenaga Nasional TNB MK Add 9.62 13.40 39% 55,085 64,626 1.12
Sapura Energy Bhd SAPE MK Hold 0.12 0.14 17% 1,917 9,864 1.10
Yinson Holdings Bhd YNS MK Add 4.99 6.18 24% 5,316 4,083 1.01
Malakoff Corporation MLK MK Add 0.81 1.04 29% 3,934 6,455 1.00
Nestle (Malaysia) NESZ MK Hold 133.20 136.70 3% 31,235 542 0.97
DKSH Holdings (Malaysia) DKSH MK Add 2.96 4.20 42% 467 628 0.94
Cypark Resources Bhd CYP MK Hold 0.86 1.00 16% 416 860 0.90
Telekom Malaysia T MK Add 6.06 7.00 16% 22,869 5,050 0.72
WCT Holdings WCTHG MK Add 0.55 0.67 22% 779 2,649 0.72
SP Setia SPSB MK Add 1.05 1.42 35% 4,271 10,547 0.69
Only World Group Holdings OWG MK Hold 0.40 0.36 -9% 158 151 0.68
Eco World Development Group Bhd ECW MK Hold 0.69 0.66 -4% 2,017 2,876 0.62
Destini Berhad DSTN MK Reduce 0.19 0.06 -68% 290 79 0.60
Eastern & Oriental EAST MK Hold 0.61 0.75 24% 866 867 0.51
Axis REIT AXRB MK Add 1.92 2.44 27% 2,777 1,072 0.51
Share price data as at 14-Jul-2021
SOURCES: CGS-CIMB RESEARCH, BLOOMBERG, COMPANY REPORTS
33Malaysia │ Strategy │ July 29, 2021
Key trading themes: Recovery plays
Malaysia is expected to move to the third phase of its recovery plan in Sep as it aims to vaccinate Klang Valley residents with at least
one dose of Covid-19 vaccine by earl- Aug and complete two doses of vaccine inoculation by the end of Aug.
This is expected to lower the number of new Covid-19 cases in the country and ease the tremendous pressure that has been placed on
the healthcare system. This should allow the country to transition to a recovery stage in 4Q21.
In line with this, we look for stocks under our coverage that are expected to show strong earnings growth post Covid-19. In our
selection criteria, we compare the net profit forecasts for CY22F vs. CY21F for stocks under our coverage with Add ratings. Based on
this, we have a list of the top 20 companies that exhibit the highest earnings recovery on an absolute basis, including those that are
expected to recover from losses.
The top three Shariah-compliant companies with Add calls and which offer the highest earnings growth rates in CY22F are Media
Chinese, Velesto and Karex.
Bloomberg Share price Target Price Market Cap CY22F EPS growth vs CY21F
Company Recom. Upside
Ticker (RM) (RM) (RM m) yoy %
Media Chinese Int'l MCIL MK Add 0.19 0.21 14% 312 282.1%
Velesto Energy Berhad* VEB MK Add 0.15 0.19 31% 1,191 nm
Karex Berhad KAREX MK Add 0.47 0.77 66% 490 138.4%
Malayan Cement Bhd LMC MK Add 2.73 3.73 37% 2,552 108.9%
Star Media Group Bhd* STAR MK Add 0.35 0.50 43% 254 nm
Lee Swee Kiat Group LSKG MK Add 0.79 1.52 92% 128 72.9%
Aemulus Holdings Bhd AMLS MK Add 0.87 1.10 26% 527 66.1%
Oceancash Pacific Bhd OCP MK Add 0.46 0.60 30% 120 63.7%
KPJ Healthcare KPJ MK Add 1.01 1.10 9% 4,328 52.0%
SP Setia SPSB MK Add 1.05 1.42 35% 4,271 47.8%
Mi Technovation MI MK Add 3.68 5.20 41% 3,019 39.5%
Tomypak Holdings TOMY MK Add 0.51 0.71 41% 218 32.2%
Mr D.I.Y. Group (M) Bhd MRDIY MK Add 3.33 4.36 31% 20,901 29.9%
IHH Healthcare Bhd IHH MK Add 5.64 6.91 23% 49,514 27.2%
Unisem UNI MK Add 7.76 10.50 35% 6,259 27.2%
WCT Holdings WCTHG MK Add 0.55 0.67 22% 779 26.2%
InNature Bhd INNATURE MK Add 0.60 0.75 25% 424 24.9%
HSS Engineers HSS MK Add 0.53 0.89 69% 260 24.0%
Daibochi Bhd DPP MK Add 2.28 3.83 68% 746 22.4%
EITA Resources Bhd EITA MK Add 0.80 1.86 133% 208 20.9%
Note*: Negative earnings growth as they’re loss making in CY21F
Share price data as at 14-Jul-2021
SOURCES: CGS-CIMB RESEARCH, BLOOMBERG, COMPANY REPORTS
34Malaysia │ Strategy │ July 29, 2021
Key trading themes: ESG picks
In this theme, we look for stocks under our coverage that have the highest ESG scores by third-party assessors.
In our selection criteria, we screen for Shariah stocks under our coverage with Add ratings and which have the best ESG scores ranked
using (1) FTSE ESG Grading Band (score of 4 equates to top 25% by ESG ratings among companies in FBMEMAS), (2) Refinitiv ESG
scores (A – excellent relative ESG performance), (3) Sustainalytics ESG ratings (lower Sustainalytics score is equivalent to lower ESG
risk), and (4) MSCI’s ESG rating (AAA represents leader).
The top three Shariah-compliant companies under our coverage with Add calls that scored well on three or four third-party ESG
assessors on ESG ratings relative to peers are MISC, Petronas Dagangan and Telekom Malaysia.
Bloomberg Share price Target Price Market Cap FTSE ESG
Company Recom. Upside Refinitiv Score Sustainalytics Rating MSCI Rating
Ticker (RM) (RM) (RM m) Grading Band
MISC Bhd MISC MK Add 6.88 7.95 16% 30,711 4.00 B+ 18.70 na
Petronas Dagangan Bhd PETD MK Add 19.04 20.17 6% 18,915 4.00 B 32.70 AA
UEM Sunrise Bhd UEMS MK Add 0.39 0.56 45% 1,948 4.00 B na na
Bermaz Auto Berhad BAUTO MK Add 1.49 1.90 28% 1,731 4.00 B- na na
IJM Corp Bhd IJM MK Add 1.76 2.16 23% 6,342 4.00 B- 35.80 na
Genting Plantations GENP MK Add 6.71 10.40 55% 6,020 4.00 B- 47.80 na
Telekom Malaysia T MK Add 6.06 7.00 16% 22,869 4.00 B- 26.20 AA
Kuala Lumpur Kepong KLK MK Add 19.80 25.25 28% 21,350 4.00 B- 40.40 A
Petronas Chemicals Group PCHEM MK Add 8.03 9.05 13% 64,240 4.00 B- 28.00 B
Hartalega Holdings HART MK Add 7.26 8.50 17% 24,811 4.00 C 17.40 AA
Sime Darby Bhd SIME MK Add 2.16 2.80 29% 14,693 4.00 C+ 25.20 A
Dialog Group Bhd DLG MK Add 2.85 3.82 34% 16,081 4.00 C+ 31.50 BBB
MY E.G. Services MYEG MK Add 1.62 2.50 54% 5,822 4.00 D na na
Mah Sing Group MSGB MK Add 0.81 1.16 43% 1,966 4.00 na na na
DKSH Holdings (Malaysia) DKSH MK Add 2.96 4.20 42% 467 4.00 na na na
Duopharma Biotech Bhd DBB MK Add 2.90 3.67 26% 2,048 4.00 na na na
Karex Berhad KAREX MK Add 0.47 0.77 66% 490 4.00 na na na
Unisem UNI MK Add 7.76 10.50 35% 6,259 4.00 na na na
Velesto Energy Berhad VEB MK Add 0.15 0.19 31% 1,191 4.00 na na na
Sime Darby Property Berhad SDPR MK Add 0.60 0.83 38% 4,081 3.00 B+ na na
Gamuda GAM MK Add 2.76 4.00 45% 6,937 3.00 B 39.10 na
UMW Holdings UMWH MK Add 2.97 4.20 41% 3,470 3.00 B- 27.90 na
Petronas Gas PTG MK Add 15.60 17.70 13% 30,868 3.00 B- 29.40 BB
SP Setia SPSB MK Add 1.05 1.42 35% 4,271 3.00 B- na na
Tenaga Nasional TNB MK Add 9.62 13.40 39% 55,085 3.00 C 36.10 BBB
Share price data as at 14-Jul-2021
SOURCES: CGS-CIMB RESEARCH, BLOOMBERG, COMPANY REPORTS
35You can also read