Bronze Award - Science in Australia Gender Equity
←
→
Page content transcription
If your browser does not render page correctly, please read the page content below
1

                                                              AT H E N A S WA N I N ST I T U T I O N A P P L I C AT I O N
AT H E N A S WA N I N ST I T U T I O N A P P L I C AT I O N

Bronze Award

Name of institution       Southern Cross University
Date of application       31 July 2019
Award Level               Bronze
Date joined Athena SWAN   September 2015
Contact for application   Professor Mary Spongberg
Email                     dvcr@scu.edu.au
Telephone                 07 5589 3083
ATHENA SWAN BRONZE INSTITUTION AWARDS
Recognise a solid foundation for eliminating gender bias and developing an inclusive culture
that values all staff. This includes:
•	an assessment of gender equality in the institution, including quantitative (staff data) and
    qualitative (policies, practices, systems and arrangements) evidence and identifying both
    challenges and opportunities
•	a four-year plan that builds on this assessment, information on activities that are already in
    place and what has been learned from these
•	the development of an organisational structure, including a self-assessment team, to carry
    proposed actions forward.

                                                                                                           2

                                                                                                           AT H E N A S WA N I N ST I T U T I O N A P P L I C AT I O N
Completing the form
DO NOT ATTEMPT TO COMPLETE THIS APPLICATION FORM WITHOUT READING
THE ATHENA SWAN AWARDS HANDBOOK.
Do not remove the headers or instructions. Each section begins on a new page.

WORD COUNT
The overall word limit for applications are shown in the following table.

There are no specific word limits for the individual sections, and you may distribute words over each of
the sections as appropriate. At the end of every section, please state how many words you have used
in that section. The action plan is not included in the word count.
We have provided the following recommended word counts as a guide.

WORD LIMIT                                              11,000

Recommended word count

1   Letter of endorsement                               500

2   Description of the institution                      500

3   Self-assessment process                             1,000

4   Picture of the institution                          2,000

5   Supporting and advancing women’s careers            5,000

6   Supporting transgender people                       500

7   Intersectionality                                   500

8   Indigenous Australians                              500

9   Further information                                 500

10 Action plan                                          N/A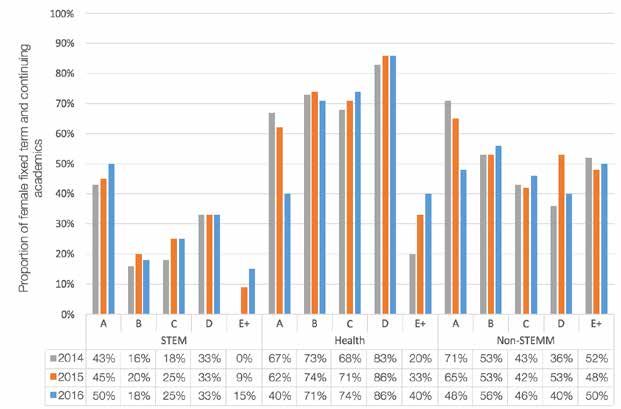
3

                                     AT H E N A S WA N I N ST I T U T I O N A P P L I C AT I O N
    1

Letter of endorsement from
the Vice Chancellor

Recommended word count   500 words
Actual word count		      584 words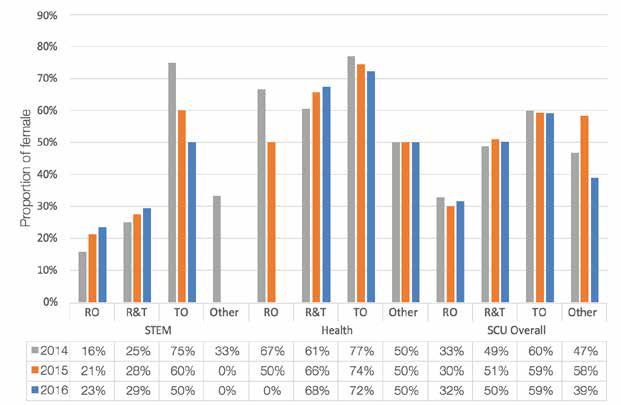
Office of the Vice Chancellor

         Thursday 25 July 2019                                                                              ovc@scu.edu.au
                                                                                           Office of the Vice Chancellor PO Box
         Dr Wafa El-Adhami
                                                                                                        157, Lismore, NSW, 2480
         SAGE Executive Director
         Australian Academy of Science
         GPO Box 783
         CANBERRA ACT 2601

         Dear Dr El-Adhami

         Re: Letter of Endorsement from the Vice Chancellor

         It is with great pleasure that I endorse this application from Southern Cross University for the Bronze
         Athena SWAN Institutional Award (SAGE Pilot). I can state without reservation that this represents a top
         priority for the University.

         I believe our participation in the Athena SWAN program will assist us to attract, retain and to advance our
         talented STEMM staff and students. Beyond the STEMM disciplines, we are equally sure that the initiative
         will embed cultural change which will enhance the development of the entire University.

         Southern Cross is committed to excellence in diversity, fairness and recognition. We are resolved to
         provide equal opportunity, access and development to all colleagues in our community.

         On a personal note, I am fully committed to leading the achievement of gender equity through Athena
         SWAN as Chair of the new Southern Cross University Gender Equity Committee. I have introduced Key
         Performance Indicators in the area of gender equity for all members of the Senior Executive and I report
         regularly to the University Council on our progress.

         Professor Anja Scheffers, supported by our Deputy Vice Chancellor (Research), Professor Mary
         Spongberg, has led the development of this application. I am deeply grateful to both of them. We are
         fostering a culture where gender equity and the lived experience of staff is respected in open dialogue
         and colleagues are encouraged to raise issues around any barriers which they perceive.

         We are excited to see the changes which are already underway at Southern Cross. These include the
         development of the University Gender Equity Committee, a targeted recruitment strategy for academic
         STEMM women; new training and resources to better support female academic promotion and career
         progression; and our re-launched staff mentoring program.

         As a mark of our commitment to enlightened social transformation, the University’s governing Council
         voted unanimously in 2018 to support Marriage Equality. This year it resolved equally strongly to back the
         Uluru Statement – Voice from the Heart.

         This application – founded as it is on principles of clear gender fairness – stems from that same sense of
         enlightened accountability.

scu.edu.au
Lismore                                                                                         Gold Coast
PO Box 157, Lismore NSW 2480 Australia    Hogbin Drive, Coffs Harbour NSW 2450 Australia        Locked Mail Bag 4, Coolangatta QLD 4225 Australia
T +61 2 6620 3000 F +61 2 6620 3700       T +61 2 6659 3777                                     T +61 7 5589 3000 F +61 7 5589 3700

CRICOS Provider 01241G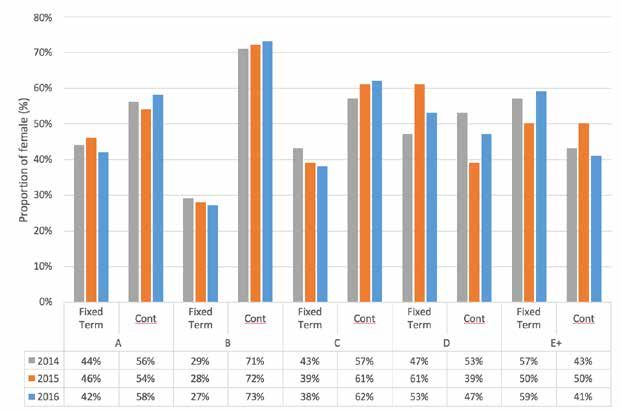
Office of the Vice Chancellor

  Office of the Vice Chancellor
         Equally, our institution is one of just four Australian university pilot sites to develop the strongest possible
         strategy to prevent violence against, and harassment of, women. That is something of which we are
         particularly proud. This project is being undertaken in collaboration with the leading Australian NGO, Our
         Watch; another indication of our strong belief in potential betterment and in gender equity.

         However, while we have achieved many goals, I recognise that we must do much more – as this
         application demonstrates. We have reflected on our current position and practices and have consulted
         widely with colleagues and students. We seek to understand the challenges, barriers and issues
         impacting on gender equity at Southern Cross and to address them forthrightly. We still have important
         work to do to increase our numbers of women – and, in particular, senior women in STEMM. Our
         challenge is to embed the principles, practices and attitudes required to sustain a more equitable gender
         profile and to create a truly inclusive environment in which staff and students can thrive.

         We are looking forward to celebrating and sharing our efforts, commitment and successes with the
         Southern Cross community, including the citizens of our region. We aspire to become an exemplary
         model of contemporary workplace gender equity. Finally, we have a strong desire to collaborate with
         other regional employers, to enable them to follow suit.

         I commend this application to you. Please feel free to contact me if I can amplify it in any way.

         Sincerely,

         Professor Adam Shoemaker
         Vice Chancellor
         Southern Cross University

scu.edu.au
Lismore                                                                                       Gold Coast
PO Box 157, Lismore NSW 2480 Australia      Hogbin Drive, Coffs Harbour NSW 2450 Australia    Locked Mail Bag 4, Coolangatta QLD 4225 Australia
T +61 2 6620 3000 F +61 2 6620 3700         T +61 2 6659 3777                                 T +61 7 5589 3000 F +61 7 5589 3700

CRICOS Provider 01241G
                                                                                                                                  Page 2 0f 2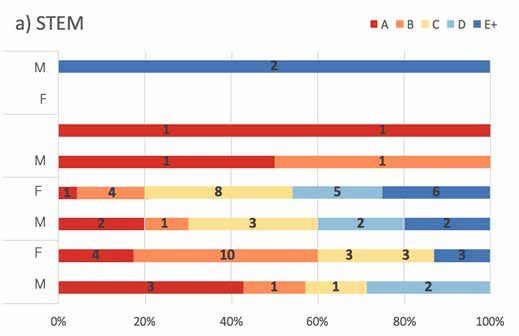
GLOSSARY OF TERMS

CALD                      Culturally and Linguistically Diverse
Casual Academic	Academic staff employed on a casual contract. May include ‘Lecturing,
                  Tutoring, Clinical Nurse Education, Marking, Other academic activity, IASS
                  Study Support Officers’
DVCA                      Deputy Vice Chancellor (Academic)
DVCR                      Deputy Vice Chancellor (Research)
EA                        Enterprise Agreement
ECR                       Early Career Researcher up to 5 years post PhD
EFTSL                     Equivalent Full-time Student Load
F                         Female
FTE                       Full-time equivalent
Gnibi                     Gnibi, College of Indigenous Australian Peoples
                                                                                                      6
Health                    School of Health and Human Sciences
HERDC                     Higher Education Research Data Collection

                                                                                                      AT H E N A S WA N I N ST I T U T I O N A P P L I C AT I O N
HEW                       Higher Education Worker
JCF                       Joint Consultative Forum
Levels A, B, C, D, E, E+	A Associate Lecturer
                          B Lecturer
                          C Senior Lecturer
                          D Associate Professor
                          E Professor
                          E+ Professors and those holding a senior position above their substantive
                          appointment
M                         Male
MCR                       Mid-Career Researcher between 5 and 15 years post PhD
MIS                       Management Information System
Other	Academic Function not including R&T, RO, or TO, normally senior
       management, executive or administrative roles
PRP                       Performance Review and Planning
PVCS                      Pro Vice Chancellor (Students)
RAP                       Reconciliation Action Plan
R&T                       Research and Teaching Academic Function
RO                        Research Only Academic Function
SAT                       Athena SWAN Self-Assessment Team
SCU                       Southern Cross University
SCUGEC                    Southern Cross University Gender Equity Committee
STEMM                     Science, Technology, Engineering, Mathematics and Medicine
STEM	Science, Technology, Engineering and Mathematics (excluding health
      disciplines)
The Professoriate         Academic Levels D, E and E+
TO                        Teaching Only Academic Function (SCU term is Teaching Scholar)
Teaching Scholar	Southern Cross University classification for Teaching Only appointments
UGSD                      Understanding Gender and Sexuality Diversity
VC                        Vice Chancellor
WHS                       Work, Health and Safety
X                         Other gender, not female or male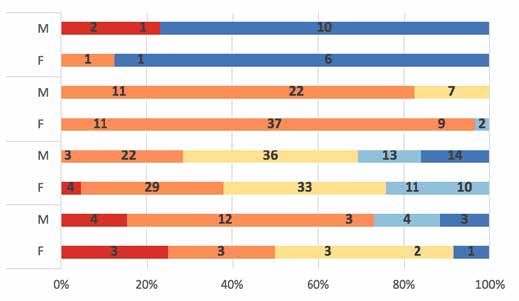
7

                                     AT H E N A S WA N I N ST I T U T I O N A P P L I C AT I O N
  2

Description of the Institution

Recommended word count   500 words
Actual word count		      561
(i)      information on where the institution is in the Athena SWAN process
Southern Cross is a young (est 1994) regional university headquartered in the Bundjalung nation
in Lismore New South Wales and has had a long history of commitment to the advancement of
Indigenous peoples, and the promotion of gender equity and diversity in our research and teaching.
There are three main campuses: Lismore, Coffs Harbour (NSW) and Gold Coast (Queensland), with
branch campuses in Sydney, Perth and Melbourne as well as tailored online delivery modes.
Southern Cross University (SCU) joined the Australian Athena SWAN pilot in September 2015. The
initiative was initially led by Professor Susan Nancarrow, Acting Deputy Vice Chancellor (Research),
and now Professor Mary Spongberg, Deputy Vice Chancellor (Research), the SAT chaired by Professor
Anja Scheffers, and support provided by the University Executive and staff within their relevant
portfolios. The principles of Athena SWAN are aligned to our strategic values of openness and respect,
collaboration and trust, and honest and ethical behavior. Our commitment is commensurate with our
size (and constraints), and we have tailored our approach as a result.
Our implementation plan will embed actions which ultimately drives a                                      8
cultural shift in STEMM and across the University.

                                                                                                          AT H E N A S WA N I N ST I T U T I O N A P P L I C AT I O N
(ii)	information on its teaching and its research
      focus
Teaching and research activities span a range
of disciplines: arts and social science, law
and justice, Indigenous studies, education,
health (e.g. nursing, podiatry), engineering,
business, tourism, and environmental and
agricultural science (e.g. marine, plant,
geoscience). Community engagement as a
collaborative process is woven throughout,
and linked to creating inspired student
learning and innovative research.
The Excellence in Research Australia
(ERA) 2018 assessment rated 23 discipline areas as
performing ‘at or above world standard’, with 14 areas rated as ‘well above world
standard’.

(iii)	the number of staff; present data for academic, professional and
       support staff separately
In 2016, SCU employed 333 academic staff (166 women and 167 men) and 562 professional staff
(377 women and 185 men) in continuing and fixed term positions (table 1). Women and men were
equally represented in the academic workforce, which exceeds the sector average of 45% for women’s
representation in academic roles (2016).1 Southern Cross University had 36% women at Level E in 2016
and is within the top 5 Australian universities for female representation.1 In terms of leadership, SCU
has 2 women on the Executive. The under-representation of women on Executive is recognized as a
gender equity issue which is a priority for SCU and is being addressed in our Action Plan.

1
    Universities Australia 2016 Interinstitutional Gender Equity Statistics.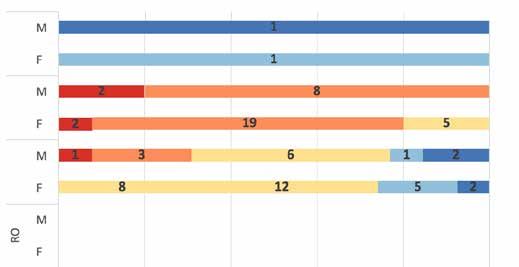
TABLE 1: SCU staff holding continuing and fixed term contracts by gender and employment
classification level (academic and professional) at 31 March 2016

LEVEL                    F        M      TOTAL     %F

A                        18       20       38       47
B                        70       56      126       56
C                        45       46       91       49
D                        16       18       34       47
E                        12       21       33       36
E+                       4        2        6        67
Academic Executive       1        3        4        25
                                                                                          9
VC                       0        1         1       0
Academic Total          166      167      333       50

                                                                                          AT H E N A S WA N I N ST I T U T I O N A P P L I C AT I O N
HEW1                     0        1         1       0
HEW2                     1        0         1      100
HEW3                     10       4        14       71
HEW4                    106       23      129       82
HEW5                    102       43      145       70
HEW6                     65       37      102       64
HEW7                     53       48       101      52
HEW8                     21       12       33       64
HEW9                     7        5        12       58
HEW10                    6        4        10       60
Senior Managers          5        6        11       45
Executive                1        2        3        33
Total                   377      185      562       67
OVERALL TOTAL           543      352      895       61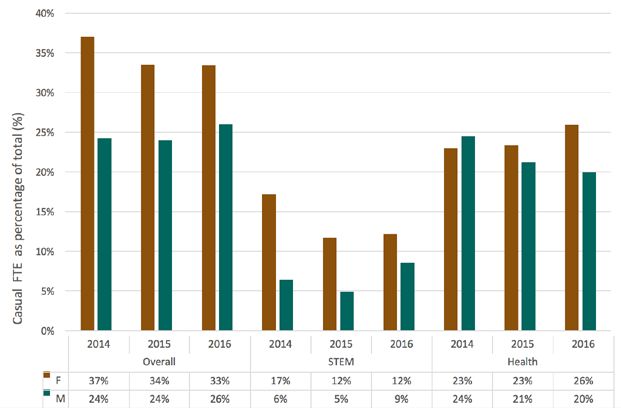
(iv) the total number of departments and total number of students
In 2016, across eight Academic Schools and seven Research Centres (table 2), our student load was
9750 EFTSL, with 29% enrolled in undergraduate STEMM programs (table 3). Students from more
than 50 countries study with SCU in Australia; the university delivers degrees with collaborators in
China, Singapore, Papua New Guinea and New Zealand. Academic and/or STEMM employees are
also employed in the Centre for Teaching and Learning, SCU College and Environmental Analysis
Laboratory (EAL).

TABLE 2: SCU Academic Schools and Research Centres

  STEMM                         School of Environment, Science and Engineering
                                School Research Centres:
                                National Marine Science Centre Centre for Coastal
                                Biogeochemistry Marine Ecology Research Centre Forest
                                Science Research Centre
                                                                                                       10

                                Southern Cross Plant Science Research Centre

                                                                                                        AT H E N A S WA N I N ST I T U T I O N A P P L I C AT I O N
                                Southern Cross GeoScience Research Centre
                                Environmental Analysis Laboratory

                     Health     School of Health and Human Sciences

  Non-STEMM                     School of Arts and Social Science

                                School of Law and Justice

                                School of Education
                                School Research Centre:
                                Centre for Children and Young People

                                School of Business and Tourism

                                Gnibi College of Australian Indigenous Peoples

                                Centre for Teaching and Learning

                                SCU College (University Access Pathways/English Language)
TABLE 3: SCU Student Enrolments (headcount) by degree classification and gender
2014 2015 2016
F M X Total %F F M X Total %F F M X Total %F
STEMM Undergraduate 273 388 0 661 41% 225 366 0 591 38% 234 352 0 586 40%
(excl. Health)
Postgraduate 74 70 0 144 51% 77 81 0 158 49% 100 173 0 273 37%
Health Undergraduate 1,739 520 0 2,259 77% 1,810 514 0 2,324 78% 2,153 602 0 2,755 78%
Postgraduate 216 91 0 307 70% 241 88 0 329 73% 360 106 0 466 77%
Non- Undergraduate 5,255 2,670 0 7,925 66% 5,228 2,795 0 8,023 65% 5,135 2,913 3 8,051 64%
STEMM
Postgraduate 1,079 935 1 2,015 54% 1,195 944 1 2,140 56% 1,385 1,193 1 2,579 54% 11
AT H E N A S WA N I N ST I T U T I O N A P P L I C AT I O N
SCU Undergraduate 7,267 3,578 0 10,845 67% 7,263 3,675 0 10,938 66% 7,522 3,867 3 11,392 66%
OVERALL
STEMM % 28% 25% 0% 27% 69% 28% 24% 0% 27% 70% 32% 25% 0% 29% 71%
Postgraduate 1,369 1,096 1 2,466 56% 1,513 1,113 1 2,627 58% 1,845 1,472 1 3,318 56%
STEMM % 21% 15% 0% 18% 64% 21% 15% 0% 19% 65% 25% 19% 0% 22% 62%(v) list and sizes of Science, Technology, Engineering, Mathematics and Medicine (STEMM)
departments. Present data for academic and support staff separately.
In 2016, STEMM employees represented 44% of academics, and 17% of the professional workforce
(table 4). While there was relative parity for professional STEMM employees, the School of Environment,
Science and Engineering and Southern Cross Plant Science had the lowest representation of female
academic appointments of all STEMM areas (table 4) which is not unusual in the sector.
With exceptions for Southern Cross GeoScience and Southern Cross Plant Science, data for research
centres are presented as part of an academic school. Due to the predominance of women, data for the
School of Health and Human Sciences (Health) have been presented separately where feasible.
TABLE 4: SCU STEMM and Health fixed term and continuing staff by organisational area 2016
(Headcount)
Academic Professional 12
F M Total %F F M Total %F
AT H E N A S WA N I N ST I T U T I O N A P P L I C AT I O N
STEMM School of Environment, 13 38 51 25 12 10 22 55
Science & Engineering
Southern Cross 4 6 10 40 3 2 5 60
GeoScience
Southern Cross Plant 2 7 9 22 12 12 24 50
Science
Environmental Analysis - - - - 5 10 15 33
Laboratory
STEMM Total 19 51 70 27 32 34 66 48
Health School of Health & 54 24 78 69 23 9 32 72
Human Sciences
STEMM TOTAL 73 75 148 49 55 43 98 56
SCU TOTAL 166 167 333 50 377 185 562 6713
AT H E N A S WA N I N ST I T U T I O N A P P L I C AT I O N
3
The Self-Assessment Process
Recommended word count 1000 words
Actual word count 711DESCRIBE THE SELF-ASSESSMENT PROCESS.
THIS SHOULD INCLUDE:
(i) a description of the self-assessment team
The Self-Assessment Team (SAT) governed the preparation and drafting of this application (table 5). To
facilitate flexibility, the structure was based on a three-tiered model of stakeholder engagement:
a. Senior Advisory Group (University Executive with visible role modelling and endorsement)
b. Core Working Group* (ex-officio; e.g. HR Services, Equity, Gnibi)
c. Advisory Group (diverse stakeholders from STEMM and non-STEMM to drive local engagement).
This model has given the project continuity, navigating changes in personnel (including ex officio
members) which occurred throughout 2015–2018.
TABLE 5: SCU Athena SWAN Pilot Self-Assessment Team (2015–2018) 14
AT H E N A S WA N I N ST I T U T I O N A P P L I C AT I O N
Tier Name Substantive Position Skills set & influence Diversity
Prof Susan Deputy Vice Chancellor Senior responsibilities for [redacted]
Nancarrow* (Research) research strategy / Matrix
influence
Prof Geraldine
Mackenzie
(2015–Sept 2017)
Prof John Jenkins Deputy Vice Chancellor Oversight Academic quality [redacted]
(Academic) and seven Schools / Matrix
Prof Andrew McAuley
influence
(2015–Oct 2017)
Prof Nan Bahr Pro Vice Chancellor Student experience / Dean [redacted]
(Students) School of Education /
Matrix influence
(new role Nov 2017)
Prof Anja Scheffers* Director, Southern Cross Chair SAT / Senior STEMM [redacted]
GeoScience Academic Leader
Dr Hanabeth Luke* Lecturer, Southern Cross SCU Athena SWAN Project [redacted]
(2015–July 2017) GeoScience Manager / Survey design
and analysis
Ms Julie Porter* Equity and Diversity Officer WGEA and gender [redacted]
(2015–April 2017) knowledge and
implementation
Ms Rachel Callahan* Equity and Diversity Head, Gender equity strategy, [redacted]
policy and intersectionality
advice (GLBTIQ /
Indigenous / CALD)
Mrs Sharon Farquhar* Director, HR Services Organisational culture and [redacted]
Human Resources expert
advice
Ms Wendy Poole / HR Workforce Planning Human Resources / WGEA [redacted]
Ms Stephanie Jarvis Managers data and advice / Gender
and HR Policy
Dr Nicole Rice* Executive Officer to DVCR Research grants, systems, [redacted]
policies and procedures /
Matrix influence
Prof Norm Sheehan Head Gnibi Indigenous expertise [redacted]
and cultural guidance /
Knowledge of Indigenous
STEMMTABLE 5: SCU Athena SWAN Pilot Self-Assessment Team (2015–2018)
Tier Name Substantive Position Skills set & influence Diversity
Prof Bill Boyd Environment, Science and Advice on research design, [redacted]
Engineering data analysis / Expertise in
ethics / STEMM research
Dr Renaud Joannes- Senior Lecturer, Southern STEMM researcher / Male [redacted]
Boyau* Cross GeoScience champion of gender equity
/ Research methodology
Ms Brigid Veale Head, SCU Communications and [redacted]
(2015–April 2017) Communications engagement / Advice on
promoting Athena SWAN
Associate Prof Geoff School of Education Specialist STEMM [redacted]
Woolcott Education / STEMM 15
academic in a non-STEMM
work area
AT H E N A S WA N I N ST I T U T I O N A P P L I C AT I O N
Dr Ellen Moon* Research Associate, STEMM Early Career [redacted]
Southern Cross Researcher / Expertise
GeoScience in social media
communications
Prof Leslie Christidis Dean, Graduate Studies, Post graduate student [redacted]
Graduate School experience, policy
and process / STEMM
researcher / Matrix
influence
Prof Isaac Santos Environment, Science and STEMM academic / Senior [redacted]
Engineering research leadership / Male
champion of gender equity
Associate Prof Danny Environment, Science and STEMM academic / [redacted]
Bucher Engineering Research methodology /
Male champion of gender
equity
Dr Kathryn Taffs Senior Lecturer, Course Coordinator [redacted]
Environment, Science and Bachelor of Science /
Engineering Research design and
analysis
Prof Bill MacNeil Dean, Law & Justice Non-STEMM senior leader / [redacted]
Research methodology
Dr Rudi Meir Senior Lecturer Health and Research methodology and [redacted]
Human Sciences ethical practice
(ii) an account of the self-assessment process
SENIOR ADVISORY GROUP: Met as required with Core Working Group and quarterly with SAT
The DVCR initiated participation in the Athena SWAN Pilot. The DVCA, and the incoming PVC
(Students) joined as members of Executive with responsibility for gender equity across our academic
environment. They engaged the broader University community and decision making groups through
senior management meetings and reports to Academic Board and Council.
Professor Anja Scheffers accepted an invitation to Chair the SAT and lead Athena SWAN. From 2015
until 2018, Professor Scheffers was supported by a part-time Athena SWAN Project Officer and
dedicated resources have been provided through Equity and Diversity and HR Services for data
reporting.CORE WORKING GROUP: Met Fortnightly
To ensure SCU’s participation in Athena SWAN was guided by stakeholders with relevant knowledge
and skills, a Core Working Group was established (table 5). Members regularly attended Athena SWAN
Regional Meetings with NSW and QLD Universities. They have shared information through networks
and at conferences, for example, Equity Practitioners in Higher Education Australasia.
This group has focused on collating relevant data and preparing the application. The data sets were
derived from the SCU Management Information System (MIS), HR Services, manual collation and the
research management system. Due to size, and relatively small data sets, collated data is presented for
some sections to avoid identification of individuals and ensure discussions were not biased. Given the
relatively low representation of women academics in STEMM, this group has been prioritised.
Qualitative findings were drawn from the following activities:
- All Staff (Athena SWAN) Survey (June 2017) – an all staff career experience survey (All Staff
Survey) was conducted to better understand factors influencing women. A total of 441 staff
responded (~ 30−40% of staff). 16
- Key Stakeholder Interviews (2017) − a series of 1−1½ hour Interviews were conducted with Heads
AT H E N A S WA N I N ST I T U T I O N A P P L I C AT I O N
and Deputy Heads of STEMM Schools, and Directors of Research Centres.
- SAT interviews (2017) − independent interviews were conducted with each member on their
experience and views within their work units and disciplines.
- Key cohort consultations (conducted by SAT team members) − Work Unit discussions and
consultations.
- Gender Program Evaluations − responses from women attending the annual SCU Academic
Promotion for Women, and the Women in Research workshops have informed this application.
Attendees included women from STEMM and non-STEMM disciplines across a range of levels.
Yarning Circle (June 2017) – views from members of Gnibi were gained through a culturally
-
appropriate consultative process.
ADVISORY GROUP: Met quarterly
In addition to the SAT, an Advisory Group included invited staff and student representatives to advise
on data collection and the design and rollout of the All Staff Survey. Membership included academic
and professional staff from STEMM and non-STEMM areas, of all genders, senior and junior, Indigenous
and culturally and linguistically diverse backgrounds. This ensured diversity of opinion and the capacity
to influence across the University.
(iii) plans for the future of the self-assessment team
To ensure the success of our SAGE Action Plan the SAT team will be reformed and formally re-launched
as the Vice Chancellor’s Gender Equity Committee.
Chaired by the Vice Chancellor, the Committee will comprise the Deputy Vice Chancellor (Research)
and all Deans and Research Centre Directors to ensure direct accountability for the successful
implementation of SAGE Actions. The Chair of the SAT Team and additional SAT member – the
Director, Human Resources, will be members of the new Committee to provide continuity, expertise
and further momentum to the SAGE goals and objectives.
The performance and success of Committee members’ participation and contribution will be
measured and evaluated through individual KPIs linked directly to annual performance reviews.
The Committee will meet quarterly and report to the Executive committee, SCU Council, Academic
Board and the Equity & Diversity Committee (following each meeting) on progress to date, successful
outcomes, resourcing of projects and new actions that arise during implementation.
Members of the SCU Gender Equity Committee will be accountable for demonstrating leadership in
gender equity, and leading and reporting on the implementation of SAGE actions in their portfolio or
School. Members will communicate with staff, students and external stakeholders on the commitment
and priority of SCU to gender equity, and will provide feedback to the Committee to support new and
future gender equity actions.A detailed communication strategy will be developed by the Committee to ensure awareness of
the Action Plan and implementation progress across the institution. New marketing tools, webpage
infrastructure and tailored engagement activities will be developed to support the Action Plan and
drive an attitudinal shift, ensuring gender equity underpins policy, practice, decision-making, events
and organizational processes.
SCU SAGE ACTION PLAN
- Establish the Southern Cross University Gender Equity Committee, chaired by Vice
Chancellor and promulgate its aims and outcomes to staff and students at all staff meetings,
email and the intranet.
- Report on the implementation of the SAGE Action Plan to Council, Exective Group,
Academic Board, School Boards, and to staff at the all-staff briefings.
17
AT H E N A S WA N I N ST I T U T I O N A P P L I C AT I O N18
AT H E N A S WA N I N ST I T U T I O N A P P L I C AT I O N
4
A picture of the Institution
Recommended word count 2000 words
Actual word count 2379ACADEMIC AND RESEARCH STAFF DATA
(i) Academic and research staff by grade and gender
In 2016, gender parity existed at the lower academic levels (A−D). However, the proportion of women
at Level A declined over the period of 2014 to 2016 (table 6) due to the practice of appointing early
career staff at Level B. Our profile is consistent with higher education trends across the sector, with
decreasing representation as women reached the professoriate.2 Consistent with national trends,
women comprised 67% of professional staff (table 4) at SCU and were clustered in the mid-range HEW
4-7 employment bands (table 1).
The number and proportion of female academic staff holding PhD qualifications is increasing. In 2016,
119 female staff and 125 male staff held PhD’s, compared to 115 and 135, respectively, in 2014.
TABLE 6: SCU academic staff by gender and level (2014–2016)
NB: E does not include Executive or senior managers
19
2014 2015 2016
AT H E N A S WA N I N ST I T U T I O N A P P L I C AT I O N
LEVEL F M Total %F F M Total %F F M Total %F
A 27 17 44 61 28 19 47 60 18 20 38 47
B 77 71 148 52 67 59 126 53 70 56 126 56
C 42 48 90 47 41 45 86 48 45 46 91 49
D 15 20 35 43 19 18 37 51 16 18 34 47
E 14 21 35 40 11 23 34 32 12 21 33 36
Total 175 177 352 50 166 164 330 50 161 161 322 50
Across all STEMM areas, females held 49% of academic and 56% of professional continuing and fixed
term appointments, placing SCU on par with the sector average of 45% for women’s representation
in academic roles (2016).3 However, inclusion of Health data hides underlying issues in STEMM areas
which span the disciplines known to be dominated by males from the point of bachelor qualification.4
Women represented around 25% of all academics in STEMM areas, with the highest representation at
Level A (figure 1). This is consistent with national trends, with the representation of women in STEMM at
only 32%.2
2
SAGE website reports – nationally 43% academics in STEMM are women, women represent 43% of all level A STEMM
Academics, and 20.6% of all level E STEMM Academics
3
Universities Australia 2016 Interinstitutional Gender Equity Statistics.
4
Office of the Chief Scientist 2016 Australia’s STEMM Workforce Australian Government CanberraFIGURE 1: Proportion of female fixed term and continuing academics by level and area
20
AT H E N A S WA N I N ST I T U T I O N A P P L I C AT I O N
STEMM HEALTH Non-STEMM
The Health disciplines at SCU are female dominated, as such, women represented 69% of academics, compared
with only 25% in the STEMM areas (figure 1). In Health, the highest proportions of women were clustered at Levels
B–D, however, there are still relatively fewer women advancing to the professorial level.
In non- STEMM areas, the proportion of women across all levels remained fairly stable over the three years, at
around 50% (data not shown). The representation of women in our non-STEMM areas was generally higher than
STEMM and lower than Health (figure 1). A higher proportion of women in our non-STEMM areas held Level E
appointments, however, we still observed a general decline in women above Levels A–B (figure 1).
The data reveal an opportunity to improve the proportions of women at key career pipeline positions, which is
occurring through staff renewal. A number of factors contribute to the lack of female academic staff in STEMM
disciplines and the lack of female STEMM staff at Professorial level, which is typical in the sector.
Qualitative feedback from the staff survey included calls for targeted programs to better enable career progression
for part-time staff, and greater staff diversity within schools – including those already with strong female staff
numbers.
We are adopting specific recruitment and appointment targets to attract female STEMM staff and are providing
significantly improved promotion support for women; and a number of retention initiatives in the area of flexible
work arrangements, better support for part-time staff and actions to improve the return rate of female staff from
parental leave.
In addition, the Action Plan includes measures to improve gender equity culture and governance within SCU which
will positively impact the numbers and levels of women across all cohorts of staff.(ii) Academic and research staff on fixed-term, open-ended/permanent and casual contracts by
gender
From 2014-2016, across all academic levels, the proportion of women on fixed term and continuing
contracts was relatively stable. At the lower academic levels (A–C) women were more likely to hold
continuing contracts in comparison with Levels D and E (figure 2).
FIGURE 2: Proportion of female academic staff by level on continuing or fixed term contracts
(NB: Individuals may be counted twice as some may hold more than one contract type across any year)
21
AT H E N A S WA N I N ST I T U T I O N A P P L I C AT I O N
For academic staff holding fixed term and continuing contracts, there were fewer women in STEMM areas, with
a notable decline above Level A (figure 1). In contrast, Health had high representation of women holding fixed
term and continuing contracts (69% overall), with women representing over 68% of Levels B–D, and the lowest
representation at Level E+ (figure 1). As noted in 4.1(i), across SCU there is an under-representation of women in
our professoriate, which includes senior management and executive.
The number of academic staff employed on a casual contract remained relatively stable at 30%. In STEMM
areas, the proportion of casual academic staff was around 10% (2016) with women more likely to hold a casual
contract (figure 3). Health had a higher reliance on casual academics, representing around 23% (2016) of their
workforce, with the proportion of women holding casual contracts higher (figure 3). Due to the professional
nature of Health degrees, there is significant casual engagement of local health professionals, to ensure
teaching is relevant and of high quality. Overall, at SCU there is a disproportionate number of female staff in
casual employment.
Under SCU’s Enterprise Agreement, fixed-term staff may apply to have their position converted where the work
is ongoing and their appointment was through an externally advertised vacancy. There are prescribed reasons
for employing fixed-term staff under the SCU EA. One of these reasons is for the employment of Early Career
Development Fellows which enables SCU to appoint long-term, appropriately qualified casual academics on
a fixed-term basis, providing beneficial career opportunities. Also within the EA, casual academic staff may be
redeployed to sessional employment on either a fixed-term or continuing basis.Consistent feedback was received through the staff survey (64% of survey respondents
were female) regarding the challenges and impact of insecure employment. Dominant
themes were evident in relation to:
• the need for longer term contracts
• the lack of transparent and clear career pathways
• the need for more effective performance management processes to support
career planning.
SCU recognises the imbalance in our profile relating to the proportion of women on casual and
fixed-term contracts. To improve and maintain continuity of employment, and facilitate the career
development of female staff in STEMM, SCU will set targets to convert existing female STEMM casual
and fixed-term staff to continuing employment.
In addition, in 2019 a review of research at SCU will address the use of short-term contracts, and move
casual and fixed-term research staff from Research Centres into academic Schools. This will provide
stronger and more direct pathways for current STEMM staff to continuing employment and enable 22
career development opportunities that come with more stable employment.
AT H E N A S WA N I N ST I T U T I O N A P P L I C AT I O N
SCU SAGE ACTION PLAN
- Set targets to convert existing casual and fixed-term female STEMM staff to continuing
employment to achieve an overall increase of 20% in continuing female STEMM staff numbers.FIGURE 3: Casual Academic FTE as a percentage of total by gender and area
23
AT H E N A S WA N I N ST I T U T I O N A P P L I C AT I O N
Overall STEMM Health
(iii) Academic staff by contract function and gender: research-only, research and teaching, and
teaching-only
The majority of fixed term and continuing academic staff were Research and Teaching (R&T) and
Teaching Only (TO), with women more likely to hold TO appointments (figure 4). “Teaching Scholar”
(TO) profiles provide a pathway for those pursuing a teaching career, and the ability to transition to R&T.
Generally, there was a higher representation of women holding TO appointments, notably higher in
Health (figure 4).
To highlight gender differences by function, contract type and level, this discussion focuses on 2016 data
(figures 5–6). The data indicate the majority of continuing positions were R&T, with relative parity between
women and men (figure 5c).
Within STEMM, there was an under-representation of women holding R&T and a higher proportion
holding TO positions (figure 4). However, there was relative parity between contract types for these
functions (figure 5a). Within Health, the majority of R&T roles were continuing; no men held fixed term
R&T, TO appointments, or both (figure 5b).
Research Only (RO) contracts are common within STEMM areas (60% of total, data not shown), and are
linked to performance in competitive research funding. However, the representation of women holding
this contract type was low (no RO in Health in 2016) (figure 5a and 5b). Due to the short term funding
cycles of research grants, RO appointments tend to be fixed term and aligned to the short term contract
cycles funding their activity (figure 5a). More men hold RO appointments (figure 5) in STEMM, while no
women hold RO appointments at Level E (figure 6a).
It is more common for R&T and TO contracts to be continuing (figure 5c). SCU’s Enterprise Agreement
(EA) facilitates continuity for positions linked to central funding and core activity. Health has strategically
broadened its undergraduate offerings and increased undergraduate numbers, and has focussed on
building capacity around a traditional mix of R&T and TO appointments (figure 5b).
In line with the high representation of women in Health, there is a high representation of women holding
R&T and TO appointments (figure 4). Women in STEMM areas are not moving from Level D to E. There is
an under-representation of women holding Level E, Senior Managerial appointments, or both, such as
Head of School, irrespective of contract type.FIGURE 4: Proportion of female continuing and fixed term academic by area and function
24
AT H E N A S WA N I N ST I T U T I O N A P P L I C AT I O N
STEMM HEALTH SCU Overall
FIGURE 5: Proportion of Fixed Term and Continuing Academics by gender and function (2016 only)
(NB: tables contain headcount of employees)
a) STEMM b) Health
c) SCUFIGURE 6: Proportion of fixed term and continuing academics by level and function (2016 only)
(NB. Numbers in bars is headcount of employees)
a) STEMM
25
AT H E N A S WA N I N ST I T U T I O N A P P L I C AT I O N
b) Health
c) SCU OverallAcross a three year period (2014–2016), the proportion of casual academic staff was relatively stable
(figure 7).
Across STEMM, there is an increase in the representation of women holding casual contracts (figure 7).
Traditionally, postgraduate research candidates (students) are engaged casually in teaching roles across
our STEMM, providing training for those considering an academic career.
The number of women and men (proportionate to FTE) engaged in casual TO roles increased over the
three years. Factors contributing to this include the University’s investment in new course offerings,
and the rapid expansion of courses and student numbers at our Gold Coast Campus.
The equity and balance of our overall academic profile is of concern and requires a deeper analysis.
The research only contracts are an artefact of our Special Research Centre structure and the
fellowships attached to those Centres. We are currently in the process of self-assessment and review
of these Centres and it is likely that this structure will not continue. It is an aim of the new research
strategy to move away from research only positions to support research intensive roles across
the University, and particularly in STEMM. Such roles will be appointed on the basis of integrated
26
performance, opportunity, and organizational priorities, rather than a single funding source. The
broadening of criteria for appointment, beyond a single funding source, will open up the possibility of
AT H E N A S WA N I N ST I T U T I O N A P P L I C AT I O N
more research pathway opportunities for female staff across the STEMM disciplines.
While some academic staff may choose a teaching scholar profile for professional or personal reasons,
or both, SCU needs to further interrogate this data to better understand the drivers of the proportion
of women in such roles. Evidence from staff surveys and annual performance review discussions
indicate that career interruptions and lack of metrics to support teaching excellence are sometimes
impediments to women successfully progressing to an integrated teaching and research role, and
to being promoted. Unconscious bias training that promotes greater understanding of research
performance relative to opportunity will remove potential barriers to promotion for women academics,
in STEMM and other disciplines. Supporting transition from teaching only to integrated teaching and
research roles through a review of promotion process and targeted research equity initiatives will also
enhance career progression for women in STEMM and other disciplines.
FIGURE 7: Proportion of casual6 academics by gender and area
SCU overall
Health
STEMM
STEMM Health
SCU overall
6
asual staff data at SCU is calculated by full-time equivalency according to the Enterprise Agreement hourly model,
C
not by headcount.SCU SAGE ACTION PLAN
- Review and improve the career development opportunities and promotional pathways for
female staff with Teaching Scholar profiles.
- Implement regular staff surveys and improve the annual performance review and planning
(PRP) guide to capture qualitative data on academic profile preferences and links to career
progression.
(iv) Academic leavers by grade and gender
Overall, between 15 and 17% of the academic workforce left SCU, per annum, between 2014 and 2016
(table 7). At Levels A and B, the majority departed due to their contract ending (between 58 and 60%).
These Levels also contributed the largest numbers of leavers (between 63 and 74%). At Level C, the
main reason was resignation, and at Levels D and E+, a fairly even split between contracts ending,
resignation and retirement.
27
More women than men exited the STEMM workforce (55% of 82 exits between 2014 and 2016) (table
AT H E N A S WA N I N ST I T U T I O N A P P L I C AT I O N
8). The most common exit reasons were contracts ending (62% female), and resignations (57% female)
(table 9). The data reflect SCU’s historical reliance on short fixed-term contracts in STEMM Research
Centres which has had a gendered impact on turnover and retention. The current review of Special
Research Centres will promote greater integration between the Centres and our largest STEMM School
– Environment, Science and Engineering. The integration will result in better job security for current
fixed-term STEMM research staff and improved pathways to maintaining a career at SCU.
TABLE 7: Academic Leavers as a percentage (%) of the total workforce
2014 2015 2016
F M Total F M Total F M Total
STEMM (excl. Health) 6 11 9 2 18 19 16 14 14
Health 18 12 16 8 12 16 20 4 15
SCU Overall 18 16 17 5 14 15 20 13 17
Feedback from the staff survey provides insight into possible drivers.
• a need for dedicated mentoring programs.
• better career progression opportunities for part-time staff.
• improved recognition and support particularly for teaching.
• more options regarding child care for staff.
The high number of women leaving the School of Health and Human Sciences due to resignation is of concern
and needs further investigation.
Qualitative data on leavers needs to be improved. Currently staff leaving have the option to complete an online
exit survey with a further option for an interview. The latter option is rarely taken up by either female or male staff
and the reasons for this are not yet known.
Programs targeting the progression and retention of female academic staff at all levels are required and the
Action Plan addresses the retention of STEMM staff. Work on converting and offering more stable employment,
particularly for STEMM women, forms part of this program of work (as per 4.1 (ii)).
Further targeted retention Actions include: implementing a career support and promotion program for early
and middle career women in STEMM; better management of career interruption, to ensure female staff are aware
of support for research re-establishment and equity fellowships; and developing a program of work promoting
good gender and flexible work arrangement practices to improve workplace culture.
SCU SAGE ACTION PLAN
- Implement an improved Exit Survey process.TABLE 8: Academic staff leavers by level and gender
2014 2015 2016
Level F M %F F M %F F M %F
STEMM A 4 4 0 3 4 43 3 2 60
(excl. Health) B 2 2 33 1 3 25 0 3 0
C - - - 0 1 0 0 1 0
D - - - 0 1 0 - - -
E+ - - - - - - 0 1 0
Health A 1 0 100 5 2 71 2 1 67
B 7 1 88 4 0 100 5 0 100
C 1 1 50 0 1 0 3 0 100
D 1 1 50 1 0 100 - - - 28
E+ - - - 0 1 0 1 0 100
SCU Overall A 8 7 53 11 10 52 9 4 69
AT H E N A S WA N I N ST I T U T I O N A P P L I C AT I O N
B 17 13 57 9 7 56 14 8 64
C 3 3 50 3 4 43 6 3 67
D 1 2 33 2 1 67 1 1 50
E+ 3 4 43 1 2 33 4 5 44
TABLE 9: Academic staff reasons for leaving
2014 2015 2016
Reason for
Leaving F M %F F M %F F M %F
STEMM Resignation 5 2 71 6 6 50 0 3 0
(excl. Health) Contract End 5 5 50 8 5 62 3 4 43
Redundancy 0 1 0 0 1 0 - - -
Other* 1 1 50 0 1 0 - - -
Health Resignation 4 1 80 5 3 63 8 0 100
Contract End 5 1 83 5 1 83 2 1 66
Redundancy 0 1 0 0 0 - - - -
Other* 1 0 100 0 0 - 1 0 100
SCU Overall Resignation 7 10 41 9 8 53 17 6 74
Contract End 20 11 65 15 10 60 12 13 48
Redundancy 2 2 50 0 2 0 - - -
Other* 3 6 33 2 4 33 5 2 71
*’Other’ includes termination, retirement or death (Redundancy includes voluntary and involuntary)(v) Equal pay audits/reviews
SCU’s gender pay equity is analysed through our annual submission to WGEA. SCU’s overall pay gap
(base salary and total remuneration) is significantly better than the “Comparison Group” (Tertiary
Education – All Employees) and is improving. In 2018 the gap was 5.9% which was a reduction from
9.6% in 2017. The comparison group median percentage was 11.5% and 12.0% respectively.
SCU’s current gap of 5.9% is primarily due to occupational segregation of SCU’s workforce with women
over-represented in lower paid administrative roles, and under-represented in senior academic and
management roles.
As the majority of SCU staff are paid according to EA salary schedules and a formal classification
system is in place, at an individual level, women and men are paid the same for similar work.
The EA does not apply to senior managers whose base salary exceeds the salaries for Academic
Level E and HEW 10. Outside of the EA, performance-based increases occur as part of annual review
processes.
29
Building on the WGEA submissions, we are undertaking a detailed gender pay audit which is an
important priority for SCU and is currently underway.
AT H E N A S WA N I N ST I T U T I O N A P P L I C AT I O N
Based on the outcome of this audit, further priorities will be determined and actioned. A strong focus
will be on analysing the starting salaries of new appointees to determine if there are any gender-based
trends. Discretionary remuneration, such as market loadings and bonus arrangements will also be
analysed (by HR Services on commencement or renewal of each case) to ensure gender equity across
the SCU workforce in this area of remuneration.
SCU SAGE ACTION PLAN
- Complete and report on the outcome of the Gender pay Audit including making
recommendations for changes in remuneraton practices.30
AT H E N A S WA N I N ST I T U T I O N A P P L I C AT I O N
5
Supporting and advancing
women’s careers
Recommended word count 5000 words
Actual word count 79915.1. KEY CAREER TRANSITION POINTS: ACADEMIC STAFF
(i) Recruitment
Data across three years (2014–2016), shows 43% of applications for positions were from women (table 10).
For Levels A and B, applications were on par by gender. At Level B there were around two and half times
more women than men appointed (29 female, 11 male; table 10), despite the relative gender parity between
applicants. However, the proportion of applications from women reduced to 35% for Level C (77 female, 145
male). A further reduction was observed for professorial appointments, with women applying for only 23%
of positions. This was significantly below SCU workforce representation rates in 2016 of 49% and 39% for
Levels C and E, respectively (table 2).
For STEMM areas, 39% of applicants were women (4% lower than SCU overall), and regardless of level, there
were more applications from men (table 10). At Level B in STEMM, there were 20 female appointments which
was five times the number of male appointments at the same level (table 10). We observed a decrease in
the number of applications from women for positions at Level C and above; at Level E there were nine times
31
more male applicants (3 female, 27 male; table 10).
Overall, women were more successful at progressing to shortlisting and appointment for all levels, except Level
AT H E N A S WA N I N ST I T U T I O N A P P L I C AT I O N
E (table 10). Anecdotal evidence from recruiters suggests the low level of women applying for senior academic
roles is caused by a combination of factors including our regional location and the University’s limited capacity
to appoint spouses. The development of improved attraction techniques to increase the number of women
applying for senior academic roles is needed and will form part of the targeted SAGE Actions. An example is
the development of a STEMM women onboarding package that will be available for candidates to access prior
to submitting an application and promoted during induction and on the staff intranet.
SCU’s Recruitment and Appointment policy guides recruitment, with equal opportunity principles
embedded throughout and promoted to applicants via the SCU website and throughout Jobs@SCU. The
benefits of working at SCU are strongly promoted including the range of flexible working conditions and an
active Employee Wellbeing program. Applicants are also provided with the University’s Values, professional
learning opportunities and detailed information about the selection process.
Selection panels must observe policy on gender balance (50% women) and this is closely monitored by
HR Services. Selection processes articulate and accommodate the particular needs of applicants from
equity groups including Indigenous Australians, people with disabilities and individuals from diverse cultural
backgrounds, and we actively promote applications from candidates from these groups.
Where there is an identified gender imbalance within the work unit or discipline, statements are included in
advertisements to encourage female (or male) applicants. We explicitly encourage the recruitment of men
and women with an Indigenous background, and in Health, male applicants are encouraged to apply.
TABLE 10: Academic Recruitment Aggregated Fixed Term and Continuing
(fixed term appointments in brackets)
FEMALE MALE
Applied Short Appointed Success Applied Short Appointed Success
Listed rate Listed rate
A 250 24 10 (5) 4% 251 10 7 (4) 3%
B 232 78 29 (8) 13% 251 48 11 (2) 4%
C 77 20 5 (2) 6% 145 27 8 6%
D 13 0 0 0% 66 4 0 0%
E 26 12 4 (4) 15% 68 17 4 (4) 6%
Total 598 134 48 (19) 8% 781 106 30 (10) 4%
A 76 7 3 (1) 4% 114 1 0 0%
B 139 39 20 (5) 14 159 19 4 (1) 3%
C 28 9 3 (1) 11% 79 12 3 4%
D - - - - - - - -
E 3 3 0 0% 27 8 2 (2) 7%
Total 246 58 26 (7) 11% 379 40 9(3) 2%Actions to improve SCU’s gender equity performance in recruitment include targets for the
recruitment of STEMM women, the development of a STEMM women onboarding package (which, for
example, will include information on flexible work arrangements available and our support for women
with caring responsibilities). Specialised training for hiring managers for STEMM vacancies, and the
roll-out of Unconscious Bias training for all senior managers will boost SCU’s experience in attracting
strong female candidates and improve our processes and outcomes in merit-based selection.
The Jobs@SCU website will also be improved to better showcase our flexible work arrangements,
leave conditions, career support programs and the University’s strong commitment to gender equity –
as per the Vice Chancellor’s Gender Equity Committee and SAGE Action Plan.
SCU SAGE ACTION PLAN
- Set targets for the recruitment of STEMM women at each level (targets to include numbers
of applicants, shortlisted applicants and those appointed) to achieve an overall increase of
20% in continuing female STEMM staff numbers. 32
- Deliver specialised training to Hiring Managers for STEMM vacancies.
AT H E N A S WA N I N ST I T U T I O N A P P L I C AT I O N
(ii) Induction
Induction for new employees takes two forms: a formal online induction, and a local work area
induction by the line manager (introductions, work space, behavioural expectations). In addition, prior
to commencement, we provide a list of discussion points to the manager of the new appointee and
require them to cover off on these issues on or prior to commencement (e.g. working hours, office
provisions, the importance of completing the online induction program).
New employees complete Work Health and Safety (WHS) and Equity online (includes gender equity)
training, and supervisors are accountable for ensuring completion. The Centre for Teaching and
Learning offers a wide range of induction support for new teaching staff.
An introductory suite of training programs, including EO Online, Respectful Workplace and Cultural
Competency, is required to be completed by new supervisors. A tailored induction program exists for
new Heads of Work Units. Confirmation of completed inductions are received and monitored by HR
Services.
HR Services has commenced a new initiative where HR Advisors contact new staff within a fortnight
of commencing to follow up directly on their induction experience, record their feedback on ways to
improve the induction (using a questionnaire template), and answer questions. This process has been
very effective although it has demonstrated a lack of consistency in the ‘thoroughness’ of induction -
particularly for new academic staff. This matter will be addressed through immediate changes to our
manager training programs.
The Action to create and implement a STEMM women onboarding package will be our priority in
addressing induction shortcomings. Following this, and based on continuously seeking feedback from
new employees, implementation of more effective and consistent onboarding packages for all staff will
be prioritized.
SCU SAGE ACTION PLAN
- Develop a STEMM women onboarding package.(iii) Promotion
Academic promotion is an annual process, and the criteria and processes are embedded in the
Academic Promotion Policy. Annual workshops are held to inform and guide applicants, with staff
and their supervisors expected to discuss and plan for promotion, as part of annual performance
reviews.
Over three years (2014–2016), there were 31 applications from women and 36 from men, with women
having a higher success rate (81%) than men (67%) (table 12). Part-time staff comprised only 3% of
promotion applications, despite the fact that they represented 16% of all fixed term and continuing
academics.
In our STEMM workforce, there were 11 applications from women and 20 from men, with women
having a higher success rate (91%) than men (65%) (table 13). There were no applications in STEMM
for promotion to Level B in 2014 or 2015, and there were no women seeking promotion to Level C or
D in 2016 (table 13). Across the three years, only one part-time STEMM staff member, who was female,
applied for promotion to Level B.
33
TABLE 11: Academic staff promotion applications received as a percentage of those eligible
to apply
AT H E N A S WA N I N ST I T U T I O N A P P L I C AT I O N
2014 2015 2016
F M Total F M Total F M Total
STEMM 8.2 10.1 9.2 4.2 14.5 9.0 2.9 6.6 4.6
Non-STEMM 8.9 6.0 7.5 6.0 3.9 5.0 8.8 10.4 9.6
Total 8.6 7.9 8.3 5.2 8.6 6.8 6.0 8.7 7.3
TABLE 12: SCU overall academic promotion by gender and level
FEMALE MALE
YEAR Level Applied Appointed Success Applied Appointed Success
rate rate
2014 B 1 1 100% 0 0 -
C 6 5 83% 5 3 60%
D 5 4 80% 4 2 50%
E 2 1 50% 3 2 67%
2015 B 3 3 100% 0 0 -
C 3 2 67% 3 3 100%
D 1 1 100% 4 3 75%
E 1 1 100% 5 3 60%
2016 B 3 3 100% 0 0 -
C 5 3 60% 6 2 33%
D 1 1 100% 6 6 100%
E 0 0 - 0 0 -TABLE 13: STEMM academic promotion by gender and level
FEMALE MALE
Level Applied Appointed Success Applied Appointed Success
rate rate
B 0 0 - 0 0 -
C 2 2 100% 3 1 33%
2014
D 2 2 100% 2 1 50%
E 2 1 50% 2 1 50%
B 0 0 - 0 0 -
C 1 1 100% 2 2 100%
2015
D 1 1 100% 3 2 67%
E 1 1 100% 4 3 75%
B 2 2 100% 0 0 - 34
C 0 0 - 2 1 50%
2016
AT H E N A S WA N I N ST I T U T I O N A P P L I C AT I O N
D 0 0 - 2 2 100%
E 0 0 - 0 0 -
When analysing applications as a percentage of those eligible to apply, fewer women than men
applied (table 12); a consistent trend in all areas, including STEMM. This may reflect a lack of
confidence in women’s perceptions of their readiness to apply and be successful, or perceptions of a
lack of support for career progression from their managers and peers.
The Staff Survey data highlighted that female academic staff (n = 83) were more likely than men (n =
63) to wait until they fulfilled all promotion criteria before applying (54.2% vs 46.6%). This may have
some bearing on the overall higher success rates for women.
The combination of lower applications from women but with overall higher success rates
demonstrates that SCU needs to do more work in building the confidence of female academic staff in
applying for promotion.
Women only promotion information sessions are held with strong take-up. In the last three years
between eight and ten women have attended the sessions. A feature of these sessions is discussion on
effectively addressing the “relative to opportunity” component of the application. In addition, several of
SCU’s most successful senior female STEMM academics are available to offer application guidance to
promotion applicants.
A new mentoring program has recently been launched with career progression as a strong element.
Interest in this program from female staff has been strong - four applications for every application from
male staff members.
The new Performance Review and Planning policy for academic staff, as well as the associated
manager training has a dedicated component on planning for academic promotion. The intention is to
start planning and preparation for future promotion as early as possible and to be reviewing progress
at least annually. Managers are required to provide constructive feedback to staff about promotion
prospects and to provide the support needed to facilitate successful promotion applications.
The SAGE Action Plan has a strong focus on improving promotion outcomes for female staff, including
working with Deans to identify and target potential applicants, the implementation of tailored
career support programs for early and mid-career women in STEMM, and a review of the Academic
Promotions Policy and Procedures to remove any barriers identified in this process that impede
women in this process.
Feedback from the Staff Survey showed that 27% of staff experienced challenges or barriers in
their career associated with their supervisor. As a result, actions are planned to ensure greater
accountability of line-managers in their support and encouragement of women to apply for promotion
when ready.You can also read