2020 The Bioscience Economy: Propelling Life-Saving Treatments, Supporting State & Local Communities - Biotechnology Innovation ...
←
→
Page content transcription
If your browser does not render page correctly, please read the page content below

TEConomy/BIO

   The Bioscience Economy:
  Propelling Life-Saving Treatments,
Supporting State & Local Communities

             2020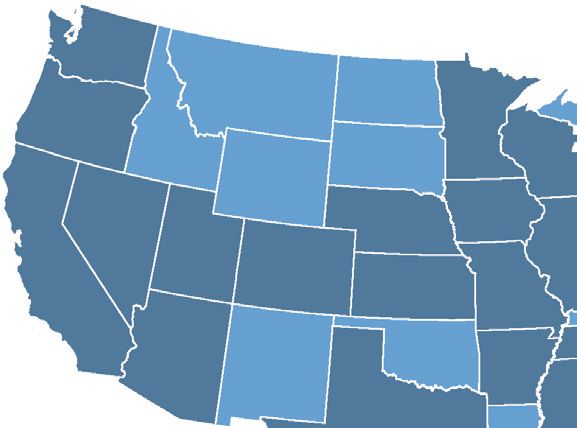
BIO is the world’s largest trade association representing biotechnology companies, academic institutions,
state biotechnology centers and related organizations across the United States and in more than 30 other
nations. BIO members are involved in the research and development of innovative healthcare, agricultural,
industrial and environmental biotechnology products. BIO also produces the BIO International Convention, the
world’s largest gathering of the biotechnology industry, along with industry-leading investor and partnering
meetings held around the world. BIOtechNOW is BIO’s blog chronicling “innovations transforming our world.”

TEConomy Partners, LLC is a global leader in research, analysis and strategy for innovation-driven economic
development. Today we’re helping nations, states, regions, universities and industries blueprint their future
and translate knowledge into prosperity. The principals of TEConomy Partners include the authors of the
prior Battelle/BIO State Bioscience Development reports, published since 2004. For further information,
please visit www.teconomypartners.com.

Public Affairs Consultants

PMP Public Affairs Consulting, Inc.—PMP— is an independent consulting firm serving the public and constitu-
ent relations needs of bioscience-related companies and associations.

TEConomy Partners, LLC (TEConomy) endeavors at all times to produce work of the highest quality, consistent with our
contract commitments. However, because of the research and/or experimental nature of this work, the client undertakes the
sole responsibility for the consequence of any use or misuse of, or inability to use, any information or result obtained from
TEConomy, and TEConomy, its partners, or employees have no legal liability for the accuracy, adequacy, or efficacy thereof.
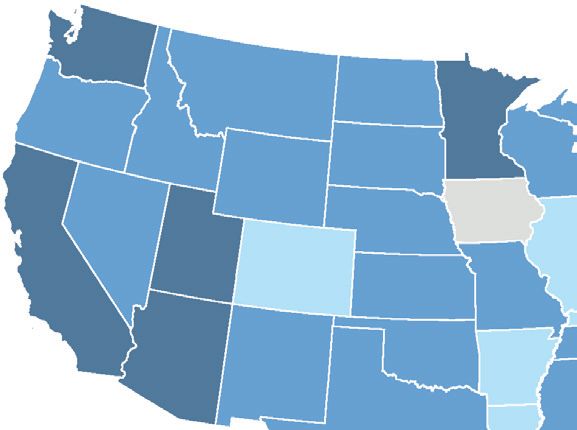
Table of Contents

The Bioscience Industry is in a Strong Position to Meet
the Medical and Economic Challenges of a Global Pandemic........................................................................1
    Introduction: An Industry Built for this Moment                                                                                                    1
    The Bioscience Industry’s Pandemic Response                                                                                                        1
    Highlights and Key Findings of the Latest Bioscience Industry and Ecosystem Assessment                                                            3

The U.S. Bioscience Industry: A Strong Growth Trajectory
Entering a Period of Global Economic Uncertainty...........................................................................................5
    Bioscience Industry Wages Reach Nearly Two Times the U.S. Average                                                                                10
    Bioscience Industry Economic Impacts: A $2.6 Trillion Contribution to the U.S. Economy                                                            11
    The Role Small- and Mid-Sized Firms Play in the U.S. Biopharmaceutical Sector
    and Innovation Pipeline Biopharmaceutical Sector and Innovation Pipeline                                                                         13
    The Bioscience Industry in U.S. States and Metropolitan Areas: Highlights and Key Findings                                                       15

The Innovation Ecosystem for the Biosciences: National Highlights and Leading States.................... 21
    University Bioscience R&D Activity: Rapid Recent Growth Fueling Innovation and Discovery                                                         21
    NIH Research Funding Returns to Steady Growth                                                                                                   24
    Patent Activity Signals Increasing Bioscience Innovation                                                                                        26
    Bioscience Venture Capital Investments Reach New Highs, Funding Shifts Towards Earlier Stages                                                   30

State and Metropolitan Area Performance Across the Bioscience Industry Subsectors...................... 35
    Agricultural Feedstock & Industrial Biosciences                                                                                                 36
    Drugs & Pharmaceuticals                                                                                                                         39
    Medical Devices & Equipment                                                                                                                     42
    Research, Testing, & Medical Laboratories                                                                                                       45
    Bioscience-Related Distribution                                                                                                                 48

Appendix: Data & Methodology......................................................................................................................... 51
    Industry Employment, Establishments and Wages                                                                                                    51
    Industry Economic Impacts and Employment Multipliers                                                                                            53
    Bioscience Academic R&D Expenditures                                                                                                            53
    National Institutes of Health (NIH) Funding                                                                                                     53
    Bioscience Venture Capital Investments                                                                                                          54
    Bioscience Patents                                                                                                                              54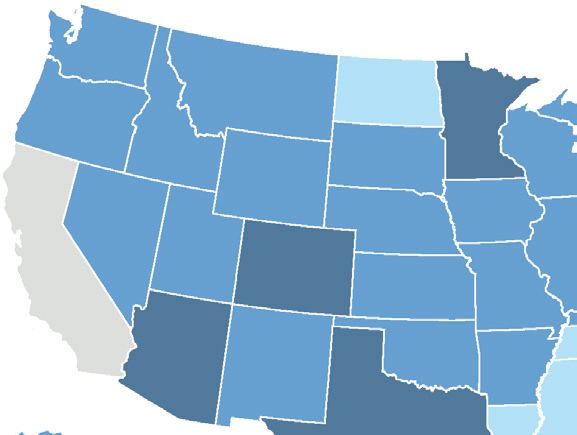
Tables
Table 1: U.S. Bioscience Establishment and Employment Summary, 2018 and Recent Trends                                        9
Table 2: Average Annual Wages for the Biosciences and Other Major U.S. Industries, 2018                                    10
Table 3: Economic Impacts of the U.S. Bioscience Industry, 2018 ($ in millions)                                             12
Table 4: State Specializations and Job Growth by Bioscience Subsector, 2018                                                 17
Table 5: Leading States in Academic Bioscience R&D Expenditures and Growth                                                 22
Table 6: Leading States in Per Capita and Concentration of Academic Bioscience R&D Expenditures, 2018                      23
Table 7: Leading States in NIH Funding, FY 2019                                                                            25
Table 8: Leading States-Bioscience-Related Patents                                                                         28
Table 9: Leading States in Bioscience-related Patents by Class Group, 2016-19                                              29
Table 10: U.S. Bioscience Venture Capital Investments by Stage, 2016-2019                                                   31
Table 11: Leading States in Bioscience Venture Capital Investments                                                         32
Table 12: Leading States in Bioscience Venture Capital Investments by Segment, 2016-19                                     33
Table 13: States with Large and Specialized Employment in Agricultural Feedstock and Industrial Biosciences, 2018          37
Table 14: Metropolitan Statistical Areas with the Largest Employment Levels in Agricultural                                37
Table 15: Metropolitan Statistical Areas with the Highest Location Quotients
in Agricultural Feedstock and Industrial Biosciences, by Size of MSA, 2018                                                 38
Table 16: States with Large and Specialized Employment in Drugs and Pharmaceuticals, 2018                                  40
Table 17: Metropolitan Statistical Areas with the Largest Employment Levels in Drugs and Pharmaceuticals, 2018             40
Table 18: Metropolitan Statistical Areas with the Highest Location Quotients
in Drugs and Pharmaceuticals, by Size of MSA, 2018                                                                         41
Table 19: States with Large and Specialized Employment in Medical Devices and Equipment, 2018                              43
Table 20: Metropolitan Statistical Areas with the Largest Employment Levels in Medical Devices and Equipment, 2018         43
Table 21: Metropolitan Statistical Areas with the Highest Location Quotients
in Medical Devices and Equipment, by Size of MSA, 2018                                                                     44
Table 22: States with Large and Specialized Employment in Research, Testing, and Medical Labs, 2018                        46
Table 23: Metropolitan Statistical Areas with the Largest Employment Levels in Research, Testing, and Medical Labs, 2018   46
Table 24: Metropolitan Statistical Areas with the Highest Location Quotients
in Research, Testing, and Medical Labs, by Size of MSA, 2018                                                               47
Table 25: States with Large and Specialized Employment in Bioscience-Related Distribution, 2018                            49
Table 26: Metropolitan Statistical Areas with the Largest Employment Levels in Bioscience-Related Distribution, 2018       49
Table 27: Metropolitan Statistical Areas with the Highest Location Quotients
in Bioscience-Related Distribution, by Size of MSA, 2018                                                                   50
Table A-1. Bioscience Industry Definition                                                                                  52
Table A-2. Bioscience-Related Patents—Classes and Groups                                                                   55

Figures
Figure 1: Economic Impacts of the U.S. Bioscience Industry, 2018                                                             3
Figure 2: Employment, Establishment, and Wage Trends for the U.S. Bioscience Industry                                        5
Figure 3: U.S. Bioscience Industry and Private Sector Employment Trends, 2001-18                                             6
Figure 4: Bioscience and Major Industry Subsector Employment Growth Trends, 2016-18                                          8
Figure 5: Economic Impacts of the U.S. Bioscience Industry, 2018                                                            12
Figure 6: Summarizing the Importance of Small and Mid-Sized Firms in the U.S.                                              14
Figure 7: Change in Bioscience Industry Employment by State, 2010-18 and 2016-18                                           16
Figure 8: University Bioscience R&D Expenditures, FY 2010-18 ($ in Billions)                                               22
Figure 9: National Institutes of Health Awards, FY 2013-19 ($ in billions)                                                 24
Figure 10: Bioscience-related U.S. Patents, 2016-19                                                                        26
Figure 11: Bioscience-related U.S. Patents by Segment, Cumulative 2016-19                                                  27
Figure 12: Bioscience-related Venture Capital Investments, 2016-19 ($ in Billions)                                         30
Figure 13: Bioscience-related Venture Capital Investments by Segment, 2016-19 ($ in Millions)                              32
The Bioscience Industry is in a Strong
Position to Meet the Medical and Economic
Challenges of a Global Pandemic

Introduction:                                                              area levels. This year, it also analyzes the important

An Industry Built for this Moment                                          role of small- and mid-sized biopharmaceutical
                                                                           companies within the innovation pipeline of new treat-
2020 has seen the rapid progression of the                                 ments. And while this report primarily documents the
COVID-19 global pandemic caused by the spread                              state of the industry leading up to the global pandem-
of the novel coronavirus SARS-CoV-2.1 While this                           ic, it begins by recognizing the rapid mobilization of the
global health emergency is alarming and tragic,                            industry and key partners to respond.
a strong public health response, combined with
smart science and innovative solutions, will enable
us to win the fight. As this biennial report on our na-                    The Bioscience Industry’s
tion’s bioscience industry has documented, two key                         Pandemic Response
characteristics of the industry set it apart and make
it vital in meeting the challenges of the pandemic:                        America’s bioscience industry is mobilizing in an
                                                                           unprecedented manner to address the pandemic.
    •      The innovative capacity of the bioscience
                                                                           Since the novel coronavirus was first detected, the
           industry to address global challenges from
                                                                           industry has stepped forward to develop diagnos-
           human health to food production and securi-
                                                                           tics, antiviral therapies, and vaccines to contain
           ty, to clean energy, and sustainability; and
                                                                           and treat the rapidly spreading illness. Dedicated

    •      The bioscience industry’s role as a consistent                  scientists and researchers from across the biosci-

           economic stalwart, with a track record of                       ence industry have begun or accelerated develop-

           generating high-quality jobs and near con-                      ment of vaccines and antiviral therapies. Numerous

           tinuous growth that has acted as a key buffer                   antiviral drugs, such as HIV medicines, have en-

           during prior economic recessions.                               tered clinical trials to test whether they can be used
                                                                           safely and effectively against the virus. Medicines
The bioscience industry is well-positioned to                              previously developed as medical countermeasures
respond to the imperative for new medical treat-                           against other coronaviruses, including SARS and
ments to help end the health crisis posed by the                           MERS, are also being tested as potential treatments
COVID-19 pandemic, as well as to contribute to the                         for COVID-19. According to BIO’s own pipeline
expected post-pandemic economic recovery.                                  tracker for COVID-19, as of mid-May 2020, there
                                                                           were more than 400 drug programs in development
Since 2004, this report has assessed the state of the                      aimed at eradicating the disease, including 100
U.S. bioscience industry and its associated innovation                     vaccine programs and 135 antiviral drug programs.2
ecosystem at the national, state, and metropolitan

1       Note: COVID-19 stands for the coronavirus disease 2019.
2       To access BIO’s COVID-19 Therapeutic Development Tracker, visit: https://www.bio.org/policy/human-health/vaccines-biodefense/
        coronavirus/covid-19-pipeline-tracker.

                                                                       1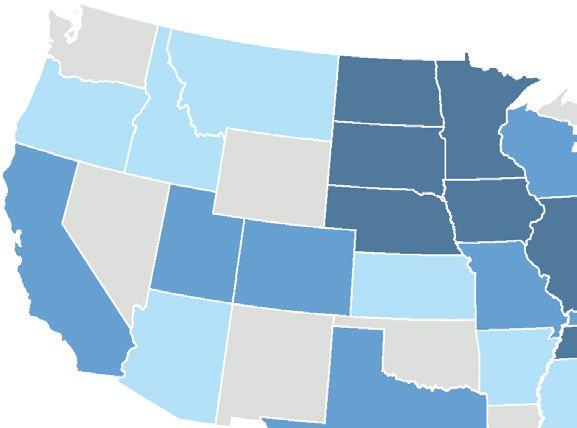
THE BIOSCIENCE ECONOMY: PROPELLING LIFE-SAVING TREATMENTS, SUPPORTING STATE & LOCAL COMMUNITIES

Containing an outbreak such as the novel coro-                             impact caused by the pandemic. Of particular
navirus requires an all-hands-on-deck effort with                          concern is the impact of the coronavirus on the
strategic collaborations. Numerous large biophar-                          ability of bioscience firms to conduct clinical trials,
maceutical companies such as Pfizer, Johnson &                             which are critical to bringing medical innovations
Johnson, AbbVie and Gilead, as well as smaller                             forward and scaling up bioscience company
biotech firms like Inovio, Moderna, and Novavax,                           activities. A survey by BIO and BioCentury of biosci-
are working closely with U.S. government agencies                          ence companies finds that 81 percent were facing
to identify and develop vaccines and therapies to                          challenges in conducting clinical trials because of
counter the deadly virus. Collaboration between                            the coronavirus outbreak.4
the public and private sectors is vital to translating
science into solutions to combat the virus. For these                      In addition, there are concerns about how the eco-
reasons, BIO is leading an effort that will connect in-                    nomic downturn caused by the COVID-19 pandemic
novators with partners across both the industry and                        will affect the formation and scale-up of emerging
government. The BIO Coronavirus Collaboration                              high-growth potential bioscience companies. The
Initiative is sharing information and best practices,                      most recent Venture Monitor, a publication pre-
as well as leveraging the expertise of leaders with                        pared by the National Venture Capital Association
experience responding to past public health emer-                          and PitchBook covering the first quarter of 2020,
gencies. It includes researchers and executives
          3
                                                                           voices this concern that “investment pace will
from BIO member companies and is overseen by                               likely slow down if shelter-in-place orders are still
experienced industry leadership.                                           in effect once deals that were already in progress
                                                                           or in the pipeline are completed, since VC is a
The pandemic has placed a spotlight on the impor-                          business that revolves around in-person meetings
tance of nurturing bioscience R&D and innovation                           with founding teams before making an investment
ecosystems. The current situation illustrates the im-                      … And just like startups in other sectors, life science
portance of proactive investment in these ecosys-                          companies are in cost-cutting mode.”5
tems and the underlying infrastructure and talent
that powers them—resources that can be directed                            Still, once the economy re-opens, history suggests the
toward innovating solutions when a global chal-                            bioscience industry will serve as an economic stabi-
lenge arises. The capacity of the global biophar-                          lizer since the demand for medical treatments are not
maceutical community to develop and produce                                dependent upon economic conditions. During and
diagnostic tests, vaccine candidates, and potential                        just after the “Great Recession” of late 2007 through
antiviral agents, and to then scale-up their clinical                      mid-2009, overall U.S. private sector employment
trials, manufacturing, and distribution, is the direct                     declined by 6.9 percent compared with a decline of
result of investments in the science, technologies,                        just 1.4 percent for the biosciences. Following the 2001
and skilled people that drive innovation. This report                      recession, all industry employment fell by 2 percent
has long documented these investments and the                              while the bioscience industry rose by 2 percent.
corresponding ecosystem dynamics across the U.S.
and sets out to do the same in this ninth edition.                         The bioscience industry as an innovation and
                                                                           economic driver has never been more important,
There is no doubt that the bioscience industry                             both for our health and our economic recovery.
will not be immune to the devastating economic

3   For more information visit BIO’s Coronavirus Hub at: https://hub.bio.org/.
4   BIO/BioCentury Survey: COVID-19 Impact on Clinical Trials: A joint survey from BIO and BioCentury at: https://www.bio.org/sites/default/
    files/2020-03/2020-03-25%20Survey%20and%20Citleine%20data%20v3.pdf.
5   NVCA and PitchBook, Venture Monitor: Q1 2020.

                                                                       2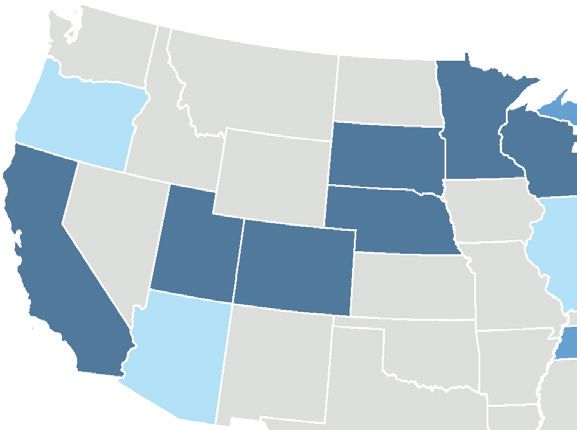
THE BIOSCIENCE ECONOMY: PROPELLING LIFE-SAVING TREATMENTS, SUPPORTING STATE & LOCAL COMMUNITIES

Highlights and Key Findings                                      •     Bioscience industry establishments and

of the Latest Bioscience Industry                                      average wages grew as well; and the industry
                                                                       continues to stand out as a major job genera-
and Ecosystem Assessment                                               tor among knowledge- and technology-driv-
                                                                       en sectors for the U.S. economy.
National Industry Highlights:
The U.S. bioscience industry has continued its impres-           •     All five of the industry’s major subsectors have
sive growth trend, generating high-paying, quality                     grown their employment base since 2016.
jobs and significant economic impacts for the nation.
                                                                 •     Bioscience industry wages now reach nearly
  •    The nation’s bioscience industry employs                        two times the overall U.S. average—the
       1.87 million across more than 101,000 U.S.                      average bioscience worker earns more than
       business establishments.                                        $107,000, or $50,000 more than the nation’s
                                                                       private sector average.
  •    Since 2016, the industry has grown its
       employment base by 7.2 percent, which                     •     The bioscience industry’s total economic
       is more than twice the growth rate for the                      impact on the U.S. economy totaled $2.6
       overall private sector.                                         trillion dollars in 2018, as measured by
                                                                       overall output (Figure 1).

Figure 1: Economic Impacts of the U.S. Bioscience Industry, 2018

              DIRECT IMPACT                                          TOTAL IMPACT

                                                                     Employment       9.4M
                                                                     Wages &
                                                                     Benefits      $699B

                                                                                     $2.6T
                                                                     Economic
             Bioscience Industry                                     Output
                Employment

                    1.87M                                            State &
                                                                     Local Taxes      $97B
                                                                     Federal
                                                                     Taxes          $150B
Source: TEConomy Partners data, analysis of U.S. IMPLAN Input/Output Model.

                                                            3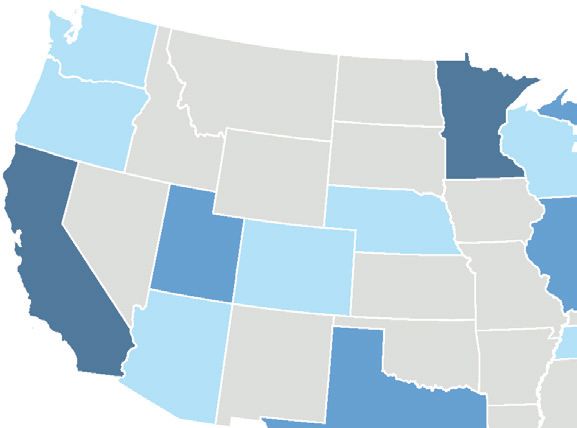
THE BIOSCIENCE ECONOMY: PROPELLING LIFE-SAVING TREATMENTS, SUPPORTING STATE & LOCAL COMMUNITIES

 •   The industry’s 1.87 million employees and as-              •   NIH Research Funding Returns to Steady
     sociated economic output support nearly 7.5                    Growth Path. In 2019, NIH awarded nearly $31
     million additional jobs throughout the econo-                  billion in extramural research funding. This
     my through indirect and induced effects.                       continues a steady growth trend over the last
                                                                    4 years following flat or declining research
State and Metropolitan Area                                         funding in the early part of the decade. Since
Industry Highlights                                                 2015, annual growth in NIH funding has aver-
The nation’s bioscience industry has a vast geo-                    aged 7.8 percent.
graphic footprint—extending to every U.S. state and
region. A majority of states have a “specialized”               •   Patent Activity Signals Increasing Bioscience
concentration of employment in at least one of the                  Innovation. American inventors were asso-
five bioscience subsectors, and the vast majority                   ciated with more than 108,000 U.S. patents
have contributed to national growth.                                awarded in bioscience-related classes and
                                                                    categories from 2016 through 2019. Despite
 •   Thirty-five states and Puerto Rico have a                      a dip in totals in 2018, patent awards have
     specialization in at least one of the five                     grown by 17 percent since 2016, or 5.6 percent
     bioscience subsectors in 2018.                                 annual growth, to reach nearly 30,000 in 2019.

 •   Over the 2016 to 2018 period, 41 states experi-            •   Bioscience Venture Capital Investments
     enced job growth in the bioscience industry.                   Reach New Highs, Funding Shifts Toward Key
                                                                    Earlier Stages. Over the latest 4-year period,
Likewise, a majority of U.S. metropolitan areas also                cumulative venture capital investments in U.S.
have a niche bioscience specialization.                             bioscience companies exceeded $102 billion,
                                                                    reflecting an increasing trendline and new
 •   Of the nation’s 384 metro regions, 217 (57 per-                highs. In both 2018 and 2019, bioscience-re-
     cent) have a specialized employment concen-                    lated investments exceeded $30 billion. In the
     tration in at least one bioscience subsector.                  latest 4-year period, the pre-seed through
                                                                    early-stage investment dollars directed
Innovation Ecosystem Highlights                                     toward the biosciences matched the level of
The assessment of the industry’s innovation eco-                    those invested in later-stage companies, a
system finds it performing well, trending upward,                   50-50 split. This proportion of funding in earli-
and reaching new heights. Highlights from the                       er-stage companies is above the two-decade
ecosystem assessment include:                                       average of 45 percent, representing a positive
                                                                    shift toward the key earlier stage investments.
 •   University Bioscience R&D Activity: Rapid
     Recent Growth Fueling Innovation and                     While the bioscience industry has continued with
     Discovery. Academic R&D expenditures in                  strong growth and a thriving ecosystem, its success
     bioscience-related fields reached $47.2 billion          cannot be taken for granted. This is particularly
     in 2018. After stagnating for several years in the       true as it addresses the global pandemic and
     early part of the decade, U.S. universities have         challenges of a post-pandemic recovery. There
     significantly increased bioscience research              is an acute need in the near-term for federal and
     activity since 2015. Where expenditure growth            private investments in R&D and both public and
     averaged just 0.7 percent annually over the              private investment need to scale-up production of
     2011-14 period, the pace has accelerated to av-          vaccines and therapies for COVID-19.
     erage 5.8 percent growth annually since 2015.

                                                          4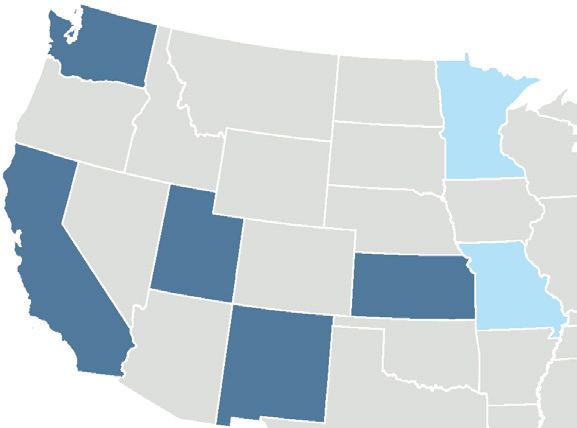
The U.S. Bioscience Industry:
A Strong Growth Trajectory Entering
a Period of Global Economic Uncertainty

Leading up to the 2020 COVID-19 global pandemic,                                     2019 had reached record-setting length. Since
the U.S. bioscience industry continued its impressive                                the “Great Recession” that began in late 2007,
growth trend, generating quality jobs and signifi-                                   and bottomed-out in mid-2009, the bioscience
cantly impacting the national economy. Since 2016,                                   industry has grown its employment base by 18
the industry has grown by 7.2 percent or more than                                   percent compared with 17 percent for all industries
twice the growth rate for the overall private sector                                 (Figure 3). Bioscience job growth accelerated from
(3.3 percent). Bioscience industry establishments
                    6
                                                                                     2017 to 2018, even accounting for differences due to
and average wages were up as well and the indus-                                     sector re-classification by the federal government
try continues to stand out as a major job generator                                  (see the Technical Note on page 8).
among knowledge- and technology-driven sectors
for the U.S. economy (see Figure 2).                                                 What stands out about the long-term trend is the
                                                                                     industry’s near continuous growth and its resiliency
These latest trends reflect sustained industry                                       during the last two recessions. The biosciences
growth over an economic expansion that by                                            have provided a much-needed buffer during

Figure 2: Employment, Establishment, and Wage Trends
for the U.S. Bioscience Industry
Bioscience Industry Growth Outpacing Overall Private Sector and Other Technology Industries

                               Growth Trends, 2016-18                                                     Employment Trend, 2016-18

                                           18.0%                                         8.8%
                                                                                                       7.2%

                                                                                                                    3.5%           3.3%

                                                                          8.7%
             7.2%                                                  6.9%

      3.3%                        3.1%

                                                                                                                                                -4.6%

      Employment                 Establishments                     Wages              Software &   Biosciences   Aerospace    Total Private   Computer
                                                                                       Computer                   Products &     Sector        Hardware
                    Total Private Sector     Bioscience Industry                        Services                     Parts

Source: TEConomy Partners analysis of U.S. Bureau of Labor Statistics, QCEW data; enhanced file from IMPLAN.

6   The bioscience industry growth trend has been impacted by a shift in the federal industry classifications in one of its five major
    subsectors—bioscience-related distribution. For a discussion on this, please see the Technical Note on page 8 of this report.

                                                                                 5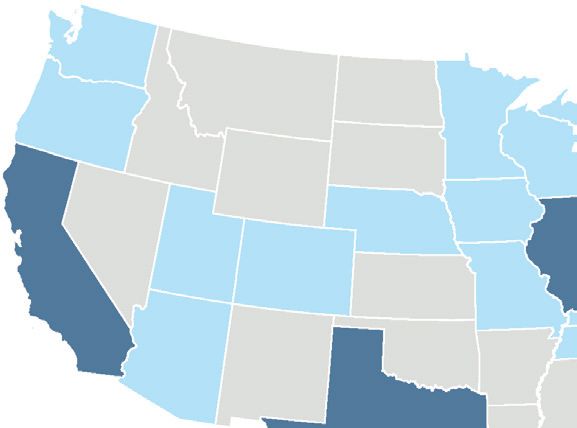
THE BIOSCIENCE ECONOMY: PROPELLING LIFE-SAVING TREATMENTS, SUPPORTING STATE & LOCAL COMMUNITIES

  Figure 3: U.S. Bioscience Industry and Private Sector Employment Trends, 2001-18
  The industry’s near continuous long-term growth and its resiliency during the last two recessions.
                                132

                                128
                                                                                                                         U.S. Bioscience Industry
                                124
Employment Index (2001 = 100)

                                120

                                116

                                112

                                108
                                                                                                                                   U.S. Total Private Sector
                                104

                                100

                                96
                                      2001   2002   2003   2004 2005 2006 2007   2008 2009   2010   2011   2012   2013   2014   2015   2016   2017   2018

  Note: Shaded areas represent recessions.
  Source: TEConomy Partners analysis of U.S. Bureau of Labor Statistics, QCEW data; enhanced file from IMPLAN.

  What stands out about the long-term industry trend is the industry’s near continuous
  growth and its resiliency during the last two recessions—the biosciences have provided
  a much-needed buffer during economic downturns, a key characteristic amid the current
  pandemic-induced global downturn.

  economic downturns, a key characteristic amid                                           products and markets, each with their own eco-
  the current pandemic-induced global downturn.                                           nomic and business dynamics (see “Defining the
  In the Great Recession, overall U.S. private sector                                     Bioscience Industry”). With that acknowledged, all
  employment declined by 6.9 percent compared                                             five of the industry’s major subsectors have grown
  with a decline of just 1.4 percent for the biosciences.                                 since 2016 (see Figure 4 and Table 1).
  Following the 2001 recession, all industry employ-
  ment fell by 2 percent while the bioscience industry                                       •   Research, testing, and medical laboratories
  rose by 2 percent.                                                                             represents the largest subsector of the
                                                                                                 bioscience industry. The subsector, which
  The biosciences are not monolithic. The breadth of                                             employs nearly 570,000 (30 percent of total
  industry activity translates into a series of unique                                           industry jobs), grew by 4 percent from 2016-18.

                                                                                      6
THE BIOSCIENCE ECONOMY: PROPELLING LIFE-SAVING TREATMENTS, SUPPORTING STATE & LOCAL COMMUNITIES
That is an annual pace slightly lower than its ed within research, testing, and medical labs.
average during the full economic expansion. Within the drugs and pharmaceuticals sub-
Biotechnology and other commercial life sector, each component industry has grown
sciences R&D and testing labs employ about since 2016, with the strongest growth coming
two-thirds of the bioscience workers within from companies manufacturing biological
the subsector. The remainder are employed in products, which includes vaccines.
medical laboratories. Both major components
of the subsector have grown since 2016. • Agricultural feedstock and industrial biosci-
ences returned to a growth path in the last
• Medical devices and equipment employ one two years, growing its employment base by
in five U.S. bioscience workers and saw its hir- 0.9 percent following two years of modest job
ing accelerate in the last two years—growing declines. The subsectors’ nearly 69,000 jobs
by 5.3 percent overall since 2016. The sub- represent 4 percent of U.S. bioscience jobs.
sector’s average annual employment growth Job gains were spread across the subsector
of 2.6 percent since 2016 was more than components, with modest growth in both
twice as fast as that for the overall expansion agricultural feedstocks and in agricultural
period (1.2 percent growth annually since chemicals manufacturing.
2010). Each component of the medical device
subsector has contributed to growth in recent • Bioscience-related distribution operations
years. Manufacturers of surgical and medical employ 545,000 in key activities across
equipment and of electromedical equipment the industry value chain, accounting for 29
have seen particularly strong growth. percent of industry employment. A significant
classification adjustment to the federal
• The drugs and pharmaceuticals subsector data by the Bureau of Labor Statistics (see
employs more than 308,000 U.S. workers and Technical Note sidebar) boosted in 2018 what
also experienced accelerated hiring since was a more modest growth trend. Subsector
2016, growing its employment base by 3.1 growth, and the impact of the adjustment,
percent, up from 2.0 percent growth in the was concentrated in two of the wholesale
prior 2-year period. After several years of net components—medical, dental, and hospital
job declines for the subsector during and equipment and drugs distribution.
immediately following the Great Recession,
pharmaceutical manufacturers have now
increased employment in six consecutive
years. While accounting for 16 percent of U.S.
bioscience jobs, the subsector is closely tied
to commercial R&D firms and establishments,
including biotechnology R&D, that are includ-
7THE BIOSCIENCE ECONOMY: PROPELLING LIFE-SAVING TREATMENTS, SUPPORTING STATE & LOCAL COMMUNITIES
Technical Note on the Growth Trend in Bioscience-related Distribution
Changes in the federal classification approach within the wholesale trade industry have impacted
the growth trend for bioscience-related distribution and warrant a discussion in this report.
Periodically, the federal statistical system updates its industry classification scheme (the North
American Industry Classification Scheme or “NAICS”). Following the 2017 NAICS update, the
U.S. Bureau of Labor Statistics (BLS) revisited the way in which it classifies certain distribution
establishments. In doing so, BLS has shifted away from classifying many individual establishments
in a relatively general “Wholesale Trade Agents and Brokers” industry sector and instead placed
more establishments into distribution sectors specifically aligned with their wholesale products.
In doing so, a disproportionate number of establishments (and their associated employment)
ended up reclassified into the bioscience-related distribution sectors (particularly drugs and
medical equipment) and had the effect of creating a significant, yet immaterial, increase in the
employment, establishment and wage level within the bioscience-related distribution subsector
in 2018. This reclassification, while providing a more accurate count of the true size and scale of
bioscience-related distribution, has impacted the overall bioscience industry trends. And while it is
not possible to fully adjust for this, the growth trend in distribution is consistent with growth across
the biosciences during this period and toward the end of a record-setting economic expansion.
Figure 4: Bioscience and Major Industry Subsector
Employment Growth Trends, 2016-18
All five bioscience industry subsectors grew during the 2016-18 period
18%
16.1%
16%
14%
12%
10%
8% 7.2%
6% 5.3%
4.0%
4% 3.3% 3.1%
2%
0.9%
0%
Bioscience- Total Medical Devices Research, Testing, Total Private Drugs & Ag Feedstock &
related Bioscience & Equipment & Medical Labs Sector Pharmaceuticals Industrial
Distribution Industry Biosciences
Source: TEConomy Partners analysis of U.S. Bureau of Labor Statistics, QCEW data; enhanced file from IMPLAN.
8THE BIOSCIENCE ECONOMY: PROPELLING LIFE-SAVING TREATMENTS, SUPPORTING STATE & LOCAL COMMUNITIES
Table 1: U.S. Bioscience Establishment and Employment Summary,
2018 and Recent Trends
Establishments Employment
Bioscience Industry &
Major Subsectors Change, Change, Change, Change,
Count, 2018 Count, 2018
2010-18 2016-18 2010-18 2016-18
Agricultural Feedstock &
1,785 4.6% 4.4% 68,642 3.8% 0.9%
Industrial Biosciences
Bioscience-related Distribution 51,582 42.6% 31.8% 545,055 23.9% 16.1%
Drugs & Pharmaceuticals 4,451 53.1% 18.6% 308,357 4.2% 3.1%
Medical Devices & Equipment 8,753 25.8% 8.3% 378,431 10.2% 5.3%
Research, Testing, &
34,572 47.5% 4.7% 569,470 30.9% 4.0%
Medical Laboratories
Total Biosciences 101,143 42.1% 18.0% 1,869,955 18.3% 7.2%
Source: TEConomy Partners analysis of U.S. Bureau of Labor Statistics, QCEW data; enhanced file from IMPLAN.
Defining the Bioscience Industry
Defining the biosciences is challenging due to its diverse mix of technologies, products and
markets, R&D focus, and companies themselves. The industry includes companies engaged in
advanced manufacturing, research activities, and technology services, but has a common thread
or link in their application of knowledge in the life sciences and how living organisms function. At a
practical level, federal industry classifications do not provide for one over-arching industry code
that encompasses the biosciences. Instead, two dozen detailed industries must be combined and
grouped to best organize and track the industry in its primary activities.
The TEConomy/BIO biennial reports have developed an evolving set of major aggregated
subsectors that group the bioscience industry into five key components, including:
Agricultural feedstock and industrial biosciences —Firms engaged in agricultural processing,
organic chemical manufacturing, and fertilizer manufacturing. The subsector includes industry
activity in the production of ethanol and other biofuels.
Bioscience-related distribution —Firms that coordinate the delivery of bioscience-related products
spanning pharmaceuticals, medical devices, and ag biotech. Distribution in the biosciences is
unique in its deployment of specialized technologies including cold storage, highly regulated
monitoring and tracking, and automated drug distribution systems.
Drugs and pharmaceuticals —Firms that develop and produce biological and medicinal products
and manufacture pharmaceuticals and diagnostic substances.
Medical devices and equipment —Firms that develop and manufacture surgical and medical
instruments and supplies, laboratory equipment, electromedical apparatus including MRI and
ultrasound equipment, dental equipment and supplies.
Research, testing, and medical laboratories —Firms engaged in research and development in
biotechnology (pre-market) and other life sciences, life science testing laboratories, and medical
laboratories. Includes contract and clinical R&D organizations.
9THE BIOSCIENCE ECONOMY: PROPELLING LIFE-SAVING TREATMENTS, SUPPORTING STATE & LOCAL COMMUNITIES
Bioscience Industry Wages Reach a skilled workforce throughout the industry perform-
Nearly Two Times the U.S. Average ing scientific R&D, designing and engineering com-
plex products and production processes, leveraging
The importance of the bioscience industry as an information technologies and advanced data
economic engine for the U.S. is further illustrated by analytics, manufacturing and distributing products,
its wage levels. Bioscience workers earn wages well largely under highly-regulated oversight regimes.
above those for their counterparts in other major
industries, reflecting the highly innovative, value-add- Average wages for each of the five major subsec-
ing nature of the industry and the skills it requires. tors far exceed those for the overall private sector,
and three of the five exceed $100,000 annually. The
In 2018, the average U.S. bioscience worker earned biosciences pay wages that are competitive rela-
more than $107,000, which is $50,000 more than tive to other knowledge-intensive sectors such as
the private sector national average (Table 2). This information technology, finance and insurance, and
89 percent wage premium reflects the demand for professional services.
Table 2: Average Annual Wages for the Biosciences
and Other Major U.S. Industries, 2018
Major U.S. Industries Average Annual Wages
Research, Testing, & Medical Laboratories $120,320
Information $113,795
Drugs & Pharmaceuticals $113,544
Finance and Insurance $109,247
Total Biosciences $107,610
Bioscience-related Distribution $105,905
Professional, Scientific, and Technical Services $97,114
Medical Devices & Equipment $90,541
Agricultural Feedstock & Industrial Biosciences $83,151
Manufacturing $68,528
Construction $62,732
Real Estate and Rental and Leasing $59,125
Total Private Sector $57,043
Transportation and Warehousing $53,215
Health Care and Social Assistance $50,328
Retail Trade $32,357
Source: TEConomy Partners analysis of U.S. Bureau of Labor Statistics, QCEW data; enhanced file from IMPLAN.
10THE BIOSCIENCE ECONOMY: PROPELLING LIFE-SAVING TREATMENTS, SUPPORTING STATE & LOCAL COMMUNITIES
Bioscience Industry Economic • Employment. The total number of full-
Impacts: A $2.6 Trillion and part-time jobs in all industries;
• Personal Income. The wages and salaries,
Contribution to the U.S. Economy including benefits, earned by the workers
holding the jobs created;
The 1.87 million U.S. bioscience industry workers are • Value-Added. The difference between
employed across every U.S. state, create a sub- an industry’s total output and the cost
stantial national economic impact. The biosciences of its labor and other inputs; and
have an extensive, interdependent supply chain for • Output. The total value of production
its research, production, and distribution activities. or sales in all industries.7
The industry both supports and depends upon
other sectors to supply everything from business Additionally, the model allows for a high-level esti-
services to commodity inputs. In addition, industry mation of tax revenues generated by the economic
employees who earn high average wages generate activity at a combined state/local level and at a
demand for goods and services through their own federal level. These tax revenues include estimates
personal spending. As a result, the biosciences of a variety of corporate and personal tax pay-
have a national economic impact that extends and ments, including both the employer and employee
multiplies well beyond the industry’s direct employ- portions of social insurance taxes.
ment and earnings.
The total economic impact of the bioscience industry
Economic impact analysis measures these types of on the U.S. economy, as measured by overall output,
impacts and effects described, including: totaled $2.6 trillion dollars in 2018 (Figure 5 and Table
3). This impact is generated by the direct industry
• Direct effects: the direct employment and other output ($1.1 trillion) combined with the indirect and
economic activity generated by the bioscience induced impacts, which total nearly $1.5 trillion. It
industry’s operations and expenditures; means that for every $1 in industry output, an addi-
• Indirect effects: the economic activity tional $1.27 in output is generated throughout the rest
generated by supplier firms to the of the national economy. This is an industry output
bioscience industry; and “multiplier” of 2.27. This substantial industry output
• Induced effects: the additional economic represents 7.1 percent of all U.S. economic activity.
activity generated by the personal spending
of the direct bioscience employees and the The 1.87 million bioscience employees, and their
employees of the supplier firms in the overall associated economic output, support nearly 7.5
economy. million additional jobs throughout the entire econ-
omy through both indirect and induced effects.
The sum of these three effects is referred to as These additional jobs span numerous other indus-
the total economic impact. TEConomy estimated tries including real estate, consulting, legal services,
the total economic impact of the U.S. bioscience transportation, information technology, and utilities,
industry in 2018 based on employment values for just to name some. The industry’s employment
each detailed industry sector within the biosciences multiplier is 5.0, which means that for every one
and evaluated the impacts across several key bioscience job an additional four jobs are support-
economic measures: ed throughout the rest of the economy.
7 The total output impacts are often referred to as the “economic impact” of an industry, project or investment.
11THE BIOSCIENCE ECONOMY: PROPELLING LIFE-SAVING TREATMENTS, SUPPORTING STATE & LOCAL COMMUNITIES
Additional economic impacts of the industry extend These total taxes, through combined direct and multi-
to local, state, and federal tax revenues through the plier effects, are estimated to have contributed nearly
corporate, personal income, and other taxes paid by $97 billion to state and local governments and almost
bioscience firms, their suppliers, and their workers. $150 billion to the federal government in 2018.
Figure 5: Economic Impacts of the U.S. Bioscience Industry, 2018
DIRECT IMPACT TOTAL IMPACT
Employment 9.4M
Wages &
Benefits $699B
$2.6T
Economic
Bioscience Industry Output
Employment
1.87M State &
Local Taxes $97B
Federal
Taxes $150B
Source: TEConomy Partners data, analysis of U.S. IMPLAN Input/Output Model.
Table 3: Economic Impacts of the U.S. Bioscience Industry, 2018 ($ in millions)
State/Local Federal Tax
Impact Type Employment Labor Income Value Added Output
Tax Revenue Revenue
Direct Effect 1,869,955 $228,022 $537,976 $1,147,179 $32,455 $52,387
Indirect Effect 3,496,978 $253,877 $397,365 $781,598 $27,817 $50,935
Induced Effect 3,984,387 $217,588 $381,999 $678,212 $36,331 $46,255
Total Impacts 9,351,320 $699,486 $1,317,340 $2,606,989 $96,603 $149,578
Multiplier 5.00 3.07 2.45 2.27
Source: TEConomy Partners data, analysis of U.S. IMPLAN Input/Output Model.
12THE BIOSCIENCE ECONOMY: PROPELLING LIFE-SAVING TREATMENTS, SUPPORTING STATE & LOCAL COMMUNITIES
The Role Small- and Mid-Sized Firms Play
in the U.S. Biopharmaceutical Sector and Innovation Pipeline
The most well-recognized segment of the biopharmaceutical industry are large multinational firms. These
firms are typically household names, publicly traded, and with substantial employment, R&D investments,
and revenues. Yet, a major segment of research, innovation, and economic activity is also occurring
among small and mid-sized biopharmaceutical firms that are much less recognized.8
Who are these small and mid-sized biopharmaceutical firms? One metric used by BIO and others,
small and mid-sized biopharmaceutical firms are those generating less than $1 billion in revenues.
From a federal procurement perspective, they include companies with fewer than 1,000 employees
for biopharmaceutical R&D companies, and fewer than 1,250 employees for biopharmaceutical
manufacturing firms.9
While the largest firms are indeed the most well-known and play an essential role in helping to drive
the overall biopharmaceutical ecosystem, smaller and mid-sized biopharmaceutical firms account
for a significant majority of the industry’s employment and establishments. Small and mid-sized
biopharmaceutical companies comprise 71 percent of total biopharmaceutical industry employment and
99 percent of the business establishments.10
While it is not surprising within a major industry cluster to have small and mid-sized firms comprise a
large share of business establishments and employment, what does stand out for small- and mid-sized
biopharmaceutical companies is the important role they play in advancing innovation. Often small- and mid-
sized biopharmaceutical companies are an important means for commercializing novel therapies associated
with research discoveries generated at universities, non-profit research institutes, and federal laboratories.
BIO estimates that there are nearly 6,700 therapies in the clinical stage pipeline (from Phase 1 trials through
new drug or biologics application), with more than 5,000 (76 percent) either led by small and mid-sized
emerging (primarily pre-revenue) companies, or where smaller firms are in partnered research programs
with large biopharmaceutical firms. This pipeline covers the broad spectrum of disease areas with 5 percent
or more of the activities in five areas: oncology (42 percent), neurology (12 percent), infectious (8 percent),
immunology (7 percent) and endocrine-related diseases (5 percent).
Often these smaller firms bring forward a specific research niche or focus for development. As they
continue to develop these technologies and related therapies, there comes an increased need for clinical
research-related skills and employees, which leads to significant employment growth. Some examples of
small-firm growth and expansion include:
• Alnylam Pharmaceuticals, with a cutting-edge research program in RNAi therapeutics, grew from 60
employees during its early funding rounds to a free-standing public company with 1,323 employees at
the end of 2019.
• Esperion Therapeutics, with a research program dedicated to approaches for reducing cholesterol, has
had two distinct growth periods. Initially in the early 2000s, Esperion grew to 65 employees, while at the
8 For these purposes, the biopharmaceutical industry consists of NAICS 3254 Pharmaceutical Manufacturing and NAICS 541714 R&D in
Biotechnology (formerly NAICS 541711).
9 SBA Table of Size Standards. See: https://www.sba.gov/document/support--table-size-standards
10 U.S. Bureau of Labor Statistics, Quarterly Census of Employment and Wages, Q1 Data by Size of Firm, 2018. While the data presented
in the text refers to the combined biopharmaceutical industry, the size distribution of establishments for NAICS 3254 Pharmaceutical
Manufacturing are fairly similar: establishments with 1,000 or more employees account for 1 percent of all establishments and 32 percent
of total employment.
13
13THE BIOSCIENCE ECONOMY: PROPELLING LIFE-SAVING TREATMENTS, SUPPORTING STATE & LOCAL COMMUNITIES
time being acquired by Pfizer. Operating as a separate unit within Pfizer, it became an independent
enterprise once again in 2008. Esperion has since grown to more than 190 employees by the end of 2019.
• Moderna Therapeutics, a leader in mRNA-based development, received its Series A funding with
approximately 25 employees in 2010, and has grown through significant venture and shareholder
investments to 830 employees at the end of 2019.
• Spark Therapeutics, with a leading gene therapy research program, grew from 50 employees in 2015
to 450 employees in 2019 as they were being acquired by Genentech.
• Vertex Pharmaceuticals, a leading firm in the development of Cystic Fibrosis therapies, started in 1989
and grew from nearly 70 employees at its IPO in 1991 to approximately 3,000 employees generating
$4.2 billion in revenue in 2019.
While there are inherent research risks in any biopharmaceutical research pipeline, small and mid-sized firms
have experienced their share of success. Analysis by BIO finds that over the past three years (2017-2019),
smaller firms have accounted for 60 percent or more of all FDA drug approvals each year, accounting for
nearly 100 new drugs and therapies over this period. These results provide concrete evidence that smaller
biopharmaceutical firms, though perhaps less well known as their larger colleagues, are an active and
significant component of the biopharmaceutical industry and its innovation pipeline.
Within the biopharmaceutical ecosystem, small and mid-sized companies are a critical driver of
innovation. They must often take on extensive research costs needed to bring drug and pharmaceutical
innovations to market, well before earning revenue. While these investments in research are the financial
risks borne by the biopharmaceutical industry regardless of the size of firm, the ability of small and mid-
sized companies to realize success depends upon having access to risk capital, strategic partnerships
with larger biopharmaceutical companies, and federal sources of innovation funding, such as the Small
Business Innovation Research (SBIR) grants.
Figure 6: Summarizing the Importance of Small and Mid-Sized Firms in the U.S.
Biopharmaceutical Sector and Innovation Pipeline
71% Smaller and mid-sized biopharmaceutical firms account for a significant
of Jobs majority of the industry’s establishments (99%) and employment (71%).
76% Share of therapies within the clinical stage pipeline either led by small and
medium-sized emerging (primarily pre-revenue) companies or where
of Pipeline for
Therapies these smaller firms are in partnered research programs with large firms.
60%+ Analysis by BIO finds that over the past three years (2017-2019), smaller firms
FDA Approvals have accounted for 60 percent or more of all FDA drug approvals each year.
Source: TEConomy Partners analysis of U.S. Bureau of Labor Statistics, Quarterly Census of Employment and Wages, Q1 Data
by Size of Firm, 2018; BIO analysis of clinical stage pipeline and FDA drug approvals.
14THE BIOSCIENCE ECONOMY: PROPELLING LIFE-SAVING TREATMENTS, SUPPORTING STATE & LOCAL COMMUNITIES
The Bioscience Industry in U.S.
States and Metropolitan Areas: Measuring Industry
Highlights and Key Findings Concentration and
“Specialization”
The nation’s bioscience industry has a vast geo- Employment concentration is a useful way
graphic footprint—extending to every U.S. state to gauge the relative importance of an
and region. The industry’s breadth and diversity industry to a state or regional economy.
translates into significant market and economic
State location quotients (LQs) measure
development opportunities for most states; in fact,
the degree of job concentration within
a majority of states have a “specialized” concen- the state relative to the national average.
tration of employment in at least one of the five States or regions with an LQ greater than
bioscience subsectors. 1.0 are said to have a concentration in the
sector. When the LQ is significantly above
average, 1.20 or greater, the state is said to
Highlights of State Industry Performance
have a “specialization” in the industry.
• Thirty-five states and Puerto Rico have a
specialization in at least one of the five
bioscience subsectors in 2018. These include:
{{ 19 states specialized in Agricultural
Feedstock & Industrial Biosciences
{{ 10 states and Puerto Rico specialized in
Bioscience-related Distribution
{{ 11 states and Puerto Rico specialized in
Drugs & Pharmaceuticals
{{ 13 states and Puerto Rico specialized in
Medical Devices & Equipment
{{ 11 states and Puerto Rico specialized in
Research, Testing & Medical Laboratories
• New Jersey and Puerto Rico stand out as the
only states that are specialized in four of the
five bioscience subsectors. While nine states
have a specialization in three subsectors, no
state has a specialization in all five subsectors.
• Over the 2016 to 2018 period, 41 states experi-
enced job growth in the bioscience industry.
15THE BIOSCIENCE ECONOMY: PROPELLING LIFE-SAVING TREATMENTS, SUPPORTING STATE & LOCAL COMMUNITIES
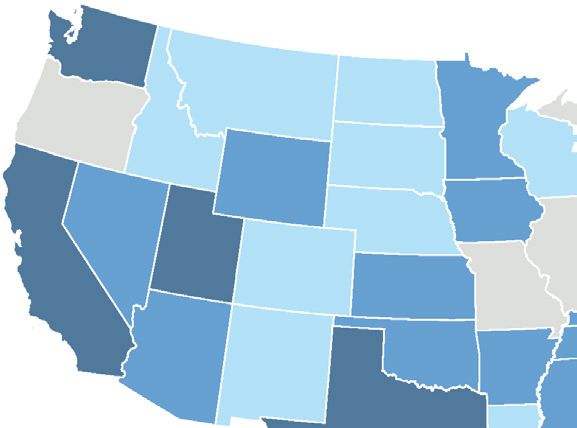
Figure 7: Change in Bioscience Industry Employment
by State, 2010-18 and 2016-18
2010-18: Economic Expansion Period
Job Gain of 5,000 or more
Job Gain of 1,000 to 4,999
Unchanged or Job Gain of 1 to 999
Job Loss of -1 to -999
Job Loss of -1,000 or more
2016-18: Latest Period
Job Gain of 5,000 or more
Job Gain of 1,000 to 4,999
Unchanged or Job Gain of 1 to 999
Job Loss of -1 to -999
Job Loss of -1,000 or more
16THE BIOSCIENCE ECONOMY: PROPELLING LIFE-SAVING TREATMENTS, SUPPORTING STATE & LOCAL COMMUNITIES
Table 4: State Specializations and Job Growth by Bioscience Subsector, 2018
Agricultural Feed- Research,
Drugs & Medical Devices & Bioscience-related
stock & Industrial Testing, & Medical
Pharmaceuticals Equipment Distribution
State Biosciences Laboratories
Specializa- Growth, Specializa- Growth, Specializa- Growth, Specializa- Growth, Specializa- Growth,
tion, 2018 2016-18 tion, 2018 2016-18 tion, 2018 2016-18 tion, 2018 2016-18 tion, 2018 2016-18
AL
AK
AZ
AR
CA
CO
CT
DE
DC
FL
GA
HI
ID
IL
IN
IA
KS
KY
LA
ME
MD
MA
MI
MN
MS
MO
MT
NE
NV
NH
17THE BIOSCIENCE ECONOMY: PROPELLING LIFE-SAVING TREATMENTS, SUPPORTING STATE & LOCAL COMMUNITIES
Agricultural Feed- Research,
Drugs & Medical Devices & Bioscience-related
stock & Industrial Testing, & Medical
Pharmaceuticals Equipment Distribution
State Biosciences Laboratories
Specializa- Growth, Specializa- Growth, Specializa- Growth, Specializa- Growth, Specializa- Growth,
tion, 2018 2016-18 tion, 2018 2016-18 tion, 2018 2016-18 tion, 2018 2016-18 tion, 2018 2016-18
NJ
NM
NY
NC
ND
OH
OK
OR
PA
PR
RI
SC
SD
TN
TX
UT
VT
VA
WA
WV
WI
WY
Note: Dots represent either a “specialized” employment concentration (LQ >= 1.20) or employment growth (> 0%).
Source: TEConomy Partners analysis of U.S. Bureau of Labor Statistics, QCEW data; enhanced file from IMPLAN.
18THE BIOSCIENCE ECONOMY: PROPELLING LIFE-SAVING TREATMENTS, SUPPORTING STATE & LOCAL COMMUNITIES
Highlights of Metropolitan Area Industry Performance
A majority of U.S. metropolitan areas also have a niche bioscience specialization. Of the nation’s 384 metropolitan
regions, 217 (57 percent) have a specialized employment concentration in at least one bioscience subsector.
Thirty metro areas have an especially diverse set of bioscience industry strengths, with specializations in
at least three of the five industry subsectors. These metros span all regions of the U.S. and reflect the broad
distribution of the industry nationally. These include (number of specializations in parentheses):
• Ames, IA (4) • Iowa City, IA (3)
• Boulder, CO (4) • Lebanon, PA (3)
• Durham-Chapel Hill, NC (4) • Logan, UT-ID (3)
• Lafayette-West Lafayette, IN (4) • Memphis, TN-MS-AR (3)
• Lincoln, NE (4) • Morgantown, WV (3)
• Madison, WI (4) • Salt Lake City, UT (3)
• Raleigh-Cary, NC (4) • San Diego-Chula Vista-Carlsbad, CA (3)
• Albany-Schenectady-Troy, NY (3) • San Francisco-Oakland-Berkeley, CA (3)
• Allentown-Bethlehem-Easton, PA-NJ (3) • San Jose-Sunnyvale-Santa Clara, CA (3)
• Bloomington, IN (3) • Santa Cruz-Watsonville, CA (3)
• Boston-Cambridge-Newton, MA-NH (3) • St. Joseph, MO-KS (3)
• Gainesville, FL (3) • Syracuse, NY (3)
• Grants Pass, OR (3) • Texarkana, TX-AR (3)
• Greensboro-High Point, NC (3) • Trenton-Princeton, NJ (3)
• Indianapolis-Carmel-Anderson, IN (3) • Worcester, MA-CT (3)
19The Innovation Ecosystem for the
Biosciences: National Highlights
and Leading States
The innovation-intensive biosciences industry University Bioscience R&D Activity:
requires a robust, supportive ecosystem in which to Rapid Recent Growth Fueling
thrive. The type of long-term growth achieved in the
nation’s bioscience sector is rooted in, and enabled
Innovation and Discovery
by, basic and applied research and development
activities; development of, and access to, a qualified University-led R&D in the biosciences plays a
and highly skilled workforce; investment capital central role in scientific discovery and innovation
allocated to innovative emerging and existing firms; by helping fuel the industry’s innovation ecosystem.
and strong and enforced legal protections of intel- Bioscience-related research activities span numer-
lectual property. Nations, regions, states, and local- ous academic disciplines and contribute to a firm
ities compete fiercely to develop, attract, and retain foundation in fundamental, basic scientific inquiry.
bioscience industry “clusters” by nurturing each of
these elements of a thriving innovation ecosystem. National academic R&D expenditures in biosci-
ence-related fields reached $47.2 billion in 2018,
While the bioscience industry has continued to following strong, consistent growth in recent years
see strong growth, its success cannot be taken (Figure 8). After stagnating for several years in the
for granted, particularly as it addresses the global early part of the decade, universities in the United
pandemic and the challenges of post-pandemic States significantly increased bioscience research
economic recovery. There will be an acute need in activity since 2015. Where expenditure growth
the near-term for federal and private investments averaged just 0.7 percent annually over the 2011-14
in R&D, as well as federal and private investment period, growth has risen to a 5.8 percent average
to enable scale-up production for therapies and pace annually since 2015.
vaccines for COVID-19.
Bioscience disciplines represent a majority of all
This section of the report takes stock of the nation’s academic research activity, and that share is
overall position and performance, as well as high- growing. The diverse bioscience-related fields cat-
lighting leading states, across several key elements egorized by the National Science Foundation (NSF)
of the U.S. ecosystem, specifically: include agricultural, biological, health, and other life
sciences in addition to biomedical engineering, and
• University Bioscience R&D Expenditures natural resources and conservation. Combined,
• NIH Funding they account for 63 percent of all U.S. university R&D
• Bioscience-related Patents expenditures today. This share has risen from 61
• Venture Capital and Angel Investments percent for much of the decade, as growth in bio-
in Bioscience Companies sciences R&D in recent years has outpaced growth
for overall science and engineering disciplines.
21You can also read