Student mobility in rural and nonrural districts in five Central Region states - ISSUES &ANSWERS
←
→
Page content transcription
If your browser does not render page correctly, please read the page content below
ISSUES               &ANSWERS          R E L 2010 – No. 089

                                  Student
 At Mid-continent Research
for Education and Learning
                                  mobility in rural
                                  and nonrural
                                  districts in
                                  five Central
                                  Region states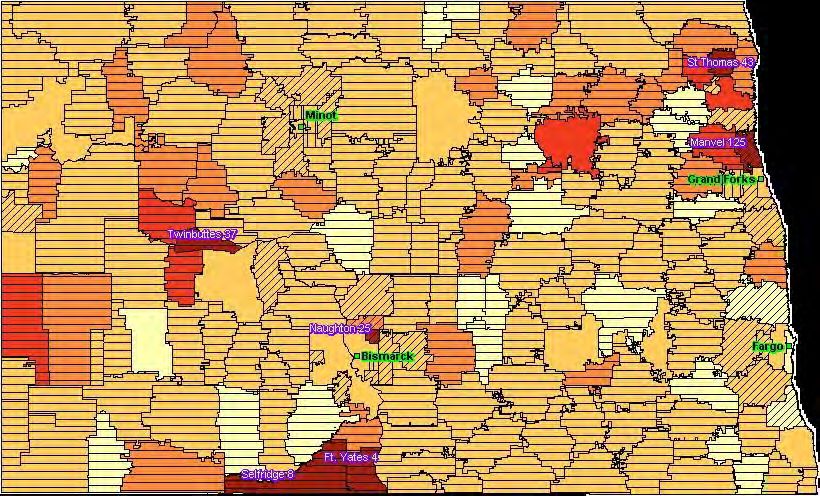
ISSUES   &   ANSWERS                                R E L 2 010 – N o . 0 8 9

                        At Mid-continent Research
                       for Education and Learning

   Student mobility in rural and nonrural
    districts in five Central Region states

                         June 2010

                        Prepared by
                       Andrea Beesley
                       Laurie Moore
                       Sarah Gopalani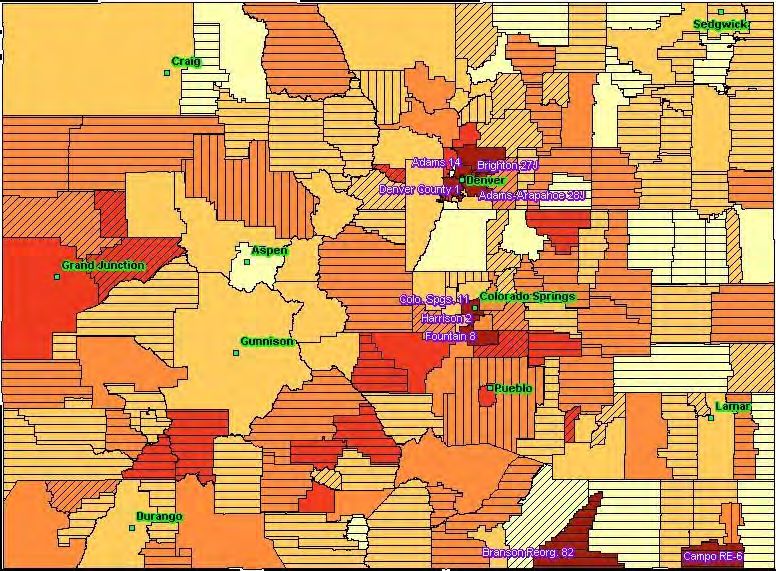
At Mid-continent Research
WA for Education and Learning ME
MT ND
VT
MN
OR NH
ID SD WI NY
MI
WY
IA PA
NE
NV OH
IL IN
UT WV
CA CO VA
KS MO KY
NC
TN
AZ OK
NM AR SC
AL GA
MS
LA
TX
AK
FL
Issues & Answers is an ongoing series of reports from short-term Fast Response Projects conducted by the regional educa
tional laboratories on current education issues of importance at local, state, and regional levels. Fast Response Project topics
change to reflect new issues, as identified through lab outreach and requests for assistance from policymakers and educa
tors at state and local levels and from communities, businesses, parents, families, and youth. All Issues & Answers reports
meet Institute of Education Sciences standards for scientifically valid research.
June 2010
This report was prepared for the Institute of Education Sciences (IES) under Contract ED-06-CO-0023 by Regional Educa
tional Laboratory Central administered by Mid-continent Research for Education and Learning. The content of the publica
tion does not necessarily reflect the views or policies of IES or the U.S. Department of Education nor does mention of trade
names, commercial products, or organizations imply endorsement by the U.S. Government.
This report is in the public domain. While permission to reprint this publication is not necessary, it should be cited as:
Beesley, A., Moore, L., and Gopalani, S. (2010). Student mobility in rural and nonrural districts in five Central Region states
(Issues & Answers Report, REL 2010–No. 089). Washington, DC: U.S. Department of Education, Institute of Education
Sciences, National Center for Education Evaluation and Regional Assistance, Regional Educational Laboratory Central.
Retrieved from http://ies.ed.gov/ncee/edlabs.
This report is available on the regional educational laboratory web site at http://ies.ed.gov/ncee/edlabs.
Summary REL 2010–No. 089
Student mobility in rural and nonrural
districts in five Central Region states
This report describes the extent and In particular, the study found that
distribution of student mobility in five
Central Region states. The study, which • Districts with extremely high student
calculated student mobility percentages mobility are often rural, have higher than
in each state and compared percentages state average shares of students eligible for
by locale (city, suburb, town, and rural free or reduced-price lunch, and are on or
locale, and degree of rurality) within each near American Indian reservations.
state, found no consistent patterns across
locales. • By locale categories only in Wyoming did
rural locales have higher student mobility
Research suggests that highly mobile students than did city and town locales. In North
(students who enter and leave school other Dakota mobility percentages were higher
than at the beginning or end of the school in both towns and rural areas than in cit
year) are less successful academically, drop ies or suburbs.
out of school at higher rates, and require
more frequent disciplinary action. This study • Comparisons in each state among the
calculated student mobility percentages in five three rural locale codes did not show a
Central Region states and compared mobil consistent pattern of mobility levels.
ity by locale (city, suburb, town, and rural
locale, and three rural subareas). It found no Because of limitations of the data, this study
consistent patterns. The report also describes does not describe where students go when they
districts in each state with extremely high change schools, explain the causes of high
student mobility, defined as greater than 2 student mobility, or describe the effects of
standard deviations above the state mean. mobility on students, schools, and districts. In
Student mobility data are displayed in state addition, because each state calculated student
maps based on each state’s formula for calcu mobility differently, mobility percentages can
lating the student mobility percentage. Tables not be compared across states.
show the level of student mobility by locale
from city to rural areas and by degree of However, overall, this information conveys
rurality (fringe of city and distant and remote the degree and distribution of transiency to
rural areas). policymakers, including state legislators. Thus,
state agency staff and policymakers can use
the information to consider outreach efforts
to areas identified as having extremely high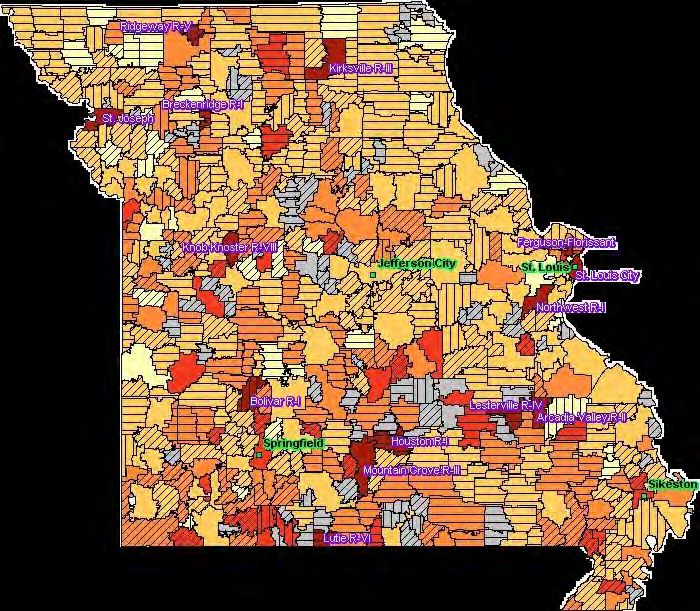
ii Summary
mobility. Further, research could help state be higher than in urban areas. In follow-up
and local education agencies find solutions conversations, the seven chief state school of
and strategies to mitigate some of the nega ficers in the Central Region (Colorado, Kansas,
tive effects of student transience. The study Missouri, Nebraska, North Dakota, South
also suggests a direction for further research Dakota, and Wyoming) expressed interest in
to understand mobility among groups—for such a study and requested that the informa
example, among American Indian students, tion be presented in a visual format that would
given the extremely high student mobility on quickly convey the extent of rural mobility to
some reservations. educators and policymakers. They noted that
maps of mobility would provide a helpful at-
The study responds to a request by partici a-glance overview of where mobility is con
pants at a meeting of Central Region rural centrated and could help in allocating funds
principals and superintendents for help in intended for districts and schools with highly
understanding the extent of student mobil mobile student populations.
ity in their schools and districts, especially in
rural areas, where they believed mobility to June 2010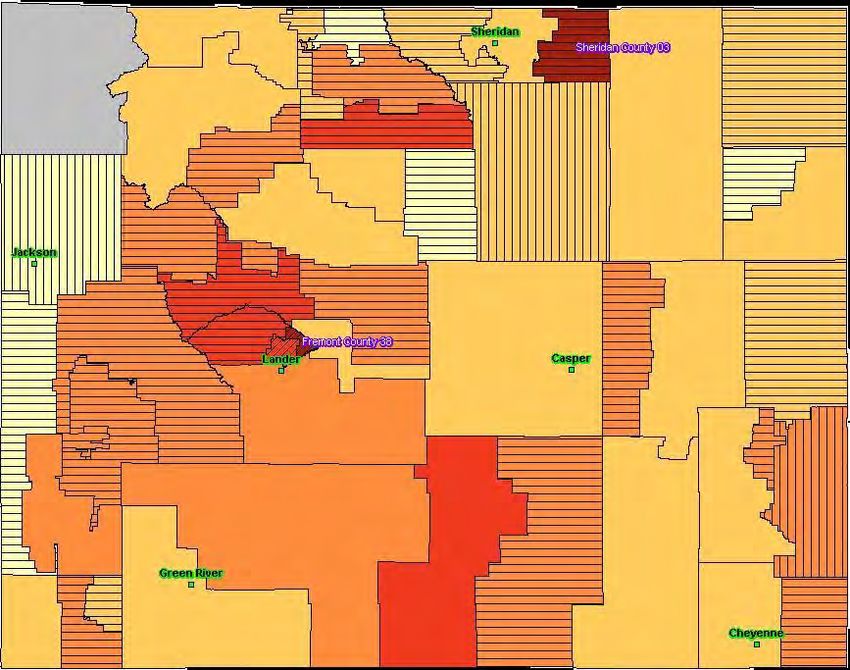
Table of conTenTs           iii

Table of conTenTs

Why this study?     1
  What the research shows      1
  Regional importance of data on student mobility          3
  Research question     3
What are each state’s district student mobility percentages, and where is mobility most prevalent?            4
  Colorado       6
  Missouri       8
  Nebraska       11
  North Dakota         14
  Wyoming         16
Limitations         19
Appendix A        Data collection and analysis      20
Appendix B        Mobility percentages by district for the five Central Region states          22
Appendix C        National Center for Education Statistics locale codes and definitions             52
Notes        53
References         54
Boxes
1    Key definitions         2
2    Data collection and analysis        4
Maps
1    Colorado public school student mobility percentages, 2006/07        7
2    Missouri grade 9–12 public school student mobility percentages, 2007/08         10
3    Nebraska public school student mobility percentages, 2007/08        13
4    North Dakota public school student mobility percentages, 2007/08          15
5    Wyoming public school student mobility percentages, 2007/08          17
Tables
1    District student mobility percentages in Colorado by locale category, 2006/07         6
2    Rural district student mobility percentages in Colorado by locale code, 2006/07           6
3    Mobility and poverty percentages in extremely high student mobility districts in Colorado, 2006/07           8
4    District student mobility percentages in Missouri by locale category, 2007/08         9
5    Rural district student mobility percentages in Missouri by locale code, 2007/08           9

iv      Table of conTenTS

6    Mobility and poverty percentages in extremely high student mobility districts in Missouri, 2007/08       11
7    District student mobility percentages in Nebraska by locale category, 2007/08        12
8    Rural district student mobility percentages in Nebraska by locale code, 2007/08           12
9    Mobility and poverty percentages in extremely high student mobility districts in Nebraska, 2007/08       12
10   District student mobility percentages in North Dakota by locale category, 2007/08          14
11   Rural district student mobility percentages in North Dakota by locale code, 2007/08            14
12   Mobility and poverty percentages in extremely high student mobility districts in North Dakota, 2007/08    16
13   District student mobility percentages in Wyoming by locale category, 2007/08          18
14   Rural district student mobility percentages in Wyoming by locale code, 2007/08            18
15   Mobility and poverty percentages in extremely high student mobility districts in Wyoming, 2007/08        18
B1 Colorado school district mobility percentages and locale codes, 2006/07         22
B2 Missouri school district mobility percentages and locale codes, 2007/08         27
B3 Nebraska school district mobility percentages and locale codes, 2007/08           39
B4 North Dakota school district mobility percentages and locale codes, 2007/08            46
B5 Wyoming school district mobility percentages and locale codes, 2007/08            50
C1 National Center for Education Statistics locale codes and definitions      52

Why ThiS STudy? 1
Why ThiS STudy?
This report
Educators are concerned about high student
describes the mobility because it is associated with negative
outcomes for students and schools. While research
extent and on student mobility has not established direct
causal links between mobility and negative effects
distribution of on students and schools, the literature does find
an association between high student mobility and
student mobility lower student achievement and describes difficul
ties in coping with mobility in small rural schools.
in five Central This literature does not specifically address
student mobility across the Central Region, the
Region states. focus of a request by rural principals and super
intendents for information on student mobility
The study, in the region. While the literature supports their
reasons for concern, it does not identify areas of
which calculated high mobility in the region. This study addresses
that gap by describing levels of student mobility in
student mobility Central Region school districts.
percentages What the research shows
in each state The literature on student mobility (student entry
and exit during the school year; see box 1 for defi
and compared nitions) documents an association between high
student mobility and weaker student performance
percentages and finds that small rural schools have more dif
ficulty coping with mobility. For example, studies
by locale (city, of student-level data in Louisiana (Engec 2006),
Illinois (Beck and Shoffstall 2005), the Pacific
suburb, town, Northwest (Gruman et al. 2008), rural Pennsylva
nia (Lesisko and Wright 2009), and North Caro
and rural locale, lina (Xu, Hannaway, and D’Souza 2009) reported
that students scored lower on assessments as
and degree of mobility increased. In addition, higher rates of
student mobility and discipline problems were
rurality) within correlated with higher rates of school crime (Chen
2008), higher suspension rates (Engec 2006), and
each state, found lower student classroom participation (Gruman et
al. 2008).
no consistent
A meta-analysis of studies of school mobility and
patterns across achievement focusing on the effects of mobil
ity on reading and mathematics achievement in
locales. elementary grades found that mobile students had
a three- to four-month performance disadvantage
2 STudenT mobiliTy in rural and nonrural diSTricTS in five cenTral region STaTeS
box 1 the date of measurement influences the student would be counted only
Key definitions student mobility percentages. once, despite the multiple entrances
and exits.
Student mobility. Student school School- and district-level mobility.
entrances and exits or, in some states, Some states count student mobility Extremely high mobility. “Extremely
exits only that do not occur at the at the school level, and some at the high mobility” is defined as greater
beginning or end of the school year. district level. School-level mobility is than 2 standard deviations above the
based on movements into and out of mean for each state. This definition
Student mobility percentage. While schools (including schools within a takes into account differences in state
the definition of student mobility is district) rather than into and out of definitions of mobility since the cut
the same across states, each state has districts. District-level mobility, based off designating extremely high mobil
its own formula for calculating the on movements into and out of dis ity is relative to each state’s data.
percentage of student mobility, which tricts, does not consider students who
drives the data each state collects. move into and out of schools within Locale codes. The codes, based on a
Because states collect different data, the district. In small districts in rural classification system developed by the
a common student mobility formula areas with only one K–6 school and National Center for Education Statis
cannot be applied across states. That one 7–12 school, for example, mobil tics in the 1980s and most recently
means that the results reported here ity is the same at school and district updated in 2006, designate a school’s
must be understood individually for levels. In large districts with multiple locale ranging from large city to rural
each state. An underlying common schools serving each grade level, (U.S. Department of Education 2009).
ality is a count of student entrances mobility percentages that include only The codes are based on population
and exits that do not occur during movement into and out of the district size and location relative to an urban
regularly scheduled times at the would not capture the full scale of ized area according to a geographic
beginning or end of the school year, student mobility. Two states (Colorado database maintained by the Census
divided by district’s student count. and Nebraska) count mobility at the Bureau. The 12 locale codes are ag
Because this creates a ratio of quanti school level, two states (Missouri and gregated into four categories: city,
ties of the same kind (counts), known Wyoming) at the district level, and one suburb, town, and rural. The three
as a dimensionless quantity, the ratio state (North Dakota) at both levels. locale codes within the rural category
can be expressed as a percentage are rural fringe (41; Census-defined
(Bureau international des poids et Duplication. Duplication refers to area that is 5 miles or less from an
mesures 2006). counting each entrance and each exit urbanized area and 2.5 miles or less
of a student from a school or district from an urban cluster); rural, distant
District student count. The total in a single school year when calculat (42; Census-defined area that is
number of students in a district. In ing mobility. For example, a student 5–25 miles from an urbanized area
Colorado, Missouri, Nebraska, and who leaves a school in October, and more than 2.5–10 miles from
North Dakota the count is the total returns in December, and leaves an urban cluster); and rural, remote
number of students in the district at a again in March would be counted (43; Census-defined area that is more
specific date in the fall. In Wyoming three times, because there were three than 25 miles from an urbanized
the count is determined in March. entrances and exits in the course of area and more than 10 miles from an
There is no evidence to suggest that the school year. Without duplication, urban cluster).
in achievement relative to nonmobile students concluded that mobile students were approxi
(Mehana and Reynolds 2004). Using student-level mately twice as likely as other students to drop out
data from the National Longitudinal Study of Ado of school and that all students attending schools
lescent Health to examine student mobility and with high student mobility had increased risk of
school dropout, South, Haynie, and Bose (2007) dropout.Why ThiS STudy? 3
Another study found that mobility was a sig data analysis to be a if student mobility is a
nificant predictor of school improvement status. state-level need. Regional predictor of adequate
Schools with high student mobility were twice as Educational Laboratory yearly progress status,
likely as schools with lower student mobility to be Central obtained data states need to know
assigned to one of the two lowest school improve from five of the seven where student mobility is
ment status levels related to making adequate Central Region states highest so that they can
yearly progress under the No Child Left Behind to conduct this study. consider strategies to
Act of 2001 (Rhodes 2005). State education agency mitigate any potentially
staff requested that the negative effects
Because rural schools tend to be smaller than oth information be displayed
ers, a small number of mobile students can have a in a visual format that
greater influence on a rural school’s overall perfor would quickly convey the extent of rural mobility
mance than they might have on larger schools (Ver to educators and policymakers. They noted that
mont Department of Education 1998). In studies of maps would provide helpful at-a-glance visuals of
rural New York and Pennsylvania using district- and districts where mobility is concentrated and could
student-level data along with surveys and interviews, help staff allocate funds intended for districts and
Schafft (2005, 2006) and Schafft and Killeen (2007, schools with highly mobile student populations.
2008) reported that rural schools generally have
smaller administrative staffs and faculties and fewer Because student mobility can disrupt instruction
financial resources, making it difficult for them and has been linked to negative consequences for
to meet the needs of highly mobile students. For students, both state and local administrators indi
example, they have difficulty transferring records, cated a need to understand the extent and distribu
particularly when students transfer to a school in an tion of student mobility. This need is particularly
other district. Delayed record transfers can disrupt pressing in light of the No Child Left Behind Act
special education and other student services. requirements on student proficiency rates and
schools’ adequate yearly progress. If, as Rhodes
Other research has indicated that high student (2005) reported, student mobility is a predictor
mobility makes it difficult for small rural dis of adequate yearly progress status, states need to
tricts to project staffing needs and to reallocate know where student mobility is highest so that they
resources to accommodate changes in the number can consider strategies to mitigate any potentially
of students in a classroom or with special needs negative effects. School and district personnel also
(Thorson and Maxwell 2002). Schafft and col wanted information on the characteristics of dis
leagues (Schafft 2005, 2006; Schafft and Killeen tricts with high mobility; the knowledge they have
2007, 2008; Schafft, Prins, and Movit 2008) em is anecdotal and often gained through informal
phasized that despite district staff concerns, data conversations with colleagues. While mobility data
on student mobility are not readily available. are publicly available on the Internet for three of the
five states requesting the study, no reports could be
Regional importance of data on student mobility found from departments of education about student
mobility in these or the other two states or any
This study responds to requests from rural other analyses or depictions of these data.
principals and superintendents across the Central
Region for help in understanding the extent of Research question
student mobility in their schools and districts.
Discussions with the chief state school officers in The research question guiding this study is:
the Central Region states (Colorado, Kansas, Mis
souri, Nebraska, North Dakota, South Dakota, and • What are district student mobility percent
Wyoming) showed analysis of student mobility ages in the Central Region states, based on4 STudenT mobiliTy in rural and nonrural diSTricTS in five cenTral region STaTeS
each state’s definition of mobility, and in policymakers and educators, the data on student
which locales is mobility most prevalent? mobility percentages by district are presented as
maps.1 Tables of descriptive statistics by locale
Using tables and maps, this study provides infor categories, and by the three rural locale codes, are
mation on the degree of student mobility in rural also provided.
and nonrural districts in five of the seven Central
Region states (Colorado, Missouri, Nebraska, Descriptive information is presented for districts
North Dakota, and Wyoming). with extremely high mobility levels, where “ex
tremely high mobility” is defined as mobility per
centages greater than 2 standard deviations above
WhaT aRe eaCh STaTe’S diSTRiCT STudenT the mean for each state. Because the cutoff for the
mobiliTy peRCenTageS, and WheRe extremely high mobility designation is relative to
iS mobiliTy moST pRevalenT? each state’s data, this definition takes into account
differences in mobility definitions across states.
Data on district student mobility from each of The descriptive information includes percentage
the five states examined were used for this study of students eligible for free or reduced-price lunch
(see box 2 and appendix A on data collection and (the literature shows poverty to be associated
analysis) based on each state’s student mobil with student mobility) and other features of the
ity formula. To provide an easy reference for community.2
box 2 of instances of student mobility available on the department’s web
Data collection and analysis (unscheduled entrances and exits site. However, the department
from each school with duplication) provided a file that included all
Data collection. Data on student per school, along with a total student districts in one document and that
mobility, as defined in each state, count per district on its web site. Mo contained calculated student mobility
were obtained from all districts in the bility percentages at the school level percentage.
five Central Region states represented were calculated for each district by
in this study (Colorado, Missouri, summing across the district’s schools Nebraska’s 2007/08 calculated
Nebraska, North Dakota, and Wyo and dividing by the total student student mobility percentages were
ming), so the data are population data count for the district.1 Online-only available from the Nebraska Depart
and have no sampling error. These schools were excluded (for both ment of Education (2009) data web
data differ on several parameters, student mobility and total student site. The mobility percentage included
including the school year, the grade counts by district), as they draw students who enter or leave schools
levels for which mobility data were students from across the state and between the last Friday in September
collected, the level (school or district) do not reflect local student mobil (the date the total student count is
at which mobility was measured, and ity. Colorado’s definition of mobility taken) and the last day of school.
the existence of student duplication counts students who are out of school
in the data sets (see table). Because no for more than 10 consecutive days North Dakota provided a spreadsheet
two states rely on the same set of pa as an exit. Students are not recorded with 2007/08 counts of students who
rameters, student mobility cannot be as mobile in Colorado until after transferred out of districts or out of
compared across states. Some states October 1. schools within districts (to another
provided mobility percentages, and school in the same district) and a
others provided the underlying data. Missouri Department of Elementary total enrollment count but not counts
and Secondary Education (2009) data of students who transferred into each
The Colorado Department of Educa on grade 9–12 mobility for individual district or into schools from another
tion (2009) provided 2006/07 counts districts for 2007/08 are publicly school within the district. Transfers
(conTinued)WhaT are each STaTe’S diSTricT STudenT mobiliTy percenTageS, and Where iS mobiliTy moST prevalenT? 5
box 2 (conTinued)
Data collection and analysis
Characteristics of the five states’ student mobility data
grade existence of date of district
State School year levels level reported duplication student count
colorado 2006/07 K–12 School yes 9/29/2006
missouri 2007/08 9–12 district yes 9/26/2007
nebraska 2007/08 K–12 School no 9/28/2007
north dakota 2007/08 K–12 district and school (exits only) no 9/10/2007
Wyoming 2007/08 K–12 district no 3/12/2008
Source: Authors’ analysis based on data from state departments of education; see appendix A for details.
out of each district and out of schools formula (Missouri provided calcu low mobility (more than 1 standard de
within each district were summed lated percentages; see appendix B). viation below the mean), low mobility
to establish total exits for the district (1 standard deviation below the mean
and then divided by the district stu The five state master data files were to the mean), high mobility (mean to
dent count to get a mobility percent merged with files containing the geo 1 standard deviation above the mean),
age based on exits only. Mobility per graphic information system (GIS) co very high mobility (1–2 standard devi
centages are smaller than they would ordinates for each state’s public school ations above the mean), and extremely
be had student entrances also been districts, and the data were used to cre high mobility (more than 2 standard
included in the state definition, since ate maps for each state on the extent of deviations above the mean).
it is likely that some students transfer district student mobility. Because there
in while others are transferring out. are too many districts to label legibly, Because of the variations in how each
However, the maps accurately depict major cities or towns are identified state defined the student mobility
the intensity of mobility based only and color coding is used to distinguish percentage, no comparisons can be
on exits. district student mobility levels and the made across states without taking
three types of rural districts. these differences into account.
Wyoming provided a spreadsheet
with 2007/08 mobility percentages To compare rural and nonrural dis Notes
calculated by district (without dupli tricts, population means and standard 1. The Colorado Department of Education
cation). In districts with more than deviations of student mobility percent (2009) web site provided a district total
for mobility instances and a mobility per
one school per grade level these cal ages were calculated for each state by
centage. However, the district total given
culations would not capture mobility locale category (see appendix C). Then, was not the sum of the mobility instances
at the school level if students moved means, medians, and standard devia but rather a sum based on district-level
between schools within the district. tions were calculated for each locale mobility only. Following consultation
category,2 and means and standard with Colorado Department of Education
Data processing and analysis. A deviations were calculated for the three staff, mobility instances were summed to
reflect mobility into and out of schools,
master data file was created for each rural locale codes (41, 42, and 43) to
since the necessary data were available.
state listing school districts and show how student mobility varied by 2. Because the means presented are the
2005/06 locale codes from the Com the remoteness of rural districts. true population means, and any differ
mon Core of Data (U.S. Department ences between means are true popula
of Education 2009; see appendix A). Levels of district student mobility in tion mean differences, tests of differ
The master files also included student each state were determined by the ences between means used to estimate
population means based on sample
mobility percentages in each district distance of each district’s mobility
means, such as t-tests and analysis of
calculated according to each state’s percentage from the state mean: very variance, do not apply.6 STudenT mobiliTy in rural and nonrural diSTricTS in five cenTral region STaTeS
The study found that districts in each state with Map 1 shows student mobility percentages for
extremely high student mobility were often in Colorado school districts in 2006/07. While most
rural areas, had higher than state average shares of of Colorado’s districts are rural (n = 116), the high-
students eligible for free or reduced-price lunch, and est levels of student mobility were reported for city
were on or near American Indian reservations. Only districts (n = 13), followed by suburban districts
in Wyoming did rural locales have higher student (n = 15; table 1).
mobility than city and town locales. In North Da-
kota both town and rural percentages were higher Most of Colorado’s rural districts (85 of 116) are
than city or suburb percentages. Comparisons in in locale code 43, the most remote rural locale
each state among the three rural locale codes did (table 2). Student mobility was similar across the
not show a consistent pattern of mobility levels. three rural locale codes.
Colorado In 2006/07 nine Colorado districts had mobility
higher than 49.3 percent, 2 standard deviations
Because Colorado’s mobility formula is based on above the state mean of 30.7 percent (table 3). Four
school-level data and records duplication (students are adjacent districts in the Denver area, while
who move several times in one year), the mobil- three are adjacent districts in the Colorado Springs
ity percentages completely capture mobility at the area. The remaining two extremely high mobility
school level. districts are in rural southeastern Colorado. Seven
of the nine districts had percentages of students
Colorado’s mobility formula: eligible for free or reduced-price lunch higher than
the state mean of 34.0 percent.
Sum of student mobility instances
for each school building • Four extremely high student mobility districts
District total student count —Denver County 1, Adams-Arapahoe 28J
Table 1
district student mobility percentages in Colorado by locale category, 2006/07
city Suburb Town rural
State (all codes) (codes 11,12,13) (codes 21,22,23) (codes 31,32,33) (codes 41,42,43)
population n = 179 n = 13 n = 15 n = 35 n = 116
mean 30.6 39.9 35.2 29.1 29.6
median 29.0 39.2 36.2 28.3 29.0
Standard deviation 9.2 11.5 10.7 7.2 8.6
Note: Because data are population rather than sample data, the standard error of the mean is 0, and statistical inferences are not made.
Source: Authors’ analysis based on data from Colorado Department of Education (2009); see box 2 and appendix A for details.
Table 2
Rural district student mobility percentages in Colorado by locale code, 2006/07
fringe (code 41) distant (code 42) remote (code 43)
population n=6 n = 25 n = 85
mean 31.2 31.3 29.0
median 31.9 29.0 28.7
Standard deviation 4.8 8.0 8.9
Note: Because data are population rather than sample data, the standard error of the mean is 0, and statistical inferences are not made.
Source: Authors’ analysis based on data from Colorado Department of Education (2009); see box 2 and appendix A for details.WhaT are each STaTe’S diSTricT STudenT mobiliTy percenTageS, and Where iS mobiliTy moST prevalenT? 7
map 1
Colorado public school student mobility percentages, 2006/07
mobility percentage locale code
very low8 STudenT mobiliTy in rural and nonrural diSTricTS in five cenTral region STaTeS
Table 3
mobility and poverty percentages in extremely high student mobility districts in Colorado, 2006/07
Students eligible for free
district locale code mobility percentage or reduced-price luncha
adams-arapahoe 28J 11 51.9 54.1
adams county 14 21 49.7 74.0
branson reorganized 82 43 55.6 32.5b
brighton 27J 31 50.2 28.5
campo re-6 43 56.3 59.4
colorado Springs 11 11 51.7 42.5
denver county 1 11 59.5 65.3
fountain 8 21 50.5 35.9
harrison 2 11 52.3 60.2
colorado na 30.7 34.0
na is not applicable.
a. Numbers in bold are higher than the state mean.
b. Excludes students in the online school
Source: Authors’ analysis based on data from Colorado Department of Education (2009); see box 2 and appendix A for details.
(Aurora Public Schools), Brighton 27J, and of southeastern Colorado, on the border with
Adams County 14—are adjacent districts the Oklahoma Panhandle. It is located in the
in the Denver metropolitan area, the largest Comanche National Grassland.
metropolitan area in Colorado and home to
Buckley Air Force Base. Four other adjacent • Branson Reorganized 82, in southeastern
districts had very high mobility percentages Colorado, is three districts to the west of
(close to the 2 standard deviation cutoff), Campo RE-6 on the New Mexico border.
ranging from 43.2 percent to 46.7 percent: Located in a ranching area, it had 63 students
Englewood 1, Mapleton 1, Sheridan 2, and in its two schools in 2006/07. The district’s
Westminster 50. Together these eight con online school, enrolling 1,229 students in
tiguous districts form a cluster of very to 2006/07, was not included in the student
extremely high student mobility in north- mobility analysis.
central Colorado.
Missouri
• Colorado Springs 11, Harrison 2, and Fountain
8 are adjacent districts in the Colorado Springs Missouri compiled data for mobility into and out
area, the second-largest metropolitan area in of districts with student duplication, but for grades
Colorado, and near Fort Carson Army base, 9–12 only. Data on mobility reported at the district
Peterson Air Force Base, and the Air Force rather than school level tend to underrepresent
Academy. The adjoining Hanover 28, a rural mobility into and out of schools within districts.
distant (locale 42) district, had very high stu
dent mobility of 48.1 percent, close to the 49.3 Missouri’s mobility formula:
percent cutoff for extremely high mobility.
Number of unscheduled student district entrances
• Campo RE-6 is a small-enrollment district + number of unscheduled student district exits
(64 students in 2006/07) in a ranching area District total student countTable 4
district student mobility percentages in missouri by locale category, 2007/08
city Suburb Town rural
State (all codes) (codes 11,12,13) (codes 21,22,23) (codes 31,32,33) (codes 41,42,43)
population n = 443 n = 12 n = 41 n = 89 n = 301
mean 24.9 42.1 22.2 27.8 23.8
median 22.1 39.9 20.0 22.9 21.6
Standard deviation 15.7 21.3 13.6 20.2 13.5
Note: All data are for grades 9–12. Because data are population rather than sample data, the standard error of the mean is 0, and statistical inferences are not
made.
Source: Authors’ analysis based on data provided by the Missouri Department of Elementary and Secondary Education; see box 2 and appendix A for details.
Table 5
Rural district student mobility percentages in missouri by locale code, 2007/08
fringe (code 41) distant (code 42) remote (code 43)
population n = 29 n = 132 n = 140
mean 22.8 23.7 24.1
median 19.9 21.7 22.1
Standard deviation 15.4 11.5 14.7
Note: Because data are population rather than sample data, the standard error of the mean is 0, and statistical inferences are not made.
Source: Authors’ analysis based on data provided by the Missouri Department of Elementary and Secondary Education; see box 2 and appendix A for details.
Map 2 shows student mobility percentages for • Northwest R-1 is 25 miles southwest of
grades 9–12 in Missouri school districts in St. Louis, within the greater metropolitan
2007/08. Most of Missouri’s districts are rural area.
(n = 301), but city districts (n = 12) had higher
mean student mobility (42.1 percent) than did • Arcadia Valley R-II and Lesterville R-IV are
rural, town, and suburban districts (table 4). in the southeast Missouri Ozarks, in a tourist
area near Mark Twain National Forest and
There was little difference in student mobility other parks and natural areas.
among the three rural locale codes in Missouri
(table 5). • Further west are Bolivar R-I, Mountain Grove
R-III, Lutie R-VI, and Houston R-I, all 30–90
In 2007/08, 14 Missouri districts had student miles from Springfield, the third largest city
mobility percentages higher than 56.3 percent, 2 in the state. Bolivar R-I, the closest to Spring-
standard deviations above the state mean of 24.9 field, is in a community with a university.
percent (table 6). Of these, 11 reported higher eligi- Lutie R-VI is a small-enrollment district with
bility for free or reduced-price lunch than the state 201 students in 2007/08; it is near a large
average (39.5 percent). lake and a national forest. Houston R-1 is the
farthest from Springfield.
• St. Louis City, Wellston, and Ferguson-Floris-
sant R-II districts are located in and around • St. Joseph, 55 miles north of Kansas City
St. Louis, the largest metropolitan area in the on the Kansas border, contains a state
state. university.10 STudenT mobiliTy in rural and nonrural diSTricTS in five cenTral region STaTeS
map 2
missouri grade 9–12 public school student mobility percentages, 2007/08
mobility percentage locale code
very lowWhaT are each STaTe’S diSTricT STudenT mobiliTy percenTageS, and Where iS mobiliTy moST prevalenT? 11
Table 6
mobility and poverty percentages in extremely high student mobility districts in missouri, 2007/08
Students eligible for free
district locale code mobility percentage or reduced-price luncha
arcadia valley r-ii 41 67.1 59.6
bolivar r-i 41 61.1 49.7
breckenridge r-1 43 60.0 49.5
ferguson-florissant r-ii 21 58.8 36.7
houston r-i 43 58.9 54.6
Kirksville r-iii 33 60.0 41.4
Knob noster r-viii 33 151.2 34.4
lutie r-vi 43 65.2 66.1
lesterville r-iv 43 128.1 68.3
mountain grove r-iii 33 63.5 64.1
ridgeway r-v 42 57.7 49.6
northwest r-i 31 118.1 32.3
St. Joseph 13 59.4 49.1
St. louis city 11 97.5 80.4
missouri na 24.9 39.5
na is not applicable.
a. Numbers in bold are higher than the state mean.
Source: Authors’ analysis based on data provided by the Missouri Department of Elementary and Secondary Education; see box 2 and appendix A for details.
• Breckenridge R-1, 60 miles east of St. Jo Nebraska’s mobility formula:
seph, was a small district of 105 students in
2007/08. Number of unscheduled student school entrances
+ number of unscheduled student school exits
• Knob Noster R-VIII is approximately 60 miles District total student count
east of Kansas City, near Whiteman Air Force
Base and a large state park. Map 3 shows student mobility percentages for
Nebraska school districts in 2007/08. Most of
• Ridgeway R-V, in north-central Missouri Nebraska’s districts are rural (206 of 254; table 7).
near the Iowa border, enrolled 87 students in The overall rural mobility percentage is similar to
2007/08. the percentages of the other locale categories in the
state, although all but one of the extremely high
• Kirksville R-III, the largest town in northeast mobility districts (2 standard deviations above the
Missouri, is near a lake and a state park and state mean) are rural.
has a medical school and a state college.
Mobility percentages differed little among the
Nebraska three rural locale codes (table 8).
Nebraska’s mobility data included mobility into In 2007/08 seven districts, some of them con
and out of schools. The data include students who tiguous, had mobility higher than 21.0 percent
moved between schools within districts, but with (the state average was 9.4 percent), the cutoff for
out duplication of students. extremely high mobility (table 9). Six of them12 STudenT mobiliTy in rural and nonrural diSTricTS in five cenTral region STaTeS
Table 7
district student mobility percentages in nebraska by locale category, 2007/08
city Suburb Town rural
State (all codes) (codes 11,12,13) (codes 21,22,23) (codes 31,32,33) (codes 41,42,43)
population n = 254 n=5 n=4 n = 39 n = 206
mean 9.4 12.5 12.3 11.0 9.0
median 8.6 14.0 12.4 10.5 8.3
Standard deviation 5.8 5.1 6.2 4.2 6.0
Note: Because data are population rather than sample data, the standard error of the mean is 0, and statistical inferences are not made.
Source: Authors’ analysis based on data from Nebraska Department of Education (2009); see box 2 and appendix A for details.
Table 8
Rural district student mobility percentages in nebraska by locale code, 2007/08
fringe (code 41) distant (code 42) remote (code 43)
population n=8 n = 40 n = 158
mean 10.0 10.8 8.5
median 10.4 8.2 8.4
Standard deviation 5.4 10.3 4.1
Note: Because data are population rather than sample data, the standard error of the mean is 0, and statistical inferences are not made.
Source: Authors’ analysis based on data from Nebraska Department of Education (2009); see box 2 and appendix A for details.
Table 9
mobility and poverty percentages in extremely high student mobility districts in nebraska, 2007/08
Students eligible for free
district locale code mobility percentage or reduced-price luncha
cedar bluffs public Schools 42 21.8 39.7
cozad city Schools 33 24.5 35.9
gordon-rushville public Schools 43 21.6 51.0
Santee community Schools 43 35.0 82.5
umonhon nation public Schools 42 23.4 80.9
Walthill public Schools 42 63.9 62.6
Winnebago public Schools 42 33.5 76.1
nebraska na 9.4 37.4
na is not applicable.
a. Numbers in bold are higher than the state mean.
Source: Authors’ analysis based on data provided by the Missouri Department of Elementary and Secondary Education; see box 2 and appendix A for details.
reported higher eligibility for free or reduced-price Winnebago Indian Reservation, while Walt
lunch than the state average of 37.4 percent. Hill and the Umonhon Nation Public Schools
are on the Omaha Indian Reservation.3 Santee
• Winnebago Public Schools, Walthill Public Community Schools, another extremely high
Schools, and Umonhon Nation Public Schools mobility district, is located on the Santee
are contiguous districts on Nebraska’s eastern Sioux Nation Reservation in the northeast
border. The Winnebago district is on the part of the state.WhaT are each STaTe’S diSTricT STudenT mobiliTy percenTageS, and Where iS mobiliTy moST prevalenT? 13
map 3
nebraska public school student mobility percentages, 2007/08
mobility percentage locale code
very low14 STudenT mobiliTy in rural and nonrural diSTricTS in five cenTral region STaTeS
• Further west is Gordon-Rushville Public the relative intensity of mobility for each district.
Schools, a very large district (2,300 square Some districts reported no mobility, according to
miles) that borders South Dakota’s Pine Ridge the state’s definition, in 2007/08.
Reservation. The Cozad City Schools district,
in the south central part of the state, is a local North Dakota’s mobility formula:
manufacturing hub; it is the only nonrural
extremely high mobility district in Nebraska. Number of unscheduled student district exits +
number of unscheduled student school exits
• Finally, Cedar Bluffs Public Schools is an ex- District total student count
tremely high mobility rural district approxi-
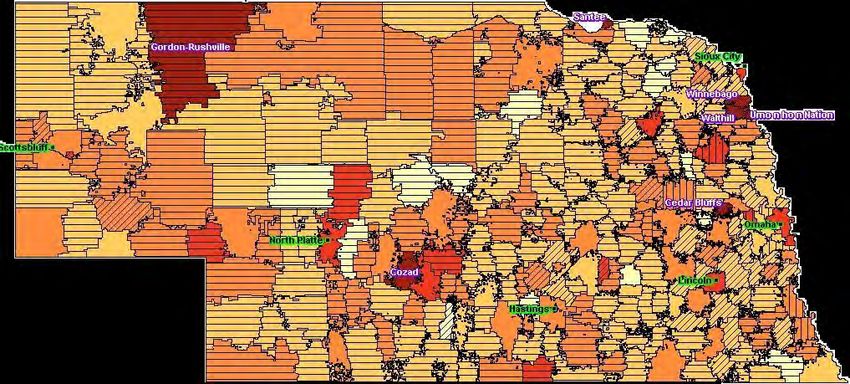
mately 35 miles from Omaha. Map 4 shows student mobility percentages for
North Dakota school districts in 2007/08. Most
North Dakota districts are rural (141 of 158; table 10). Mobility
percentages were higher for rural (6.5 percent) and
North Dakota provided 2007/08 counts of students town locales (7.0 percent) than for suburban (1.1
who transferred out of districts and schools within percent) and city locales (1.4 percent).
districts (to another school in the same district) as
well as total enrollment but did not provide counts Some 87 percent of North Dakota’s rural districts
of students who transferred into each district or were in locale 43, the most remote (table 11).
into schools from another school within the dis- Mean student mobility percentages were higher in
trict. These mobility percentages are smaller than districts in remote rural locales (6.3 percent) and
they would be if student entrances had also been distant rural locales (8.3 percent) than in urban
included. Nonetheless, the maps accurately depict fringe rural districts (0.8 percent).
Table 10
district student mobility percentages in north dakota by locale category, 2007/08
city Suburb Town rural
State (all codes) (codes 11,12,13) (codes 21,22,23) (codes 31,32,33) (codes 41,42,43)
population n = 158 n=3 n=3 n = 11 n = 141
mean 6.3 1.4 1.1 7.0 6.5
median 3.3 0.6 0.6 4.0 3.4
Standard deviation 10.4 1.6 1.2 8.2 10.6
Note: Because data are population rather than sample data, the standard error of the mean is 0, and statistical inferences are not made.
Source: Authors’ analysis based on data provided by the North Dakota Department of Public Instruction; see box 2 and appendix A for details.
Table 11
Rural district student mobility percentages in north dakota by locale code, 2007/08
fringe (code 41) distant (code 42) remote (code 43)
population n=2 n = 16 n = 123
mean 0.8 8.3 6.3
median 0.8 2.7 3.5
Standard deviation 0.1 15.0 10.0
Note: Because data are population rather than sample data, the standard error of the mean is 0, and statistical inferences are not made.
Source: Authors’ analysis based on data provided by the North Dakota Department of Public Instruction;; see box 2 and appendix A for details.WhaT are each STaTe’S diSTricT STudenT mobiliTy percenTageS, and Where iS mobiliTy moST prevalenT? 15
map 4
north dakota public school student mobility percentages, 2007/08
mobility percentage locale code
very low 0% other than rural
low16 STudenT mobiliTy in rural and nonrural diSTricTS in five cenTral region STaTeS
Table 12
mobility and poverty percentages in extremely high student mobility districts in north dakota, 2007/08
Students eligible for free
district locale code mobility percentage or reduced-price luncha
fort yates 4 43 81.8 85.5
manvel 125 42 51.8 17.3
naughton 25 42 42.9 0.0
St. Thomas 43 43 27.8 53.0
Selfridge 8 43 44.0 88.8
Twin buttes 37 43 40.5 91.9
north dakota na 6.3 31.2
na is not applicable.
a. Numbers in bold are higher than the state mean.
Source: Authors’ analysis based on data provided by the North Dakota Department of Public Instruction; see box 2 and appendix A for details.
In 2007/08 six North Dakota districts had stu- Wyoming
dent mobility percentages above 27.1 percent, 2
standard deviations above the state mean of 6.3 Wyoming provided data on student mobility
percent. Four of the six extremely high student into and out of districts, with no duplication of
mobility districts had eligibility percentages for students. In districts with more than one school
free or reduced-price lunch that were higher than per grade level these data do not capture mobility
the state average of 31.2 percent. at the school level for students who move between
schools within a district.
• St. Thomas 43, a very small rural district in
northeastern North Dakota on the Minne- Wyoming’s mobility formula:
sota border, had 2007/08 enrollment of 115
students. Number of unscheduled student district entrances
+ number of unscheduled student district exits
• Manvel 125 is 50 miles south of St. Thomas; District total student count on March 12, 2008
15 miles from Grand Forks, the third largest
metropolitan area in North Dakota; and 18 Map 5 shows student mobility percentages for
miles from Grand Forks Air Force Base. Wyoming school districts in 2007/08. Wyoming
has only two city districts and no suburban dis-
• Twin Buttes 37, on the Fort Berthold Indian tricts; 30 districts are rural and the remaining 17
reservation, is a small-enrollment (37 students are in town locales (table 13). The mean mobility
in 2007/08) district in west-central North percentages are higher for rural (15.6 percent) and
Dakota. town locales (12.8 percent) than that for the city
locale (9.0 percent).
• Naughton 25, northeast of Bismarck, has one
K–8 school that enrolled seven students in Eighty percent of Wyoming’s rural districts are
2007/08. No students were eligible for free or in the most remote locale (table 14). Districts in
reduced-price lunch. distant rural locales had higher mean student
mobility (30.0 percent) than did urban fringe
• Selfridge 8 and Fort Yates 4 are neighboring rural districts (10.9 percent) and remote districts
districts on the Standing Rock reservation. (15.2 percent).WhaT are each STaTe’S diSTricT STudenT mobiliTy percenTageS, and Where iS mobiliTy moST prevalenT? 17
map 5
Wyoming public school student mobility percentages, 2007/08
mobility percentage locale code
very low18 STudenT mobiliTy in rural and nonrural diSTricTS in five cenTral region STaTeS
Table 13
district student mobility percentages in Wyoming by locale category, 2007/08
city Suburb Town rural
State (all codes) (codes 11,12,13) (codes 21,22,23) (codes 31,32,33) (codes 41,42,43)
population n = 49 n=2 n=0 n = 17 n = 30
mean 14.5 9.0 na 12.8 15.6
median 14.1 9.0 na 12.1 15.1
Standard deviation 6.3 0.2 na 3.6 6.8
na is not applicable.
Note: Because data are population rather than sample data, the standard error of the mean is 0, and statistical inferences are not made.
Source: Authors’ analysis based on data provided by the Wyoming Department of Education; see box 2 and appendix A for details.
Table 14
Rural district student mobility percentages in Wyoming by locale code, 2007/08
fringe (code 41) distant (code 42) remote (code 43)
population n=4 n=2 n = 24
mean 10.9 30.0 15.2
median 10.6 30.0 15.1
Standard deviation 3.3 6.3 5.7
Note: Because data are population rather than sample data, the standard error of the mean is 0, and statistical inferences are not made.
Source: Authors’ analysis based on data provided by the Wyoming Department of Education; see box 2 and appendix A for details.
Table 15
mobility and poverty percentages in extremely high student mobility districts in Wyoming, 2007/08
Students eligible for free
district locale code mobility percentage or reduced-price luncha
fremont county School district 38 42 36.3 95.3
Sheridan county School district 3 43 29.0 34.7
Wyoming na 14.5 30.0
na is not applicable.
a. Numbers in bold are higher than the state mean.
Source: Authors’ analysis based on data provided by the Wyoming Department of Education; see box 2 and appendix A for details.
Wyoming had two districts with mobility per- districts of Fremont 6, 14, and 21 had high
centages greater than 27.1 percent, 2 standard mobility percentages that ranged from 21.7
deviations above the state mean of 14.5 percent. to 25.3. Fremont 14 and 21 are also on the
Both districts had higher eligibility for free or Wind River reservation, and Fremont 6 is
reduced-price lunch than the state mean of 30.0 near it.
percent in 2007/08 (table 15).
• Sheridan County School District 3, in the
• Fremont County School District 38, in the north-central part of the state, covers roughly
west central part of the state, is on the Wind 1,200 square miles and had an enrollment of
River Indian Reservation. The adjacent 101 students in 2007/08.limiTaTionS 19
comparisons across states because the five states
limiTaTionS and could shed light on in this study calculate
the relative seriousness of student mobility
This study describing student mobility across student mobility and on differently, student
school districts in five Central Region states is mobility across state bor mobility percentages
a first step in addressing mobility in the region. ders. This is potentially cannot be compared
The five states do not collect data on why students important, as several
move into and out of schools and districts, so the extremely high mobility
discussion of student mobility, including descrip areas in the five states are in districts on or near
tions of district attributes such as share of students state borders.
eligible for free or reduced-price lunch, should not
be interpreted as related to the causes of mobility. This study cannot describe where students go
In addition, the states did not report information when they change schools, explain the causes of
on where students went when they left schools or high student mobility in districts where it exists,
districts or on the origins of students who trans or describe the effects of this mobility on students,
ferred into a school or district. schools, and districts. However, state agency staff
and policymakers can use the information on mo
Because the five states in this study calculate stu bility percentages to consider outreach efforts to
dent mobility differently, student mobility percent areas identified as having extremely high student
ages cannot be compared. Mobility percentages mobility. The study also suggests a direction for
should be considered only within each state. further research to understand mobility among
groups such as American Indian students, given
Among these five states, there were no two states the extremely high student mobility percentages
that tracked mobility in exactly the same way. Fur on some reservations. Research about mobility
ther research into student mobility would be aided might help state and local education agencies
by the adoption of a single method for collecting pursue solutions and strategies that could mitigate
and recording mobility data. This would enable some of the negative effects of student transience.20 STudenT mobiliTy in rural and nonrural diSTricTS in five cenTral region STaTeS
appendix a available on the Department of Elementary
daTa ColleCTion and analySiS and Secondary Education (2009) web site.
However, the department provided a file that
Student mobility data as defined in each state included all districts in one document. The
were obtained from all districts in the five Central file contained the calculated student mobility
Region states that requested the study (Colorado, percentage for use in generating the map.
Missouri, Nebraska, North Dakota, and Wyo
ming). Therefore, the data are population data and • Nebraska’s 2007/08 calculated student mobil
have no sampling error. ity percentages were available from the Ne
braska Department of Education (2009) data
Data collection web site. The mobility percentage included
students who entered or left schools between
The student mobility data differ on several pa the last Friday in September (the date the total
rameters, including school year, grade levels for student count was taken) and the last day of
which mobility data were received, level (school school.
or district) at which mobility was measured, and
existence of student duplication in the data sets • North Dakota Department of Public Instruc
(see table 1 in main report). Because no two states tion provided a spreadsheet with 2007/08
rely on the same set of parameters, student mobil counts of students who transferred out of
ity cannot be compared across states. districts or out of schools within districts
(to another school in the same district) and
States also provided data in different forms; a total enrollment count but not counts of
some provided mobility percentages, and others students who transferred into each district or
provided the underlying data for calculating the into schools from another school within the
mobility percentages. district. Transfers out of each district and out
of schools within each district were summed
• The Colorado Department of Education (2009) to establish total exits for the district and
web site provided counts of instances of student then divided by the district student count to
mobility per school for 2006/07 (unsched get a mobility percentage based on exits only.
uled entrances and exits from each school, Mobility percentages are smaller than they
with duplication), along with a total count of would be had the state definition also included
students per district. Mobility percentages at student entrances. Nonetheless, the maps ac
the school level were calculated for each district curately depict the intensity of mobility based
by summing across each district’s schools and on exits for each district relative to all other
dividing by the total student count for the districts in the state.
district.4 Online-only schools were excluded
from the calculations (both for student mobil • Wyoming provided a spreadsheet with mobil
ity per school and district total student counts), ity percentages calculated by district, without
as they draw students from across the state and student duplication. In districts with more
do not reflect local student mobility. Colorado’s than one school per grade level this percent
definition of mobility counts students who are age would not capture mobility at the school
out of school for more than 10 consecutive days level if students moved between schools
as an exit. Students are not recorded as mobile within the district.
in Colorado until after October 1.
Each state department of education gave consent
• Missouri data on grade 9–12 mobility for to use and display the data in this report. All stu
individual districts in 2007/08 are publicly dent mobility data were aggregated to the schoolYou can also read