Gender Dynamics in Crowdfunding (Kickstarter): Evidence on Entrepreneurs, Backers, and Taste-Based Discrimination
←
→
Page content transcription
If your browser does not render page correctly, please read the page content below
Downloaded from https://academic.oup.com/rof/advance-article/doi/10.1093/rof/rfaa041/6039186 by Kungl Tekniska Hogskolan Biblioteket user on 10 February 2021
                                                              Review of Finance, 2021, 1–40
                                                               doi: 10.1093/rof/rfaa041
                                   Advance Access Publication Date: 16 December 2020

Gender Dynamics in Crowdfunding
(Kickstarter): Evidence on Entrepreneurs,
Backers, and Taste-Based Discrimination*
Hadar Gafni1,2, Dan Marom3, Alicia Robb4, and Orly Sade3
1
 Department of Strategy and Innovation, Copenhagen Business School, 2KTH Royal Institute of
Technology, 3The Hebrew University of Jerusalem, and 4University of Colorado at Boulder

Abstract
This study focuses on the launch phase of the leading reward-based crowdfunding
market—Kickstarter. It documents the behavior of male and female entrepreneurs in
raising early stage capital. We find that women share as entrepreneurs in the plat-
form (34.7%) does not equal to their share in the overall population, and they are
concentrated in stereotyped sectors, both as entrepreneurs and as backers. We also
find that women do not set lower funding goals than men, they enjoy higher rates of
success than men, even after controlling for project categories and funding goals,
and that backers of both genders have a tendency to fund entrepreneurs of their
own gender. Our survey of Kickstarter backers finds evidence of taste-based dis-
crimination by male backers.

JEL classification: G29, G41, L26, J16
Keywords: Crowdfunding, Discrimination, Gender, Early stage financing
Received November 11, 2020; accepted November 24, 2020 by Editor Andrew Ellul.

 * We appreciate many helpful comments and suggestions from the Andrew Ellul (the editor) and two
   referees. We have benefited from comments by Yakov Amihud, Alon Eizenberg, Xavier Gabaix, Lee
   Fleming, Avner Kalay, Caterina Lucarelli, Ethan Mollick, Ramana Nanda, Chester Spatt, Henriette
   Prast, Vera Rocha, Thomas Rønde, Mirjam Van Praag, Robert Whitelaw, Yishay Yafeh, and attendees
   at the 2016 American Finance Association meeting (San Francisco), 2015 Utah Winter Finance
   Conference, the 2015 Development of Securities Markets: Trends, Risks and Policies, Bocconi
   University - Milan, the UC Berkeley Workshop on Crowdfunding, the 2014 Financial Modeling and
   Capital Markets conference in Jerusalem, the 2014 Strategic Management Society meeting in Tel
   Aviv, the 2014 Academy of Management meeting, the 2014 Diana conference in Stockholm, and the
   NYU Shanghai, Fudan University, Ben-Gurion University, Hebrew University, CAS Or-Yehuda, Cass
   Business School, and CU Boulder Seminars. We would like to thank OurCrowd for providing us with
   data about their investments. This project received financial support from the Kauffman Foundation,
   the Asper Center at the Hebrew University, the Kruger Center at the Hebrew University, and the ISF
   grant No. 430/14. We thank Wei Yang and Talia Ochayon for their excellent research assistance,
   Roxanne Powell for language editing and Fabian Gaessler and Goran Calic for their help with the data.

C The Author(s) 2021. Published by Oxford University Press on behalf of the European Finance Association. All rights
V
reserved. For permissions, please email: journals.permissions@oup.com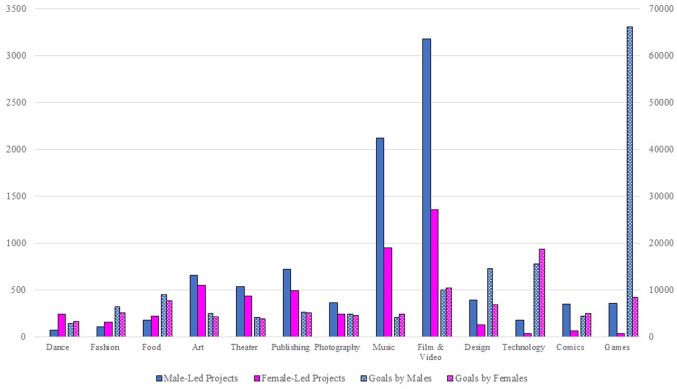
2                                                                                         H. Gafni et al.

                                                                                                             Downloaded from https://academic.oup.com/rof/advance-article/doi/10.1093/rof/rfaa041/6039186 by Kungl Tekniska Hogskolan Biblioteket user on 10 February 2021
1. Introduction
Using the Internet to mobilize a crowd of supporters in order to fund a project or a business
was an almost nonexistent approach only a decade ago. Yet, within a relatively short time,
billions of dollars have been raised through crowdfunding platforms to fund new projects
and companies. Crowdfunding leverages the Internet and social networks in order to raise
funds from a large, undefined number of investors or contributors to support new ventures,
innovation, and other causes; each individual backer usually contributes only a small
amount of money. Supporters of these platforms argue that by relying on a large number of
small contributions, crowdfunding has the potential to “democratize” entrepreneurship
funding and capital markets by providing the means to both female entrepreneurs and fe-
male investors to participate more fully (Mollick and Robb, 2016).
    While crowdfunding is a term that is used to describe several market mechanisms differ-
entiated by the return to the backer (equity, debt, reward, or nothing in the case of a dona-
tion), this article focuses on a leading reward-based platform: Kickstarter. We were keen to
focus on the launch of a reward-based platform because it has been claimed that this in-
novative funding mechanism has the potential to reduce some of the frictions in the trad-
itional financial markets and might potentially increase the diversity of participants.1 We
documented the level of female participation as entrepreneurs and as funders. Starting with
the demand side, we asked if male and female entrepreneurs participated at different rates
and at which categories, whether they take different fundraising decisions, and if they face
different success rates. We benchmark these results against the female proportions in the
population and in comparable industries, as well to their success among angel investors,
venture capitals (VCs), and within experiments. To explain our results, we turned to the
supply side, and compared male and female backers’ funding decisions with respect to the
entrepreneurs’ genders. Lastly, we conducted a survey to check whether taste-based dis-
crimination (TBD, as opposed to statistical discrimination, SD) against women might play
a part in funding decisions.2 We also provide additional evidence from the launch of an
equity crowdfunding platform, OurCrowd.
    We used a custom-made software to retrieve data from Kickstarter and create our data-
set, which contains information on 16,641 successful projects, 4,128 failed projects,
22,274 entrepreneurs, 1,108,186 backers, and contributions that total more than $120 mil-
lion. Our data cover the period from April 2009 (inception of Kickstarter) to March 2012.
Focusing on the launch of the platform enabled us to investigate the effect of its launch per
se, prior to any other gender-related effects (such as the “me too” movement).

1 There are several conjectures related to this motivation. Since each backer may contribute a rela-
  tively small amount, this enables people who possess or control little capital to participate.
  Moreover, unlike the complexity of assessing equity, it is less difficult to assess the potential return
  related to the contribution in different future states of the world, and this can enable the participa-
  tion of individuals who possess little financial literacy. It is well documented (e.g., Lusardi and
  Mitchell, 2011 among others) that women tend to have less capital and be less financially literate
  than men.
2 Taste-based discrimination was defined by Becker (1957) as follows: an economic player who dis-
  likes, or prefers not to be associated with, individuals of a given race, gender, ethnicity, religion,
  status, or some other personal characteristic. Statistical discrimination, on the other hand, was
  described by Arrow (1972) and Phelps (1972) as discriminatory behaviour that can be rational, ra-
  ther than result from prejudice.
Gender Dynamics in Crowdfunding 3
Downloaded from https://academic.oup.com/rof/advance-article/doi/10.1093/rof/rfaa041/6039186 by Kungl Tekniska Hogskolan Biblioteket user on 10 February 2021
We started by investigating the level of female participation as project leaders on this
platform, and found that women-led projects made up about one-third of all the projects
led by one entrepreneur. This ratio is clearly below the female proportion in the overall
population (about half). The different gender participation rate varied between categories
(industries represented on the platform): while the proportion of male entrepreneurs in the
Comics, Design, Games, and Technology categories was in the 76–92% range, female
entrepreneurs constituted the majority in the Dance, Fashion, and Food categories (55–
77%). In order to compare relative gender participation in Kickstarter and other compar-
able capital fundraising channels, we focused on the Film and Video and Technology cate-
gories. Even though at Kickstarter, these are male-dominated categories (30 and 16% of
the entrepreneurs are women, respectively), we could still observe a relatively higher par-
ticipation of women than on other financing platforms for these industries (17% of regis-
tered film directors are women, and 0% in a market for financing technology start-ups, as
elaborated in Section 2.1).
The next step consisted in examining funding goals set by entrepreneurs, comparing
those set by men and women. The all-or-nothing funding mechanism of the Kickstarter
platform makes this decision a crucial one, since an over-ambitious goal may well lead to
no funding at all. Although descriptive results suggest that men set higher goals than
women, this difference was not significant during the period we investigated once we con-
sidered co-variables.
We also studied the impact of gender on crowdfunding campaign success. This question
is important because of the concern that female entrepreneurs face difficulties in obtaining
funds from traditional sources. Evidence of such difficulties has been found with angel
investors (Sohl, 2014; Ewens and Townsend, 2019) and in mock-investment experiments
(Brooks et al., 2014; Thébaud, 2015). However, a logit regression with fundraising success
as a dependent variable and several related controls, including campaign goal, revealed that
female entrepreneurs were significantly more likely to succeed than men. To check the ro-
bustness of these results, we used a matching technique to pair selected projects according
to the main category, subcategory, country of the entrepreneur, and fundraising goal,
whereby the only difference was the gender of the entrepreneur. The results of our full sam-
ple, which show higher success rates for women than for men, were replicated in the match-
ing subsample.
In order to find an explanation for this relative advantage enjoyed by women, we inves-
tigated whether the platform attracted women to become involved in financing. We were
able to assign a gender to 888,468 out of 1,108,186 backers (i.e., 80% of backers). The ma-
jority of backers were also men, although the ratio was more balanced: about 45% of
Kickstarter project backers are female. This is a much higher female participation level
than in angel investing (about 20% (Sohl, 2014)) or VC (about 6% (Brush et al., 2014)).
Differences probably result from the very low barriers to participation as a backer on
Kickstarter: much less capital is needed (compared with angel investment), and no assigned
role is required (compared with being a partner in a VC firm). When we examined the pref-
erences of backers for specific types of industry, we found that, similarly to entrepreneurs,
male backers were most interested in Comics, Product Design, Games, and Technologies
(71–86% of contributions), whereas female backers dominated the Dance, Food, and
Theater categories (58–68%).
Since the supply side of this market is not solely controlled by one gender, it is of
interest to learn about differences in contribution patterns according to gender.4 H. Gafni et al.
Downloaded from https://academic.oup.com/rof/advance-article/doi/10.1093/rof/rfaa041/6039186 by Kungl Tekniska Hogskolan Biblioteket user on 10 February 2021
Therefore, we examined the relationship between the gender of the entrepreneur(s) (alone
or in a team of two) and the proportion of women among project backers (disregarding
contributed sums). Not only was the proportion of female (male) backers higher (lower)
for female-led projects than for male-led or male/female-led, there was a clear trend
showing that the more the female element was dominant in a project (i.e., 2 women > 1
woman > woman-man > man-woman > 1 or 2 men), the more the proportion of female
backers increased.
Analyzing the backers’ in our sample, we found clear patterns: female backers pledged
40% of their contributions to female entrepreneurs, higher than the latter’s proportion of
34.7%, whereas men pledged only 23% (and conversely for pledges to male entrepreneurs).
This pattern was robust for most Kickstarter categories, yet weaker when considering only
backers who had made more than five contributions (serial backers, SB); here, we found
that women became agnostic to gender.
To account for potential endogeneity, we test the hypotheses using regression analyses,
which consider various covariates. We employed two approaches for our regression analy-
ses, which discovered gender-related contribution patterns for both genders. The first was
at project level: the share held by female backers out of all project backers was regressed
over the gender of the entrepreneur and controls. The second investigated the backer level,
which enabled us to observe the menu of projects that backers faced when making their
contributions. Under both approaches, the gender of the entrepreneur strongly predicted
the gender of her or his backers: men were mainly backed by men and women were mainly
backed by women. Remarkably, this effect diminished once female SB were involved, but
not with male ones.
A survey of Kickstarter backers revealed that men and women had different reasons for
backing projects. We used the respondents’ answers to gender equality questions in order to
investigate whether TBD (as opposed to SD) played a role in funding decisions in our sub-
sample. Using responses to a questionnaire derived from common practice in the gender lit-
erature, we constructed a metric of gender inequality (GI) perception. Since a person may
back a project led by someone of their own gender for different reasons, such as SD or
interest in the same categories, we controlled for this tendency in our estimation. In add-
ition to this tendency, we measured a negative effect of that taste toward inequality on
funding female entrepreneurs’ projects. This negative effect is true for men, but not for
women. This is consistent with the existence of TBD by men as regards female-led projects,
which is on top of other potential explanations.
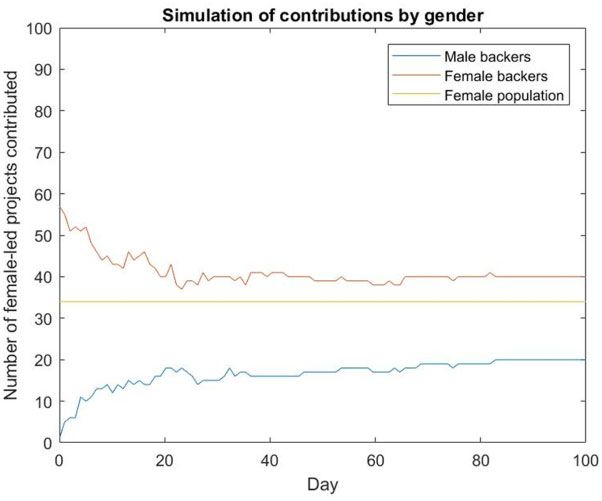
Finally, we provide an economic model that explains the observed difference in behavior
between serial and non-SB, since experience in contributing to crowdfunding projects is
expected to affect SD and not taste-based one. We simulated a dataset for this model, and
the results of the simulation mimic what we observed in the data.
Our article is structured in the following manner. Section 2 will survey the gender-
related finance literature, in particular as regards the participation, incentives, and attrib-
utes of women in the traditional fundraising process, both as entrepreneurs and investors;
this section also puts forward a number of hypotheses. Section 3 will provide an overview
of the Kickstarter platform and the data used in our analysis. In Section 4, we will present
our empirical analysis of the data. In Section 5, we will cross these data with data from a
survey conducted amongst backers and add a simulation analysis. We will draw conclu-
sions in Section 6.Gender Dynamics in Crowdfunding 5
Downloaded from https://academic.oup.com/rof/advance-article/doi/10.1093/rof/rfaa041/6039186 by Kungl Tekniska Hogskolan Biblioteket user on 10 February 2021
2. Gender-related Literature and Our Hypotheses
Given that the focus of this article is the relationship between gender and the funding of
entrepreneurship, this section will review the literature relating to the participation, incen-
tives, and attributes of women in traditional fundraising processes, both as entrepreneurs
and investors. According to the similarities and differences between traditional fundraising
and crowdfunding, we either aligned our hypotheses, or contrasted them, with common
practices among angel and VC investors and the firms they invest (or do not invest) in.
2.1 Participation of Women as Entrepreneurs
While the overall population is gender-balanced, one immediate question is about the share
of various economic activities, such as entrepreneurship, held by each gender. A large
amount of literature is devoted to the gender structuring of organizations, including the seg-
regation of men and women into different areas of studies, jobs, occupations, firms, and
industries (e.g., Baron and Bielby, 1985; Charles and Grusky, 2005; Charles and Bradley,
2009). While women-owned businesses make up about 35.8% of firms in the USA, owner-
ship rates vary dramatically by industry (United States Census Bureau, 2015). A number of
studies have indicated that women tend to start firms in low-growth sectors of service and
retail, which are typically less capital-intensive, and that this could reflect higher financing
barriers for women-owned firms than for men-owned ones (Robb, 2002; Watson and
Robinson, 2003; Fairlie and Robb, 2009).
Previous studies provided statistics on women-founded businesses that were venture-
backed: from 10.7% during the years 2010–15 (Gompers and Wang, 2017), through
12.4% for ownership of “high-impact firms” in 2004–8 (Tracy, 2011), to 15% in the
period of 2011–13 (Brush et al., 2014). Of the US-based companies that received a round
of VC financing in 2010, only 6% had a female CEO, 7% had a female founder, and 10%
had a female founder or CEO at some point (Dow Jones Venture Source, 2011). A contem-
poraneous work by Ewens and Townsend (2019) used a dataset of start-ups’ pitches and
reactions of angel investors from AngelList, enabling the authors to observe unfunded com-
panies as well. They found that women constituted only 15.8% of founder CEOs trying to
raise capital, and 21% of all founders.
However, one might expect the gender gap to be smaller in terms of involvement in raising
capital on crowdfunding platforms, as well as regarding the performance of entrepreneurs.
The Internet enables practically barrier-free entry to these platforms, thus there are fewer
gatekeepers who may be biased against women and, hence, restrict access to a wider variety
of entrepreneurs. In addition, the Internet allows people to be involved in a much more an-
onymous fashion. There is often little or no in-person or face-to-face interaction between pro-
ject leaders and funders; thus, women might feel more comfortable launching a project or
idea in this space, even in industries that are typically male-dominated. Moreover, reward-
based crowdfunding requires less financial literacy than equity investment. Given that the
academic literature has pointed to GI in that regard as well (e.g., Lusardi and Mitchell,
2011), the introduction of such platforms may well attract greater female participation.
Hypothesis 1: The level of participation of female entrepreneurs on the platform is different
from the level of participation of male entrepreneurs.
Hypothesis 2: Female entrepreneurs participate in different project categories at a different rate
than male entrepreneurs.6 H. Gafni et al.
Downloaded from https://academic.oup.com/rof/advance-article/doi/10.1093/rof/rfaa041/6039186 by Kungl Tekniska Hogskolan Biblioteket user on 10 February 2021
2.2 Confidence and Risk Aversion among Fundraising Women
Numerous studies have documented that women tend to launch firms in sectors with lower
capital requirements, such as retail and services and, regardless of industry, with signifi-
cantly smaller amounts of capital than men (Rosa, Carter, and Hamilton, 1996; Carter,
Williams, and Reynolds, 1997; Coleman and Robb, 2009). Lower levels of capital can con-
strain the ability of firms to grow, as well as increase the risk of financial distress if the firm
does not have sufficient liquidity to weather periods of adversity.3 In the literature, women
have been portrayed differently from their male counterparts as regards the following
dimensions: (i) women are less confident and more likely to underestimate their skills and
performance in various business-related contexts (e.g., Bandura, 1986; Estes and Hosseini,
1988; Fletcher, 2001; De Bruin, Brush, and Welter, 2007; Morales-Camargo et al., 2013,
among others); (ii) they tend to be less aggressive in career choices and advancement (e.g.,
Bertrand, Goldin, and Katz, 2010; Buser, Niederle, and Oosterbeek, 2014); (iii) risk aver-
sion is higher amongst women (Byrnes, Miller, and Schafer, 1999; Croson and Gneezy,
2009; Reuben, Sapienza, and Zingales, 2010),4 although Filippin and Crosetto (2016)
found negligible differences between the genders when studying the results of fifty-four
experiments; (iv) women also tend to negotiate less than men, and settle for less than what
they want instead of asking for more (Babcock et al., 2003; Ahl, 2004; Niederle and
Vesterlund, 2007; Bowles, Babcock, and Lai, 2007; Langowitz and Minniti, 2007; Säve-
Söderbergh, 2007; Castillo et al., 2013); (v) women typically have smaller networks and,
thus, may feel that they have access to fewer investors (Olm et al., 1988; Aldrich, Reese,
and Dubini, 1989; Klyver and Grant, 2010)5; and (vi) women may feel that there will be
implicit biases against their level of competence, especially in male-dominated industries
(Ridgeway, 2009).
When fundraising on crowdfunding platforms, an entrepreneur is required to set the
funding goal prior to the start of the campaign and cannot change it later. This is a crucial
decision on platforms that apply an all-or-nothing mechanism (i.e., the entrepreneur must
reach the goal in order to obtain the totality of the funds). Entrepreneurs thus have an in-
centive to ask for an amount that does not exceed what they actually need. In fact, some of
them might wish to raise a lot more than their stated goal, but purposefully set a lower tar-
get in order to increase the likelihood of raising some initial capital (high enough to guaran-
tee that the project can be undertaken). Entrepreneurs may also underestimate the demand
3 Prior research suggests both demand-side and supply-side issues in the raising of financial capital.
Demand-side issues include entrepreneur preferences for growth, profit, industry sector, risk, and
control, while supply-side factors would include the investor preferences for specific types of in-
dustry, firms, or entrepreneur (Fabowale et al., 1995; Carter and Rosa, 1998; Constantinidis et al.,
2006; Orser et al., 2006). Furthermore, there is some evidence that women continue to experience
problems in terms of their relationships with lenders (Fabowale et al., 1995; Chaganti et al., 1996;
Brush et al., 2001, 2002; Greene et al., 2001; Lee and Denslow, 2004; Menzies et al., 2004; Alsos
et al., 2006; Becker-Blease and Sohl, 2007; Carter et al., 2007; Gatewood et al., 2009).
4 Mohammadi and Shafi (2018) studied gender-related patterns of investing through a Swedish equity
crowdfunding platform, and found that women were more likely to invest in the equity of older firms
and in firms belonging to more traditional industries, which a lower percentage of equity offerings.
This behavior is also consistent with risk aversion.
5 Carter et al. (2003) did not find any impact of social networks on the likelihood of using equity
financing.Gender Dynamics in Crowdfunding 7
Downloaded from https://academic.oup.com/rof/advance-article/doi/10.1093/rof/rfaa041/6039186 by Kungl Tekniska Hogskolan Biblioteket user on 10 February 2021
for their product or prototype, setting a low goal that reflects what they think the demand
will be.
This implies that women might set lower goals than men for a desired level of funding
owing to some of the above-mentioned reasons. This is indeed the case when female found-
ers seek funds from angel investors on AngelList—their average goal is 77.5% of the aver-
age goal of male founders (Ewens and Townsend, 2019).
On the other hand, these gender differences might be mitigated if we consider the specif-
ic characteristics of people who decide to become entrepreneurs: they are typically less risk-
averse (Hvide and Panos, 2014), less loss-averse (Koudstaal, Sloof, and Van Praag, 2015),
and more confident, especially in the crowdfunding setting, with its low entry costs, differ-
ent dynamics, and specific risks. Our next hypothesis investigates whether financial goals
vary by gender.
Hypothesis 3: Female entrepreneurs set lower funding goals than male entrepreneurs.
2.3 Fundraising Success of Female Entrepreneurs
Data about success rates of female entrepreneurs in obtaining capital from VCs are scarce,
although a lower likelihood of funding by angel investors has been reported. For instance,
Sohl (2014) documented an angel funding success rate of 19% for female entrepreneurs,
and8 H. Gafni et al.
Downloaded from https://academic.oup.com/rof/advance-article/doi/10.1093/rof/rfaa041/6039186 by Kungl Tekniska Hogskolan Biblioteket user on 10 February 2021
2007; Padnos, 2010). A few years later, the Center for Venture Research estimated that
women angels represented 19.4% of the angel market in 2013 (Sohl, 2014).
The VC industry continues to be heavily male-dominated as well. Brush et al. (2004)
found that women constituted only 9% of management-track venture capitalists in 2000,
and were twice as likely as men to leave the industry before attaining senior-level positions.
Brush et al. (2014) noted that the number of female partners in VC firms had actually
declined since an earlier study using 1999 data: from 10% of all firms to 6%. According to
a 2016 study by National Venture Capital Association and Deloitte, the percentage of VC
investors who were women was 11%, down from 14% in 2008. In another study
(Gompers et al., 2014), VentureSource data on all VC investments made between 1975 and
2003 showed that 79% of VC firms had no female investors. Of those firms that did have
female VC investors, about 75% had only one; at the individual level, women constituted
only 6.1% of the sample of venture capitalists.
A similar pattern emerges from an examination of US-based VC firms that had raised at
least one fund totaling $200 million or more since 2009: this yielded a total of 92 VC firms.
Only 23 of the 542 partner-level venture capitalists identified in these firms were women,
or 4.2%, which is even lower than the 4.6% of female CEOs among the Fortune 500. Of
these ninety-two firms, only seventeen had at least one senior female partner, and just five
firms had at least two (Fortune, 2014).
A number of articles cite women’s lack of access to angel investor or VC networks as a
constraint that reduces their likelihood of securing external equity (Brush, Greene, and
Hart, 2001; Marlow and Patton, 2005; Brush et al., 2009). In terms of investment activity
and patterns, women are significantly more likely to apply for funding from angel net-
works, which have a higher proportion of female investors (Becker-Blease and Sohl, 2007).
This suggests that female entrepreneurs’ willingness to apply for external equity may
be suppressed by the relatively small number of female angel investors and venture capital-
ists. There are a few angel groups and VC funds that specifically target female entrepre-
neurs (such as Astia Angels and Golden Seeds), but they are the exception rather than
the rule.
Another explanation for women’s purported exclusion from, or limited access to inter-
action networks is the prevalence of homophily, i.e., preferred interaction with others who
are similar in terms of sex, race, or education (Rogers and Kincaid, 1984; Ibarra, 1992).
Brush et al. (2014) found that VC firms with women partners were twice as likely to invest
in companies with a woman on the management team (34% versus 13%). Similarly, VC
firms with female partners were three times more likely to invest in companies with women
CEOs (58% versus 15%). Ewens and Townsend (2019) found that on an online platform,
female entrepreneurs were, ceteris paribus, less likely than male entrepreneurs to be funded
by male angel investors.
Reward-based crowdfunding platforms do not set any entry barriers to people who
would like to fund projects, which opens the door to a more balanced gender distribution
on the supply side. Moreover, the smaller amounts of money involved may influence fund-
ing decisions, since there is no risk of losing large sums of money. On the other hand, there
is a significantly larger information asymmetry on crowdfunding platforms, since the ability
of potential backers to perform due diligence on entrepreneurs is limited, and this may
cause backers to give more weight to characteristics such as the entrepreneur’s gender. If
the behavior of female crowdfunders is similar to the behavior of female investors in VCs,
we may expect a tendency to provide funds to projects initiated by other women.Gender Dynamics in Crowdfunding 9
Downloaded from https://academic.oup.com/rof/advance-article/doi/10.1093/rof/rfaa041/6039186 by Kungl Tekniska Hogskolan Biblioteket user on 10 February 2021
Hypothesis 5: The level of participation of female backers on the platform will be different from
the level of participation of male backers.
Hypothesis 6: Women will tend to fund female entrepreneurs, while men will tend to fund male
entrepreneurs.
2.5 TBD and SD in Financial Markets
How can gender-related investment patterns be explained? Can they be attributed to gender
discrimination in the marketplace? And if so, to what type of discrimination? The econom-
ics literature has put forward two leading theories. The first one, by Becker (1957), focused
on TBD, or personal prejudice: an economic player dislikes, or prefers not to be associated
with, individuals of a given race, gender, ethnicity, religion, status, or some other personal
characteristic. The second leading theory, by Arrow (1972) and Phelps (1972), dealt with
SD. Discriminatory behavior may in some cases be rational rather than result from preju-
dice; namely, it stems from differences across groups as regards specific relevant aggregate
characteristics. Typically, in SD models, discrimination in the marketplace involves stereo-
typing, which is used to cope with imperfect information.6 Separating taste-based from
statistical-based behavior is a challenging task. Nevertheless, understanding the underlying
reasons for channeling funds into projects is of great interest.
Hypothesis 7: The preference for contributing to a female-led project is correlated with taste-
based discrimination.
3. Sample and Data
For our empirical analysis, we collected data on projects and backers from
Kickstarter.com, making use of custom-made software. In this section, we will describe this
crowdfunding platform, the information collection method, and the main variables.
3.1 Kickstarter Sample
Kickstarter is a leading crowdfunding platform in the USA and is considered by many as
the most popular reward-based platform. As an intermediary between entrepreneurs seek-
ing funding and potential backers, the platform uses a fundraising mechanism combining
reward-based and pre-purchase crowdfunding models. It is used by entrepreneurs to launch
or expand their businesses. Mollick and Kuppuswamy (2016) conducted a survey of design,
technology, and video games projects that raised money on Kickstarter prior to mid-2012
and found that over 90% of successful projects remained as ongoing ventures. Between its
inception (April 2009) and April 2018, Kickstarter accounted for more than 141,986 suc-
cessfully funded projects and attracted over 14.5 million backers contributing over $3.6
billion.7
Investigating a fundraising platform from its launch offers a number of research advan-
tages: (i) we can document the introduction of a new financing mechanism; (ii) Kickstarter
uses an all-or-nothing mechanism, whereby entrepreneurs only receive funding if they reach
their goal within the allotted timeframe (otherwise, the funds are returned to the backers),
which provides a clear definition of successful fundraising; (iii) the platform attracted a
6 For an extensive discussion and review of taste-based and statistical discrimination, please see
Guryan and Charles (2013).
7 Retrieved from https://www.kickstarter.com/help/stats (April 2018).10 H. Gafni et al.
Downloaded from https://academic.oup.com/rof/advance-article/doi/10.1093/rof/rfaa041/6039186 by Kungl Tekniska Hogskolan Biblioteket user on 10 February 2021
substantial number of ventures over 3 years, providing information both on entrepreneurs
and backers; and (iv) detailed information about both successful and unsuccessful funding
attempts, which is usually not disclosed to outsiders, was available.
3.2 Data
In March 2012, we used a custom-made software to collect information from the platform.
This enabled us to gain information not only about projects but also about backers. We col-
lected data on 16,641 successful projects, 4,128 failed projects, 22,274 entrepreneurs,
1,108,186 backers, and total contributions of more than $120 million. Our focus was the
launch of the platform; hence, the study period covers three years, from the inception of
Kickstarter in April 2009 through March 2012. All textual data concerning projects avail-
able on the site were downloaded, as well as data about project creators and backers.
It is important to note that Kickstarter only offered direct access to projects that were in
the process of raising funds or had already successfully fundraised, but not to failed cam-
paigns. We bypassed this limitation by using the list of links to projects that funders had
contributed to and by collecting the same type of information about these projects as well
using our custom-made software. We were able to download failed projects that had
received at least one pledge by backers who funded a successful or ongoing project. We
validated our dataset by using another dataset, which included all failed and cancelled proj-
ects, obtained in late 2018 from Kaggle.com. Although the latter dataset lists more failed
projects than those we initially obtained, it does not feature certain control variables that
are key to our analysis; neither does it include any information about backers. For robust-
ness purposes, we ran our empirical analyses over the complete set (see Sections 4.2 and
4.3) and the quality of results remained the same.
3.2.a. Gender classification
When preparing the data, first we removed projects where the author’s name was the name
of a company or organization (e.g., ending with Ltd). We then extracted the project leaders’
first names from each of the projects; we classified project leaders by gender by comparing
extracted first names with those found in lists of male and female names (from various on-
line sources), with manual adjustments. We then manually verified a large sample of those
names.8
Ultimately, we were able to classify by gender 13,533 projects involving single entrepre-
neurs and 539 projects involving teams of two entrepreneurs, out of 20,769 projects.
Considering either single entrepreneurs or the first of a team of two, men-led projects made
up almost two-thirds of the sample (9,193), while women-led projects made up just over
one-third (4,879). In addition to the gender of entrepreneurs, we were also able to deter-
mine the gender of backers for each project—as long as they had entered their names. We
were thus able to assign gender to 80% of backers over the examined period (888,468 out
of a total of 1,108,186).
We carried out a robustness check on our gender classification by randomly selecting
1,000 projects in our sample, and presented a short survey in Mechanical Turk, one of the
largest crowdsourcing platforms.9 Two evaluators used photographs of the entrepreneurs
8 The algorithm is used by several articles, for example Belenzon and Zarutskie (2012).
9 https://www.mturk.com/. The evaluators who were eligible to participate in the survey were quali-
fied to do so by their prior experience and user reviews on the Mechanical Turk platform.Gender Dynamics in Crowdfunding 11
Downloaded from https://academic.oup.com/rof/advance-article/doi/10.1093/rof/rfaa041/6039186 by Kungl Tekniska Hogskolan Biblioteket user on 10 February 2021
to categorize all 1,000 projects. We found that the dictionary used to classify names had
correctly predicted 98% of the men and 96.5% of the women, thus validating the algorithm
we used to classify entrepreneurs and backers by gender in our database.
Comparing our data with a similar Kickstarter database obtained by Rhue (2015)
helped us provide an additional validation of the female entrepreneurs’ representation and
distribution. Rhue downloaded a sample from WeRobots.io for the period April 2009 until
December 2014 and identified the gender of the entrepreneur by using computer vision
technology. The gender distribution in her sample is almost identical to ours.
3.2.b. Category classification and additional related variables
Kickstarter projects are divided into the following thirteen observable categories: Art,
Comics, Dance, Design, Fashion, Film and Video, Food, Games, Music, Photography,
Publishing, Technology, and Theater. The distribution of these categories is provided in
Column 1 of Panel A in Table I. In addition, we obtained data about the fundraising goals
of all projects, their countries of operation, launch, and completion dates, and the subcat-
egory assigned to each project, as well as whether it was labeled Popular or Staff Picked on
the platform. Following Gafni, Marom, and Sade (2019), we counted the number of times
that entrepreneurs mentioned their own names in the project description, because this
proved to be a predictor of success, especially among art projects. As regards backers on
the platform, we gathered data about all the projects they funded and the dates at which
they did so.
4. Empirical Analysis
In this section, we will test the predictions and hypotheses proposed in Section 2, starting
with entrepreneurs making use of the Kickstarter crowdfunding platform, continuing with
backers, before presenting a survey that provided deeper insights into the motives of partici-
pating agents.
4.1 Participation of Women on Kickstarter
To test Hypotheses 1 and 2, we investigated the participation of women in Kickstarter. In
our sample, 34.7% of project leaders were women, rising to 36.4% of the subsample of
funded projects. Female entrepreneurs were strongly represented in some categories but
clearly under-represented in others. As shown in Columns 2 and 3 of Panel A in Table I,
and in Figure 1, the shares held by male entrepreneurs in the Comics, Design, Games, and
Technology categories ranged between 76 and 92%, while women formed the majority of
entrepreneurs in the Dance category (77%) as well as in Fashion and Food (more than
half).
While these categories are not directly comparable to the industry categories of US
firms, the large gender differences across categories are very stereotyped in both cases. In
the general business population of the USA, data from the 2012 US Census Bureau indicate
that while women-owned firms accounted for 35.8% of all firms, they constituted the ma-
jority of firms in the healthcare and social assistance sector (62.5%), and the educational
services sector (54.2%) (United States Census Bureau, 2015). Thus, industry segregation
appears to characterize the categories in which women participate. A comparison to the
proportion of female entrepreneurs who seek external funding from VCs or angel investors
is difficult since we can observe only funded start-ups. A hint may come from the small12 H. Gafni et al.
Downloaded from https://academic.oup.com/rof/advance-article/doi/10.1093/rof/rfaa041/6039186 by Kungl Tekniska Hogskolan Biblioteket user on 10 February 2021
Table I. Distribution of entrepreneurs, goals, contributions and patterns by category
This table presents the distribution of key elements by Kickstarter project category. Panel A.
(1): Number of projects in our sample. (2) and (3): Projects by gender of first or only entrepre-
neur, starred if significantly larger than 50%. (4) and (5): Successful projects by gender of first
or only entrepreneur, starred if significantly larger than 50%. (6) and (7): Mean fundraising goal
by gender. Starred if significantly larger than the other genders. (8) and (9): Contributions of
backers by gender of the backer, starred if significantly larger than 50%. Panel B. (1): Number of
projects in our sample. (2) and (3): Share of female-led projects funded by male or female back-
ers, starred if significantly different from Column 3. (4) and (5): Same as (2) and (3) but for SB
only. Table sorted by Column 3. *, **, and *** indicate that the coefficients are statistically sig-
nificantly different at the 10, 5, and 1% levels, respectively.
Panel A Distribution of entrepreneurs Distribution of contributions (%)
All Successful Funding goal ($)
projects (%) projects (%)
(1) (2) (3) (4) (5) (6) (7) (8) (9)
Projects Male Female Male Female Male Female Male Female
Dance 308 22.7 77.3*** 20.5 79.5*** 2,847.4 3,208.3 32.0 68.0***
Fashion 261 41.0 59.0*** 35.9 64.1*** 6,333.4 5,158.4 38.6 61.4***
Food 392 44.6 55.4** 43.2 56.8*** 8,973.7* 7,638.5 40.5 59.5***
Art 1,204 54.4*** 45.6 52.8** 47.2 4,891.6 4,211.2 46.1 53.9***
Theater 966 55.3*** 44.7 54.3*** 45.7 4,110.4 3,802.8 42.0 58.0***
Publishing 1,209 59.6*** 40.4 58.2*** 41.8 5,283.7 5,148.8 48.1 51.9***
Photography 606 59.9*** 40.1 57.3*** 42.7 4,752.0 4,522.1 44.1 55.9***
Music 3,072 69.0*** 31.0 67.5*** 32.5 4,130.1 4,820.2*** 52.1*** 47.9
Film and Video 4,530 70.1*** 29.9 68.9*** 31.1 9,888.8 10,439.9 52.0*** 48.0
Design 517 76.0*** 24.0 73.0*** 27.0 14,525.1*** 6,784.5 77.32** 22.7
Technology 207 83.6*** 16.4 84.0*** 16.0 15,469.8 18,715.0 78.7*** 21.3
Comics 411 84.9*** 15.1 83.4*** 16.6 4,385.7 4,913.3 71.2*** 28.8
Games 389 91.8*** 8.2 91.8*** 8.2 66,062.3 8,455.0 85.9*** 14.1
Total 14,072 65.3*** 34.7 63.6*** 36.4 9,468.3 6,468.4 55.2*** 44.8
Panel B Share of Share of Share of Share of
female-led female-led female-led female-led
projects funded projects funded projects funded projects funded
by male backers by male backers by male backers by male backers
All sample SB
(1) (2) (%) (3) (%) (4) (%) (5) (%)
Projects Male Female Male Female
Dance 308 75.5** 78.5*** 84.2*** 75.7
Fashion 261 57.6 75.8*** 54.9* 64.0**
Food 392 42.3*** 55.0 33.6*** 42.5***
Art 1,204 33.7*** 49.7*** 33.3*** 41.9***
Theater 966 43.1*** 46.9*** 44.1 44.1
Publishing 1,209 29.3*** 50.3*** 26.5*** 42.7*
Photography 606 37.8*** 44.2*** 38.4* 41.1
(continued)Gender Dynamics in Crowdfunding 13
Downloaded from https://academic.oup.com/rof/advance-article/doi/10.1093/rof/rfaa041/6039186 by Kungl Tekniska Hogskolan Biblioteket user on 10 February 2021
Table I. Continued
Panel B Share of Share of Share of Share of
female-led female-led female-led female-led
projects funded projects funded projects funded projects funded
by male backers by male backers by male backers by male backers
All sample SB
(1) (2) (%) (3) (%) (4) (%) (5) (%)
Projects Male Female Male Female
Music 3,072 31.7*** 38.1*** 43.8*** 45.1***
Film and Video 4,530 23.5*** 36.1*** 22.2*** 32.7***
Design 517 3.0*** 17.5*** 4.3*** 15.3***
Technology 207 10.5*** 19.2*** 14.3*** 12.7**
Comics 411 13.5*** 30.6*** 21.4*** 29.8***
Games 389 7.3*** 13.0*** 8.3** 11.6***
Total 14,072 22.1*** 40.4*** 19.5*** 33.5***
Figure 1. Distribution of projects and goals by gender and category. This figure presents the number
of projects in our sample by gender of first or only entrepreneur (full color bars), sorted from most fe-
male-dominated category (Dance) to most male-dominated category (Technology). The dotted bars
visualize the mean fundraising goal in US dollars by gender of the entrepreneur and project category.
proportion of female founders in AngelList (Ewens and Tonwsend, 2019), which was sub-
stantially lower than in Kickstarter.
In order to make a rigorous comparison and discover whether crowdfunding might fos-
ter greater female participation, we wished to examine an industry for which we had data
that reflected gender differences in the economy and compare it with an identical category
on Kickstarter. We decided to focus on the film industry, because the Film and Video cat-
egory in our sample was the most populated one and directors in North America are part of14 H. Gafni et al.
Downloaded from https://academic.oup.com/rof/advance-article/doi/10.1093/rof/rfaa041/6039186 by Kungl Tekniska Hogskolan Biblioteket user on 10 February 2021
a guild.10 Thus, we approached the Directors Guild of America11 and obtained a complete
list of all film and television directors, assistant directors, stage managers, and unit produc-
tion managers registered in the USA and Canada. We removed all data concerning members
who were not principal directors. Out of 8,433 directors on this list,12 we managed to iden-
tify the gender of 89.6% by applying the same algorithm used with the Kickstarter sample.
Among the directors who were identified, only 17.3% were women, compared with 29.9%
for the Film and Video category on Kickstarter, suggesting greater female participation on
crowdfunding platforms.13 On the contrary, when we compared the Kickstarter percentage
of female directors with the percentage of directors involved with another alternative
source of film funding, the share held by women was quite similar. According to a report
about the Sundance film festival (considered the largest independent film festival in the
USA), 28.7% of film directors who took part in the festival were women (Smith et al.,
2013), which is very similar to the 29.9% that we documented as regards Kickstarter.14
One might ask whether low female entrepreneur participation in technology-related
projects is a characteristic of reward-based platforms only. In order to provide additional
evidence, we contacted OurCrowd, a leading global equity crowdfunding platform for
accredited investors who fund early stage start-ups.15 OurCrowd’s portfolio consists mainly
of technology companies (technology here is broadly defined: from medical devices to
algorithms).
We received data on investments, totaling $78 million, made during the period October
2012 to January 2015 to fifty-three firms in seventy-six funding rounds (some firms had
more than one funding round via OurCrowd). The average funding campaign in the sample
attempted to achieve just over $1 million, while the median was about $725,000.
10 We also compared the share held by female entrepreneurs in the technology subsample with their
share of ventures that received venture capital finance. Among the latter, the share held by
female-led businesses ranged between 10% and 15% (see Section 2); thus, we can see that fe-
male participation was higher amongst crowdfunding entrepreneurs, since the proportion of
funded female entrepreneurs in comparable categories (Design and Technology) ranged between
16 and 27%.
11 Available at https://www.dga.org.
12 Within this list, only 2,349 had a movie listed to their name on IMDb (Internet Movie Database).
That is to say, this was not a list of already funded directors but, rather, a pool of directors seeking
funding for their films, thus comparable to Kickstarter.
13 Women representation among directors decreases to 7% when considering the top domestic
grossing films of 2016 (Lauzen, 2017).
14 As a festival for independent films, it features films not funded by major film studios, which can be
compared to venture capital funds. The funds and small independent studios that fund these films
are the alternative funding methods—just like reward-based crowdfunding. Like backers on
Kickstarter, committee members on such non-profit funds do not consider the profit-making pros-
pects of the film but rather their own tastes. While market forces are at play on Kickstarter, ensur-
ing that a fair share of funded films is by women directors is sometimes a stated goal for these
funds.
15 OurCrowd invests its own capital and incorporates selected start-ups into its accredited member-
ship. OurCrowd investors must meet stringent accreditation criteria and invest a minimum of
$10,000 per deal of their choice. OurCrowd provides post-investment support to its portfolio com-
panies, assigning industry experts as mentors and taking board seats.Gender Dynamics in Crowdfunding 15
Downloaded from https://academic.oup.com/rof/advance-article/doi/10.1093/rof/rfaa041/6039186 by Kungl Tekniska Hogskolan Biblioteket user on 10 February 2021
Table II. Distribution by team composition
This table presents the distribution of key elements by the composition of the entrepreneurial
team. (1) and (2): Number of projects in our sample. (3): Mean fundraising goal in US dollars.
(4): Success rate in our sample. (5): Mean number of backers. (6): Mean individual contribution
by backer in US dollars.
Gender (1) (2) (3) (4) (5) (6)
Number Percentage Goal ($) Success # of Backers Mean individual
contribution ($)
Two women 112 0.8 10,452.2 0.938 113.2 82.2
One woman 4,666 33.2 6,305.1 0.820 64.6 78.2
Woman and man 101 0.7 9,596.8 0.842 97.6 85.8
Man and woman 118 0.8 8,531.8 0.831 99.8 87.4
One man 8,867 63.0 9,438.7 0.759 81.4 77.6
Two men 208 1.5 11,259.8 0.841 270.0 94.4
Total 14,072 100.0 8,428.2 0.783 79.1 78.2
Interestingly, and in line with our intuition, over a duration of >2 years, none of the CEOs
or leading founders of these fifty-three technology-related firms were women.
Coleman and Robb (2012) and Godwin et al. (2006) argued that as a result of gender-
based stereotypes, female entrepreneurs faced unique obstacles in accessing resources for
their ventures; one way to overcome these obstacles was to partner with men, especially in
male-dominated industries. As mentioned earlier, 539 of the projects in our sample
involved two entrepreneurs (hereafter, teams or partnerships), as presented in Column 1 in
Table II. About 61% of teams included a woman, compared with 79% including a man. In
two of the four categories that had the lowest percentages of single female leads (Design
and Games, but not Comics or Technology), mixed partnerships were more strongly repre-
sented among projects that included women. To test our Hypotheses 3 and 4, the next sec-
tions will examine funding goals and success rates in these categories.
4.2 Gender and Fundraising Goal
As shown in Columns 6 and 7 of Panel A in Table I, there are considerable gender differen-
ces relating to the average goal, both by category and overall. Women’s average goals per
category range from about $3,200 in Dance to nearly $19,000 in Technology. Men’s aver-
age goals per category range from a low of less than $3,000 in Dance to over $66,000 in
Games. Overall, the average goal for female-led projects is $6,468, compared with an aver-
age of $9,468 for men. This is consistent with our third hypothesis, yet these differences are
statistically insignificant. In an unreported table, we regressed the goal over the gender of
the entrepreneur(s) while controlling for team, country, and category, and the coefficient
for the gender was insignificant. The overall differences in mean values of goals are not sig-
nificantly explained by gender but, rather, by project characteristics. When examining the
mean goal by team composition (see Table II), on average, teams seek more funding than
single entrepreneurs, and male teams more than female teams.
We investigated whether projects led by women in categories with a larger than average
share held by women were different from projects led by women in categories that are male
dominated. The average goal for female-led projects exceeded that of male-led projects in16 H. Gafni et al.
Downloaded from https://academic.oup.com/rof/advance-article/doi/10.1093/rof/rfaa041/6039186 by Kungl Tekniska Hogskolan Biblioteket user on 10 February 2021
five categories: Comics, Dance, Film and Video, Music, and Technology, only one of which
(Dance) is a category where women are much more represented than men (77%). In two of
the categories, Comics and Technology, women were noticeably inconspicuous (about 15–
16%), indeed far below the share they generally hold (34.7%). A regression analysis also
failed to identify any significant effect of gender density within a category on the funding
goal. Overall, once we introduced controls, we could observe that female entrepreneurs did
not set significantly lower goals than men. A possible explanation for this result might be
the self-selection of women into entrepreneurship: women with more “entrepreneurial”
characteristics than women in the general population are attracted to Kickstarter.
4.3 Gender and Fundraising Success
Female entrepreneurs in our sample enjoyed a higher success rate (82%) than men
(76%).16 If we compare the distribution of successful projects by gender with the overall
project distribution (Columns 2 and 3 of Panel A in Table I), we can see that female-led
projects are more represented among successful projects in all categories—except for
Games and Technology (see Columns 4 and 5 in Table I). Interestingly, women appear to
be relatively more successful in categories where they hold a higher share compared with
overall, with a 2.9% increase in their density, compared with 1.7% overall. Column 4 in
Table II shows that, in line with the traditional financial sector, women who team up with
male entrepreneurs increase their likelihood of obtaining funds; however, this increases
even more when they team up with another woman.
The advantage of women in likelihood of fundraising success is visible in Table III, in
which we ran a logit regression with fundraising success as a dependent variable over two
different specifications. In Column 1, we regressed with a dummy variable equal to 1 if the
entrepreneur was a woman or if the first entrepreneur in the partnership was a woman, and
in Column 2 with a dummy variable equal to 1 if the entrepreneur was one or two women,
and a parallel dummy variable for one or two men (with mixed partnerships as a reference
group). We controlled for the logged goal, the number of entrepreneurs, the number of
times the entrepreneur(s) mentioned themselves in the description, the length of the descrip-
tion text (logged), a dummy variable for US-based projects, whether the project appeared in
the Popular section, and the project category.
The results of the two specifications were consistent: female entrepreneurs were much
more likely to succeed in fundraising, even after controlling for the set goal, contrary to
Hypothesis 4. In Columns 3 and 4, we added interaction terms of the share held by female
entrepreneurs in the category, but these were not significant.
To check the robustness of these results, we used a matching technique to pair selected
projects according to the exact main category, subcategory, country of the entrepreneur,
and fundraising goal, whereby the only difference was the gender of the entrepreneur (or of
the leading entrepreneur in the case of teams). We ended up with a subsample of 911
matched pairs. Similarly to the results presented in Table III, women are still more likely
than men to reach their funding goals (80% versus 73.7%), which provides evidence that
lower goals are not the factor driving higher success rates amongst women. Previous aca-
demic research has documented that women were more likely to wait until they were
16 Success rates in the sample were higher than actual ones, as explained earlier, yet the advantage
enjoyed by women was validated by using the dataset consisting of all failed projects.Gender Dynamics in Crowdfunding 17
Downloaded from https://academic.oup.com/rof/advance-article/doi/10.1093/rof/rfaa041/6039186 by Kungl Tekniska Hogskolan Biblioteket user on 10 February 2021
Table III. Multivariate analysis of fundraising success
This table presents the results of the logit regression described in Section 4.3. The dependent
variable is a dummy variable equal to 1 if the fundraising goal is successfully reached. In
Column 1, we regress over a dummy variable equal to 1 if either the entrepreneur or the first
entrepreneur in the partnership is female; in Column 2 we regress over a dummy variable equal
to 1 if the entrepreneur is one or two women and a parallel dummy variable for one or two men
(with mixed partnerships as a reference group). We control for the logged goal, whether one or
two entrepreneurs are involved, the number of times the entrepreneur/s mentioned themselves
in the description text, the length of the description text (logged), a dummy variable for US-
based projects, whether the project appeared in the Popular section, and the category of the
project. *, **, and *** indicate that the coefficients are statistically significantly different at the
10, 5, and 1% levels, respectively.
Gender (1) (2) (3) (4)
Dependent variable: fundraising success
Female-led 0.362*** 0.453***
(0.048) (0.149)
All-female dummy 0.725*** 0.743**
(0.259) (0.296)
All-male dummy 0.356 0.295
(0.257) (0.255)
Share of category held by women 0.163 0.148
(0.248) (0.246)
Female-led* share held by women 0.258
(0.397)
All-female* share held by women 0.226
(0.399)
Partnership 0.868*** 1.086*** 0.756*** 0.950***
(0.131) (0.177) (0.129) (0.175)
Log(Goal) 0.478*** 0.478*** 0.505*** 0.505***
(0.019) (0.019) (0.019) (0.019)
Self-Mentions 0.245*** 0.245*** 0.299*** 0.300***
(0.029) (0.030) (0.030) (0.030)
Popular 2.500** 2.500** 2.381** 2.380**
(continued)You can also read