Storage Futures Study - Storage Technology Modeling Input Data Report - Chad Augustine and Nate Blair - NREL
←
→
Page content transcription
If your browser does not render page correctly, please read the page content below
Storage Futures Study
Storage Technology Modeling
Input Data Report

 Chad Augustine and Nate Blair

Storage Futures Study
Storage Technology Modeling
Input Data Report
Chad Augustine and Nate Blair

Suggested Citation: Augustine, Chad, and Nate Blair. Energy Storage Futures Study: Storage Technology Modeling Input Data Report.
Golden, CO: National Renewable Energy Laboratory. NREL/TP-5700-78694. https://www.nrel.gov/docs/fy21osti/78694.pdf.

Preface
 This report is one in a series of the National Renewable Energy Laboratory’s Storage Futures
 Study (SFS) publications. The SFS is a multiyear research project that explores the role and
 impact of energy storage in the evolution and operation of the U.S. power sector. The SFS is
 designed to examine the potential impact of energy storage technology advancement on the
 deployment of utility-scale storage and the adoption of distributed storage, and the implications
 for future power system infrastructure investment and operations. The research findings and
 supporting data will be published as a series of publications. The table on the next page lists the
 planned publications and specific research topics they will examine under the SFS.

 This report, the second in the SFS series, reviews the current characteristics of a broad range of
 mechanical, thermal, and electrochemical storage technologies with application to the power
 sector. The report provides current and future projections of cost, performance characteristics,
 and locational availability of specific commercial technologies already deployed, including
 lithium-ion battery systems and pumped-storage hydropower. These projections will inform the
 modeling and analysis of power system evolution scenarios planned for later reports in the series.

 The SFS series provides data and analysis in support of the U.S. Department of Energy’s
 Energy Storage Grand Challenge, a comprehensive program to accelerate the development,
 commercialization, and utilization of next-generation energy storage technologies and sustain
 American global leadership in energy storage. The Energy Storage Grand Challenge employs
 a use case framework to ensure storage technologies can cost-effectively meet specific needs,
 and it incorporates a broad range of technologies in several categories: electrochemical,
 electromechanical, thermal, flexible generation, flexible buildings, and power electronics.

 More information, any supporting data associated with this report, links to other reports in the
 series, and other information about the broader study are available at
 https://www.nrel.gov/analysis/storage-futures.html.

 iii
This report is available at no cost from the National Renewable Energy Laboratory (NREL) at www.nrel.gov/publications.
Title Description Relation to this Report
 The Four Phases of Explores the roles and opportunities for Provides broader context on
 Storage Deployment: new, cost-competitive stationary energy the implications of the cost
 A Framework for the storage with a conceptual framework and performance
 Expanding Role of based on four phases of current and characteristics discussed in
 Storage in the U.S. potential future storage deployment, and this report, including the
 Power System presents a value proposition for energy specific grid services they
 storage that could result in cost-effective may enable in various phases
 deployments reaching hundreds of of storage deployment
 gigawatts (GW) of installed capacity
 Energy Storage Reviews the current characteristics of a Presented in this report
 Technology Modeling broad range of mechanical, thermal, and
 Input Data Report electrochemical storage technologies with
 application to the power sector. Provides
 current and future projections of cost,
 performance characteristics, and locational
 availability of specific commercial
 technologies already deployed, including
 lithium-ion battery systems and pumped
 storage hydropower.
 Economic Potential of Assesses the economic potential for utility- Analyzes utility-scale storage
 Diurnal Storage in the scale diurnal storage and the effects that deployment and grid
 U.S. Power Sector storage capacity additions could have on evolution scenarios to test the
 power system evolution and operations various cost trajectories and
 assumptions detailed in this
 report.
 Distributed Storage Assesses the customer adoption of Analyzes distributed storage
 Customer Adoption distributed diurnal storage for several adoption scenarios to test the
 Scenarios future scenarios and the implications for various cost trajectories and
 the deployment of distributed generation assumptions detailed in this
 and power system evolution report.
 Grid Operational Assesses the operation and associated Considers the operational
 Implications of value streams of energy storage for implications of storage
 Widespread Storage several power system evolution scenarios deployment and grid
 Deployment and explores the implications of seasonal evolution scenarios to
 storage on grid operations examine and expand on the
 grid-scale scenario results
 found with ReEDS
 Storage Futures Study: Synthesizes and summarizes findings from Includes a discussion of all
 Executive Summary and the entire series and related analyses and other aspects of the study
 Synthesis of Findings reports, and identifies topics for further and provides context for the
 research results of this study

 iv
This report is available at no cost from the National Renewable Energy Laboratory (NREL) at www.nrel.gov/publications.
Acknowledgments
 We would like to acknowledge the contributions of the entire Storage Futures Study team as well
 as our U.S. Department of Energy (DOE) Office of Strategic Analysis colleagues as core
 contributors to this document. Those contributors include Paul Denholm, Wesley Cole, Will
 Frazier, Ben Sigrin, Kevin McCabe, and Ashreeta Prasanna from the National Renewable
 Energy Laboratory (NREL) and Kara Podkaminer from DOE. We would also acknowledge the
 feedback and contributions of other NREL staff, including Chad Hunter, Evan Reznicek,
 Michael Penev, Greg Stark, Vignesh Ramasamy, David Feldman, and Trieu Mai, We also would
 like to thank the technical review committee for input, including Doug Arent (NREL/Chair),
 Paul Albertus, Ines Azevedo, Ryan Wiser, Susan Babinec, Aaron Bloom, Chris Namovicz,
 Arvind Jaggi, Keith Parks, Kiran Kumaraswamy, Granger Morgan, Cara Marcy, Vincent
 Sprenkle, Oliver Schmidt, David Rosner, John Gavan, and Howard Gruenspecht. Finally,
 additional thoughts and suggestions came from various technical experts at DOE, including Paul
 Spitsen, Kathryn Jackson, Neha Rustagi, Marc Melaina, Andrew Dawson, Adria Brooks, Sam
 Baldwin, Sarah Garman.

 This work was authored by the National Renewable Energy Laboratory, operated by Alliance for
 Sustainable Energy, LLC, for the U.S. Department of Energy (DOE) under Contract No. DE-
 AC36-08GO28308. Funding provided by U.S. Department of Energy Office of Energy
 Efficiency and Renewable Energy Solar Energy Technologies Office, U.S. Department of
 Energy Office of Energy Efficiency and Renewable Energy Wind Energy Technologies Office,
 U.S. Department of Energy Office of Energy Efficiency and Renewable Energy Water Power
 Technologies Office and U.S. Department of Energy Office of Energy Efficiency and Renewable
 Energy Office of Strategic Analysis. The views expressed in the article do not necessarily
 represent the views of the DOE or the U.S. Government. The U.S. Government retains and the
 publisher, by accepting the article for publication, acknowledges that the U.S. Government
 retains a nonexclusive, paid-up, irrevocable, worldwide license to publish or reproduce the
 published form of this work, or allow others to do so, for U.S. Government purposes.

 v
This report is available at no cost from the National Renewable Energy Laboratory (NREL) at www.nrel.gov/publications.
List of Acronyms and Abbreviations
 ATB Annual Technology Baseline
 BESS battery energy storage system(s)
 BNEF Bloomberg New Energy Finance
 BOS balance of system
 CAES compressed air energy storage
 CSP concentrating solar power
 dGen Distributed Generation Market Demand (dGen) model
 DOE U.S. Department of Energy
 E/P energy/power ratio
 EPC engineering, procurement, and construction
 ESB energy storage block
 ESBOS energy storage balance of system
 ESS energy storage system
 EV electric vehicle
 FC fuel cell
 FERC Federal Energy Regulatory Commission
 H2 hydrogen (as a storage fluid)
 H2 Elec-salt cavern- CT hydrogen storage using electrolyzers, salt caverns, and combustion
 turbines
 H2 Elec-salt cavern- FC hydrogen storage using electrolyzers, salt caverns, and stationary
 fuel cells
 kW kilowatt
 kWh kilowatt-hour
 LAES liquid air energy storage
 LCOGS levelized cost of generation and storage
 LFP lithium, iron, phosphate
 LIB lithium-ion battery
 mS millisecond
 MW megawatts
 MWDC megawatts-direct current
 MWh megawatt-hour
 NCA nickel, cobalt, aluminum
 NMC nickel-manganese-cobalt
 NREL National Renewable Energy Laboratory
 O&M operation and maintenance
 PSH pumped-storage hydropower
 PTES pumped thermal energy storage
 ReEDS NREL’s Regional Energy Deployment System model
 RTE round-trip efficiency
 S second
 SFS Storage Futures Study
 USD U.S. dollars
 WDC watts-direct current

 vi
This report is available at no cost from the National Renewable Energy Laboratory (NREL) at www.nrel.gov/publications.
Executive Summary
 The Storage Futures Study (SFS) is a multiyear research project to explore the role and impact
 of energy storage in the evolving electricity sector of the United States. The SFS is designed to
 examine the potential impact of energy storage technology advancement on the deployment of
 utility-scale storage and the adoption of distributed storage, and the implications for future power
 system infrastructure investment and operations. This specific report synthesizes current and
 projected cost performance assumptions along with location availability for storage technologies
 through 2050 that will be used in scenario analysis for the SFS at both the bulk power and
 distribution system scales. For comparison and context, this report also presents a synthesis of
 current cost and performance characteristics of energy storage technologies for storage durations
 ranging from minutes to months and including mechanical, thermal, and electrochemical storage
 technologies for the electricity sector. This information is intended to cover a broad range of
 storage technologies that are currently receiving significant attention from the investment
 community as well as in the media. In the report, we emphasize that energy storage technologies
 must be described in terms of both their power (kilowatts [kW]) capacity and energy (kilowatt-
 hours [kWh]) capacity to assess their costs and potential use cases.

 The technology cost and performance future projections highlighted in this work are limited to
 two commercial technologies that have already been deployed in the United States and thus have
 available data to inform forward projections: battery energy storage systems (BESS) and
 pumped-storage hydropower energy storage (PSH). These scenarios capture an aggressive range
 of future cost reductions under current market and policy conditions. They do not explicitly
 represent cost reductions that may occur with rapid deployment to achieve deep decarbonization.
 While there are uncertainties with potential supply chain constraints, costs could come down
 even faster than captured in this analysis under a highly decarbonized future. There are ongoing
 efforts to better capture the potential for accelerated cost reductions based upon accelerated
 deployment.

 For each technology, we develop three projections: an Advanced Scenario, a Moderate Scenario,
 and a Conservative Scenario. The Moderate Scenario is the most likely projection based on
 literature and analysis, and the Advanced and Conservative Scenarios are used to test the
 sensitivity of technology costs to projected deployments under SFS scenarios. The PSH and
 utility-scale BESS projections will be used in the National Renewable Energy Laboratory’s
 (NREL’s) Regional Energy Deployment System (ReEDS) capacity expansion model to explore
 grid-scale energy storage, while residential and commercial and industrial BESS projections are
 used in the Distributed Generation Market Demand (dGen) model to study distributed energy
 storage.

 These projections provide a benchmark for storage technologies, with a wide but plausible range
 of technology advancement over multiple decades. Any of the emerging technologies that reach
 comparable cost and performance levels could be deployed instead of BESS or PSH. Likewise,
 the SFS project assesses the grid impacts independent of specific storage technologies, but
 instead driven by the services and value that are provided. In other words, when evaluating SFS
 model results, the reader should focus on the energy storage costs, durations, and use cases rather
 than the specific technologies and should realize that a suite of technologies has the potential to
 provide these characteristics in the future.

 vii
This report is available at no cost from the National Renewable Energy Laboratory (NREL) at www.nrel.gov/publications.

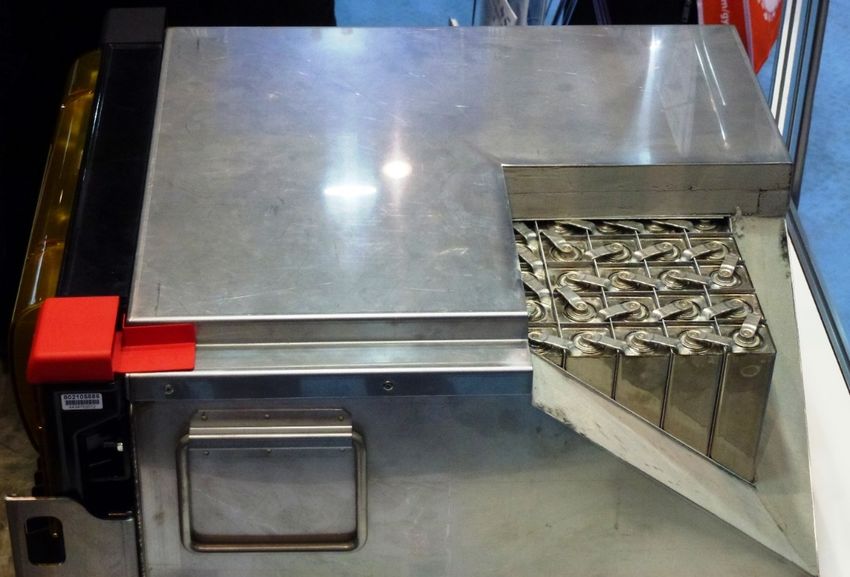
Current and Projected Costs
 Current and Projected PSH Costs: To develop current and future projections for PSH costs,
 data from the U.S. Department of Energy’s (DOE’s) HydroWIRES cost modeling of U.S.-
 averaged resources is used to frame PSH relative to a broad set of technologies (Mongird et al.
 2020). Because of the interest in modeling site-specific regional data and constraints, we use the
 existing regional supply curve cost and performance data developed as part of the DOE
 HydroVision Study (DOE 2016) in the ReEDS model to assess the implications for grid
 evolution.

 Battery Energy Storage Systems (BESS) Costs: For utility-scale, commercial/industrial, and
 residential BESS, we estimate current component-level costs of BESS for each market segment
 and apply a consistent cost projection curve for future costs. For all BESS, we assume lithium-
 ion battery (LIB) technology is used, although do not specify the type of battery chemistry.

 Current Utility-Scale BESS Costs: Current costs for utility-scale BESS are based on a bottom-
 up cost model using the data and methodology for utility-scale BESS in Feldman et al. (2021).
 The bottom-up BESS model accounts for major components, including the LIB pack, inverter,
 and the balance of system (BOS) needed for the installation. The battery pack is a set of cells
 themselves and their packaging (see Figure 11). Enclosures and anything that packages a number
 of packs is typically captured separately in the capital cost. Using the detailed NREL cost models
 for LIB, we develop current costs for a 60-MW BESS with storage durations of 2, 4, 6, 8, and 10
 hours, shown in terms of energy capacity ($/kWh) and power capacity ($/kW) in Figure ES-1
 and Figure ES-2 respectively. 60-MW is used as the representative BESS project size in ReEDS
 based on the assumed ratio of storage for the representative 100MW PV system used in ReEDS
 (although here we are not looking at a hybrid system). Current installed capital costs for BESS in
 terms of $/kWh decrease with duration, while costs in $/kW increase. This inverse behavior is
 observed for all energy storage technologies and highlights the importance of distinguishing the
 two types of battery capacity when discussing the cost of energy storage.

 viii
This report is available at no cost from the National Renewable Energy Laboratory (NREL) at www.nrel.gov/publications.
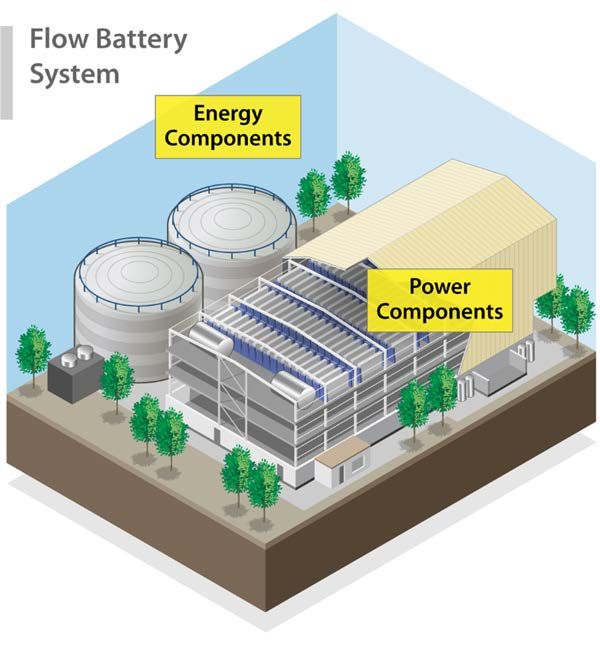
Figure ES-1. 2019 U.S. utility-scale LIB storage costs for durations of 2–10 hours (60 MWDC)
 in $/kWh
 EPC = engineering, procurement, and construction

 ix
This report is available at no cost from the National Renewable Energy Laboratory (NREL) at www.nrel.gov/publications.
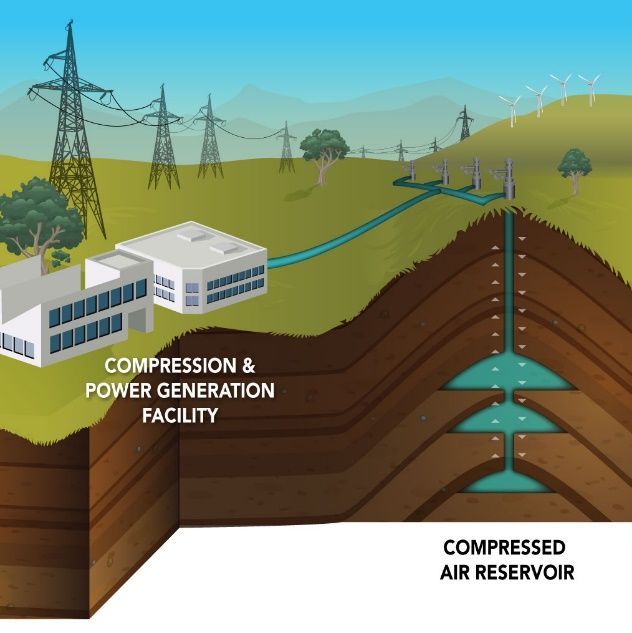
Figure ES-2. 2019 U.S. utility-scale LIB storage costs for durations of 2–10 hours (60 MWDC) in
 $/kW
 Projected Utility-Scale BESS Costs: Future cost projections for utility-scale BESS are based on
 a synthesis of cost projections for 4-hour duration systems in Cole and Frazier (2020) 1and the
 Bloomberg New Energy Finance (BNEF) cost projections for utility-scale BESS (BNEF 2019b;
 BNEF 2019a). The Cole and Frazier cost projections are based on a literature survey that
 includes results from 18 studies of BESS costs. The BNEF cost projections are based on learning
 rates and deployment projections for utility-scale BESS that are broken down at the system
 component level. Both projections extend to 2050. Projected battery costs tend to decrease much
 more quickly than other system components such as the inverter, BOS, installation, and soft cost
 components (EPRI 2018; BNEF 2019b; BNEF 2019a; Schmidt et al. 2018). Thus, projected total
 system costs decrease more quickly for longer-duration battery storage than shorter-duration
 battery storage. However, the duration aspect is not captured in the BNEF cost projections,
 which only consider a 4-hour system. The Cole and Frazier (2020) projections contain
 information for both power and duration so costs can be calculated for any storage duration, but
 they do not account for how the different BESS component costs (particularly, the LIB pack
 cost) change over time. Therefore, to account for storage costs as a function of storage duration,

 1
 The report and comparison of 18 projections were developed for use in NREL’s Annual Technology Baseline
 (https://atb.nrel.gov/).

 x
This report is available at no cost from the National Renewable Energy Laboratory (NREL) at www.nrel.gov/publications.
we apply the BNEF battery cost reduction projections to the energy (battery) portion of the 4-
 hour storage and use the Cole and Frazier summary for the remaining component costs to
 develop combined projections for future years. In this way, the cost projections capture the
 rapid projected decline in battery costs while also accounting for component costs decreasing at
 different rates in the future. Figure ES-3 shows the resulting utility-scale BESS future cost
 projections for the Moderate Scenario for 2–10 hours in terms of both $/kWh and $/kW. We
 also explore Advanced and Conservative BESS cost scenarios as shown in Figure 32 (page 43)
 and Figure 33 (page 45).

 Figure ES-3. Utility-scale BESS Moderate Scenario cost projections, on a $/kWh basis (left) and
 a $/kW basis (right)
 Projections assume a 60-MWDC project. Note that 2019 costs correspond to Figure ES-1 and Figure ES-2.

 Current Residential and Commercial/Industrial BESS: Residential and commercial/industrial
 BESS costs are estimated based on BESS combined with solar photovoltaic (PV) systems, or
 PV+BESS system. This is done to provide the dGen model with appropriate costs for these
 typical hybrid systems. In addition, rather than prescribe a system size, we allow the model to
 choose the optimum system size and storage duration. Current costs for residential and
 commercial/industrial BESS and PV+BESS are based on NREL’s bottom-up BESS cost models
 using the data and methodology for commercial/industrial PV systems and BESS in Feldman et
 al. (2021) (see Figure ES-4 and Figure ES-5). We run the models over a range of system sizes
 and storage durations and then develop a correlation for costs by fitting curves to the results.
 Because of the method of optimization used to select PV and battery sizes within the dGen
 model, the correlations are linear functions of system power capacity and energy capacity.

 xi
This report is available at no cost from the National Renewable Energy Laboratory (NREL) at www.nrel.gov/publications.
Figure ES-4. Cost of residential PV-stand-alone, BESS-stand-alone, and PV+BESS systems
 estimated using NREL bottom-up models

 Figure ES-5. Estimated costs of commercial and industrial stand-alone PV, stand-alone BESS, and
 PV+BESS using NREL bottom-up model

 xii
This report is available at no cost from the National Renewable Energy Laboratory (NREL) at www.nrel.gov/publications.
Projected Residential and Commercial/Industrial BESS Costs: For both residential and
 commercial/industrial BESS, future BESS cost projections are based on relative component level
 cost reductions sourced from BNEF (Figure ES-6), which uses learning rates and future capacity
 projections specific to residential BESS systems (BNEF 2019b). Projected costs for
 representative residential BESS, shown in Figure ES-6 and ES-7, are calculated by applying the
 BNEF cost reduction projections to the current costs described above. The resulting Advanced,
 Moderate, and Conservative Scenario cost projections for representative residential and
 commercial/industrial BESS are shown in Figure ES-7.

 Figure ES-6. Relative changes in projected component costs for residential BESS
 Data Source: (BNEF 2019b)

 xiii
This report is available at no cost from the National Renewable Energy Laboratory (NREL) at www.nrel.gov/publications.
Figure ES-7. Moderate, Advanced, and Conservative Scenario cost projections for representative
 residential BESS

 Summary of Storage Technologies and Metrics Comparison
 To be consistent and clear in our analysis of energy storage technologies, Section 2 defines and
 summarizes the key metrics related to energy storage. The metrics needed to quantify electricity
 storage costs differ from those for electricity generation. Electricity generation equipment is
 sized based on only its power capacity, or the amount of power (kW) it can provide to the grid,
 and the equipment is typically costed in capacity terms ($/kW). In contrast, energy storage
 systems are sized based on two factors: their power capacity and their energy capacity, or how
 much energy (kWh) they can store. Energy capacity relative to power capacity (E/P) determines
 a system’s storage duration, or how long it can provide power at its rated power capacity. To
 assess energy storage system costs, one must know both the energy capacity and power capacity
 (or storage duration).

 The data sources for the current technology costs and other parameters used in the comparison in
 Figure ES-8 are based on a variety of sources with ranges of uncertainty, especially in emerging
 technologies (Table ES-1).

 xiv
This report is available at no cost from the National Renewable Energy Laboratory (NREL) at www.nrel.gov/publications.
Table ES- 1. Data Sources for Energy Storage Technologies

 Reference Year for
 Storage Type/Technology Current (2019) Costs Primary Data Source
 Thermal Storage
 Pumped thermal energy storage (PTES) 2020 McTigue et al. In Press
 Electrochemical Storage
 Multiple sources;
 Lithium-ion battery (weighted value) (LIB) 2020
 see References (p. 59)
 Lead-acid battery 2020 Mongird et al. 2020
 Redox flow battery (flow batteries) 2020 Mongird et al. 2020
 Sodium sulfur battery 2018 Mongird et al. 2019
 Sodium metal halide battery 2018 Mongird et al. 2019
 Zinc-hybrid cathode battery 2018 Mongird et al. 2019
 Ultracapacitors 2018 Mongird et al. 2019
 Hydrogen storage (using electrolyzers, 2020 Hunter et al. 2021
 salt caverns, and combustion turbines)b
 Hydrogen storage (using electrolyzers, 2020a Hunter et al. 2021
 salt caverns, and stationary fuel cells)c
 Electromechanical Storage
 Compressed air energy storage (CAES) 2020 Mongird et al. 2020
 Liquid air energy storage (LAES) 2020 Olympios et al. 2021
 Pumped-storage hydropower (PSH) 2020 Mongird et al. 2020
 Flywheel 2018 Mongird et al. 2019
 Gravity 2018 Schmidt 2018
 And [the/a] future year as defined in Hunter et al. 2021
 a
 b Shown in figures in this report as H2 Elec-salt cavern- CT
 c Shown in figures in this report as H2 Elec-salt cavern- FC

 We compare current costs for energy storage by separating the total capital costs for energy storage
 into two components—a power capacity term ($/kW) and an energy component ($/kWh)—and
 then plotting them on the same graph (Figure ES-8). Technology total capital cost ($/kW) for a
 given duration is calculated by multiplying storage duration by the energy capital cost component
 value ($/kWh) and adding the power capital cost component ($/kW). The results demonstrate that
 technologies with high power component costs and low energy component costs are generally
 more economic for long-duration storage applications. Technologies with low power component
 costs and high energy component costs are more appropriate for short-duration storage.
 Technologies with both low power and low energy component costs will be the lowest cost overall.
 LIB, being closest to the origin of the graph, have the lowest power and energy component costs of
 the technologies presented. Being on either side of the dashed line indicates a tendency toward
 power or energy but lower absolute costs could still make one technology a project choice.
 Meanwhile, technologies like hydrogen storage, compressed air energy storage (CAES) and (PSH)
 are close to the y-axis indicating that buying the power “capacity” (MW) is the more expensive
 portion of the project than storing and handling either the water or compressed air, making these
 technologies more suitable for deploying with much longer durations.

 xv
This report is available at no cost from the National Renewable Energy Laboratory (NREL) at www.nrel.gov/publications.
Short-Duration
 Storage

 Figure ES-8. Capital cost for energy ($/kWh) versus capital cost for capacity ($/kW) for
 various technologies
 Energy storage technologies can also be compared across their total capital costs and storage
 durations, as shown in Figure ES-9. In addition to showing the current costs of several
 technologies, the chart demonstrates the changing landscape over 5 years as LIB costs continue
 to decrease. As shown in the chart, LIB is currently the cheapest option at 4 hours of duration
 and are anticipated to continue near-term price reductions. At 4 hours of duration, the non-LIB
 battery types as well as gravity, pumped thermal, and LAES are all significantly more expensive
 than LIBs. Cost reductions for any of these technologies could also occur as the energy storage
 market grows, especially those technologies that are emerging now.

 At over 8 hours of duration, the ratio of energy to duration costs changes such that several
 technologies are at total capital costs comparable to or lower than LIBs. Pumped thermal energy
 storage (PTES) is anticipated to be cheaper that LIB in most cases, and hydrogen storage costs
 become more competitive—especially if future cost improvements are realized as described by
 Hunter et al. (2020). This flip with longer durations indicates several technologies might be
 competitive with LIBs at longer duration. PSH and CAES also enter the picture at longer durations
 on the graph, at costs where it might be expected that they would be deployed more. However, as
 we look to the future and an anticipated decrease in LIB capital costs of an additional 50% from
 current by 2030, the capital cost advantage of most non-LIB technologies decreases resulting in
 LIB capital costs potentially being below the other technologies even at these longer durations.

 xvi
This report is available at no cost from the National Renewable Energy Laboratory (NREL) at www.nrel.gov/publications.
Capital costs alone do not determine energy storage costs. Operational costs, efficiencies and
 lifetimes must also be considered to determine lifetime project costs. Doing so is complicated by
 the fact that these values all depend on how the storage is used in the system (e.g., frequently for
 backup, capacity, and energy time-shifting). We use the levelized cost of storage (LCOS) to
 allow for comparison of technologies that are providing the capabilities discussed in Section 2,
 including four hour, 8-12 hour and long-duration technologies. However, the shortcomings of
 attempting to use a single LCOS to capture the diverse use cases for storage are also highlighted
 in that discussion. These shortcomings make it difficult to compare storage costs in a simplified
 way. This limitation also underscores the need for system wide assessments using capacity
 expansion and production cost models.

 In summary, in this report, we review a variety of energy storage technologies with storage
 durations ranging from minutes to months. We quantified the current costs of those technologies,
 recognizing that energy storage technologies must be described in terms of both their power
 (kW) capacity and energy (kWh) capacity to assess their costs and potential use cases (Section
 2.3). And we examine LIB and PSH costs support the broader modeling activities.

 More information and related data and information associated with this report are available at
 https://www.nrel.gov/analysis/storage-futures.html.

 xvii
This report is available at no cost from the National Renewable Energy Laboratory (NREL) at www.nrel.gov/publications.
H2 (2020)

 LIB (2019)
 LIB (2020)

 PSH (2020)
 LIB (2024) H2 (Future)

 CAES

 Figure ES-9. Total investment cost ($/kW) for a system with 100 MW of storage with varying durations
 Flywheels and ultracapacitors are not included in the figure, as they are deemed to be unsuited for these durations.

 xviii
This report is available at no cost from the National Renewable Energy Laboratory (NREL) at www.nrel.gov/publications.
Table of Contents
 1 Introduction ........................................................................................................................................... 1
 2 Energy Storage Technologies Overview ............................................................................................ 3
 2.1 Reported Metrics ........................................................................................................................... 3
 2.1.1 Round-Trip Efficiency ..................................................................................................... 3
 2.1.2 Response Time ................................................................................................................. 3
 2.1.3 Calendar Life and Cycle Life ........................................................................................... 3
 2.1.4 Degradation ...................................................................................................................... 4
 2.1.5 Technology Readiness Level ........................................................................................... 4
 2.1.6 Total Capital Cost (total $ OR $/kW OR $/kWh) ............................................................ 4
 2.1.7 Capital Cost of Power Capacity ($/kW) ........................................................................... 5
 2.1.8 Capital Cost of Energy ($/kWh)....................................................................................... 6
 2.1.9 Operation and Maintenance: Fixed ($/kW-year) and Variable ($/kWh-year) ................. 6
 2.1.10 Depth of Discharge........................................................................................................... 7
 2.1.11 Levelized Cost of Storage (LCOS) .................................................................................. 7
 2.1.12 Other Metrics ................................................................................................................... 8
 2.2 Caveats of Metrics ......................................................................................................................... 8
 2.3 Impacts of Anticipated Services Provided by Storage Technologies on Technology Selection ... 9
 2.4 Cost and Performance Characteristics of Technologies Considered........................................... 11
 2.4.1 Thermal Storage Technologies....................................................................................... 11
 2.4.2 Electromechanical Technologies.................................................................................... 14
 2.4.3 Electrochemical Technologies ....................................................................................... 17
 2.5 Comparison of Current Costs of Technologies ........................................................................... 24
 3 Battery Energy Storage System (BESS) Cost Assumptions and Projections for Scenario
 Modeling .............................................................................................................................................. 33
 3.1 Sensitivity to Commodity Prices ................................................................................................. 34
 3.2 Utility-Scale BESS ...................................................................................................................... 36
 3.2.1 Current Costs .................................................................................................................. 36
 3.2.2 Utility-Scale PV+BESS.................................................................................................. 39
 3.2.3 Future Cost Projections .................................................................................................. 39
 3.3 Residential BESS ........................................................................................................................ 47
 3.3.1 Current Costs .................................................................................................................. 47
 3.3.2 BESS Future Cost Projections........................................................................................ 51
 3.3.3 PV+BESS Future Costs.................................................................................................. 54
 3.4 Commercial and Industrial BESS................................................................................................ 54
 3.4.1 Current Costs .................................................................................................................. 54
 3.4.2 Future Cost Projections .................................................................................................. 55
 4 Pumped-Storage Hydropower Inputs to ReEDS ............................................................................. 56
 5 Conclusions ........................................................................................................................................ 58
 6 References .......................................................................................................................................... 59

 xix
This report is available at no cost from the National Renewable Energy Laboratory (NREL) at www.nrel.gov/publications.
List of Figures
 Figure ES-1. 2019 U.S. utility-scale LIB storage costs for durations of 2–10 hours (60 MWDC) in $/kWh ix
 Figure ES-2. 2019 U.S. utility-scale LIB storage costs for durations of 2–10 hours (60 MWDC) in $/kW .. x
 Figure ES-3. Utility-scale BESS Moderate Scenario cost projections, on a $/kWh basis (left) and
 a $/kW basis (right) ................................................................................................................. xi
 Figure ES-4. Cost of residential PV-stand-alone, BESS-stand-alone, and PV+BESS systems estimated
 using NREL bottom-up models ............................................................................................. xii
 Figure ES-5. Estimated costs of commercial and industrial stand-alone PV, stand-alone BESS, and
 PV+BESS using NREL bottom-up model ............................................................................. xii
 Figure ES-6. Relative changes in projected component costs for residential BESS.................................. xiii
 Figure ES-7. Moderate, Advanced, and Conservative Scenario cost projections for representative
 residential BESS ................................................................................................................... xiv
 Figure ES-8. Capital cost for energy ($/kWh) versus capital cost for capacity ($/kW) for
 various technologies .............................................................................................................. xvi
 Figure ES-9. Total investment cost ($/kWh) for a system with 100 MW of storage with varying durations
 ............................................................................................................................................. xviii
 Figure 1. Energy storage system nomenclature ............................................................................................ 5
 Figure 2. O&M costs for various storage technologies................................................................................. 7
 Figure 3. Electric system services provided by energy storage .................................................................. 10
 Figure 4. Illustration of CSP with storage................................................................................................... 12
 Figure 5. Image: Trane® Thermal Energy Storage .................................................................................... 13
 Figure 6. Schematic of PTES system or Carnot battery using liquid storage ............................................. 14
 Figure 7. Illustration of CAES system ........................................................................................................ 15
 Figure 8. Schematic of flywheel energy storage system ............................................................................. 16
 Figure 9. Illustration of hydropower pumped storage system..................................................................... 17
 Figure 10. 2019 BNEF battery price survey results (with cell and pack split) ........................................... 18
 Figure 12. Illustration of flow battery system ............................................................................................. 19
 Figure 13. Photo of sodium-metal halide battery ........................................................................................ 20
 Figure 14. Illustration of grid-scale lithium-ion battery system ................................................................. 21
 Figure 15. Past and projected market share of different LIB chemistries through 2030 ............................ 22
 Figure 16. Illustration of hydrogen energy storage system ......................................................................... 24
 Figure 17. Power capacity cost component ($/kW) versus energy capacity cost component ($/kwh) ....... 27
 Figure 18. Total investment cost ($/kW) for a system with 100 MW of storage with varying durations... 28
 Figure 19. Projected newly installed capacity of PSH for scenarios used in HydroVision study............... 30
 Figure 20. Round-trip efficiency of energy storage technologies ............................................................... 31
 Figure 21. Levelized cost of storage ($/kWh) of energy storage technologies included in this study........ 32
 Figure 22. Battery pack prices (real 2019 $/kWh) for different end-use applications ................................ 33
 Figure 23. Expected battery demand by sector and LIB price projections ................................................. 34
 Figure 24. Raw material costs for different LIB chemistries by year ......................................................... 35
 Figure 25. Sensitivity of nickel-manganese-cobalt (811) LIB pack (percentage change) to metal
 components prices .................................................................................................................. 35
 Figure 26. 2019 U.S. utility-scale LIB stand-alone storage costs for durations of 2–10 hours (60 MWDC)
 in $/kWh................................................................................................................................. 38
 Figure 27. 2019 U.S. utility-scale LIB stand-alone storage costs for durations of 2–10 hours (60 MWDC)
 in $/kW................................................................................................................................... 39
 Figure 28. Normalized battery cost projections for 4-hour LIBs, with values relative to 2019 from Cole
 and Frazier (2020) used in this study ..................................................................................... 40
 Figure 29. Methodology for projecting utility-scale BESS costs ............................................................... 41
 Figure 30. Utility-scale BESS Moderate Scenario cost projections, on a $/kWh basis (left) and
 a $/kW basis (right) ................................................................................................................ 42

 xx
This report is available at no cost from the National Renewable Energy Laboratory (NREL) at www.nrel.gov/publications.
Figure 31. Utility-scale BESS Advanced Scenario cost projections, on a $/kW basis and $/kWh basis ... 43
 Figure 32. Utility-scale BESS Conservative Scenario cost projections, on a $/kW basis and $/kWh basis
 ................................................................................................................................................ 43
 Figure 33. Comparison of current and future utility-scale BESS cost estimates from different sources.... 45
 Figure 34. Comparison of utility-scale BESS future cost projections ........................................................ 46
 Figure 35. Cost of residential PV-stand-alone, BESS-stand-alone, and PV+BESS systems estimated using
 NREL bottom-up models ....................................................................................................... 48
 Figure 36. Comparison of current residential BESS total and component costs from NREL and BNEF .. 49
 Figure 38. Relative changes in projected component costs for residential BESS....................................... 52
 Figure 39. Comparison of BNEF and Schmidt et al. (2018) residential BESS installed costs Storage
 Futures Study scenarios with time on a $/kWh basis ............................................................. 53
 Figure 40. Estimated costs of commercial and industrial stand-alone PV, stand-alone BESS, and
 PV+BESS using NREL bottom-up model ............................................................................. 55
 Figure 41. Modeled new PSH resource potential........................................................................................ 57
 Figure 42. National PSH supply curve of capital cost versus cumulative capacity potential ..................... 57

 List of Tables
 Table ES- 1. Data Sources for Energy Storage Technologies .................................................................... xv
 Table 1. Data Sources for Energy Storage Technologies ........................................................................... 26
 Table 2. Utility-Scale LIB Energy Storage Systems Used in SFS modelinga............................................. 37
 Table 3. Residential Storage-Only Modeling Inputs and Assumptionsa ..................................................... 47
 Table 4. Assignment of Component Cost Categories from NREL Model to BNEF Component Cost
 Categories, and Learning Rates Assumed for the Moderate Scenario ................................... 51
 Table 5. Commercial and Industrial LIB Energy Storage Systems: 2019 Model Inputs and Assumptions
 (in 2018 USD) ........................................................................................................................ 54
 Table 6. Energy Storage Technology Data ................................................................................................. 62

 xxi
This report is available at no cost from the National Renewable Energy Laboratory (NREL) at www.nrel.gov/publications.
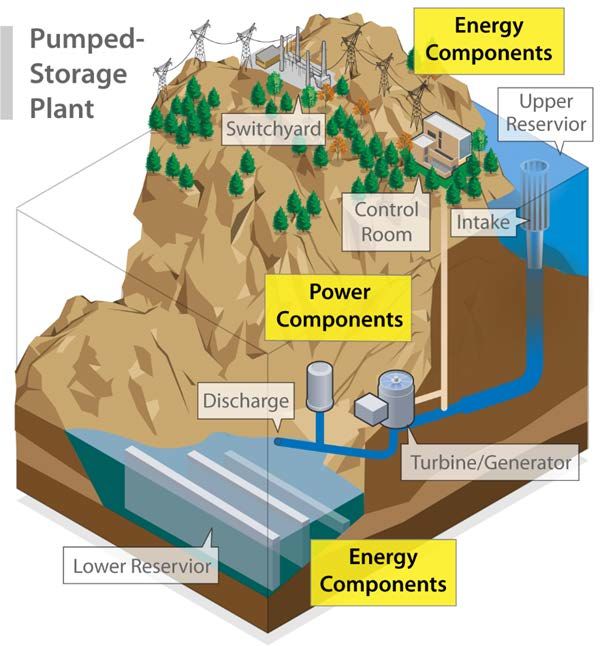
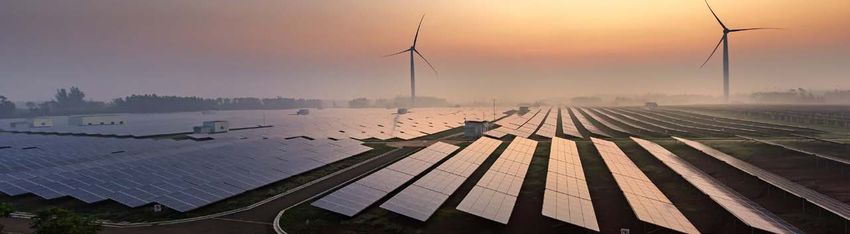
1 Introduction
 Energy storage has been used for hundreds of years to shift thermal energy from day to night and
 from season to season. Originally, this was in the form of thermal energy as large buildings were
 designed with thick walls to mitigate temperature fluctuations to reduce the need for fires. For
 centuries, ice was transported great distances or stored underground from the prior winter to
 preserve food in the summer. More recently, the first pumped hydropower electrical storage
 plant was deployed in 1907 with the first use in the United States by Connecticut Electric and
 Power Company in 1930. 2 Since then, pumped-storage hydropower (PSH) has been the
 dominant form of electricity storage in the United States and globally. However, because of
 recent rapid decreases in grid-scale battery storage costs combined with recent dramatic price
 drops and increased deployment trends for solar photovoltaic (PV) and land-based wind, we
 anticipate an increase in energy storage demand and are already seeing this in the market. Both
 solar PV and land-based wind technologies are variable in their output so the energy they
 generate and supply to the grid will not always match the current demand for energy. As they
 make up a larger portion of total energy generation capacity, this creates potential for significant
 storage being optimally mixed in as these technologies grow in the marketplace.

 The goal of this report is twofold, which is reflected in two parts of the report. The first half of
 the report (Section 2) takes a broad look across a variety of mature and emerging electricity
 storage technologies. The goal of this section is to provide a current understanding of the relative
 capabilities of these technologies, gather information about the system cost and performance, and
 provide background information on storage technologies that will be helpful to stakeholders
 seeking to understand this sector. To do this, we introduce and describe a variety of relevant
 metrics that can be used to compare and contrast energy storage technologies. The second half
 of the report (Sections 3–4) deals with the detailed current and future costs of energy storage
 technologies provided to the models performing future scenarios for the larger Storage Futures
 Study (SFS), of which this report is a part. That section is limited to distributed and grid-scale
 BESS and grid-scale PSH, as these are (1) commercial technologies that already have been
 deployed in the United States and have sufficient available data to inform forward projections
 and (2) the energy storage technologies used in the detailed modeling done in the broader SFS.
 However, because the energy models consider only a few parameters such as cost, storage
 duration, and capacity factor, BESS and PSH function as a proxy for any of the emerging
 technologies that eventually reach comparable cost and performance levels.

 The SFS uses the Regional Energy Deployment System (ReEDS) model and the Distributed
 Generation Market Demand (dGen) model to project grid-scale and distributed capacity
 deployments, respectively. These models and the scenarios used in the SFS guide the boundaries
 of this report. Because they can neither model nor anticipate multiday energy storage needs,
 storage durations for BESS are limited to 10 hours, and PSH plants are assumed to have
 sufficient storage to operate as needed within the diurnal variations represented in the model
 (i.e., 12-hour duration). At this time, energy storage technologies in dGen consist of only

 2
 “A Ten-Mile Storage Battery.” Popular Science, July 1930, p. 60.
 https://books.google.com/books?id=sigDAAAAMBAJ&pg=PA60&dq=1930+plane+%22Popular&hl=en&ei=zxiV
 TtztJ-
 Pr0gGvtu2kBw&sa=X&oi=book_result&ct=result&resnum=2&ved=0CDQQ6AEwATgU#v=onepage&q=1930%2
 0plane%20%22Popular&f=true

 1
This report is available at no cost from the National Renewable Energy Laboratory (NREL) at www.nrel.gov/publications.
distributed BESS technologies, which limits the distributed energy storage technologies we
 explore in this report. ReEDS currently cannot model generation and energy storage hybrid
 systems, so we neither explore or nor include the costs of utility-scale PV+BESS in this report.
 Cost estimates for these systems, which are provided by Feldman et al. (2021) and included here,
 show that the difference between stand-alone and colocated PV and BESS is small and should
 not significantly impact results. Finally, some of the technologies discussed here (LIB in
 particular) have costs and performance that are rapidly changing, so this report may not reflect
 current values. The reader is encouraged to check for updated information before using the
 values and conclusions in this report.

 2
This report is available at no cost from the National Renewable Energy Laboratory (NREL) at www.nrel.gov/publications.
2 Energy Storage Technologies Overview
 This section portrays various energy storage technologies across a variety of metrics. The
 characteristics of each technology are discussed, as is the potential for disruption in the storage
 technology space.

 2.1 Reported Metrics
 Appropriate metrics can be difficult to define for energy storage technologies because of the
 many use cases, values, and configurations of energy storage technologies. Given the range in
 technology scales from massive PSH systems utilizing huge reservoirs that last for decades to
 small grid-enabling technologies that discharge in sub-second increments, comparing these
 technologies and the growing role that they all are pursuing is daunting. Here we have gathered a
 variety of metrics with which we seek to compare technologies. This set of metrics will not
 determine the full value of the storage technologies within the grid or behind the meter; other
 parts of the SFS will perform those functions. Here we do hope to supply metrics and present
 information that helps set the energy storage landscape for the reader.

 2.1.1 Round-Trip Efficiency
 The round-trip efficiency (RTE) is equal to the energy supplied by the storage device during the
 discharge phase divided by the energy provided to the device during the charging phase. This
 metric is dramatically different across technologies we consider in this report, as it ranges from
 27% for hydrogen systems including combustion turbines (page 17) to 92% for ultracapacitors.
 Additionally, CAES adds natural gas to the compressed air prior to the combustion turbine to
 increase power output and so RTEs for CAES are sometimes reported to be greater than one.
 While RTE is just one component of the overall cost equation, a low RTE for a technology
 requires that all the other cost components (e.g., capital cost, O&M, project development, and
 construction time) be lower for the technology to be competitive. Raising the RTEs of
 technologies—but especially those with significant losses—through R&D can provide
 significant benefits in cost-effectiveness.

 2.1.2 Response Time
 Response time is defined as the time that it takes a storage system to go from rest to rated output.
 Response times for battery systems are typically around 1 second (with the battery system design
 allowing that to be slightly shorter or longer). PSH and CAES and other mechanical systems
 have longer response times (Mongird et al. 2019), which may or may not matter depending on
 the grid services being provided by the resource.

 2.1.3 Calendar Life and Cycle Life
 Calendar life is defined as the lifetime of the system absent degradation that is due to cycling.
 Cycle life is defined as the number of charge-discharge cycles a system can go through in its
 useful lifetime. When a system is being cycled, the lesser of the calendar life or the cycle life
 determines the actual lifetime of the system. Significant cycling will lead to an actual lifetime
 that is much shorter than the calendar life of the storage device. Note that full or partial
 replacement of battery cells or packs can extend both calendar and cycle life.

 3
This report is available at no cost from the National Renewable Energy Laboratory (NREL) at www.nrel.gov/publications.
2.1.4 Degradation
 Degradation is the decrease in technology performance with time and/or the number of
 charge/discharge cycles. Degradation is a critical metric, as some technologies degrade strongly
 with use, including LIB. Other technologies indicate that with appropriate O&M, their
 degradation is negligible. Degradation can be a strong function of how the storage technology is
 used and cycled, thus making it nonlinear with both time and usage. The levelized cost of storage
 (LCOS) equation described in Section 2.1.11 (page 7) incorporates the impact of these
 degradation rates over the lifetime of a system. The LCOS equation includes several degradation
 rates, including the calendar degradation and cycling degradation. Degradation is most impactful
 for batteries and chemical systems. Mechanical, thermal systems, and electromechanical systems
 broadly have minimal degradation each year. This has been shown over many decades with PSH
 specifically in that its lifetime is assumed to be 40 years or more in ReEDS. Finally, not
 including the degradation of a storage system (or conversely not accounting for upgrades during
 the lifetime to augment the storage system) can lead to incorrect dispatch (i.e., dispatching to
 capture arbitrage values insufficient to compensate for accelerated aging of the system).

 2.1.5 Technology Readiness Level
 A technology readiness level (TRL) is a common metric for assessment of R&D needs and
 technology potential that categorizes the extent to which a technology has been developed. DOE
 (2011) defines nine technology readiness levels:

 • TRL 1: Basic principles observed and reported
 • TRL 2: Technology concept and/or application formulated
 • TRL 3: Analytical and experimental critical function and/or characteristic proof of
 concept
 • TRL 4: Component and/or system validation in laboratory environment
 • TRL 5: Laboratory-scale, similar system validation in relevant environment
 • TRL 6: Engineering/pilot-scale, similar (prototypical) system validation in relevant
 environment
 • TRL 7: Full-scale, similar (prototypical) system demonstrated in relevant environment
 • TRL 8: Actual system completed and qualified through test and demonstration
 • TRL 9: Actual system operated over the full range of expected mission conditions

 The TRL level of technologies can be very important for these analyses and for assessing the
 cost uncertainty as many of the technologies being discussed here have not been piloted yet, let
 alone developed either individually in a large commercial facility or as part of a supply chain.

 2.1.6 Total Capital Cost (total $ or $/kW or $/kWh)
 As discussed above, storage technologies have both a power component cost and an
 energy/duration component cost. The total capital cost includes the cost of all of the initial
 investment to build the system. This includes not only the equipment but also installation; project
 development; engineering, procurement, and construction (EPC); customer acquisition; and other
 costs. The total capital cost can be described in terms of total cost ($), power capacity ($/kW) or
 energy capacity ($/kWh). The storage duration (in hours) can be used to convert between total
 capacity cost on a power or energy basis. For this reason, comparisons of total capital costs for
 technologies must consider storage duration. Note that in this analysis, we use the nameplate

 4
This report is available at no cost from the National Renewable Energy Laboratory (NREL) at www.nrel.gov/publications.
capacity for costing and not the “usable” 3 capacity. We should also note that we use the
 nameplate capacity of storage systems when we determine capital costs.

 A common nomenclature for what is included in the total capital cost is important. Different cost
 values reported in literature describe various portions of the overall cost. Below in Figure 1, we
 provide a diagram that structures some of the nomenclature for energy storage systems. In the
 diagram, from Mongird et al. (2020), key acronyms include ESS (energy storage system), ESB
 (energy storage block), and ESBOS (energy storage balance of system). This nomenclature is
 important throughout this report, as other publications refer only to the capital cost of the core
 storage component and do not include the other costs needed to use an energy storage system.

 Figure 1. Energy storage system nomenclature

 2.1.7 Capital Cost of Power Capacity ($/kW)
 As discussed above, storage technologies have both a power component cost and an
 energy/duration component cost. When used as a specific cost component, this metric— the
 capital cost of power capacity—speaks to the relative cost of building out the capacity
 independent of the duration of the storage system. This is the portion of the installed cost of
 a technology that can be attributed to equipment that converts energy to electricity and delivers
 it to the grid. This cost component will need to be combined with the capital cost of energy
 capacity ($/kwh; 2.1.8) to calculate the total capital cost (Section 2.1.6, page 4). In some
 systems, such as PSH, the power capacity capital cost is the majority of the overall cost with the

 3
 Usable capacity refers to the capacity of energy storage when practical constraints are considered. For example, a
 10-kWh battery that operates assuming a 90% depth of discharge has a usable storage capacity of 9 kWh.

 5
This report is available at no cost from the National Renewable Energy Laboratory (NREL) at www.nrel.gov/publications.
You can also read