Uqalo Research - Formal Retail in sub-Saharan Africa February 2016 - EIU Canback
←
→
Page content transcription
If your browser does not render page correctly, please read the page content below
Uqalo Research

Formal Retail in sub-Saharan Africa
             February 2016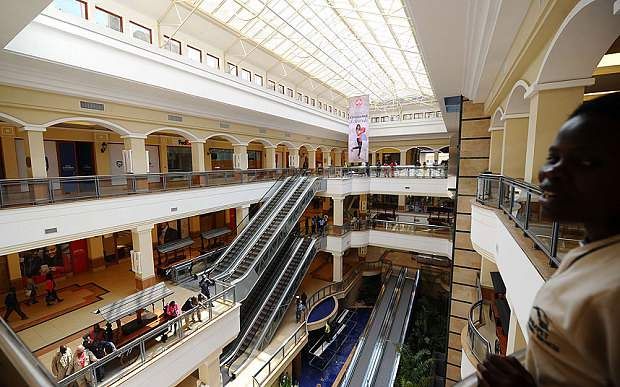
Background

As mature markets slow and African economies develop, global retailers increasingly see the
potential of Africa.   Although much has been written about specific markets and certain
segments, there are few comprehensive reports about international brands expanding into sub-
Saharan Africa.

As a specialist sub-Saharan consumer sector investor, this expansion is of particular interest to us.
We have therefore researched and illustrated the current state of formal retail in sub-Saharan
Africa as well as opportunities for the future. We are pleased to make our research publicly
available through our website, www.uqalo.com.

Uqalo Advisory (Pty) Ltd

February 2016
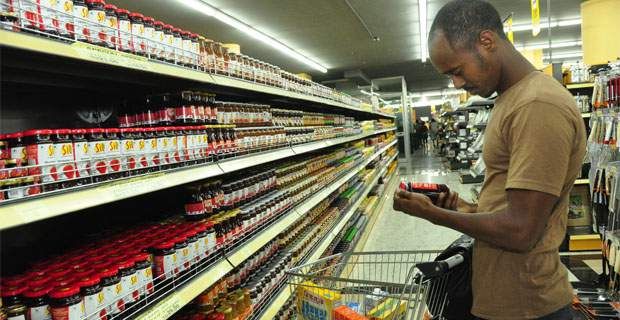
Table of Contents

1.    Executive Summary                                                                      7
2.    Our approach and sources                                                               9
3.    Glossary                                                                              10
4.    Introduction                                                                          11
5.    The Geographical Opportunity in Sub-Saharan Africa (SSA)                              13
6.    Entering and Operating in SSA                                                         17
     6.1     West African Franchise Groups                                                  18
     6.2     East African Franchise Groups                                                  19
     6.3     South African Franchise Groups                                                 20
     6.4     Middle Eastern Franchise Groups                                                21
7.    Formal retail - Sizing and Opportunity                                                22
     7.1     Nigeria                                                                        31
     7.2     Kenya                                                                          39
     7.3     Ghana                                                                          46
     7.4     Ethiopia                                                                       52
8.    Grocery Retailers in SSA                                                              55
     8.1     First Movers                                                                   56
     8.2     Gradualists                                                                    64
     8.3     New Players                                                                    69
     8.4     Explorers                                                                      70
9.    Apparel Retailers in SSA                                                              71
     9.1     First Movers                                                                   71
     9.2     Gradualists                                                                    79
     9.3     New Players                                                                    81
     9.4     Explorers                                                                      82
10.        Opportunities                                                                    83
     10.1     Regional Opportunities                                                        83
     10.2     Sector Opportunities                                                          84
11.        Acknowledgements                                                                 85
12.        Appendix                                                                         86
     13.1 Photographs of Formal Retail in SSA                                               86
13.        References                                                                       90

                                                                                        3
Formal Retail in sub-Saharan Africa.                     February 2016. www.uqalo.com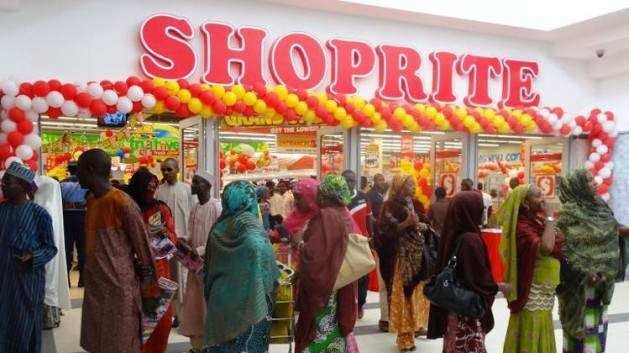
Table of Figures

Figure 1: SSA Map                                                                                   13
Figure 2: Regional Map of SSA                                                                       14
Figure 3: Regional Differences in SSA                                                               14
Figure 4: Regional Country Selections                                                               15
Figure 5: Retailer Considerations for SSA                                                           16
Figure 6: Retail Models for SSA – Pros and Cons                                                     17
Figure 7: West African Franchise Groups                                                             18
Figure 8: East African Franchise Groups                                                             19
Figure 9: South African Franchise Groups                                                            20
Figure 10: Middle Eastern Franchise Groups                                                          21
Figure 11: Size of Formal Retail in Selected SSA Countries                                          22
Figure 12: Retail Development Markers (US$ GDP Per Capita)                                          23
                                                  2
Figure 13: Comparison of Formal Retail Space (m )                                                   24
Figure 14: Formal Retail Sizing in Select SSA Markets                                               25
Figure 15: Formal Retail Space in SSA Compared to Other Developing Markets                          26
Figure 16: Retail Space Growth 2010 – 2014 in SSA (Excluding SA)                                    26
Figure 17: Comparing Formal Retail Space within SSA (Excluding SA)                                  27
Figure 18: Mall Sizing in the USA Compared to SSA                                                   27
Figure 19: Developments Coming on Stream by 2019                                                    28
Figure 20: Monthly Rentals in Uqalo’s Countries of Focus                                            29
Figure 21: Consumer Spending in Select SSA Markets                                                  30
Figure 22: Nigeria Duty and VAT Rates (2015)                                                        31
Figure 23: Retail Sales Growth in Nigeria 2009 – 2019 (US$m)                                        32
Figure 24: Retail Sales Splits in Nigeria 2014                                                      32
Figure 25: Non-Grocery Specialist Sales Splits in Nigeria (2014 US$)                                33
Figure 26: Current and Forecast Grocery and Apparel/Footwear Sales in Nigeria                       33
Figure 27: Nigerian Grocery and Apparel Retailers as of 2014                                        34
Figure 28: Pricing in Shoprite Nigeria as Compared to South Africa                                  35
Figure 29: Major Nigerian Properties                                                                36
Figure 30: Major Nigerian Property Developments in the Pipeline                                     36
Figure 31: Average Monthly Rents in Nigeria                                                         37
Figure 32: Kenya Duty and VAT Rates (2015)                                                          39
Figure 33: Retail Sales Growth in Kenya 2009 – 2019 (US$m)                                          40
Figure 34: Retail Sales Splits in Kenya 2014                                                        40
Figure 35: Non-Grocery Specialist Sales Splits in Kenya (2014 US$)                                  41

                                                                                                    4
Formal Retail in sub-Saharan Africa.                                 February 2016. www.uqalo.com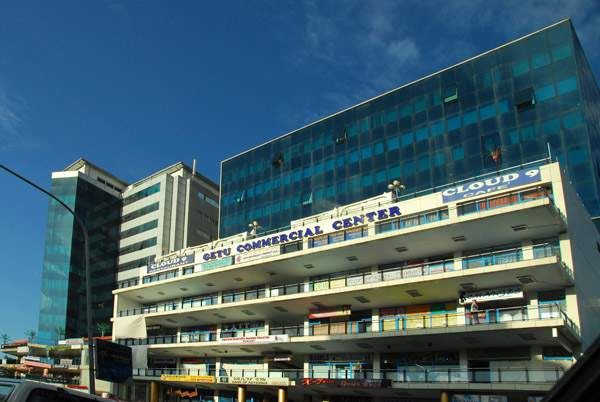
Figure 36: Current and Forecast Grocery and Apparel/Footwear Sales in Kenya                      41
Figure 37: Kenyan Grocery and Apparel Retailers as of 2014                                       42
Figure 38: Comparing Game Pricing in Kenya and South Africa                                      43
Figure 39: Major Kenyan Properties                                                               43
Figure 40: Major Kenyan Property Developments in the Pipeline                                    44
Figure 41: Average Monthly Rentals in Kenya                                                      45
Figure 42: Ghana Duty and VAT Rates (2015)                                                       46
Figure 43: Retail Sales Growth in Ghana 2009 - 2018 (US$)                                        47
Figure 44: Retail Sales in Ghana 2013                                                            47
Figure 45: Non-Grocery Sales in Ghana (2013 US$)                                                 48
Figure 46: Current and Forecast Grocery and Apparel/Footwear Sales in Ghana                      48
Figure 47: Comparing Shoprite Prices in Ghana and South Africa                                   49
Figure 48: Major Ghanaian Retail Properties                                                      50
Figure 49: Major Ghanaian Property Developments in the Pipeline                                  50
Figure 50: Ethiopia Duty and VAT Rates (2015)                                                    52
Figure 51: Key Ethiopian Grocery Retailers                                                       53
Figure 52: Food and Beverage Sales in Uqalo’s Countries of Focus (2014 US$)                      55
Figure 53: Comparative Store Numbers for Shoprite and Massmart in SSA (ex SA), 2014              55
Figure 54: Shoprite Africa Footprint and Store Count                                             56
Figure 55: Shoprite 2010 - 2015 Financial Information                                            57
Figure 56: Massmart Africa Footprint                                                             58
Figure 57: Massmart 2010 – 2014 Financial Information                                            59
Figure 58: Choppies Africa Footprint                                                             60
Figure 59: Choppies 2014 Sales Splits                                                            60
Figure 60: Choppies 2014 Financial Information                                                   61
Figure 61: Kenyan Retail Groups Footprint and Sales Data                                         62
Figure 62: Percentage Retail Value Share Across Channels in Kenya                                63
Figure 63: Pick n Pay Africa footprint                                                           64
Figure 64: Pick n Pay 2012 - 2015 Financial Information                                          64
Figure 65: Fruit & Veg City Africa footprint                                                     66
Figure 66: Spar Africa Footprint and Store Count                                                 67
Figure 67: Spar International 2014 Financial Information                                         68
Figure 68: Mr Price 2013 - 2015 Financial Information                                            71
Figure 69: Mr Price Africa footprint and Store Count                                             72
Figure 70: Truworths Africa Footprint and Store Count                                            73
Figure 71: Truworths 2013 - 2015 Financial Information                                           73
Figure 72: Woolworths Africa Footprint                                                           75

                                                                                                 5
Formal Retail in sub-Saharan Africa.                              February 2016. www.uqalo.com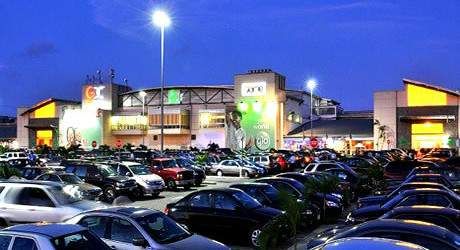
Figure 73: Pepkor Africa Footprint 76
Figure 74: Edcon Africa Footprint and Store Count 77
Figure 75: The Foschini Group Africa Footprint and Store Count 79
Figure 76: The Foschini Group 2013 - 2015 Financial Information 79
Figure 77: Palms Mall in Lagos, Nigeria 86
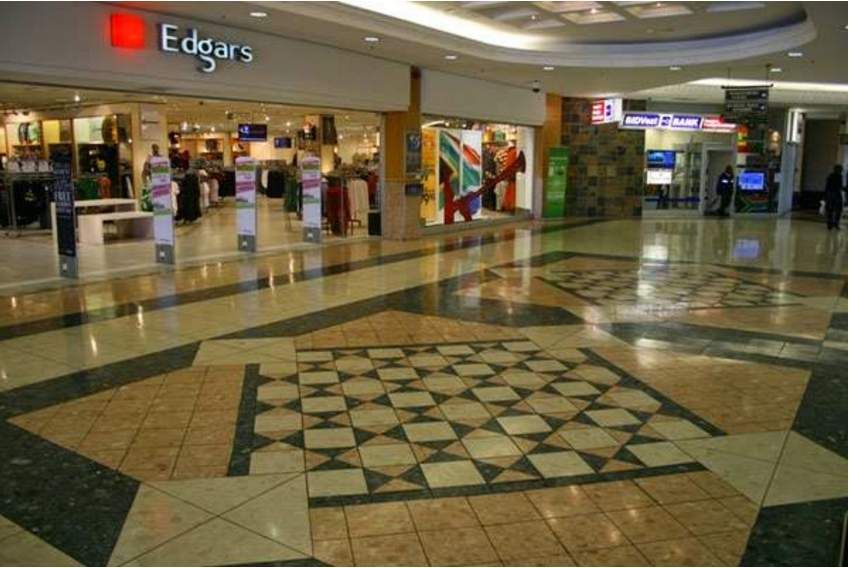
Figure 78: Westgate Mall in Nairobi, Kenya 86
Figure 79: West Hills Mall in Accra, Ghana 87
Figure 80: Getu Commercial Centre in Addis Ababa, Ethiopia 87
Figure 81: Shoprite in Nigeria 88
Figure 82: Nakumatt in Kenya 88
Figure 83: Mango in Ghana 89
Figure 84: Shoa Hypermarket in Ethiopia 89
6
Formal Retail in sub-Saharan Africa. February 2016. www.uqalo.com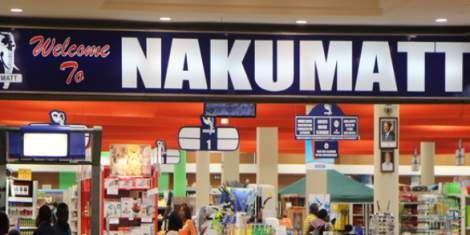
1.    Executive Summary

This research report describes in some detail the relatively underdeveloped formal retail
landscape in sub-Saharan Africa and the extent to which developers, brands and retailers are
responding to the opportunity.

What conclusions can be drawn at this early stage?

Until recently, the Africa Rising story was justifiably hot, stoked by economic growth and a
consequential real rise in consumer demand across SSA.

But even then there were questions about the size of the opportunity and doubts about the
extent to which African economies had broken free of their reliance on natural resources.

The recent wobble in global economies, and in China in particular, has affected all the economies
in SSA, even the net resource importers.       And while regional growth is still attractive, the
consumer opportunity in the short term is less interesting than it was.

In the medium term, the opportunity is considerable because the extent of formal retail is
woefully inadequate to meet the needs of a growing and informed consumer class demanding a
better shopping experience.

We believe that the opportunity at the pinnacle of the consumption pyramid is overstated and
that much more attention should be given to the value end of the market.

With the exception of South Africa, there is a paucity of formal retail space throughout SSA.
Whilst developers are bringing malls on stream quite quickly, and there is real demand from
retailers for this new space, developments in SSA are extremely expensive on a comparative basis.
We question the affordability of mall space and believe that developers need to consider cheaper
and more accessible options such as strip malls.

Infrastructure in SSA is a major impediment to developers, retail operators and consumers alike.
Airports, ports, rail, roads, custom facilities, transport and warehousing are all inadequate.
Infrastructural development is patchy and will be an inhibitor for the foreseeable future.

                                                                                               7
Formal Retail in sub-Saharan Africa.                        February 2016. www.uqalo.com
Corruption, both great and small, is pervasive throughout the supply chain and it is questionable
whether, in some countries, any single consumer product can be imported without a corrupt
payment taking place.

It’s difficult for foreign retailers to enter SSA on their own and its equally difficult for them to find
suitable partners.

The new African consumer is online and informed. Brands and branding really matter.

African consumers are prepared to support new brands, particularly local brands, if they are
properly promoted and offer value for money.

While South African brands entered SSA early, with a handful of exceptions, notably Shoprite and
Mr Price, they have not really captured the imagination and attention of African consumers.
Many South African fashion brands have uninspiring and relatively expensive offerings and,
because they don’t spend on advertising, they risk being overwhelmed by global and local brands
in future.

Because physical retail is so difficult, expensive and inaccessible, E-commerce will be more
important, more quickly, than in developed economies.

Brands need to find ways of accessing consumers through the 80%+ of retail which is still
conducted informally. Regardless of the pace of the growth of formal retail in SSA, the informal
market will remain important to the middle class consumer.

                                                                                                       8
Formal Retail in sub-Saharan Africa.                           February 2016. www.uqalo.com
2.    Our approach and sources

This report features detailed research about formal retail in Nigeria, Ghana, Kenya, and Ethiopia,
which are Uqalo’s countries of investment focus.

In conducting our research we paid due regard to publicly available information. We used annual
reports and published information for the context. We purchased data from Euromonitor and
Nielsen and Sagaci Research granted us access to parcels of information about Ethiopia. All these
sources are cited in this report where applicable.

We interviewed executives responsible for planning the expansion of many African and
international retailers into the sub-Sahara region. We also interviewed property developers and
managers in South Africa, Ghana, Nigeria and Kenya. We have combined our findings from these
interviews. Broll and Knight Frank provided key information about certain markets.

Using these inputs we have assessed upcoming formal retail opportunities and estimated the
2020 size of formal retail space in sub-Saharan Africa. We have ignored online retail as we intend
to research this separately in 2016.

The information and opinions contained in this report come from public sources and proprietary
discussions with sources believed to be reliable, but no representation or warranty, express or
implied, is made that any of it is accurate, complete or up to date and it should not therefore be
relied upon for any purpose.

                                                                                                9
Formal Retail in sub-Saharan Africa.                       February 2016. www.uqalo.com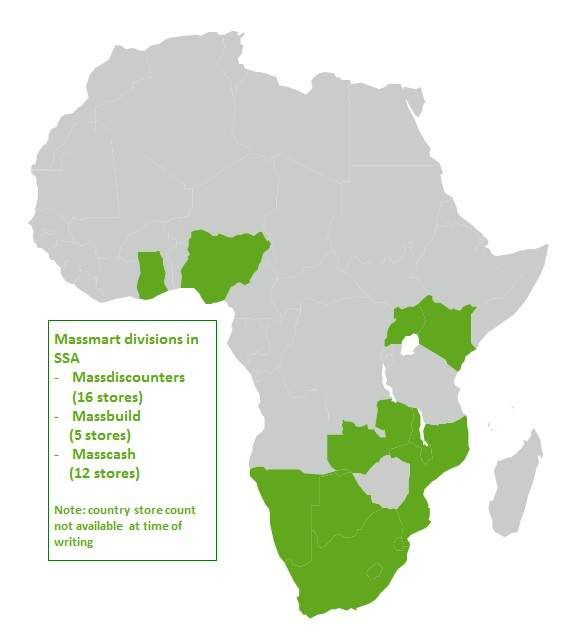
3.      Glossary

Abbreviation                                                    Meaning
Bn                                                              Billion
CAGR                                                            Compound Annual Growth Rate
DBI                                                             World Bank’s Doing Business Index
DC                                                              Distribution centre
EAC                                                             East African Community
FMCG                                                            Fast moving consumer goods
GLA                                                             Gross Lease Area
HQ                                                              Headquarters
M                                                               Million
Non-Grocery Specialist                                          Retail outlets selling predominantly non-
                                                                grocery consumer goods1
SA                                                              Republic of South Africa
SADC                                                            South African Development Community –
                                                                member states are Angola, Botswana,
                                                                Democratic Republic of Congo, Lesotho,
                                                                Madagascar, Malawi, Mauritius, Mozambique,
                                                                Namibia, Seychelles, South Africa, Swaziland,
                                                                Tanzania, Zambia and Zimbabwe2
SKU                                                             Stock keeping unit
SSA                                                             Sub-Saharan Africa
tn                                                              Trillion
VAT                                                             Value Added Tax

1 Euromonitor definition.
2 South African Development Community. http://www.sadc.int/about-sadc/overview/sadc-objectiv/.

                                                                                                            10
Formal Retail in sub-Saharan Africa.                                        February 2016. www.uqalo.com
4. Introduction
In the past ten years Africa has become the world’s second fastest growing region with an average
annual growth rate of 5.1%.3 In 2014, Africa’s 54 countries had a combined GDP of US$2.4tn,4
higher than India and on par with Brazil.
The continent as a whole is forecast to continue being the second fastest growing region for the
next ten years,5 and to have a population of 1.3bn people by 20206, when consumer spending is
predicted to be US$1.4tn with 128 million households having discretionary spending income.7
Formal retail has been developing across the continent. For the purposes of our research, we
consider formal retail to be regulated retail taking place under a roof. This includes malls,
shopping centres, convenience stores and hypermarkets. We refer to unregulated retail, on
tabletops or in open air markets, as ‘informal’ retail.
Agencies segment Africa into North Africa and sub-Saharan Africa (SSA.) South Africa is included in
SSA data but is generally considered to be a developed economy. Retailers often view South
Africa and SSA as two entirely separate regions. In this report we consider them separately when
possible.
Historically, retailers have extended their operations from the Middle East into North Africa. The
region has around 1m m2 of mall space8, including developments in most major cities. Most
international retailers we surveyed have not successfully moved their operations from North
Africa into SSA.
South Africa, with a population of 53 million and 23m m2 of retail space,9 has been seen as a
springboard for retailers into both Africa and SSA. However, strong domestic competition and
apparel import duties of 45% make South Africa unattractive.
Increasingly retailers are considering moving directly into SSA, as previous hurdles to retail have
slowly been reduced, mall developments have emerged and economic growth has been strong
and is forecast to remain so over the next few years.
3 Susan Lund, A. (2012). 10 things you didn't know about Africa's economy. The Independent. Retrieved 12 October 2015, from
http://www.independent.co.uk/news/business/analysis-and-features/10-things-you-didnt-know-about-africas-economy-
8113876.html
4 World Bank GDP 2014 data and Uqalo analysis. Retrieved 8 October 2015, from
http://data.worldbank.org/indicator/NY.GDP.MKTP.CD.
5 McKinsey & Company. (2014). Lions on the move. The Japan-Africa Business Forum 2014. Retrieved 10 October 2015 from
http://www.afdb-org.jp/file/japan/bf2014/main_forum/1.%20Mr.%20Adam%20Kendall_McKinsey%20and%20Company.pdf
6 United Nations Department of Economic and Social Affairs. (2015). World Population Prospects - Population Division - United
Nations. Retrieved 28 September 2015, from http://esa.un.org/unpd/wpp/DataQuery/
7 Lions on the Move Ibid.
8 Hyprop Investments Limited. (2013). Hyprop Investments Limited Interim Results 2013. Presentation. Retrieved 20 October 2015
from http://www.slideshare.net/AfricanisCool/hyprop-investments-limited-sa-hy-2014-financial-results-presentation
9 Eichstadt, R., & Holmes, S. (2015). Too much retail space in South Africa? Deutsche Bank Markets Research.
11
Formal Retail in sub-Saharan Africa. February 2016. www.uqalo.comQuantifying formal retail space in SSA is difficult. Malls are of various grades and property
managers often differ on the definition of a mall. No single source has comprehensive data on
space. Our report uses information from Deutsche Bank, Broll, Sagaci Research and Knight Frank
to provide an overview of the size of formal retail in SSA.
Here we focus on African and international retailers, including brand principals. We consider
African retailers as those headquartered in an African nation with a presence in more than one
sub-Saharan African country. International retailers are those which retail goods on the continent
but are not headquartered in Africa.
All the retailers covered in this report have stores in more than one SSA country. We examine the
own store, franchise, joint venture and acquisition models. We focus on grocery and apparel
because these have typically been the first sectors in which formal retail has developed in sub-
Saharan Africa. Lastly, we have concentrated our research on mass market brands and retailers.
12
Formal Retail in sub-Saharan Africa. February 2016. www.uqalo.com5. The Geographical Opportunity in Sub-Saharan Africa (SSA)
Sub-Saharan Africa (SSA) is made up of 48 different countries with vastly different cultures,
languages and governments. Despite all the differences, the region’s attractive GDP growth and
favourable demographic profile have stimulated the interest of retailers.
2014 SSA (including South Africa) at a glance:
- 937 million people10
- Population growth of 3% per annum to 202511
- US$2 100 nominal GDP per capita12
- 120 million people spending between US$5-20 per day13
Figure 1: SSA Map
Source: World Bank
10 World Bank. (2015) Sub-Saharan Africa (developing only) Data. Retrieved from http://data.worldbank.org/region/SSA
11 United Nations Department of Economic and Social Affairs. (2015). World Population Prospects - Population Division - United
Nations. Retrieved 23 August 2015, from http://esa.un.org/unpd/wpp/DataQuery/
12 Data.worldbank.org,. (2015). Sub-Saharan Africa (developing only) Data. Retrieved 19 August 2015, from
http://data.worldbank.org/region/SSA
13 African Development Bank (2015.) The Middle of the Pyramid: Dynamics of the Middle Class in Africa. (p. 23). Retrieved from
http://www.afdb.org/fileadmin/uploads/afdb/Documents/Publications/The%20Middle%20of%20the%20Pyramid_The%20Middle%20
of%20the%20Pyramid.pdf
13
Formal Retail in sub-Saharan Africa. February 2016. www.uqalo.comRetailers looking at SSA often divide it into West Africa, East Africa and the South African
Development Community (SADC).
Figure 2: Regional Map of SSA
*ECOWAS
**EAC
***SADC
Source: Uqalo
* ECOWAS: Economic Community of West African States
** EAC: East African Community
*** SADC: Southern African Development Community
Figure 3: Regional Differences in SSA
East Africa West Africa SADC
- A history of formal retail - Formal retail is a fairly - Extension of South African
new concept retail opportunities
- Affinity to Asian brands14
- Affinity to Western brands - South African brands most
- More existing well known
developments - Most fashion conscious
- Rentals typically in local
currency
Source: Uqalo
14 The Business of Fashion. (2012). Global Briefing | Could Africa be the Next Frontier for Fashion Retail? Retrieved 4 October 2015,
from http://www.businessoffashion.com/articles/intelligence/global-briefing-could-africa-be-the-next-frontier-for-fashion-retail
14
Formal Retail in sub-Saharan Africa. February 2016. www.uqalo.comIn these three regions, retailers typically see an immediate opportunity in only one or two
countries, which include:
Figure 4: Regional Country Selections
East Africa West Africa SADC
Country Kenya Nigeria Ghana South Africa
Johannesburg
Cities Nairobi Lagos Accra
Cape Town
Most formalised
Low barriers to Second highest GDP in
retail market
Highest GDP in SSA; entry and easy SSA; 23m m2 of retail
outside of South
180m population; to do business; space; developed retail
Africa; high rates
Attraction aspirational consumers high environment and
of GDP per
familiar with brands urbanisation infrastructure
capita and
consumer
spending
Source: Uqalo
As formal retail in South Africa is more advanced than the rest of SSA, retailers usually research
SSA and South Africa separately.
15
Formal Retail in sub-Saharan Africa. February 2016. www.uqalo.comThe retailers we interviewed who are already operating in SSA agreed that certain criteria are
critical when setting up operations in SSA, including:
Figure 5: Retailer Considerations for SSA
Source: Uqalo Interviews
To measure ease of doing business, most analysts refer to the World Bank’s Doing Business Index
(DBI), which ranks 189 countries. Most countries in SSA are in the bottom quartile with only seven
countries in the top 100.15
15 World Bank Group. (2015). Ranking of economies - Doing Business – World Bank Group. Retrieved 20 August 2015, from
http://www.doingbusiness.org/rankings
16
Formal Retail in sub-Saharan Africa. February 2016. www.uqalo.com6. Entering and Operating in SSA
Retailers have the following options:
• Own stores
• Joint Venture
• Franchise
• Acquisition
Grocery retail acquisitions, such as Walmart’s purchase of Massmart in 2010, are a ready made
way to enter a new market. However, few companies are available for purchase and those that
are available are expensive.
Figure 6: Retail Models for SSA – Pros and Cons
Model Examples Pros Cons
- Control
Shoprite - Leverage own supply - Most risk
Own stores
Woolworths chain and brand - Lack of local knowledge
management
- Difficult to find a suitable
Carrefour - Partners have local partner
Joint venture
knowledge - Partner management
issues
- Least risk
Fruit & Veg City - Less control over brand
- Way to test new
Franchise Tommy Hilfiger - Difficult to find a suitable
markets and potential
franchisee
longer term partners
- Valuation
- Speed to market
Acquisition Choppies - Previous governance
- Local knowledge
- Integration
Source: Uqalo Interviews
Most South African apparel retailers first entered SSA with a franchisee but as their businesses
grew, many of them have chosen to convert to a direct operating model.
Most international retailers in SSA started with a joint venture or franchise partner. Both
developers and retailers emphasize the importance of finding the correct franchise partner as:
• The number of skilled franchise operators is limited
• Few have the necessary funding
• Few understand international brands
• They may already have existing partnerships in the same category
17
Formal Retail in sub-Saharan Africa. February 2016. www.uqalo.comA flexible franchise model is critical. Currently most brands have multiple franchisees in different
SSA regions because no single franchise group is capable of covering the whole region.
We highlight local and international franchise groups in the following sections.
6.1 West African Franchise Groups
Figure 7: West African Franchise Groups
Smartmark/
Franchisee Persianas Retail Fast Forward Fox Business Artee
Fashion
Headquarters Nigeria Nigeria Nigeria Nigeria
Nigeria, Côte
Countries of operation Nigeria Nigeria, Ghana Nigeria
d’Ivoire
Nike, Tommy
Hilfiger, Swatch,
Hugo Boss,
TM Lewin,
Puma, Max Mango, Celio,
Brands Converse, Spar
Fashions, Enzo
Levi’s, United
Lacoste
Colours of
Benetton
Part of
Persianas Smaller player
Property Group; Broad range of in Nigeria but Building own
Key information
ability to put brands very strong in properties
brands into own Côte d’Ivoire
malls
Sources: Information from company websites and trade data; Uqalo interviews
Other smaller franchisees in Nigeria include
• Styles, Trends and Fashion Limited – Wrangler
• Ofocent Limited – Pierre Cardin
• Mopheth Sports – Adidas
• Audacious Business Concept – Jones Inc. (Nine West, Anne Klein)16
16 Horne, M. (2015). The Future of Retail in East Africa. Presentation, Nairobi, Kenya. Retrieved 24 October 2015 from
http://download.eapisummit.com/2015_presentations/011_Malcolm_Horne.pdf
18
Formal Retail in sub-Saharan Africa. February 2016. www.uqalo.com6.2 East African Franchise Groups
Most East African franchisees are based in Kenya.
Figure 8: East African Franchise Groups
Franchisee Deacons Nakumatt Manix
Headquarters Kenya Kenya Kenya
Kenya, Tanzania, Kenya, Tanzania,
Countries of operation Kenya
Uganda Uganda, Rwanda
Mr Price, Mr Price Levi's, Polo,
Home, Bossini, Pringle, Baumler,
Woolworths (SA), Clarks, Skechers, Pepe Jeans
Brands
Truworths, Adidas London, Gini &
Babyshop, Adidas, Jony, Little
4U2, Angelo Kangaroo
Strongest retailer in
Smaller owner-
Largest franchise East Africa; looking
Key information managed franchise
group in East Africa to diversify its
group
portfolio
Sources: Information from company websites and trade data; Uqalo interviews
19
Formal Retail in sub-Saharan Africa. February 2016. www.uqalo.com6.3 South African Franchise Groups
South African franchise groups often secure the rights to operate within SADC and use their South
African supply chains to bring goods into new markets.
Figure 9: South African Franchise Groups
Franchisee Busby Edcon Stuttafords Surtee
South Africa,
Countries of
South Africa South Africa Botswana, South Africa
operation
Namibia
Topshop*,
Aldo, Forever
Topman*, Tom
New, GUESS,
Tailor, Dune Tommy Hilfiger, Hugo Boss,
Karen Millen,
Brands London, Ted Baker, Gap, Lacoste, Paul
Mango*,
TM Lewin, Lucky Banana Republic Smith
Topshop*,
Brand, Calvin
Topman*
Klein, Mango*
Has mono brand
Large number of stores in addition Mono brand
Shop in shop in its
Key mono brand to multi-brand in stores; focus on
department
information stores in key Edgars premium and
stores
malls department luxury brands
stores
Sources: Information from company websites and trade data; Uqalo interviews
* Busby Group and Edcon joint venture.
Fashion retailer, the Foschini Group, also operates mono brand stores on behalf of some
international brands, such as G-Star.
20
Formal Retail in sub-Saharan Africa. February 2016. www.uqalo.com6.4 Middle Eastern Franchise Groups
Middle Eastern franchise groups have started to enter SSA and are an option for international
retailers looking for a partner for SSA.
Figure 10: Middle Eastern Franchise Groups
Franchisee Majid al Futtaim Alshaya Azadea
United Arab Emirates
Headquarters Kuwait UAE
(UAE)
Kuwait, Saudi Arabia, Algeria, Bahrain,
UAE, Oman, Kuwait,
UAE, Qatar, Bahrain, Cyprus, Iraq, Jordan,
Qatar, Bahrain, Jordan,
Countries of Lebanon, Jordan, Oman, Kuwait, Lebanon,
Lebanon, Iraq, Georgia,
operation Morocco, Iraq, Russia, Oman, Qatar, Saudi
Pakistan, Saudi Arabia,
Turkey, Poland, Czech Arabia, UAE, Egypt,
Egypt, Kenya
Republic, Egypt Ghana
Mothercare,
Debenhams, H&M,
American Eagle Inditex, Decathlon,
Outfitters, Next, Gap, Gymboree,
Carrefour, Vox
Brands Topshop, River Island, Mango, Mango Man,
Cinemas
Express, Massimo Dutti,
Jack Wills, Dorothy Max Mara, Superdry
Perkins,
Miss Selfridge, Oasis
Operating in Kenya Operating in Ghana
Not yet in SSA but
with Carrefour. Plan to with Mango, Payless
SSA information looking at both West
extend mall ownership Shoes and Sunglass
and East Africa
to SSA Hut
Sources: Information from company websites and trade data; Uqalo interviews
21
Formal Retail in sub-Saharan Africa. February 2016. www.uqalo.com7. Formal retail - Sizing and Opportunity
Scope of Formal Retail
For most Africans, ‘retail’ still means open air markets. Only 20% of retail in sub-Saharan Africa is
yet formal.17
Figure 11: Size of Formal Retail in Selected SSA Countries
SSA#
Nigeria#
Ghana#
Ethiopia#
Kenya#
South#
Africa#
0%# 10%# 20%# 30%# 40%# 50%# 60%# 70%# 80%# 90%# 100%#
Formal#Retail#Channel#%# Informal#Retail#Channel#%#
Source: Euromonitor, Nielsen
Most formal retail takes place in malls or smaller shopping centres,18 which have largely been
developed in the past five years. Informal traders have the advantage of not having to pay the
duties, rentals or infrastructure costs. Duty rates in SSA fluctuate, particularly for apparel.
Apparent import duty is a comparatively low 20% in Nigeria, but 45% in South Africa.
17 Nielsen. (2015). Africa: How to Navigate the Retail Distribution Labyrinth (p. 5). Nielsen. Retrieved from
http://www.nielsen.com/content/dam/nielsenglobal/ssa/docs/reports/2015/africa-report-navigating-the-retail-dist-labyrinth-feb-
2015.pdf.
18 AT Kearney. (2015). The 2015 African Retail Development Index (p. 4). AT Kearney. Retrieved from
https://www.atkearney.com/documents/10192/6437503/Retail+in+Africa.pdf/b038891c-0e81-4379-89bb-b69fb9077425
22
Formal Retail in sub-Saharan Africa. February 2016. www.uqalo.comGlobal research shows that retail is activated when GDP per capita reaches US$750 and grows
exponentially above US$3 000.19
Figure 12: Retail Development Markers (US$ GDP Per Capita)
Source: McKinsey & Company
By 2020, more than 80% of SSA countries will have crossed the US$750 GDP per capita threshold
and 33% of those will be over the US$3 000.20
Formal Retail Space
In SSA, formal retail is developing cyclically. As developers build malls in new regions to diversify
their portfolios, consumers are introduced to formal retail and concomitantly demand more.
However, lack of available real estate currently impedes formal retail development and, for some
retailers, forms a barrier to entry to SSA.
Current Retail Space
Given the size and population of SSA, it has little formal retail space. Of the 48 countries that
make up SSA, only 25 have modern mall developments. There is 25.4m m2 of retail gross leasable
are in sub-Saharan Africa but 23 m2 of this is in South Africa. With a population of 54 million,
South Africa has a GLA nearly 10 times that of SSA, which has a population 17 times greater.
19 Hattingh, D., Russo, B., Sun-Basorun, A., & Van Wamelen, A. (2015). The Rise of the African Consumer (p. 4). Johannesburg:
McKinsey & Company. Retrieved from
http://www.mckinsey.com/~/media/mckinsey%20offices/south%20africa/pdfs/rise_of_the_african_consumer-
mckinsey_africa_consumer_insights_center_report.ashx
20
2015 World Economic Outlook Dataset and Uqalo analysis. Data set Retrieved from
https://www.imf.org/external/pubs/ft/weo/2015/01/weodata/download.aspx
23
Formal Retail in sub-Saharan Africa. February 2016. www.uqalo.com2
Figure 13: Comparison of Formal Retail Space (m )
Source: Deutsche Bank, Knight Frank, Broll, Sagaci Research
24
Formal Retail in sub-Saharan Africa. February 2016. www.uqalo.comQuantifying formal retail space in SSA is difficult as grades and types of developments vary.
21
Figure 14: Formal Retail Sizing in Select SSA Markets
Total Number of Space CAGR Mall density
GLA 2014
Country Number of new malls 2006 - (m2 per 1000
(m2)
malls 2014 2006 - 2014 201422 people)
Angola 87 667 9 8 36% 3.62
Botswana 282 936 28 16 18% 127.45
Ghana 74 064 5 5 23% 2.76
Kenya 350 000 24 14 7% 7.8
Lesotho 70 492 4 3 28% 33.42
Malawi 27 095 3 2 24% 1.62
Mozambique 56 001 6 3 25% 2.06
Namibia 429 366 39 39 11% 178.69
Nigeria 171 500 10 10 22% 0.97
Rwanda 68 000 5 5 6% 6
South Africa 23 046 165 1 942 947 8% 426.78
Swaziland 28 750 5 2 2% 22.65
Tanzania 61 000 4 4 5% 1.18
Uganda 167 000 12 10 22% 4.42
Zambia 109 361 18 13 15% 6.96
Total 25 393 640 2 145 1 081 8.9% 32.25
Total (ex SA) 2 347 475 203 166 26% 4.23
Sources: Deutsche Bank, Knight Frank, Broll, Sagaci Research
Outside South Africa, mall densities are very low, averaging less than 3.2m2 per 1 000 people
across the 24 SSA countries with formal retail space.
This is low compared to other developing markets. Brazil, Mexico and Turkey all have more space,
despite having populations of up to a tenth of the size. India’s population and GDP per capita are
similar to SSA but it too has more formal retail space.
21 Data in the top part of the table has been calculated from information provided by Deutsche Bank and Knight Frank. The bottom
part of the table has been calculated from Broll’s EAPi Summit presentation in Nairobi, Kenya in April 2015. When no historical data
has been located we have left the space blank and have not calculated CAGR or factored into the overall CAGR growth rate.
22 Calculated where historical data was available.
25
Formal Retail in sub-Saharan Africa. February 2016. www.uqalo.comFigure 15: Formal Retail Space in SSA Compared to Other Developing Markets
Source: Deutsche Bank, Knight Frank, Broll Research, Sagaci Research
Although still small, formal retail developments in SSA have doubled over the past five years and
are expected to double again by 2020 as demand for high calibre space exceeds supply.
Figure 16: Retail Space Growth 2010 – 2014 in SSA (Excluding SA)
Size of Retail Space in SSA 2010 Size of Retail Space in SSA 2014 CAGR 2010 - 2014
(m2) (m2)
1 148 337 2 347 475 20%
Source: Deutsche Bank, Knight Frank, Broll Research, Sagaci Research
In 2014 there were 203 malls in SSA, and the most in any one market was 39. Many large brands
say this is simply not enough to support the critical mass needed for a large rollout. A brand
wanting to open 10 stores has very limited options in SSA at the moment.
There is still significant room for growth in countries with existing developments. Nigeria’s formal
retail market is underdeveloped given the size of its population and GDP per capita. Both Kenya
and Ghana have space to expand. Zambia is close to being saturated.
26
Formal Retail in sub-Saharan Africa. February 2016. www.uqalo.comFigure 17: Comparing Formal Retail Space within SSA (Excluding SA)
Source: Deutsche Bank, Knight Frank, Broll Research, Sagaci Research
Mall developments in SSA are often smaller than in other countries - typically 15 000 – 25 000 m2.
As a comparison, malls in the United States are on average four times larger. 23 Larger
developments have started appearing in SSA in the last two years. Developers tend to buy large
plots of land and develop the malls in phases to be in sync with the uptake in demand.
Figure 18: Mall Sizing in the USA Compared to SSA
Source: International Council of Shopping Centres
23 International Council of Shopping Centers. (2015). 2013 Economic Impact Of Shopping Centers (pp. 9-11). Retrieved from
http://www.icsc.org/uploads/default/2013-Economic-Impact.pdf
27
Formal Retail in sub-Saharan Africa. February 2016. www.uqalo.comWith the exception of London-based Actis, South African real estate funds were the first to
develop malls in SSA, and, from 2007 to 2015, more than US$2bn was committed by all of them.
There are more than 15 South African SSA real estate funds.24 Middle Eastern and European funds
made an appearance in 2015.
1 million m2 is currently due to come on stream in SSA by 2019, with more than half of this in East
Africa. Of this space, 35 new development properties are currently planned for second and third
tier cities in SSA.25 Some plans will expand existing malls while others will test new formats such
as strip malls. Developers find that building a mall in SSA takes a minimum of 24 months.
Figure 19: Developments Coming on Stream by 2019
West Africa East Africa SADC
Total space 316 000 m2 750 000 m2 175 000 m2
Angola: 95 000 m2
Ghana – 125 000 m2
Specific Markets Kenya – 400 000 m2 Mozambique: 45 000m2
Nigeria – 191 000 m2
Zambia – 35 000 m2
Source: Deutsche Bank, Knight Frank, Broll Research, Sagaci Research
Apart from size constraints, formal retailing in SSA faces other challenges. Developers and
retailers alike are learning to appreciate regional differences. The first modern mall in Nigeria, The
Palms Lagos, initially struggled to convert spectators into shoppers as consumers were
overwhelmed by the perceived luxury of the space. Consumers considered visiting malls as an
outing. Air conditioning levels had to be reduced as consumers did not enjoy the cold. Formal
retail in SSA remains a learning process for developers, retailers and consumers alike.
Rentals
High land and building costs result in mall construction in SSA costing four times that of South
Africa. Building a shopping mall in Nigeria costs an average of US$4 109/m2.26 Funding tends to be
in US dollars because most countries lack local funding and developers charge dollarised rentals to
recoup their investment. Dollarised rentals are one of the most contentious issues for SSA
retailers. When the local currency depreciates, as frequently happens, this is particularly
challenging. In the future mall owners are expecting to shift to a hybrid model in which rents are
paid in local currency pegged to the dollar.
24 Lewis, A. (2015). Emerging Beyond the Frontier: Presentation to the ICSC Industry Summit for SSA..
25 Games, D. (2015). Urbanisation positions property as key building block in Africa. BDlive. Retrieved from
http://www.bdlive.co.za/opinion/columnists/2015/08/31/urbanisation-positions-property-as-key-building-block-in-africa
26 Developing a Shopping Mall in Nigeria Costs $4,109 per square meter. (2015). Estate Intel. Retrieved from
http://www.estateintel.com/developing-a-modern-mall-in-nigeria-costs-4000-per-square-meter/
28
Formal Retail in sub-Saharan Africa. February 2016. www.uqalo.comMonthly rentals across 21 SSA countries average US$39/m2, with Angola having the highest at
US$120 and Malawi the lowest at US$13.527.
Figure 20: Monthly Rentals in Uqalo’s Countries of Focus
Average monthly Rent escalation
Rents (US$/m2) per annum
Ethiopia 25 n/a
Ghana 48 5%
Kenya 42 6%
Nigeria 63 6%
Source: Broll, Knight Frank, Uqalo analysis
SSA Consumer Habits
Although there are countless differences in consumer habits within and between SSA regions and
countries, retailers have found that consumers are similarly:
• Brand conscious, particularly of international brands.
• Aspirational
• Fashion focused
• Brand loyal, even if the price is slightly higher
• Informed and discerning about quality
• Price sensitive28
27 Rental information from Knight Frank and Uqalo analysis. Rental information from Knight Frank (2015). Africa Report 2015. Knight
Frank Research Reports. Retrieved from http://content.knightfrank.com/research/155/documents/en/africa-report-2015-2802.pdf
28 Hattingh, D., Russo, B., Sun-Basorun, A., & Van Wamelen, A. (2015). The Rise of the African Consumer (p.6). Johannesburg: McKinsey
& Company. Retrieved from
http://www.mckinsey.com/~/media/mckinsey%20offices/south%20africa/pdfs/rise_of_the_african_consumer-
mckinsey_africa_consumer_insights_center_report.ashx
29
Formal Retail in sub-Saharan Africa. February 2016. www.uqalo.comMost of SSA consumer spending is on food and beverage. Spending on apparel varies.
Figure 21: Consumer Spending in Select SSA Markets
Source: EIU Canback
The following details formal retail in the SSA countries of particular investment interest to Uqalo,
namely Nigeria, Kenya, Ghana and Ethiopia.
30
Formal Retail in sub-Saharan Africa. February 2016. www.uqalo.com7.1 Nigeria
Economic Overview
Nigeria has the largest population and GDP in SSA.
Nigeria With a highly urbanised population, it is difficult
for international retailers to ignore the
GDP US$570bn
opportunity.
Population 177m
Urbanization Rate 47% Dependence on oil makes growth volatile. In 2015
Nigeria recorded its slowest growth in a decade. 29
DBI Score 170
The country’s first peaceful change of democratic
government in April 2015 ushered in a new
president intent on creating a diversified and less
corrupt economy.
Legal Framework and Restrictions
An eight year ban on importing apparel was lifted in December 2011,30 although the ban remains
for footwear and bags. Since footwear typically comprises 15% of an apparel retailer’s total sales,
trading densities, and therefore profitability, are lower than they should be in Nigeria.
Figure 22: Nigeria Duty and VAT Rates (2015)
Duty VAT
FMCG 20-35% Largely exempt
Apparel 20% 5%
31
Source: Nigerian Department of Customs
Frequent changes in government policy have been disruptive. Most recently, in an attempt to
stabilise the currency, the Central Bank prohibited access to the Nigerian forex market for certain
products. Importers of 41 items32 including clothing and textiles are required to fund imports
using their own funds. At time of writing, many retail stores are severally understocked as a
result. Retailers have indicated that they will be forced to close if this is not resolved soon.
29 Bala-Gbogbo, E., Ibukun, Y., & Cohen, M. (2015). Investors' Love Affair With Nigeria Wanes as JPMorgan Cuts Bonds.
Bloomberg.com. Retrieved 28 September 2015, from http://www.bloomberg.com/news/articles/2015-09-10/investors-love-affair-
with-nigeria-wanes-as-jpmorgan-cuts-bonds
30 Nigeria Customs Service. (2011). Removal of some items from revised import prohibition list. Retrieved from
https://www.customs.gov.ng/Publications/news_results.php?NewsID=132
31 Nigeria Customs Service. (2015). Nigeria Customs Administration. Retrieved 22 October 2015, from
https://www.customs.gov.ng/Tariff/index.php
32 Central Bank of Nigeria. (2015). Inclusion of some imported goods and services on the list of items not valid for foreign exchange in
the Nigerian Foreign Exchange Markets. Retrieved from http://www.cenbank.org/Out/2015/TED/TED.FEM.FPC.GEN.01.011.pdf
31
Formal Retail in sub-Saharan Africa. February 2016. www.uqalo.comRetail Overview
Figure 23: Retail Sales Growth in Nigeria 2009 – 2019 (US$m)
Source: Euromonitor
In 2014 Nigeria recorded formal retail sales of US$57bn. Formal retailing has grown 12%
compound 12% over the past five years and is forecast to grow at 15% compound over the next 5
years to reach US$117bn by 2019. Despite this, informal retail still accounts for 98% of sales in
Nigeria.33
Figure 24: Retail Sales Splits in Nigeria 2014
Source: Euromonitor
33
Nielsen. (2015). Africa: How to Navigate the Retail Distribution Labyrinth (p. 13). Nielsen. Retrieved from
http://www.nielsen.com/content/dam/nielsenglobal/ssa/docs/reports/2015/africa-report-navigating-the-retail-dist-labyrinth-feb-
2015.pdf.
32
Formal Retail in sub-Saharan Africa. February 2016. www.uqalo.comNon-grocery is the largest component of formal retail spending in Nigeria, and purchase of
electronic items accounts for most of this.
Figure 25: Non-Grocery Specialist Sales Splits in Nigeria (2014 US$)
Source: Euromonitor
The grocery and apparel/footwear sectors have both shown strong growth over the past five
years, and are forecast to grow even faster through to 2019.
Figure 26: Current and Forecast Grocery and Apparel/Footwear Sales in Nigeria
2014 Sales 2009 – 2014 2019 Forecast 2014 – 2019
(US$bn) CAGR Sales (US$bn) Forecast CAGR
Grocery 25 10% 48 14%
Apparel and Footwear 7 18% 17 20%
Source: Euromonitor
33
Formal Retail in sub-Saharan Africa. February 2016. www.uqalo.comKey Players
Figure 27: Nigerian Grocery and Apparel Retailers as of 2014
Grocery
Sales Number of Selling Space Market Share
Retailer HQ
(US$m) stores (m2) (% retail value)
Shoprite South Africa 432 14 48 300 1.7%
Park n Shop South Africa 140 5 9 400 0.6%
Spar Netherlands 85 6 10 000 0.3%
Addide Nigeria 71 23 6 900 0.3%
Apparel
Mr Price South Africa 54 6 6 000 0.8%
Twice as Nice Nigeria 46 27 2 900 0.7%
Fast Forward Nigeria 31 13 2 300 0.4%
Source: Euromonitor
Nigeria has a large number of retailers but, as of 2014, none has a dominant market share.
Market Dynamics
By 2020 consumers in Lagos are expected to account for US$25bn in household spending.34
Nigerian consumers are a good target market for most mass market retailers: they tend to be
highly aspirational and many are well travelled, particularly to the UK. Many have an affinity for
UK brands and products. One of the challenges Woolworths South Africa faced in Nigeria was
consumer's confusing its brand with its UK namesake, which has a very different value proposition
and offering. Many Nigerian women travel to London and return with suitcases of clothes to sell
to acquaintances and the second hand clothing market is a strong competitor to formal retail.
34 Thompson, C. (2015). No easy money to be made from Nigerian shoppers. Financial Times. Retrieved from
http://www.ft.com/intl/cms/s/0/0001d31a-bb16-11e3-948c-00144feabdc0.html#axzz3nzQxkQ9t
34
Formal Retail in sub-Saharan Africa. February 2016. www.uqalo.comIn Nigeria prices are twice those in South Africa.
Figure 28: Pricing in Shoprite Nigeria as Compared to South Africa
SA Prices Nigerian %
Product
(US$) Price (US$) difference
Heinz Baked Beans 0.74 1.35 182%
Tastic Rice (1kg) 1.15 4.86 423%
Frisco Coffee 750g 4.77 5.12 107%
Palmolive Shampoo 350ml 1.34 3.31 247%
Kellogg’s cornflakes (500g) 2.08 5.52 265%
Basket total 10.08 20.16 200%
Canal Walk, Cape Town and Palms, Lagos
ZAR/USD and NRN/USD exchange rates based on rate on October 13, 2015.
Source: Uqalo
35
Formal Retail in sub-Saharan Africa. February 2016. www.uqalo.comRetail Property
There is currently 1 m2 of retail space for every 1 000 people in Nigeria.35 There are major
developments in cities across Nigeria, although most are in Lagos and Abuja.
Figure 29: Major Nigerian Properties
Retail Year
Development City Anchor tenant Retail Tenants
m2 opened
Game, Shoprite, Hugo Boss, Mango,
Palms Lagos 20 000 2005
Genesis Cinemas Nike, Puma36
Shoprite, Silverbird Mr Price, Nike, Max
Ikeja City Mall Lagos 22 000 2011
Cinemas Fashion37
Polo Park Mall Lagos 27 000 2011 Shoprite Puma, Swatch38
Ado Bayero Mall Kano 25 000 2013 Shoprite, Game Adidas39
Delta City Mall Warri 13 800 2015 Shoprite Mr Price, Jet40
Source: Broll, company websites
Many of the existing malls in Nigeria, such as the Palms are now being extended.
Figure 30: Major Nigerian Property Developments in the Pipeline
Development City Retail m2 Opening Anchor tenant Developer
Jabi Lake Abuja 25 000 Oct 2015 Shoprite, Game Actis41
Owerri City Mall Owerri 13 000 Dec 2015 Shoprite Resilient42
Circle Mall Lagos 14 000 Dec 2015 Shoprite RMB Westport43
Lekki Mall Lagos 22 000 April 2016 Shoprite, Game Novare44
Abeokuta Mall Abeokuta 15 600 April 2014 Shoprite Resilient45
Source: Broll, company websites
35 PricewaterhouseCoopers. (2015). Building the future of Africa (p. 42). Retrieved from https://www.pwc.co.za/en/assets/pdf/real-
building-the-future-of-africa-brochure-2-mar-2015.pdf
36 Persianas Group. (2015). The Palms, Lagos | Persianas Group. Retrieved 10 October 2015, from http://www.persianasgroup.com/
37 Ikejacitymall.com.ng. (2015). ICM | Official Website. Retrieved 13 October 2015, from http://www.ikejacitymall.com.ng/
38 Persianas Group. (2015). Palms Polo Park, Enugu | Persianas Group. Retrieved, from http://www.persianasgroup.com/
39 Kay, C., & Kew, J. (2015). Gun-Toting Guards at Newest Nigerian Mall in Safety Push. Bloomberg Business. Retrieved from
http://www.bloomberg.com/news/articles/2014-07-03/gun-toting-guards-at-newest-nigerian-mall-in-safety-push
40 Resilient Africa. (2015). Portfolio. Retrieved 29 October 2015, from http://resilientafrica.com/portfolio/
41 Actis. (2015). Actis | Jabi Lake Mall. Retrieved 11 October 2015, from http://www.act.is/portfolio/JabiLakeMall
42 Resilient Africa. (2015). Portfolio. Retrieved 29 October 2015, from http://resilientafrica.com/portfolio/
43 RMB Westport. (2015). Circle Mall, Nigeria | Current Development Projects | RMB Westport. Retrieved 17 October 2015, from
http://www.rmbwestport.com/current_project_OsapaConvenience.asp
44 Novare Equity Partner. (2015). Novare | Pioneers in investment management in Africa | Projects. Retrieved 17 October 2015, from
http://www.novareequitypartners.com/projects/#lekkie-mall
45 Resilient Africa. (2015). Portfolio. Retrieved 29 October 2015, from http://resilientafrica.com/portfolio/
36
Formal Retail in sub-Saharan Africa. February 2016. www.uqalo.comBy the end of 2015 Nigeria will have 22 malls across ten cites totalling 277 000 m2 of retail space,
with 48% of this in cities outside of Lagos and Abuja.46 There are 25 new shopping centres under
development47 and these are expected to range between 12 000 – 15 000 m2 in size. Many will
have Shoprite as their anchor.48 Given the difficulty of traveling in Lagos, developers believe that
catchment areas in the city can be limited to a radius of 5 kilometres.
Rentals are often dollarised although the Central Bank of Nigeria officially bans this practice.49
Rentals average US$63/m2 but anchor tenants pay less. Rent on leases must be paid either
annually or every 2-3 years in advance.50
Figure 31: Average Monthly Rents in Nigeria
Tenant Type Typical Rental (US$/m2)
Anchor 30
National Retailer 60
Other Retailers 100
Source: Uqalo interviews
Store Costs
Store opening costs are in the region of US$1.5m. Nigeria has one of the poorest power
generation networks in the world with the DBI ranking it at 187 out of 189 countries. Power from
the national grid is typically only available for 10% of the day, making privately owned generators
a necessity. Generators are very costly and retailers report that electricity, as a percentage of
sales, is four times higher than in South Africa. This alone squeezes profitably and results in higher
prices for consumers. Retailers can spend up to 5% of store sales on power.
46 Broll. (2015). Nigeria Retail Sector February 2015. Lagos. Retrieved from http://www.broll.com.ng/uploads/files/File/nigeria-retail-
sector-feb-2015.pdf
47 AT Kearney. (2015). The 2015 African Retail Development Index (p. 7). AT Kearney. Retrieved from
https://www.atkearney.com/documents/10192/6437503/Retail+in+Africa.pdf/b038891c-0e81-4379-89bb-b69fb9077425
48 Mantshantsha, S. (2015). SA business in Nigeria: Opportunity and issues. Financial Mail. Retrieved from
http://www.financialmail.co.za/coverstory/2015/05/28/sa-business-in-nigeria-opportunity-and-issues
49 Central Bank of Nigeria. (2015). The use of foreign currency as a medium of exchange in Nigeria. Retrieved from
http://www.cenbank.org/out/2015/ccd/cbn%20press%20statement%20070415.pdf
50 Knight Frank (2015). Africa Report 2015 (p. 15). Knight Frank Research Reports. Retrieved from
http://content.knightfrank.com/research/155/documents/en/africa-report-2015-2802.pdf
37
Formal Retail in sub-Saharan Africa. February 2016. www.uqalo.comSupply Chain
Supply chain is critical because there is very little relevant local agriculture or reliable
manufacturing. Imports require product specific import licenses, so retailers must use local import
agents. Fulfilment rates from agents are often low and retailers cannot be confident of deliveries.
Once a retailer reaches critical mass (typically 20 stores) they will look to build a local distribution
centre to alleviate this problem.
The largest port in Nigeria is in Lagos and is at capacity. Local retailers say that, even with the help
of clearing agents, goods can take weeks to clear. Apparel retailers often fly in goods because
clearing customs this way only takes 10 days.
Heavily congested roads make traveling even short distances challenging. A journey of only 5km
can take over two hours. This is not only an issue for transporting goods but also for attracting
customers to malls.
Product Selection
Nigerians are extremely brand conscious and due to their long exposure to goods produced in the
West, they also care greatly about product origin.51 British and American brands can achieve a
premium pricing relative to other brands. Local Nigerians brands are, however, well accepted.
Nigeria has more or less one season due to its tropical, humid climate and “winter” temperatures
of 25°C. Stocking a light winter correctly can be a challenge.
Traditional clothing is typically brightly coloured and Nigerians look for this in formal retail.
Apparel retailers find that both male and female sizing is larger in Nigeria.
Retailer Thoughts
Despite attractive macroeconomic factors, Nigeria is a highly complex and challenging market.
South African retailers Woolworths and Truworths both closed their Nigerian operations in 2013,
citing that the market was not yet mature enough for modern retail.
Local knowledge is all-important and therefore they need to employ local managers.
Grocery retailers are hopeful that the oil price collapse will stimulate a new focus on developing
local agriculture and manufacturing.
51 AT Kearney. (2015). The 2015 African Retail Development Index (p. 7). AT Kearney. Retrieved from
https://www.atkearney.com/documents/10192/6437503/Retail+in+Africa.pdf/b038891c-0e81-4379-89bb-b69fb9077425
38
Formal Retail in sub-Saharan Africa. February 2016. www.uqalo.com7.2 Kenya
Economic Overview
Kenya is appealing to international retailers. It is part of
the East African Community (EAC), a single market of
Kenya 143m people. Ranked in the top third of SSA countries by
the DBI, Kenya has the fourth highest GDP. GDP per capita
GDP US$61bn is attractive at US$2 890 in a country of 46m people.
Population 46m
With a relatively stable political climate and its Vision
Urbanization Rate 25% 2030 development programme, Kenya should be a middle
DBI Score 136 income nation by 2030. A possible brake is domestic
terrorism, in the form of Al-Shabaab, the orchestrators of
the 2013 attack in Nairobi’s Westgate Mall in which 67
people were killed. At the time of writing the group
continues to wreak violence across the region.52
Legal Framework and Restrictions
Kenya has very few laws regulating retail and selling below cost is legal. There are currently no
prohibitions on importing mass market or grocery items into the country.53
Figure 32: Kenya Duty and VAT Rates (2015)
Duty54 VAT55
FMCG 25% 16%
Apparel 25% 16%
Source: East Africa Community Tariff Rates, Kenyan Revenue
Authority
52 Stewart, C. (2015). Nairobi Westgate mall attack: Shopping centre re-opens two years after terror siege where al-Shabaab killed 67
people. The Independent. Retrieved from http://www.independent.co.uk/news/world/africa/nairobi-westgate-attack-shopping-mall-
reopens-two-years-after-terror-siege-where-alshabaab-killed-67-people-10389082.html
53 Kenya Ministry of Trade and Industry. Nairobi. Retrieved from
https://www.kenyaembassy.com/pdfs/handbookimportingexporting.pdf
54 East African Community. (2015). Common External Tariff. Retrieved from
http://www.eac.int/customs/index.php?option=com_docman&task=doc_download&gid=126&Itemid=106
55 Kenya Revenue Authority. (2015). KRA - What is Value Added Tax. Retrieved 11 September 2015, from
http://www.kra.go.ke/vat/aboutvat.html
39
Formal Retail in sub-Saharan Africa. February 2016. www.uqalo.comRetail Overview
Figure 33: Retail Sales Growth in Kenya 2009 – 2019 (US$m)
Source: Euromonitor
Kenya’s informal retail sector is estimated at 70% of trade.56 Nearly 90% of food and grocery sales
occur in informal markets.57 In 2014, having grown at 8% pa compound in the previous five years,
formal retail was almost US$14bn. This should grow at 11% compound to 2019 when formal retail
sales will reach US$23bn.
Figure 34: Retail Sales Splits in Kenya 2014
Source: Euromonitor
56 Nielsen. (2015). Africa: How to Navigate the Retail Distribution Labyrinth (p. 13). Nielsen. Retrieved from
http://www.nielsen.com/content/dam/nielsenglobal/ssa/docs/reports/2015/africa-report-navigating-the-retail-dist-labyrinth-feb-
2015.pdf.
57 KPMG. (2013). Africa's Consumer Story (p. 12). Retrieved from https://www.kpmg.com/Africa/en/IssuesAndInsights/Articles-
Publications/General-Industries-Publications/Documents/Africa's%20Consumer%20Story.pdf
40
Formal Retail in sub-Saharan Africa. February 2016. www.uqalo.comGrocery is the largest spend. Non-grocery purchases are primarily apparel and footwear.
Figure 35: Non-Grocery Specialist Sales Splits in Kenya (2014 US$)
Source: Euromonitor
Both grocery and apparel have shown high single digit growth over the past five years and apparel
is forecast to have double digit growth by 2019.
Figure 36: Current and Forecast Grocery and Apparel/Footwear Sales in Kenya
2014 Sales 2009 – 2014 2019 Forecast 2014 – 2019
(US$bn) CAGR Sales (US$bn) Forecast CAGR
Grocery 8 8% 12 8%
Apparel and Footwear 4 9% 7 15%
Source: Euromonitor
41
Formal Retail in sub-Saharan Africa. February 2016. www.uqalo.comKey Players
Figure 37: Kenyan Grocery and Apparel Retailers as of 2014
Grocery
Sales Number of Selling Space Market Share
Retailer HQ
(US$m) Stores (m2) (% retail value)
Nakumatt Kenya 671 37 177 800 8.2%
Tuskys Kenya 484 38 47 800 5.9%
Naivas Kenya 202 18 24 100 2.5%
Uchumi Kenya 195 24 45 000 2.4%
Apparel
Mr. Price South Africa 13 5 2 500 0.3%
Woolworths South Africa 8 7 4 000 0.2%
Truworths South Africa 3 4 2 000 0.1%
Source: Euromonitor
Local retailers dominate Kenya’s grocery sector and South African grocery retailers have found
trading in Kenya too challenging. The dominant apparel retailers are South African brands, many
which have partnerships with franchise group, Deacons.
Market Dynamics
Kenyans are comfortable shopping in malls. Retailers find that customers are value oriented and
not prone to impulse purchases. There are strong connections to the Middle East and India
through local traders and many Middle Eastern retail groups are now entering the country.
Kenya imports about 100 000 tonnes of second hand clothing, “mitumba”, every year58. The EAC
recently proposed a ban on mitumba to encourage growth of the local textile industry59, though it
is not clear why this would be the result.
58 Crowe, P. (2015). The global business of secondhand clothes thrives in Kenya. Reuters. Retrieved from
http://www.reuters.com/article/2014/10/15/us-kenya-textiles-idUSKCN0I41DS20141015
59 Daily Nation. (2015). East Africa States join hands to ban mitumba imports. Retrieved from
http://www.nation.co.ke/lifestyle/smartcompany/East-Africa-States-join-hands-to-ban-mitumba-imports/-/1226/2633438/-/ifnaum/-
/index.html
42
Formal Retail in sub-Saharan Africa. February 2016. www.uqalo.comYou can also read