MEASURING DISTANCE TO THE SDG TARGETS - An assessment of where OECD countries stand June - OECD.org
←
→
Page content transcription
If your browser does not render page correctly, please read the page content below
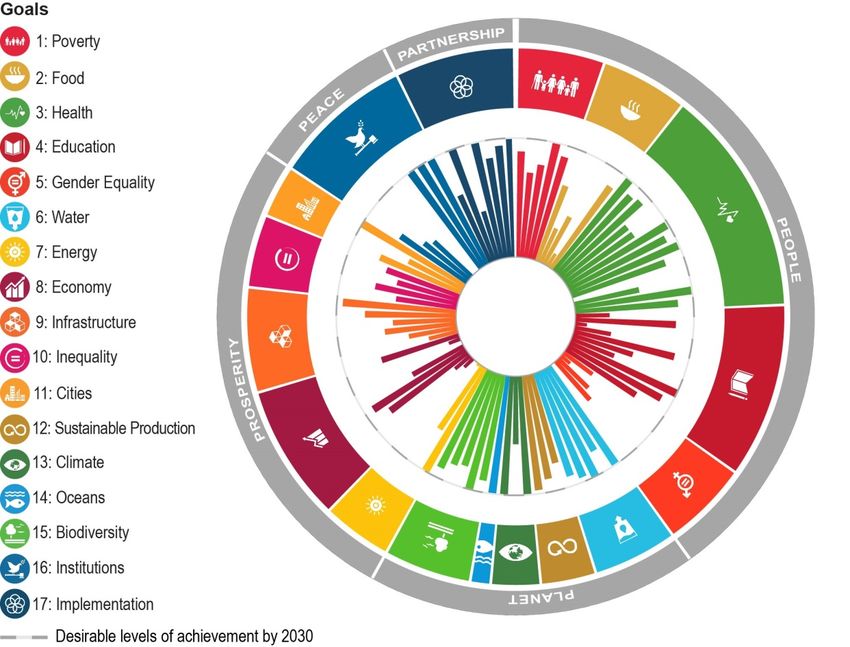
MEASURING DISTANCE
 TO THE SDG TARGETS

 An assessment
 of where OECD
 countries stand
 June
Goals
 1: Poverty
 2017 ERSH
 IP
 ARTN
 P
 2: Food
 E
 C
 A
 3: Health E
 P

 4: Education

 5: Gender Equality
 6: Water

 PE
 7: Energy

 OPL
 E
 8: Economy

 9: Infrastructure
 RITY

 10: Inequality
 SPE

 11: Cities
 O
 PR

 12: Sustainable Production
 13: Climate

 14: Oceans
 15: Biodiversity

 16: Institutions
 PLANET
 17: Implementation
 Desirable levels of achievement by 2030
EXECUTIVE SUMMARY

1. The 2030 Agenda for Sustainable Development, adopted by world leaders at the United
Nations on 25 September 2015, sets out an ambitious plan of action for people, planet and prosperity,
with the overarching objective of leaving no one behind. At its core are 17 Sustainable Development
Goals (SDGs) comprising 169 targets.

2. This Study of the distances from the SDGs of selected OECD countries is designed to help
governments as they consider developing national action plans, as well as to contribute to SDG
mainstreaming across different OECD Directorates. It leverages the wealth of statistical data collected
by OECD members and harmonised through OECD tools and processes. This booklet updates the
Pilot Study, published by OECD in July 2016, by offering a wider set of indicators and more complete
coverage of the Agenda 2030 targets, as well as a refined methodology for assessing distance to those
targets.

3. This Study uses the latest information on various indicators available in OECD databases to
establish countries’ distances from individual targets, and presents results for a number of countries.
These starting positions are measured in terms of the distance to be travelled by 2030. This requires
setting end-values for the targets to be achieved by 2030. The Study uses a flexible approach to
target setting, with appropriate consideration being given to values specified either in the 2030
Agenda or in other international commitments, but also using the current range of OECD performance
as a rating scale where no such benchmarks have been enunciated.

4. Taking as a reference the global indicator set endorsed by the UN Statistical Commission at
its 47th session, OECD indicators have been selected based on criteria of relevance, ability to
differentiate countries’ performance, availability and statistical quality. Applying these criteria, this
document identifies 131 indicators covering 98 targets spanning all 17 Goals. It is, however, clear that
many SDG targets cannot be currently measured adequately through data routinely collected by the
OECD, and that significant statistical work is needed to fill some of these gaps. The OECD is well
positioned to advance this agenda, given its expertise in developing policy indicators and in assessing
interconnectedness and policy coherence.

5. In order to help interested countries explore the trans-boundary effects or contributions of
their policies and development patterns, this Study also proposes an initial assessment of countries’
‘global contributions’ (e.g. aid flows to less developed countries or consumption-based carbon
dioxide emissions) to meeting some of the targets in the 2030 Agenda.

6. While the assessment of starting positions has been undertaken at target level, the results can
also be considered by Goal as well as through a global contribution lens. On average, OECD
countries are currently closest to reaching targets related to water, climate, biodiversity, cities,
poverty and oceans. They have the greatest distance to travel in relation to gender equality,
education, the economy and jobs, and institutions. Indicators can also be aggregated by the ‘5 Ps’ in
the 2030 Agenda: People, Planet, Prosperity, Peace and Partnership. Based on this breakdown, OECD
average scores are best on Planet, and Partnership, to a lesser extent on Prosperity, with People and
Peace lagging behind.

 1
7. It is nonetheless important to underscore that this assessment is based only on what can be
measured today. The selected indicators enable only 57% of all the SDG targets to be evaluated, and
coverage is unequal across goals and the 5Ps. For example, while health and education have at least
one indicator per target, oceans are covered in a very limited way. Similarly, while over 80% of the
targets in the People category are covered by at least one indicator, this is true for fewer than 40% of
the targets in the Planet category. Given the limitations of current data, assessments of relative
performance across the goals and 5Ps should be regarded as preliminary, and may change as more
indicators become available in the future.

8. The variation in countries’ distance to travel across both goals and targets, as well as the
variation in data coverage, suggest that national priorities for implementing the SDG agenda should
be set at target level, rather than at the goal or 5P level.

9. Finally, this Study shows that, to implement the 2030 Agenda, countries may need to
develop additional indicators and evidence to identify and track progress on policies that drive
outcomes at the country level and that have significant trans-boundary impacts.

 2

TABLE OF CONTENTS

Executive Summary ....................................................................................................................... 1
 1. Introduction............................................................................................................. 4
 2. Nature and purpose of the Study............................................................................. 9
 3. Study methodology ................................................................................................. 9
 4. Study findings ....................................................................................................... 16
 5. How participating countries have been using the Study ....................................... 20
 6. Conclusion ............................................................................................................ 21
 Annex I: OECD indicators used in this Study ..................................................................... 23
 Annex II: Selected country profiles ...................................................................................... 31
References .................................................................................................................................... 58

Tables

 Table 1. Comparison of the OECD well-being framework and the 2030 Agenda .............. 7
 Table 2. Types of SDG indicators and their 2030 end-values............................................ 13
 Table 3. Pros and cons of different normalisation procedures ........................................... 15

Figures

 Figure 1. Summary of the Sustainable Development Goals .................................................. 4
 Figure 2. Share of targets covered by at least one indicator ................................................ 11
 Figure 3. Percentage of targets measured by at least one indicator ..................................... 12
 Figure 4. Illustrating current and former normalisation procedures .................................... 14
 Figure 5. OECD average results by Goal ............................................................................ 16
 Figure 6. How OECD countries vary in their distance to targets, by SDG Goal ................ 17
 Figure 7. How OECD countries vary in their distance to targets, by 5Ps ........................... 17
 Figure 8. How OECD countries vary in their distance to targets in Goal 7- Energy .......... 18
 Figure 9. Average performance of OECD countries on some SDG targets pertaining ....... to
 global contributions.............................................................................................. 19
 Figure 10. Observed and predicted fatal traffic accidents - Slovenia .................................... 19

Boxes

 Box 1. The OECD Action Plan on SDGs .......................................................................... 5
 Box 2. The OECD well-being framework and the 2030 Agenda ...................................... 6

 3
1. Introduction

10. On 25 September 2015, world leaders meeting in New York adopted United Nations
Resolution 70/1, “Transforming our World: the 2030 Agenda for Sustainable Development”. The
Agenda is “a plan of action for people, planet and prosperity”, and “also seeks to strengthen universal
peace in larger freedom”.

11. The core of the Agenda is a set of 17 Sustainable Development Goals comprising
169 targets that draw on a large number of previous international agreements, especially concerning
development, the environment and human rights (Figure 1). The Goals are presented as “integrated
and indivisible, global in nature and universally applicable”. The Agenda presents them as addressing
the 5Ps: People (broadly corresponding to Goals 1-5), Planet (6, 12, 13, 14 and 15), Prosperity (7-11),
Peace (16) and Partnership (17).

12. Still, this does not mean that every target applies to every country. Rather: “Targets are
defined as aspirational and global, with each Government setting its own national targets guided by
the global level of ambition but taking into account national circumstances. Each Government will
also decide how these aspirational and global targets should be incorporated into national planning
processes, policies and strategies.” 1

 Figure 1. The 17 Sustainable Development Goals

Source: United Nations.

13. Once countries have decided their national targets, and how they will be integrated into
national processes, they will need to decide on how to implement policy strategies to achieve those
goals, and how to track progress in their implementation plans. The 2030 Agenda “encourage[s]
member states to conduct regular and inclusive reviews of progress at the national and sub-national
levels”, but leaves the modalities of this national review process to their discretion. The Agenda
provides much detail, however, concerning SDG follow-up and review at global level. This will
include an annual report by the UN Secretary-General, and a four-yearly review by a High Level

1.
 “Transforming our world: the 2030 Agenda for Sustainable Development”,
 https://sustainabledevelopment.un.org/post2015/transformingourworld.

 4

Political Forum, both of which will be supported by a set of global indicators. There will also be
reviews at regional and thematic levels. 2

 Box 1. The OECD Action Plan on SDGs

 The OECD Action Plan on SDGs [C/MIN(2016)6] aims to:

 Apply an SDG lens to the OECD’s strategies and policy tools: OECD Committees are encouraged to identify
opportunities to contribute to SDG implementation in their programmes of work. Mainstreaming the SDGs may also
involve revisiting thematic strategies (e.g. on innovation, skills, or green growth).

 Leverage OECD data to track progress in the implementation of the SDGs: The OECD will, inter alia,
provide data for the UN-led Global Indicator Framework for the SDGs; help developing countries address data gaps (in
collaboration with PARIS21); broaden its Programme for International Student Assessment (PISA) for developing
countries; modernise its development finance statistics; develop and expand its Revenue Statistics; and measure
policy and institutional coherence for migration and development.

 Upgrade OECD support for integrated planning and policy-making at country level, and provide a space
for governments to share their experiences on governing for the SDGs: The OECD will leverage the expertise
gained through Multidimensional Country Reviews, Policy Coherence for Development work and other tools to help its
members address multidimensional issues and connect policies across the board.

 Reflect on the implications of the SDGs for OECD external relations: This will include engaging with UN
entities, fora and processes on the 2030 Agenda to maximize synergies.

14. OECD expertise that can be mobilised in support of the 2030 Agenda is described in the
OECD Action Plan on SDGs (Box 1) and includes 3:

 • Assessing economic, social and environmental progress through measures going beyond
 GDP (e.g. the work on multidimensional well-being, Box 2), and facilitating comparison
 across and within countries.

 • Generating solid evidence and recommendations on global public goods and “bads”,
 including, for example, analysis of climate policies, development finance, foreign bribery,
 human trafficking, responsible business conduct and fiscal transparency.

 • Measuring and improving development finance by helping governments mobilise the broad
 suite of financial resources (taxes, foreign and domestic investments, remittances, aid and
 philanthropy) that will be necessary to achieve the SDGs in many countries.

 • Enhancing policy and institutional coherence by identifying policy interactions, trade-offs
 and synergies across economic, social and environmental areas; and considering trans-
 boundary and intergenerational effects.

 • Dismantling intellectual and policy silos, facilitating the exchange of knowledge across
 countries, and supporting sector-specific initiatives and partnerships.

2
 See for example United Nations, High level policy forum, “Progress towards the Sustainable
 Development Goals: Report of the Secretary General”, July 2016,
 www.un.org/ga/search/view_doc.asp?symbol=E/2016/75&Lang=E and
 https://sustainabledevelopment.un.org/ for more resources.
3
 To learn more, see: The Sustainable Development Goals: An overview of relevant OECD analysis,
 tools and approaches, OECD Expertise Relevant to the Implementation of the Sustainable
 Development Goals (SDGS)

 5
Box 2. The OECD well-being framework and the 2030 Agenda

 The OECD has long recognised the multidimensionality of people’s lives and of the resources sustaining people’s
well-being over time. In its 2011 How’s Life? report, it launched the Better Life Initiative which featured a scoreboard of
headline indicators to monitor progress across 11 dimensions of current well-being in OECD countries. These
dimensions drew on the framework put forward by the report of the Commission on the Measurement of Economic
Performance and Social Progress (Stiglitz et al., 2009), and were assessed as relevant to societies across the world,
irrespective of their level of socio-economic and human development (Boarini et al., 2014).
 The OECD well-being framework focuses on people rather than the economic system; it includes both objective
aspects observable by third parties and subjective states known only to individuals, and it concentrates on outcomes
(e.g. health status) rather than inputs (e.g. health-care spending) or outputs (e.g. the quality and quantity of surgery).
The framework also takes account of inequalities within each dimension, reflecting the idea that community and
societal welfare reflects both average outcomes and how they are distributed across people with different
characteristics. Finally, the framework recognizes the importance for well-being outcomes to be sustainable over time.
This requires preserving different types of capital whose benefits will accrue over time but that are affected by
decisions taken today. The focus on these resources is in line with the recommendations of Stiglitz et al. (2009) and
other measurement initiatives that distinguish between well-being “here and now” and the stocks of resources that
affect the well-being of generations coming “later” (UN, 2014).
 How do these elements align with the key features of the 2030 Agenda? There are both similarities and
differences, and the two approaches are complementary even though they differ in nature. The OECD well-being
framework is an analytic and diagnostic tool to assess the conditions of a community, whereas the 2030 Agenda is a
list of policy commitments agreed by world leaders. The two therefore differ as the results of a full medical check-up
would differ from the list of treatments a doctor might then prescribe. Yet, just as we would expect the treatments to
address the problems identified, in practice the policy commitments in the 2030 Agenda touch on practically all of the
dimensions considered in the OECD well-being framework. As shown by Table 1 below:

 • 8 of the 17 SDGs map to 9 of the 11 dimensions of the OECD framework for current well-being. In most
 cases, the mapping is one-to-one – e.g. SDG 3 on health maps to the OECD dimensions of “health status”.
 Sometimes, however, more than one SDG is relevant for a single OECD well-being dimension – e.g. various
 aspects of SDGs 1 and 2, on poverty and food respectively, map to the OECD dimension of “income and
 wealth”. In other cases a single SDG maps to several OECD dimensions – e.g. the decent work aspects of
 SDG 8 map to two OECD dimensions, “jobs and earnings” and “work-life balance”. Only two OECD
 dimensions do not map to any SDGs: “social connections” and “subjective well-being” (although “promoting
 well-being for all” is part of SDG 3 on health).

 • 3 of the 17 SDGs relate strongly to the cross-cutting “inequality” aspect of the OECD well-being
 framework. The relation is direct in the case of SDG 10 on reducing inequalities. However, SDG 1 on
 poverty also addresses inequality and SDG 5 on gender equality concerns the inequalities experienced
 by a specific population group. More generally, the SDGs’ emphasis on “leaving no one behind”
 underscores the importance of looking at outcomes across a range of population characteristics, such as
 age, gender, disability and socio-economic status.

 • The four types of “capital” that sustain future well-being in the OECD framework are clearly reflected in 11 of
 the 17 SDGs. Natural capital is dealt with in SDGs 12 on sustainable production, 13 on climate, 14 on
 oceans, and 15 on biodiversity. Economic capital is recognized in SDGs 7 on energy, 8 on decent work
 and the economy, and 9 on infrastructure. Human capital is the focus of SDGs 3 on health and 4 on
 education, while social capital is addressed by SDG 16 on institutions. In some cases, the same SDG may
 be relevant for both current well-being and sustainability: for example SDG 3 on health aims at lowering
 mortality and morbidity now, while supporting vaccine development for the future.

 Conversely, two aspects of the 2030 Agenda do not feature in the OECD well-being framework. The first is
SDG 17 (means of implementation); this reflects the choice in How’s Life? to focus on universally-valued outcomes,
rather than the country-specific policies needed to attain them. The second is the 2030 Agenda’s focus on the “shared
responsibility” of all countries in delivering global public goods and avoiding negative global impacts. This element
does not feature in the OECD framework because of its focus on the conditions prevailing in each community, rather
than on drivers (some of them external) shaping both current well-being and its sustainability. The focus on global
public goods in 2030 Agenda and on domestic policies and consumption patterns that can affect them is a genuine
innovation, giving expression to the “elsewhere” dimension stressed in the Conference of European Statisticians
recommendations on measuring sustainable development (UN, 2014).

 6
Table 1. Comparison of the OECD well-being framework and the 2030 Agenda

 OECD Well-being Framework Sustainable Development Goals

 Income & wealth SDG 1 (poverty); SDG 2 (food)

 Jobs and earnings SDG 8 (decent work & economy)

 Housing SDG 11 (cities)

 Health status SDG 3 (health)

Individual Well-being Work-life balance SDG 8 (decent work & economy)
well-being dimensions

 Education & skills SDG 4 (education)

 Civic engagement
 SDG 16 (institutions)
 & governance

 Environmental
 SDG 6 (water); SDG 11 (cities)
 quality

 Personal security SDG 16 (institutions)

 Differences SDG 1 (poverty); SDG 5 (women);
 across
 groups SDG 10 (inequality)

 7

OECD Well-being Framework Sustainable Development Goals

 SDG 13 (climate); SDG 14 (oceans);
 Natural capital
 SDG 15 (biodiversity);
 SDG 12 (sustainable production);

 SDG 7 (energy); SDG 8 (decent work
Sustainability of
well-being over Economic capital & economy); SDG 9 (infrastructure);
 time SDG 12 (sustainable production);

 Human capital SDG 3 (health); SDG 4 (education)

 Social capital SDG 16 (institutions)

 OECD dimensions of Subjective well-
 individual well-being not being
 covered by SDGs
 Social connections

Elements of SDGs not covered SDG 17 (implementation)
 by the OECD well-being
 framework “Global contributions, trans-boundary effects,
 international efforts”

15. The analytical framework of the present Study takes as its point of departure the 17 goals
and 169 targets of the 2030 Agenda. The indicators included in the Study are also closely aligned with
the 230 indicators of the UN global indicator framework developed by the UN Inter-Agency Expert
Group on SDG indicators (IAEG) and recently endorsed by the UN Statistical Commission.

16. The Study is not intended to support or supplant UN reporting. Its main objective is rather to
provide an innovative analytical tool that may help OECD member and possibly other countries to
plan SDG implementation, identify policy priorities, and develop their own reporting tools.
Separately, the OECD is also significantly contributing to UN Statistics Division efforts.4

17. This report is organised as follows. Section 2 discusses the nature and purpose of the Study.
Section 3 deals with the Study’s methodology, selection of indicators and how these indicators
measure countries’ “distance to travel” to meet the ambitions set for 2030. Section 4 summarises the
Study’s findings. Section 5 indicates some of the uses countries have made of the Study, and Section

4.
 The OECD is supporting the UN reporting process first through its active participation in the work of
 the UN Inter-Agency Expert Group on SDG Indicators. It is responsible for providing a number of
 indicators for the UN Global monitoring framework either directly (e.g. ODA data) or in
 collaboration with other international organisations (e.g. education-related indicators with UNESCO).
 The OECD is also helping to fill indicator gaps, leading or providing assistance in conceptual and
 developmental work in key areas (e.g. Total Official Support for Sustainable Development – TOSSD,
 governance statistics). Finally, it will assist SDG reporting in developing countries by building
 capacity through joint work with PARIS21.

 8
6 concludes. Annex I reviews the metadata used in the Study 5, and Annex II presents the country
profiles with Study results for participating countries.

2. Nature and purpose of the Study

18. The Study aims to support the ongoing OECD reflection on how to apply an SDG lens to its
work and processes. It is based on a set of indicators that can be used to assess where countries
currently stand in relation to the goals and targets of the 2030 Agenda.

19. The Study also aims to help countries working to define national action plans by:

 • Identifying available comparative indicators that Members could use to set strategic
 priorities within the SDG agenda and to track progress towards them.

 • Offering an approach to assessing the international contribution, or potential global impact
 of policies.

 • Highlighting SDG areas where statistical development will be particularly important, either
 to track progress or to advance understanding of the policy drivers of SDG outcomes.

20. In order to fulfil these aims, this Study has been kept as simple as possible. For a start, it has
been limited to Member countries’ distances to travel to reach the SDG targets; no attempt has been
made to assess past or likely future rates of progress. A second important simplification is that all
OECD countries have been treated equally on all indicators. This may seem uncontroversial but is, in
some ways, unfair. For example, some OECD members have not subscribed to United Nations
development aid targets, which were designed to apply to economically advanced countries; yet
where data are available, these members have been assessed on the same scale as others. This would
need further consideration before a full-fledged assessment could be produced.

21. Some other, mostly technical, simplifications are explained later in the course of presenting
the analysis. These have not been introduced lightly, but have been designed to keep this Study
focused on its key objectives of helping and informing interested member countries about their
distance from the target level to be achieved by 2030. However, the need for simplifications
reinforces the point made earlier that the results of this Study should not be taken as a definitive
assessment, but rather as a means of advancing thought and action on how members could identify the
SDGs areas where more urgent attention is needed at both national and global levels.

3. Study methodology

i) A brief history

22. A pilot of the OECD Study was first presented to OECD Ambassadors in July 2016, as an
example of a possible deliverable for the OECD Action Plan on SDGs. Participation in the pilot was
voluntary, and included Denmark, Finland, Netherlands, Norway, Slovenia and Sweden. Belgium, the
Czech Republic, Italy, Korea, Luxembourg, Latvia and Slovakia subsequently decided to join the
Study. The Action Plan was discussed at the 2016 Ministerial Council Meeting and approved in
December 2016 [C(2016)166/REV2].

23. Between September 2016 and January 2017, national seminars were organised in several
countries participating in the Study, and a second seminar for OECD Ambassadors took place in

5
 For the complete metadata, see www.oecd.org/std/OECD-Measuring-Distance-to-SDGs-Targets-
 Metada.pdf

 9
December 2016, followed by a technical workshop with national officials working on SDG
implementation. Feedback from these events, and directly from countries, has led to refinements in
the Study methodology, relative to the pilot. The indicator set has been considerably extended, and the
normalisation method for comparing distance to targets has been adjusted. These refinements are
detailed in the two following sections.

ii) From targets to indicators

24. The United Nations Statistical Commission, meeting in March 2016, adopted a “global
indicator framework” comprising 230 indicators, a few of them used against more than one target.
However, in a separate document the UNSC acknowledged “obvious theoretical and methodological
constraints”, which meant that “refinements and improvements to several indicators will be needed
over the years” and that the proposed indicators were “intended for global reviews and… not
necessarily applicable to all national contexts and country reviews”.

25. In fact, many of the indicators on the global list do not yet exist, and some still need to be
fully defined. A number of countries have examined the list and found that they could only report on
about 25% of them. At the same time, various indicator lists have been put forward by other
institutions. 6 In several cases, however, the indicators included in these lists refer only to the Goals
and bear limited relevance to some of the specific targets in the 2030 Agenda.

26. This assessment builds on the UN global indicator framework and relies on a dataset that
measures OECD countries’ relative distances from those targets where sufficiently good and
comparable information could be found. The selected indicators have:

 • Face validity, i.e. they are related to the main thrust and intention of the relevant target;

 • Discriminatory power, i.e. they show a range of performance among OECD countries while
 speaking to the country’s reality;

 • Broad availability, covering at least 20 OECD countries for a relatively recent year;

 • High statistical quality, i.e. they are computed according to internationally accepted
 standards, guidelines or good practices;

27. Against this background, and bearing in mind countries’ requests that indicators be closely
aligned with the IAEG Global List, the following indicator selection rules were followed:

 • First, the Study includes 65 OECD indicators directly comparable with those in the UN
 Global Indicators Database. Using OECD indicators ensures that data have been
 standardised to facilitate country comparison within the OECD. An example is productivity
 growth (growth of GDP per hour worked), for which OECD data is of high quality and
 meets demanding international statistical standards.

 • Second, where data did not yet exist in the UN Global Indicator Database, the Study has
 used a total of 14 proxies from OECD sources. As an example, the share of students above a
 minimum proficiency level in environmental science, sourced from the OECD PISA Study,

6
 The UN Sustainable Development Solutions Network originally proposed 100 global monitoring
 indicators but emphasised that producing them on a recurrent basis would require a “data revolution”
 (page 3 of the linked document). More recently, UNSDSN has focused on actual data availability; in
 three recent publications (the first one with the Bertelsmann Stiftung) it proposed four different SDG
 indicator sets, each comprising between 34 and 39 indicators. Both exercises rely heavily on OECD
 datasets.

 10
was used as a proxy of the IAEG indicator “extent to which education for sustainable
 development is mainstreamed at all levels”.

 • Third, where no OECD sources exist, the Study has used 37 indicators for which data are
 available on the UN Global Indicators Database. One example is the prevalence of moderate
 or severe food insecurity in the adult population.

 • Fourth, the Study has used 15 OECD indicators that are not on the IEAG Global List, but
 which are nonetheless relevant to capture the challenges that SDG targets raise. As an
 example, an OECD indicator of social assistance adequacy was used to complement the
 measure of social assistance coverage. In these cases indicators were only selected if they
 i) reflected the main drive and intention of the relevant target; ii) were available for at least
 20 OECD countries for a recent year; and iii) were measured and compiled according to
 international standards, guidelines or good practices.

28. As a result of these rules, suitable indicators were identified for 98 out of 169 targets, as
compared with 73 in the pilot version. For a few targets – those that are multifaceted, phrased in
general terms, or open to different statistical interpretations – more than one indicator was identified.
Overall, 131 indicators (128 unique indicators, since two indicators are used to assess more than one
target) were included in the dataset of the Study, up from 86 in the pilot version.

29. Even so, the selected indicators still only enable 57% of all the SDG targets to be assessed.
The coverage is uneven across goals, with health and education having at least one indicator per
target, while oceans are only covered in a very limited way (Figure 2, Panel A). Coverage of the
Agenda’s 5Ps - People (Goals 1, 2, 3, 4 and 5), Planet (Goals 6, 12, 13, 14 and 15), Prosperity
(Goals 6, 12, 13, 14, 15), Peace (Goal 16) and Partnerships (Goal 17) – is somewhat less uneven, as
shown by Figure 2, Panel B.

 Figure 2. Share of targets covered by at least one indicator

 Percentage of targets covered by Goal (Panel A, left) and the 5Ps (Panel B, right), all OECD countries

 100 100
 90 90
 80 80
 70 70
 60 60
 50 50
 40 40
 30 30
 20 20
 10 10
 0 0
 People Planet Prosperity Peace Partnership

30. At the country level, data are generally available for the bulk of the indicators used in the
Study: of the 35 OECD countries, 26 have data for 90% or more of the selected indicators. However,
for a few countries – often those that have joined the OECD in recent years – data are missing for
around 30% of the Study’s indicators (see Figure 3 for the range of country coverages of the
169 targets).

 11
31. The information gaps should be borne in mind, especially when evaluating performance on
the less well covered goals. They point to the need to further build statistical capacity to measure the
targets not currently covered by OECD or UN indicators. Another possibility would be to depart more
significantly from the IAEG Global List and use the best available proxies as placeholders, as several
OECD countries have done to establish their national set of reporting indicators (see also next
section).

 Figure 3. Percentage of targets measured by at least one indicator

 Panel A. Goals Panel B. 5Ps

 100 100
 90 90
 80 80
 70 70
 60 60
 50 50
 40 40
 30 30
 20 20
 10 10
 0 0

Note: The chart shows the percentage of targets covered for OECD countries on the 17 Goals (Panel A) and 5Ps (Panel B).
Black dots: OECD median country score. Box boundaries: first and third quartiles of the country distribution. Whiskers: 10th and
90th percentiles of this distribution.

32. The future statistical agenda on SDGs will have to increasingly concentrate on policy levers
and global contributions. For the latter in particular, it will be important to identify spill-overs from
domestic policies contemplated in the Agenda 2030 (e.g. attracting high-skilled immigrants may mean
brain drain and human capital reduction in poorer countries).

33. Given its expertise on policy indicators (e.g. macro-economic and sectoral policies) and in
measuring the interconnectedness among countries (e.g. ODA, trade access, Trade in Value Added,
climate), the OECD is well placed to play a prominent role in moving this measurement agenda
forward.

iii) From indicators to measuring distance to targets

34. The Study evaluates countries’ performance by examining the distance to travel in order to
reach each target level. Here, the heterogeneous nature of SDG targets means that setting desirable
levels of achievement by 2030 on each indicator requires a variety of approaches. The task is easy if
the level is explicitly specified in the 2030 Agenda itself, either as a fixed value, or as a relative
improvement on a country’s starting position. In other cases, a fixed value or a relative improvement
can be deduced from other international agreements on the relevant topic. However, in a third
category, where no guidance is available in international agreements, the Study has set the desirable
value at the “90th percentile” – the level which only 10% of OECD countries now attain. This
approach has not changed since the pilot version of the Study, but the numbers of indicators in each
category has risen to the values shown in Table 2.

 12
Table 2. Types of SDG indicators and their 2030 end-values

 Number of
 Type of indicator Means of setting 2030 end-value
 indicators
 End-value referred to in SDGs, e.g.
 A1. SDG-based, absolute in the future 46
 infant mortality at 12 per 1000 lives
 End-value referred to in SDGs, e.g.
 A2. SDG-based, relative to starting position reduce by half the proportion of 6
 people living in poverty
 End-value set by International
 Agreements, Good Practices or other
 B1. Other international agreement or shared
 Established Frameworks, e.g. reduce 40
 aspirations, absolute in the future
 PM 2.5 pollution to less than 10
 micrograms per cubic meter (WHO)
 End-value set by International
 Agreements, Good Practices or other
 B2. Other international agreement or shared
 Established Frameworks, e.g. double 3
 aspirations, relative to starting position
 the share of renewables in
 consumption (IRENA)
 th
 C. No explicit value; best historical End-value set at the 90 Percentile of
 36
 performance considered OECD countries in 2010

35. In order to compare scores across different targets, indicators must be normalised. Initially,
in the OECD pilot study (2016), indicator scores were placed on a common scale running from
0 to 100, with 100 being the end-value and 0 being the baseline level – the value that only 10% of
OECD countries failed to reach in a defined base year (see Figure 4, Panel A). Setting such a baseline
had the advantage of excluding “outliers” – unusually low scores that would otherwise unduly extend
the scale. It also generated a good spread of results against possible target values, and could be
applied to all targets, irrespective of their nature or complexity.

36. However, as the results are bounded between 0 and 100, this normalization does not
(by construction) enable one to monitor the performance of countries performing below the baseline.
This limitation would also inhibit the application of the methodology to countries outside the OECD,
many of which would fall short of the baseline on a large number of indicators. The zero bound might
also be misinterpreted as the country’s starting point, whereas in fact it represents the 10th percentile
of OECD country performance in the base year.

37. To overcome these problems, in response to comments received by countries, distances are
now calculated as the “standardised difference” between the country’s current position and the target
end-value. For each indicator, the standardised measurement units are defined as the standard
deviation across OECD countries at the beginning of the period considered. To express a country’s
starting position for a given indicator in standardised units, we first calculate the country’s distance to
the target, and then divide this by the standard deviation of the indicator, for the distribution of OECD
countries 7. Based on this approach, a score of zero implies that the target has been reached, while a
positive (non-zero) score implies that a country has not yet achieved its target (see Figure 4, Panel B).
Negative scores, which mean that a country has already exceeded the target, are reported as zero,
i.e. as meeting the target. So the higher the score, the further is the distance that the country will need
to travel to achieve its target. The units of measurement should be read as the number of standard
deviations by which a country needs to improve in order to reach the target.

7.
 Example: target 5.5 on women’s full and effective participation in leadership is measured through the share
 of seats in national parliaments held by women. The level to be achieved by 2030 is 50%, as the target is
 full gender equality. The standard deviation of the shares currently observed among OECD country scores
 is ~10 percentage points. Denmark’s share of seats held by women is 37%. So its standardised score on this
 indicator is the difference between its current share (37%) and the target (50%), divided by the standard
 deviation (10%) = 13/10 = 1.3 units.

 13
Figure 4. Illustrating current and former normalisation procedures

 Panel A – the ratio scale

 20% 80%

 Panel B – the “standardised difference”

 Unit

Note: The panels show the original and latest normalisation procedures for the same notional set of country scores on an
indicator. Blue dot: score of assessed country. Grey dots: other country scores. Green line: target level to be achieved by 2030.
Red line in Panel A: the “baseline level”, i.e. the value that only 10% of OECD countries currently fail to reach. Panel A shows
the country as 20% of the way from the baseline to the target level. Panel B shows it is four standard deviations short of the
target, this unit taking account of the position of all dots on the line.

38. This standardisation technique is a modified version of the standard “z-score” normalisation,
which is one of the most common techniques used in statistics for comparing scores on different tests
or constructing composites combining variables expressed in different measurement units. This
standardisation method was tested against alternatives and preferred due to its statistical properties.
Table 2 summarises conclusions from this testing, which included both the original method (“Ratio
scale”) and the “time-distance” method. Time-distance simply estimates the number of years it will
take to reach the target level on an indicator, given recent observed progress. Such progress can be
assumed to be following a linear trend, or some other pattern, such as an annual percentage change
(which yields an exponential trend). Overall, the modified z-score was preferred, especially because
it enables measurement of progress by countries below the previous OECD baseline level while at the
same time being relatively unaffected by the inclusion of additional countries in the sample. More
information on the robustness tests carried out on various standardisation techniques, as well as the
distributional effects on the distance results is provided in Boarini et al. (2017), forthcoming.

 14
Table 3. Pros and cons of different normalisation procedures

 Ratio scale Modified z-score Time-distance method
Interpretation Country X travelled Y% of the way Country X is Y standard Under a business as usual (BAU)
 from the current baseline score deviations short of the target scenario, country X would need Y
 th
 (10 percentile of actual years to reach the target
 performance) to the target
Formula − − Formula depends on assumed
 � � , � , � � , �
 − shape of BAU progress curve
Data Minimum values of current Current distribution of Linear, exponential or other
conditioning performances; target level country scores (dispersion); assumed rate of improvement;
the measure target level target level
Sensitivity to Where a country whose score is Adding new countries can New countries will have no impact
inclusion of below the baseline is added it will: affect the standard deviation on normalisation since trends are
new countries • if included in the normalisation – and thus the standardised country-specific
 procedure, change the bounds measurement unit – if
 so that other countries see included in the normalisation
 procedure. This in turn would
 their performances boosted
 affect the estimated number
 • if not included in the of standardised units that a
 normalisation procedure, be country will need to travel to
 assigned a null score, so that reach the target. However
 its full distance to target is not the magnitude of the impact
 registered cannot be assessed ex ante
 (see Boarini et al. for a more
 formal discussion)
Advantages • Widely used • Countries at the bottom • Easy to understand
 • Easy to compute of the league can still be • Easy to compare projected
 assessed in terms of achievement date with 2030
 distance to travel deadline
 • Lowers the scores in
 cases where all countries
 are far from the target
 and perform similarly
 badly
Disadvantages • True distance to target not • Since unit size depends • Results depend heavily on
 shown for countries that score on the standard deviation assumptions made about
 below the lower bound. of country scores in the shape of trends (linear,
 Extreme values can distort the base year, exponential etc.)
 normalised distribution standardisation could • Results expressed in years to
 • Ratio scale normalisation unduly distort the results target cannot be averaged
 could widen the range of if countries are clustered among indicators unless a
 indicators lying within a small around the mean (the country is projected to
 interval (the impact is greater impact is however progress on all of them, since
 than with z-score, OECD, smaller than ratio-scale, if it is projected to regress, it
 2008) OECD, 2008) will take an infinite number of
 years to meet that target

 39. To assess performance by target, goal and “P”, results are summed by weighting each
 indicator equally within targets, weighting each target equally within goals, and weighting each goal
 equally within each “P”. This reflects the equal emphasis given to each of the Goals and 5Ps in the
 2030 Agenda, but note that where goals have few indicators, it increases the weight of those
 indicators. The alternative of weighting each indicator equally would conversely reduce the weight of
 goals with few indicators.

 15
4. Study findings

40. The Study finds that on average OECD countries have some distance to travel to reach the
SDGs targets, particularly on the goals related to gender equality, education, the economy and jobs,
and institutions. This partly reflects the more ambitious thresholds set on these targets (e.g. “achieving
gender parity” vs. targets phrased only in terms of “substantially improve”). OECD countries are
closer to meeting targets on water, biodiversity, cities, poverty and oceans. Figure 5 shows OECD
average results by goal.

 Figure 5. OECD average results by Goal

Note: This figure shows OECD’s distance to travel towards each of the 17 Goals of the 2030 Agenda. Bars show OECD’s
performance. The y-axis indicates the distance from reaching the target in standardised units. 0 indicates that the level for 2030
has already been attained, and the axis starts at 3 as most OECD countries have already attained this level. Distances to target
are aggregated at the goal level (all targets weighted equally).

41. Distances to targets vary significantly across the Goals (Figure 6), and when the goals are
grouped into the 5Ps (Figure 7). OECD countries perform consistently well on water, biodiversity and
infrastructure. There is more variation on poverty, women, sustainable production, climate and
implementation, with some countries much nearer the 2030 levels than others. Of the 5Ps, Partnership
shows the largest spread of country performance.

 16
Figure 6. How OECD countries vary in their distance to targets, by SDG Goal

 0.00

 0.50

 1.00

 1.50

 2.00

 2.50

 3.00

 3.50

Note: The distribution of OECD countries’ distances on the 17 Goals in standard deviation units. Central black bars: OECD
median country score. Box boundaries: first and third quartiles of the country distribution. Whiskers: 10th and 90th percentiles
of this distribution.

 Figure 7. How OECD countries vary in their distance to targets, by 5Ps

 0.00

 0.50

 1.00

 1.50

 2.00

 2.50

 3.00

 3.50
 People Planet Prosperity Peace Partnership

Note: The distribution of OECD countries’ distances on the 5 Ps in standard deviation units. Central black bars: OECD median
country score. Box boundaries: first and third quartiles of the country distribution. Whiskers: 10th and 90th percentiles of this
distribution.

42. The Study shows that while individual countries’ performances tend to be fairly consistent
across Goals, their performance within each Goal is often unbalanced. This suggests that, from the
perspective of identifying strategic priorities for implementing the SDGs, countries should look at
targets individually rather than just focusing on Goals. For instance, while all countries have already
met the target of universal access to energy, many are lagging behind on renewable energy and even
more so on energy efficiency (Figure 8).

 17
Figure 8. How OECD countries vary in their distance to targets in Goal 7- Energy

 0.00

 0.50

 1.00

 1.50

 2.00

 2.50

 3.00

 3.50

 4.00

 4.50

 5.00
 7.1 - Access to energy 7.2 - Renewable energy 7.3 - Energy efficiency 7.a - ODA to clean energy

Note: The distribution of OECD countries’ distances on the four targets of Goal 7 for which indicators are available. Central
black bars: OECD median country score. Box boundaries: first and third quartiles of the country distribution. Whiskers: 10th and
90th percentiles of this distribution.

43. For illustrative purposes, the OECD Study also makes a first attempt at distinguishing
domestic targets from those with trans-boundary effects, i.e. positive or negative impacts of countries’
actions on the rest of the world. Such effects include help to other countries in meeting the targets,
including through official development assistance (ODA). However, there may also be negative
spillovers, such as when countries subsidise their own farmers in ways that reduce world prices or
market access for developing countries. Demand for products consumed in OECD countries also
entails carbon dioxide emissions in other parts of the world, which raises global greenhouse gas
levels.

44. Figure 9 shows average OECD country performance against three types of targets with
trans-boundary impacts. Countries are furthest from the 2030 targets on raising their demand-based
CO2 productivity (the goods consumed per unit of embodied emissions), whereas they are somewhat
more advanced in reducing agricultural subsidies and increasing ODA. However, further work will be
necessary to expand and deepen the analysis of trans-boundary aspects of OECD countries’
performance. The ways in which OECD countries aim to meet their domestic SDG targets may also
have cross-border impacts, e.g. if health or education outcomes are improved partly with skilled
personnel coming from developing countries.

 18
Figure 9. Average performance of OECD countries on some SDG targets pertaining to global
 contributions

 0.00

 0.50

 1.00

 1.50

 2.00

 2.50

 3.00
 Average ODA Score Demand-based CO2 productivity Unsubsidised agricultural production

45. The Study so far has been ‘static’, focusing on distances to travel rather than on rates of
improvement. However, using past trends to project possible future performance could provide a key
complement to assessing the starting positions, and also inform priority setting. For instance, if a
country is very close to reaching a given target today, but has been slowing down or even reversing
earlier progress, then in a few years it may lose its relative strength in that target and need to take
action to achieve it. Dynamic assessments can also suggest the degree of effort required to meet a
target, and how this varies across targets: where there is a long distance to travel, but recent progress
has been rapid, it may be easier to close the gap than where the initial distance is short but recent
progress has been slow or negative. The Study has therefore also been exploring Monte Carlo
simulations for a selection of indicators where sufficient data on past performance is available. By
way of example, Figure 10 shows observed and predicted fatal traffic accidents in Slovenia. The
target is to reduce such deaths by half by 2020. The Monte Carlo simulations indicate that, based on
past trends, there is only about a 30% chance of this being achieved by the deadline, though it is much
more likely to be achieved by 2030 (right panel).

 Figure 10. Observed and predicted fatal traffic accidents - Slovenia
 Expected
 2 sd from the expected value Likelihood of achievement
 Observed
 4.00 1.00

 3.50 0.90
 0.80
 3.00
 0.70
 2.50 0.60
 2.00 0.50

 1.50 0.40
 0.30
 1.00
 0.20
 0.50 0.10
 0.00 0.00
 2000 2005 2010 2015 2020 2025 2030 2015 2017 2019 2021 2023 2025 2027 2029

Note: Left panel: Slovenian traffic accidents in standard deviation units, with zero representing the 2030 target level. Black line
shows actual data to 2010. Blue lines show projected values to 2030, the solid line representing the most likely path based on
past performance, and the dotted lines the 95% confidence interval, based on Monte-Carlo simulations. Right panel: The
probability of achieving the 2030 targeted reduction of Slovenian traffic accidents in each year from 2015 to 2030, based on the
Monte Carlo simulations, from zero (impossibility) to 1 (certainty).

 19
46. A final consideration is that, as the Agenda asserts, the SDGs are indivisible and integrated.
This means that achieving one Goal may require action on others. For instance, poverty reduction is
the objective of Goal 1 but attaining it may also require progress e.g. under Goal 9, on the economy
and decent work and Goal 10 on inequalities. In other cases, mutual dependence is observed:
improving education (Goal 4) will bring benefits in terms of health status (Goal 3), income and
employment (Goals 1, 2, 8 and 10), and institutions (Goal 16), but improvements in these factors
could also improve educational resources and outcomes. In principle this calls for an integrated
assessment of countries’ starting positions, in line with the conceptual approach suggested by the
OECD Policy Coherence for Sustainable Development framework
(http://dx.doi.org/10.1787/9789264256996-en). In practice, however, an integrated assessment is very
complex to carry out, as the identification of synergies and trade-offs for many of the SDG targets is
an empirical question that has been little researched so far. The Secretariat has conducted exploratory
work to Study the correlations across targets and goals, using the dataset of the Study as well as SDG
indicator sets developed by other institutions (e.g. the UN, the World Bank, etc.). Further work in this
direction will be pursued in the future.

5. How participating countries have been using the Study

47. As explained by the UN’s Synthesis of Voluntary National Reviews at the 2016 High Level
Political Forum, countries’ responses to SDGs vary widely and many national implementation plans
are still in their infancy. Tasks include: i) translating SDGs into the national context; ii) developing
monitoring and reporting frameworks; iii) building institutional frameworks to support a whole-of-
the-government SDG implementation effort; iv) raising awareness and stakeholder involvement; and
v) securing sufficient means of implementation.

48. The Study aimed especially to help countries with i) and ii) above, and has proven useful
both in these respects and in others. Several countries are using the results of the Study to inform
the national policy debate, especially in determining priorities for action in new or updated National
Development Strategies or implementation plans or policy mechanisms. Slovenia for instance is
building its National Development Strategy around several of the priorities highlighted by the Study
such as the need to increase trust in institutions and the quality of governance more generally. In the
Netherlands, the Council of Ministers published a letter to Parliament proposing to develop an action
plan on SDGs for the coming years; the letter referred to the results of the OECD Study to indicate
possible areas for improvement (see Annex II for detailed country results from the Study). The Czech
Republic plans to refer to the Study results when preparing the implementation plan for the
2030 strategic framework that will be prepared by the end of November 2017.

49. Participating countries are also using the Study to guide their monitoring and reporting
processes, and in particular to: i) select national indicators; ii) establish starting positions and
finishing lines; and iii) developing dynamic baselines. Slovenia, Italy, Belgium and the Czech
Republic, for instance, have used the Study methodology in their work to test the robustness of
indicators and normalisation choices, or to study static versus dynamic baselines. The Czech Republic
also envisages using the Study methodology as a tool for identifying policy gaps and highlighting
changes needed to meet the 2030 Goals. In building its national reporting framework, Luxembourg is
considering the indicator set used by the Study alongside other national and international indicator
sets.

50. Some countries have also expressed an interest in referring to some of the results of the
OECD Study in their National Voluntary Reviews at the annual High Level Policy Forum held in
New York in July. So far, these countries include Slovenia, Latvia and the Czech Republic.

51. Finally, many countries valued participation in the Study as an opportunity to share
experiences on design and communication of SDG plans. These experiences are particularly
valuable to help build new institutional frameworks for a whole-of-the-government effort on SDGs,
and to facilitate stakeholder involvement. In Slovenia, for instance, the elaboration of the National

 20
Development Strategy used a participatory process with many governmental and non-governmental
stakeholders, and the Study proved valuable in presenting the country’s SDG starting positions in a
comparative perspective.

52. The uses of the Study vary partly in response to the different roles that national statistical
offices (NSOs) play in SDG implementation in different countries, which in turn depend to some
extent on the structure and nature of approaches to SDG implementation by the government system as
a whole. Useful information on these approaches is available in an OECD Survey on Planning and
Co-ordinating the Implementation of the SDGs conducted by a team of Swedish researchers in 2016.
It found that most of the 33 countries surveyed were involving their NSOs in developing indicators to
monitor implementation of SDGs, but that only some had done stocktaking or gap analysis of their
country’s starting positions in addressing SDG-relevant issues.

53. The OECD/Swedish Study also showed that lead responsibility for SDG implementation
among the surveyed countries was split evenly among three main models: leadership by the Centre of
Government (CoG, i.e. Prime Minister’s office or department); co-leadership between the CoG and
another ministry (most often the foreign ministry); and leadership or co-leadership without the centre
of government (usually involving the foreign ministry). The CSSP meeting provides NSOs with an
opportunity to share and compare their experiences under these different approaches to SDG
implementation.

6. Conclusion

54. This Study on Measuring Distance to the SDG targets has been undertaken to assist member
countries with their national implementation of the 2030 Agenda for Sustainable Development.
Drawing on the IAEG Global List of indicators, its methodology evaluates the distance countries need
to travel to meet each target. It can thus provide a high-level overview of strengths and weaknesses
across the SDGs and the 5Ps, as well as a more granular analysis. While major data gaps remain –
which the OECD is working with UN and other partners to fill – the pilot version of the Study has
proven useful to several members in identifying areas that require attention in order to reach the
2030 targets. Work will continue to enable a more in-depth analysis of the targets to be achieved and
the trajectories implied in specific country contexts.

55. Based on 131 indicators covering 98 targets, the Study shows that the OECD area as a
whole still has significant distance to travel to meet the 2030 targets. On average, OECD countries are
closest to reaching the 2030 targets on health, water and energy, and furthest away on gender equality.
There is considerable heterogeneity in starting positions across both goals and targets, which suggests
that national priorities for implementing SDG agendas should be set at target level.

 21
You can also read