Well-Being Indicators in Aotearoa/New Zealand: the 2021 'state of the play' - AUT
←
→
Page content transcription
If your browser does not render page correctly, please read the page content below
Aotearoa New Zealand Journal of Social Issues, vol. 1

    Well-Being Indicators in Aotearoa/New Zealand: the 2021 ‘state of the play’

Charles Crothers1
School of Social Sciences
Auckland University of Technology

Abstract:

Since the turn of the Millenium there have been active developments of social indicator
frameworks in New Zealand, alongside related efforts of economic, environmental, and
health indicators. The first phase included the Ministry of Social Development’s Social
Report and the – still on-going - Quality of Life Project alongside living standards studies and
the academic FWWP2 study drawing on census data. In the second decade a new approach
gradually emerged. The Statistics New Zealand (SNZ) General Social Survey provided a firm
foundation for developing indicators, international conceptualisation from the OECD and
other sources was explicitly drawn on, the Household Economic Survey underwent ongoing
enhancement and Treasury embarked on the long-term development of its Living Standards
framework. A recent fillip driven by the emerging rhetoric of ‘Social Well Being’ has been
the institutionalising of social indicators in the forthcoming Treasury Wellbeing report, an
interest in social cohesion, mobilisation of academic knowledge, consideration of a wider
range of inputs (especially on behalf of ethnic communities) and establishment of more
active SNZ and other websites and dashboards, which supply useful single-variable vignettes
and considerable downloadable source data but little analysis. The New Zealand social
indicator system, within the increasingly comprehensive overall indicator system, is
beginning to consolidate but needs more considered development.

Keywords: New Zealand, Wellbeing Indicators, Social Well-being, Indicator-sets, Economic
Indicators, Cultural Indicators, Environmental Indicators Quality of Life, Surveys, Official
statistics,
Cite as: Crothers, C. (2021). Social Indicators in Aotearoa/New Zealand: the 2021 ‘state of
the play’. Aotearoa New Zealand Journal of Social Issues, vol 1. URL:
https://ojs.aut.ac.nz/anzjsi/article/view/6

Acknowledgements: Thanks for comments to Paul Brown, Len Cook, Gerard Cotterell,
Arthur Grimes, Tim Hughes, and Conal Smith

1
  Charles is an Emeritus Professor and also a Senior Research Associate with the University of
Johannesburg.
2
  The Family and Whanau Wellbeing Project was carried out at the University Auckland: see Cotterell
& Crothers, 2011.

                                                 1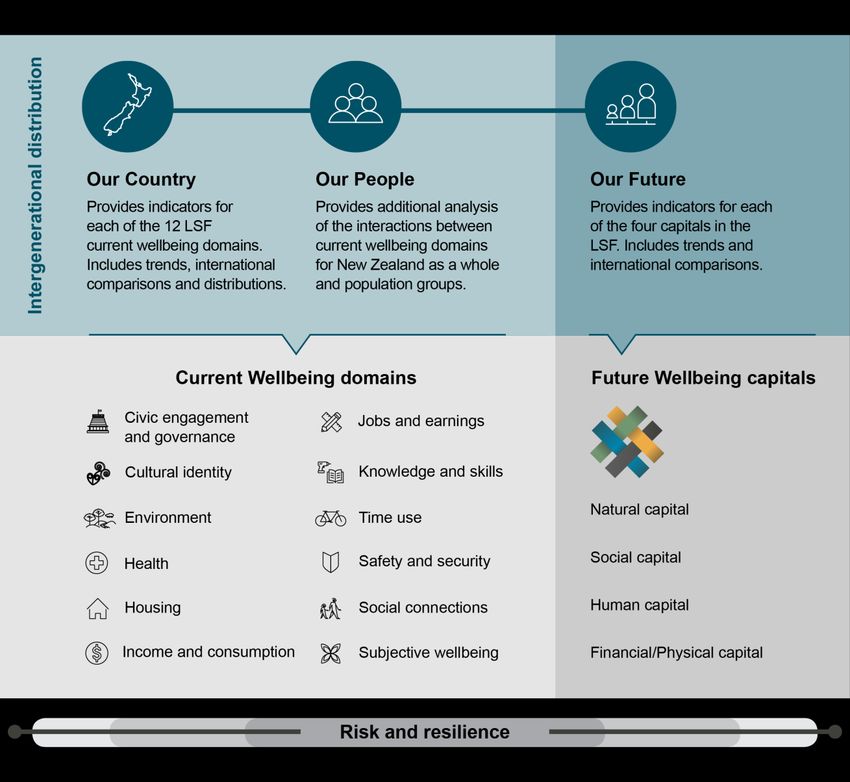
Aotearoa New Zealand Journal of Social Issues, vol. 1

1 Introduction

The recent release (early September) of Kei te pēhea tātou? A snapshot of New Zealand's
wellbeing https://www.stats.govt.nz/infographics/kei-te-pehea-tatou-a-snapshot-of-new-
zealands-wellbeing is a ‘storefront’ pointing to the recently refreshed SNZ indicators
framework Ngā Tūtohu Aotearoa – Indicators Aotearoa New Zealand (see
https://statisticsnz.shinyapps.io/wellbeingindicators/.) The snapshot is a somewhat widely
scattered infographic (also available in Te Reo) of interesting social facts on NZ, presumably
designed as exciting teasers which might pull readers into delving further into the store of
indicators. The snapshot and the proclamation of the Treasury LS2021 both are milestones
warranting the timing of this stocktake.

In turn, it seems timely to review other indicator frameworks (some mere collections)
available or being developed in New Zealand for measuring well-being. The emphasis in this
paper is on social well-being, and indeed general well-being, compared to other indicators
and only lightly refers to the arrays of economic, environmental and health indicators
(although these may well include some socially-relevant indicators). Economic and
environmental indicators in large part require different conceptualisations and
methodologies. Nevertheless, the various indicator broad domains are increasingly
interfacing.

Indicator is a term broadly used, however as used here An indicator is defined as more than
just a variable because it is institutionalised (i.e. some organisational and public ‘buy in’)
with a commitment to ongoing measurement which involves some moral loading – and
monitoring trends in relation to some normative standard, if only trending in a ‘better’
direction. Indicators are combined into sets conceptualised in terms of an encompassing
conceptual framework (sometimes minimal, seldom more than lightly developed) which
posits relationships amongst the various indicators and any mechanisms animating the
whole. Underpinnings include the stock of substantive and methodological knowledge,
techniques and technology deployed and real-life programme interventions and operations,
together with the feedback mechanisms of research using the assembled data which will
improve understandings of how the whole system works. A further layer involved the ‘eco-
system; of sponsors, users etc within which the indicator-sets are set (for a case study of
users of societal indicators in the UK see Walker et al (2020). So, in sum, the indicator
measures are but the visible layer of the whole indicator-set system.

The ultimate dependent or outcome variables for many indicator-sets is variously ‘Quality of
life’, ‘social well-being’, ‘living standards’, ‘happiness’, ‘life purpose’ etc. For current
purposes these can be treated as (near) synonymous, although there are differences in
stress on objective (e.g. living standards) or subjective (e.g. Happiness) aspects. (In the
1980s an often-used term was ‘living conditions’.)

Indicators relate to other forms of applied social research, such as programme evaluation in
that they allow some evaluation of outcomes as opposed merely to outputs and can
provide, if conditions worsen, a trigger for development of interventions.

                                               2
Aotearoa New Zealand Journal of Social Issues, vol. 1
The terminological differences do need consideration – see Duncan (2011) - and they may
have different rhetoric effects (e.g. Treasury have committed to ‘living standards’ and the
‘well-being’ nomenclature with the change of government was sufficient for the Social
Investment Agency to rechristen itself as the Social well-being Agency. Other rhetoric in
social indicator discussion has been ‘progress’, ‘higher’ standard of living etc., with
assumptions of ‘improvement’. However, these topics are not further pursued here.
There are several uses to which indicator-sets can be put, which in turn may generate a
classification of types of indicator-set:.
- The major use is in monitoring, in terms of direction and sometimes level – both at
more focused and more general levels (which e.g. might cover unintended
consequence so achieving certain goals and spill-over effects);
- More operational and providing a platform for their use in insights analysis for
policy formation and evaluation and management (e.g. social investment)
- The use of assembled data for developing and assessing descriptive and explanatory
models.
Each in this range of uses is not mutually exclusive and in fact they inter-relate. Only ‘public-
facing’ as opposed to various internal-to-government operational frameworks are included.
The latter are less visible and also more extensive. But the lines between are blurred.
The fit between indicator-sets and programme delivery vehicles is unclear, and often
fraught. Presaging a strong link PM Jacinda Ardern foretold the 2019 Wellbeing Budget.
“For Budget 2019 we will be using the Living Standards Framework developed
by the Treasury to create New Zealand’s first Well-Being Budget. We will look
beyond the normal GDP measures to measures which show how what we do
improves the health and well-being of our people, our environment, and our
communities. Improving intergenerational well-being will drive our priorities and
how we measure our success”.
But in practise several key programmes that clearly were relevant to the LSD framework
were selected on political grounds, rather than being ‘deduced’ from the framework.
Grimes (2021) argues that political priorities still hold although the better availability of data
in indicator-sets (after all the data itself was already available) allows better policy
rationales to be formulated, and maybe there’s a potential yet to be realised.
“One positive aspect of the LSF approach was the release of detailed
distributional information relating to the wellbeing domains according to
population groups based on ethnicity, gender, age, region, area deprivation,
family type, and employment status (McLeod, 2018). This information – while
not explicitly used in the budget process – has the potential to assist
prioritisation of government funding. For instance, the evidence showed that
older people were doing better on most domains than were younger people,
especially those with dependent children. This information could be used to
redirect government funding from programmes designed to boost the wellbeing
of older people to programmes designed to assist (especially low income)
3Aotearoa New Zealand Journal of Social Issues, vol. 1
parents with children.
The fact that budgeted government funding continues to increase for the over
65-year-old age group (for example, a universal ‘Winter Energy Payment’ was
introduced starting in 2018 to pay an extra cash grant in winter to all people
over 65 (plus other beneficiaries) without regard to the person’s income) despite
this information highlights another challenge of wellbeing dashboard
frameworks: the in funding from programmes designed to boost the wellbeing
of older people to programmes designed to assist (especially low income)
parents with children. The fact that budgeted government funding continues to
increase for the over 65-year-old age group (for example, a universal ‘Winter
Energy Payment’ was introduced starting in 2018 to pay an extra cash grant in
winter to all people over 65 (plus other beneficiaries) without regard to the
person’s income) despite this information highlights another challenge of
wellbeing dashboard frameworks: the information that is released may not
dovetail with political priorities in terms of voter support. Governments can pick
and choose amongst a myriad of indicators to support pet projects and ignore
others that do not support their priorities for vote retention.”
The ultimate goal may be for governments to be able to make decisions driven in large part
by modelling of indicator-set information, especially where monetised long-term
information about costs and benefits (including their social distributions) is available.
This stocktake may be useful in the nudging the thinking of the various arms of the Public Service
involved in producing social indicators into more ‘whole of government’ thinking. Attendant
academic and other researchers may be drawn into the conceptual and methodological issues
involved and also utilise the assemblage of data fir their research purposes. In particular this broad
account is to draw the attention of academics and their students and the more intellectual portions
of the general public. The government has a broad duty to provide information on its activities and
their effects on the broader society, environment and indeed the wider world. In turn, those with
relevant expertise and both the general publics and specific interest groups should be involved in the
development of indicator sets and to attest to their validity.
The international literature on social indicators and relevant methodological issues is
considerable and is only drawn lightly on here. International standards (especially OECD) are
more closely drawn on to share conceptual thinking and allow comparisons although this is
also counteracted by indigenous developments.
But first, an historical update since the 2011 report. Subsequent sections cover:
- Stats NZ Well-being framework: Ngā Tūtohu Aotearoa
- Living Conditions and poverty monitoring
- Treasury Living Standards framework
- A widespread array of other indicator-sets, with finally
- Conclusions and indications of a development agenda.
4Aotearoa New Zealand Journal of Social Issues, vol. 1
2 On From 2011
In 2011, in the last issue of the MSD Social Policy Journal of New Zealand Crothers and
Cotterell reviewed the state of social indicators in NZ at that time, with particular attention
to the contribution which might be made by an academic programme the FWWP 3. That
programme was extended with a cohort study updated with 2013 census (not a
longitudinal) trend study covering 1981-2006 period and also updated through 2013 with
census data for that year (Crothers & von Randow, 2014 ). But despite the value of this
mobilisation of census data for indicator work there are no plans for further updating since
the funding (required to extract special tables from the census database) for the FWWP
project has been exhausted.
In other respects, the Aotearoa/New Zealand social indicator space has extensively changed.
The Quality of Life (QOL) project has continued with 2-yearly surveys which have carefully
added new component but enhanced continuity by repeating most questions and keeping
high data quality standards. Unfortunately apart from a couple of rounds (2008) when MSD
paid for New Zealand wide coverage it is confined to 7 or 8 major cities, and has negligible
small town or rural coverage. But it has shed its compilation of official statistics component,
to retain only the survey data.
Adjacent to the MSD interest in social wellbeing was a stream of several surveys concerned
to measure the economic well-being of older New Zealanders, Maori and New Zealanders
more generally (2000, 2004, 2008). The living standards data then became based on the
Household Economic Survey (HES). This in turn was followed by the 2 yearly Stats NZ
General Social Survey (GSS) beginning 2008 which provided a broader foundation of social
measurement. Indeed, GSS data was taken by Crothers and Yeung (2017) to develop a
description of the ‘state of society’ in New Zealand prior to the election in that year.
The other central component of the 2000s NZ indicator framework was MSD’s Social Report.
At a political level (Minster Bennett) the report was discontinued although there was an
important one-shot update in 2016. Although this series was not continued it was carefully
developed conceptually and methodologically and forms a sound foundation for later work
and also supplementary exercises. Some of the validation was carried out by Alison Gray
(2002) who explored issues underlying measurement models with a range of interested
groups.) Several subsequent data-analyses of relevant NZ data have also confirmed the
3
Although there has been a small programme on social indicators housed in Statistics NZ in the early
1980s which carried out a dedicated survey, the current programmes of indicators began at the turn
of the Millenium, particularly as the result of trip to the UK by Minister of social Welfare (and
sociologist) Steve Maharey. In the mid-1990s, there was a burst on social capital and then time
budget diaries.
Time use surveys were another earlier arm to this. Some authors argue that time use data is useful
for revealing well-being, although links have not been explicitly developed (Callister, 2004). After an
early 1974 survey, Stats NZ has conducted time use surveys in 1998/9 and 2009/10 although a
planned 2019/20 follow up was not funded.
5Aotearoa New Zealand Journal of Social Issues, vol. 1
general thrust of indicator development and its components. Moreover, it generated
several other social indicator frameworks, some since abandoned.
There was also some interest from some regional councils, notably: Auckland, Waikato,
Wellington and Canterbury (and previously CERA).
Currently, the main attention to social indicators is retained by Waikato Regional and
Christchurch City Councils. The larger cities retain the QOL survey study begun in 2000. The
Local Government Act requires all local government organisations to set community outcomes
The National-led government (2009-2017) with its interest in ‘social investment’ (driven in
part by the interests of Deputy PM, later PM, Bill English) focused on the risks associated
with particular individuals and the actuarial outcomes of interventions and their effects in
life-time outcomes and government costs. The advent of the Labour-led government in 2017
with its focus on ‘wellbeing’ (and ‘investing in social well-being’) and in particular a
‘wellbeing budget’ was an explicit turn away to a more collective level analysis and a more
participatory basis for developing well-being frameworks. Ranges of possible indicators
were explored in various participatory exercises, across many localities. Perhaps the apex of
these convolutions was a widely-attended day-long programme held by SNZ in early
December 2018 which brain-stormed a wide range of possible indicators. The array of
indicators suggested at this gathering was then made available on the SNZ website although
many of the boxes were devoid of extant measures – see also Stats NZ, 2019.
The social indicator enthusiasm was carried on through a 2018 conference (organised by
Treasury and VUW) held in Wellington: see Weijers & Morrison (2018). International
developments in indicators have increasingly become relevant. This was particularly
facilitated by economist Conal Smith’s posting in OECD. International agencies actively
developing indicator frameworks include UN, OECD and New Zealand’s indicator
development is strongly shaped by these. Arthur Grimes was appointed to a Professorship in
Well-Being at VUW. A major impetus for further indicator work came from Treasury which
had long (since 2011 at least) been developing a Living Standards framework to provide a
wider framework for guiding its advice than the more usual cost benefit analysis.
3 Statistics NZ Wellbeing framework:
In providing the most general framework of the various alternatives SNZ might be adjudged
to be the centre of the system. It also the major provider of the statistics and has the virtue of
particular independence accorded the Government Statistician4. For documentation of the
development process see https://www.stats.govt.nz/indicators-and-snapshots/indicators-
aotearoa-new-zealand-nga-tutohu-aotearoa/.
The current framework is presented with almost no introduction, let alone commentary on
results5. Data is organised through ‘Dashboards’ within which each indicator is presented in
4
Indeed, my personal view is that the CEO of SNZ might be termed the People’s Statistician to
reinforce the point of this independence. Oddly in some comments there has been reference to the
‘chief statistician’.
5
Earlier Stats NZ indicator-sets on ‘progress indicators’ and ‘NZ Indicators’ are no longer being
updated.
6Aotearoa New Zealand Journal of Social Issues, vol. 1
charts and tables but usually also available to download CSV files provide all the data for
each topic-area, so that further analyses van be facilitated6. One major source of data is the
GSS and where possible indicators are provided not only for short-term trends but also as
broken down by age, sex, ethnicity and region. (Although a measure of social class such as
income or deprivation area of residence would have been a good addition.) Brief technical
descriptions of the construction of indicators and their source are usually provided.
The indicators are encompassed within a framework that cross-cuts three dimensions with 5
topics (further divided into some areas plus context variables) requiring more than 100
indicators to measure.
These measures cover three dimensions:
current wellbeing
future wellbeing (what we are leaving behind for future generations)
the impact New Zealand is having on the rest of the world (international impacts).
The well-beings whose progress is monitored involve social, cultural, economic, and
environmental wellbeing topics. (There is some debate about whether ‘cultural indicator’
might be added to this.) “The indicators support the government's wellbeing vision to provide
a more holistic view of wellbeing and sustainable development than a purely economic
measure does”. The Conference of European Statisticians (CES) measuring system is an
international guideline for measuring wellbeing and sustainability and was the basis for the
development of Ngā Tūtohu Aotearoa – Indicators Aotearoa New Zealand.
In addition to providing its own indicators a very useful feature of the StatsNZ indicators site
is that it provides tables show how their framework aligns with –
- The Treasury Living Standards Framework (see below)
- He Arotahi Tatauranga
- the UN’s Sustainable Development Goals.
He Arotahi Tatauranga evolved from work begun in 1995 (developed in 2002 and extensively
revised in 2014) by the Māori Statistics Forum to develop a Māori statistical framework
focused on the collective aspirations of Māori wellbeing and development. He Arotahi
Tatauranga means a focus on pathways to the future through statistics, with many entry
points and pathways within the tool. Thus, indicators with a common theme can be
considered while acknowledging the holistic and interconnected nature of wellbeing that
aligns with a Māori way of looking at the world. The dimensions or themes are
te ao Māori
human resource potential
empowerment and enablement
economic self-determination
social capability
6
Stats NZ has provided a wellbeing time series explorer which allows people the comparison
selected wellbeing data from the 2014, 2016, and 2018 general social surveys (GSS) and can be used
to produce data tables and graphs to show GSS results for different demographic groups in New
Zealand, as well as changes in wellbeing over time. https://www.stats.govt.nz/news/new-tool-for-
exploring-wellbeing-data
7Aotearoa New Zealand Journal of Social Issues, vol. 1
environmental sustainability.
As indicated above the framework is organised in terms of three dimensions. Current
outcomes seems straightforward, whereas Future wellbeing (wellbeing ‘later’) involves on
the resources the current generations will be leaving for future generations, including How
current choices affect the future population of New Zealand: wellbeing ‘later’ concerns the
resources that future generations need in order to achieve at least the same level of wellbeing
as that of the current generation. International impacts (wellbeing ‘elsewhere’) considers how
New Zealanders can impact on the wellbeing of other countries.
The super-topics of environment, economic social and cultural can be taken as fairly
straightforward although there are always boundary issues. Similarly the ‘domains’ (each
covering a set of indicators) are fairly straightforward although again there are several
boundary issues - whether some areas deserve their own domains and then which domain is
the best home for particular indicators. (Housing is one interstitial area which impinges on
economic, environmental and social issues and might be considered to deserve its own
domain status.
In addition, contextual indicators coving demographic and economic circumstances are
included to assist with interpreting the indicators since these affect the wellbeing outcomes
being measured.
The table below summarises the range of Statistics NZ indicators. (A listing of intended
indicators is provided at https://www.stats.govt.nz/reports/indicators-aotearoa-new-zealand-
nga-tutohu-aotearoa-key-findings-from-consultation-and-engagement).
https://www.stats.govt.nz/indicators-and-snapshots/indicators-aotearoa-new-zealand-nga-
tutohu-aotearoa/
Overview of NZ Indicators (Source, https://statisticsnz.shinyapps.io/wellbeingindicators/)
Current No. of Indic Future No. Indi International N In
indicat ators of cato o. di
ors with indi rs of ca
‘no cato with in tor
data’ rs ‘no di s
data ca wi
’ tor th
s ‘n
o
da
ta’
Environment
Air quality 1
Cities and settlements 7 4
Climate 1 1
Ecosystems 1 1
Land 1 1
Natural 23 14 1
capital
Waste 2 2 1
Water and sanitation 2
Economic
8Aotearoa New Zealand Journal of Social Issues, vol. 1
Economic standard of 10 1 2 1
living
Financial and 7 2 2
physical
Social
Governance 5 1
Health 8 2
Human 3 1 1
Capital
Knowledge and skills 5 2
Leisure 2 2
Safety 6 1
Social capital 4
Social connections 3 1
Subjective wellbeing 7 3
Work 9
Culture
Culture 3 1
Identity 2 1
4 Standard of Living Trends Monitoring
Some analyses are concerned with monitoring ongoing trends – without particular reference
to an overarching indicator-set. In addition to its SI framework, Stats NZ produces statistics
which feed-into ongoing monitoring work on the economic well-being of New Zealanders,
including children, from the Household Economic Survey (HES). Importantly, The Ministry
of Social Development (MSD) also reports on this in their annual Household Incomes Report
and the associated report using non-income measures (Perry, various years). The income,
wealth, consumption, and material wellbeing framework discussed in the Ministry of Social
Development (MSD) report (2018a) recognises that factors other than income can also affect
material well-being. Using non-income measures provides a direct measure of the actual day-
to-day living conditions of households – the basics of food, clothing, accommodation,
heating, and transport, and their ability to afford other items that most people would regard as
essential.
Stats NZ has collected non-income measures through the material well-being questionnaire
(MWQ) in the household economic survey (HES) since the 2006/07 survey. MWQ asks
about ownership of items, or doing certain activities, and the extent that people economise. It
also asks respondents how they rate their life satisfaction and whether income meets
everyday needs. In the 2015/16 HES collection year, and every three years following this, the
questionnaire also includes specific child-focused material hardship questions, such as the
ability to pay for school trips.
Alongside this some work (from Council of Trade Unions and poverty researchers) on
minimum income needed (St John and So, 2017) and similar topics.
As a key plank of the Labour-led government child poverty reduction is guided by its own
legislation (2018) which requires the government to set three-year and ten-year targets on
9Aotearoa New Zealand Journal of Social Issues, vol. 1
four primary measures, and the Government Statistician to report annually on 10 measures of
child poverty, in particular
- Material hardship
- Severe material hardship
- Low income and hardship: less than 60% median equivalised disposable household income
after housing costs (AHC) for the financial year and material hardship”
The HES provides the relevant data, having been enhanced to correct for a relatively small
sample size and a bias for against low-income or high-deprivation households - through an
increase in sample size and better targeting of low-income or high-deprivation households.
In methodological work multiple material hardship indexes, such as MWI, EU-13, and DEP-
17 were explored and it was decided to use DEP-17 as measure for material hardship. (DEP-
17 is a well-established deprivation index developed by the Ministry for Social
Development7. Work by Arthur Grimes with Tom Carver (2019) on the relationship of SWB
with each of ELSI (from 2012 GSS) and income shows that (2019) ELSI has a closer
relationship with SWB than does income.
In 2018 Parliament passed the Child Poverty Reduction Act, which requires governments to
report on and set targets to reduce rates of income poverty, and material hardship. The Act
deploys several different measures of income poverty and hardship with material hardship
broadly meaning that children are going without at least six essential things like warm clothes
or nutritious food. No specific child index has been created, although it is arguable that it is
important to measure hardship through items the child themselves lack or miss out on. For
example, certain families may ‘protect’ children from hardship by ensuring they have
essentials while doing without items themselves. The sample size of the HES was enhanced
to enable better robustness for smaller population. The first major report has been issued -
Perry (2021).
Again, the government-provided frameworks are supplemented and critiqued by other
researchers, especially the CPAG (e.g. McAllister et al., 2021) and the Otago University
Child Poverty Monitor (Duncanson et al, 2020). From 2013 the Monitor has tracked changes
in how many children in Aotearoa live in poverty, using a range of measures, and how poverty
impacts different aspects of their lives through health, education, housing and family
circumstances.
7
The material wellbeing index (MWI) is a revised version of the prototype economic living standards
index (ELSI) developed by MSD. From 2012/13 onwards the HES has included questions on material
well-being, which made it possible to calculate the 24-item MWI. The MWI covers the whole
spectrum of material well-being, ensuring some discrimination at the high end of material well-being
as well as at the low end. However, as a NZ index MWI does not enable international comparison.
MWI includes questions around ‘ownership or participation’, ‘economising’, ‘housing problems’,
‘freedoms/restrictions’, and ‘financial strain’. The DEP-17 index focuses on the low living standards
end of the spectrum and includes questions about ‘enforced lack of essentials’, ‘economised, cut
back, or delayed purchases a lot’, ‘in arrears more than once in last 12 months’, and ‘financial stress
and vulnerability’. The respondent is a caregiving adult from the household.
10Aotearoa New Zealand Journal of Social Issues, vol. 1
There are other research programmes which are in train which are concerned with assessment
and monitoring together with developing research which can draw on a world-class suite of
data-sets including not just the census and longitudinal census but also the IDI. The Whanau
and Family wellbeing research programme was developed by SUPERU and then transferred
to MSD. It is based on sophisticated analyses particularly of GSS data and has developed
useful frameworks for understanding the data (see reports in the SWBA hub).
6 Treasury Living Standards framework
In considerable contrast to the SNZ treasury indicator work is attended by a massive textual
support, although the relevant material is somewhat unclearly (since there is no landing-
page) distributed between a series of discussion papers and a dashboard of data.
The work on living standards (from 2011) was a drive to provide frameworks which might
complement and offset the economic focus of Treasury and add extra dimensions to its
policy advice. But it also was relevant to the 2019 ‘Welfare Budget’ of Deputy PM
Robertson. Analysis of the indicators from the Dashboard was also used, alongside other
wellbeing evidence, to inform development of the five priorities of the Government’s 2019
Wellbeing Budget. And it is central to the new four-yearly Wellbeing Report that the
Treasury will be required to produce under amendments to the Public Finance Act 1989. The
amendments to this Act require:
- every Government to, in each annual Budget Policy Statement:
a. State its wellbeing objectives; and,
b. Explain how its wellbeing objectives relate to the range of factors that it considers
matters to the long-term wellbeing of New Zealand, including (but not necessarily limited
to) consideration of social, economic, environmental, and cultural factors; and,
c. Explain how those objectives will guide its Budget.
and In each Fiscal Strategy Report:
d. Explain how its wellbeing objectives have guided its Budget; and,
e. Where those wellbeing objectives have changed, since the most recent Budget Policy
Statement, indicate any differences.
The Treasury is required to report periodically on wellbeing, at least every four years, in
addition to the existing two strategic products LTFS (Long-term Fiscal Position Statement ,
the Investment Statement and covering the following matters:
a. The state of wellbeing in New Zealand, using an appropriate set of wellbeing indicators
which are selected by the Treasury; and,
b. Discuss how those wellbeing indicators have changed over time; and,
c. Comment on the sustainability of, and risks to, the state of wellbeing in New Zealand
based on the wellbeing indicators selected by the Treasury.
The two are loosely related in that the former (Well-being report) might draw on the latter
(Well-being indicators), but annual reporting was deemed unnecessary while the 4 yearly
cycle would better fit longer term trends. The content and approach are left flexible with
the intention that the Treasury will select an appropriate set of wellbeing indicators using its
best professional judgment to provide a comprehensive, balanced and accessible view of
11Aotearoa New Zealand Journal of Social Issues, vol. 1
wellbeing, which is consistent with the available theory, evidence or data (in New Zealand
and overseas).
The slew of Treasury discussion papers is particularly concentrated on a publication surge in
early 2018: these include -
McLeod, Keith (2018) Our people - Multidimensional wellbeing in New Zealand (AP 18/04)
https://www.treasury.govt.nz/publications/ap/ap-18-04. The Treasury
Margreet Frieling (2018) The Start of a Conversation on the Value of New Zealand’s Social
Capital. Living Standards Series: Discussion Paper 18/04
Au, Joey; van Zyl, Sonette (2018) The Start of a Conversation on the Value of New Zealand's
Natural Capital (DP 18/03).
Emily O'Connell; Tia Greenaway; Trevor Moeke; Sacha McMeeking (2018) He Ara Waiora/A
Pathway Towards Wellbeing (DP 18/11). The Treasury
Sue Yong (2018) An Asian Perspective and the New Zealand Treasury Living Standards Framework
(DP 18/10). Auckland University of Technology
Thomsen, Su'a; Jez Tavita & Zsontell Levi-Teu (2018) A Pacific Perspective on the Living Standards
Framework and Wellbeing (DP 18/09).
The Treasury (2018) Note on Future Work on the Role of Culture in the Treasury’s Living Standards
Framework (DP 18/08). The Treasury
Margreet Frieling; Ken Warren (2018) Resilience and Future Wellbeing (DP 18/05). The Treasury
Judd Ormsby (2018) The Relationship between the Sustainable Development Goals and the Living
Standards Framework (DP 18/06). The Treasury
John Janssen (2018) The Start of a Conversation on the Value of New Zealand’s Financial/Physical
Capital (DP 18/07). The Treasury
Anita King (2018) Wellbeing Frameworks for the Treasury (DP 18/01).
Gulnara Huseynli & Nairn MacGibbon (2018) The Start of a Conversation on the Value of New
Zealand’s Human Capital (DP 18/02).
Suzy Morrissey (2018) The Start of a Conversation on the Value of New Zealand’s Human Capital
(DP 18/02)
Smith, Conal (2018) Treasury Living Standards Dashboard: Monitoring Intergenerational Wellbeing
Treasury Living Standards Dashboard: Monitoring Intergenerational Wellbeing.
Paul Dalziel; Caroline Saunders & Catherine Savage (2019) Culture, Wellbeing and the Living
Standards Framework: A Perspective (DP 19/02). Ministry for Culture and Heritage & The
Treasury
Te Puni Kōkiri (2019) An Indigenous Approach to the Living Standards Framework (DP 19/01).
Ministry of Māori Development—Te Puni Kōkiri and Treasury
Cook, Diana; Phil Evans; Hana Ihaka-McLeod; Kara Nepe-Apatu; Jez Tavita & Tim Hughes (2020)
He Kāhui Waiora: Living Standards Framework and He Ara Waiora COVID-19: Impacts on
Wellbeing (DP 20/02). The Treasury
Tim Hughes (2020) Justice, Wellbeing and Social Capital (DP 20/01). Ministry of Justice & The
Treasury
The central methodological paper (Smith 2018) provides a design for the system. The Living
Standards Framework (LSF) includes:
the 12 Domains of current wellbeing outcomes (see listing on dashboard diagram
below);
the four Capital stocks that support wellbeing now and into the future; and
risk and resilience.
12Aotearoa New Zealand Journal of Social Issues, vol. 1
In addition, there are various ways in which the relationship amongst domains might be
constructed. The Treasury design is ‘flat’ with each being of similar importance but arguably
quality of life and related measures might be seen as residing at an overarching level. There
is also interest in distributions – across people, places and generations – of matters across
all three of these dimensions.
Future wellbeing (wellbeing ‘later’) is concerned to monitor future potential progress: the
resources being left for future generations and how current choices might affect the future
population., and in particular the resources future generations would need in order to
achieve at least the same level of wellbeing as that of the current generation.
The international impacts (wellbeing ‘elsewhere’) dimension considers how describes the
way in which New Zealand generates its wellbeing ‘here and now’ New Zealanders’ actions
can impact on the wellbeing of other countries.
Economic wellbeing refers to the economic resources (material wealth and income) that
individuals, households, families, and whānau have available to meet their own needs and
contribute to wider economic growth, together with the control over these resources and
conditions individuals and groups have and the distribution of economic wellbeing. This
includes the financial resources people have access to, including individual and household
income and debt, consumption, and savings. Economic wellbeing acknowledges the
contribution of both paid and unpaid activities.
13Aotearoa New Zealand Journal of Social Issues, vol. 1
The Dashboard holds the data relevant to this includes a range of outcome indicators:
‘Our country’ provides data for each of the LSF Wellbeing Domains. This includes
distributional data and international comparisons, where available.
‘Our future’ provides data about stocks of each of the four Capitals in the LSF. This includes
international comparisons, where available.
‘Our people’ provides supplementary analysis of how wellbeing varies across population
groups and the relationships between the LSF Wellbeing Domains.
LSF2011 and LSF2018, following the OECD, combined some of these capitals and omitted
others, resulting in a four-capitals model: see diagram. Since LSF2011, the capitals have
been described as the ‘stocks’ and the wellbeing domains as the ‘flows’ that those capitals
facilitate. In LSF2018 a further distinction was introduced between the wellbeing domains as
representing current wellbeing and the capitals representing future wellbeing.
LSF2021 is under active development (see Treasury, 2021- forthcoming) involving several
extra steps, some to accommodate emerging policy attention to ethnic/cultural issues and
14Aotearoa New Zealand Journal of Social Issues, vol. 1
especially Maori and Pacifica and to children’s wellbeing which re seen as the policy areas
most in need of attention. The new LSF has three levels and a series of analytical prompts
that apply to all three levels.
Level one captures those resources and aspects identified as important for wellbeing as
individuals, families, whānau and communities. In LSF2018 wellbeing was implicitly
conceived of as about individual people whereas In LSF2021 the concept of collective
wellbeing has been introduced to reflect the importance of families, whānau and
community. The definitions of the 12 wellbeing domains have been revised to better reflect
child wellbeing and the wider role culture plays beyond identity: For example, the ‘social
connections’ domain has been redefined as ‘family and friends’ to capture the central
importance of attachment to the wellbeing of children.
Level 2: Our Institutions and Governance is a new level in the LSF capturing the role of
political, economic, social and cultural institutions in facilitating the wellbeing of individuals
and collectives, as well as safeguarding and building of national wealth. This layer captures
the role that, for example, schools have in the wellbeing of children, and marae have in the
wellbeing of tangata whenua.
Level 3: The Wealth of Aotearoa New Zealand captures wealth as a country, including
aspects of wealth not fully captured in the system of national accounts, such as human
capability and the natural environment. Culture is added as underpinning all aspects of our
wealth.
In LSF2021 ‘capital’ is now only used for financial and physical capital, which together with
human capability, social cohesion and the natural environment are collectively referred to
as the ‘Wealth of Aotearoa New Zealand’. This change in language reflects that things like
the natural environment, our health and skills are valued for more than their role as factors
of production, particularly in certain cultural traditions. Some aspects of the wealth and
wellbeing domains have also been refined to clarify their overlapping relationship with one
another. For example, the wellbeing domains of health, knowledge and skills, and cultural
capability and belonging each capture a part of human capability, and as wellbeing domains
capture the private benefit these personal characteristics generate for the individuals and
communities that are healthy, skilful, and culturally capable. At the third level of the
framework, the human capability aspect of NZ’s wealth captures the public benefit that is
created for all of us here in Aotearoa New Zealand by having a healthy, skilful and culturally
capable population in aggregate.
The ‘Analytical prompts’ of productivity and sustainability, alongside distribution and resilience, have
been added as lenses with which to analyse wealth and wellbeing. These are designed to provide
criteria to indicate whether observed patterns at different levels of the framework are concerning or
not.
In sum, adapting LSF to more recently stressed concerns and extending its components has pushed
the LSF well beyond the platform set by the Social Report, and doubtless the changes made will need
to reverberate around the whole indicator system.
15Aotearoa New Zealand Journal of Social Issues, vol. 1
7 Other Frameworks
Beyond the heavy-lifting indicator providers of Stats NZ and Treasury there is a sprawl of
other indicator-systems, each grouping of which will be briefly covered:
- Economic, Environmental & Cultural indicators (coeval with SWB indicators at a
general level),
- Regional and local
- Population-group orientated Ministries
- Welfare service agencies
- Vulnerability, resilience and risk indicators
- Inter-generational indicators
- Unorthodox, Academic, NGO and commercial indicator providers.
7.1 Economic Indicators
16Aotearoa New Zealand Journal of Social Issues, vol. 1
New Zealand’s economy is measured through an elaborated suite of economic indicators
drawing on a wide array of data collections, many of which are tied to the synthetic National
Accounts system which provides an overarching conceptual apparatus. There are cross-
overs but social indicators are mainly concerned with social realities beyond the economic.
This is a very large topic but a short introduction to NZ’s main economic indicators is
provided by
The goals of economic indicators are to:
- monitor progress towards economic goals and to benchmark a nation’s performance
against that of other nations.
-allow the tracking and comparison of performance both in terms of high-level outcomes
(such as income and wealth levels) and the underlying factors
that may influence these outcomes over time (such as levels of innovation and skills);
- help to evaluate the effectiveness of economic policy by tracking the direction or
pace of change over time.
The paper covers:
* Economic growth – National Accounts and Gross Domestic Product (GDP)
* Employment and unemployment – Quarterly Employment Survey (QES),
* Labour Cost - Household Labour Force Survey (HLFS)
* Inflation – Consumer Price Index (CPI)
* External – Balance of Payments (BOP)
* Finance and International – Stock market and exchange rate.
7.2 Environment Indicators (see MFE, 2021)
While there are some linkage environmental indicators are a separate indicator-set. New
and updated indicators for New Zealand’s Environmental Reporting Series: Our land 2021,
jointly developed by Stats NZ and the Ministry for the Environment (MfE) were published
during April 2021 framed within a “pressures, states, and impacts” conceptualisation. .
These included 13 indicators: one new, and 12 updated and expanded8. The Environmental
Reporting Act 2015 (the Act) requires Stats NZ and MfE to publish regular reports about the
state of the environment and their target has been to publish every six months a report on
one of the five domains– air, marine, fresh water, atmosphere and climate, and land –
together with a synthesis report on the state of New Zealand's environment as a whole
every three years. Besides maps and data-sets the Our land 2021 report also draws on
scientific literature – published, peer-reviewed articles, and technical reports.
The ERS is supplemented by Environmental health indicators provided by The Environmental
Health Intelligence New Zealand (EHINZ) at Massey University, Wellington
indicators https://www.ehinz.ac.nz/indicators/ which describe links (where possible causal)
8
all potential statistics were peer-reviewed and assessed against the six criteria from the data
quality framework (as outlined in Principles and protocols for producers of Tier 1 statistics):
relevance, accuracy, timeliness, accessibility, coherence and consistency, and interpretability
17Aotearoa New Zealand Journal of Social Issues, vol. 1
between the environment and health. The environmental health indicators cover a wide
range of topics arranged in 12 domains9:
7.3 Cultural Indicators
Ministry of Culture and Heritage has a ‘legacy’ indicator system – see key indicators
https://mch.govt.nz/statement-intent-2011-2014/key-indicators. There are three sector
outcome areas:
- Outcome 1: Cultural activity flourishes in New Zealand (Create)
- Outcome 2: Our culture and heritage can be enjoyed by future generations
(Preserve)
- Outcome 3: Engagement in cultural activities is increasing (Engage).
This area is ripe for further development (a Treasury paper in particular focuses on this) and
is treated in part in a later section on Maori-relevant indicators.
7.4 Social Cohesion indicators
A recent addition to indicator frameworks concerns social cohesion (together with
associated concepts such as social capital, inclusion/exclusion etc).
https://www.msd.govt.nz/about-msd-and-our-work/publications-resources/information-
releases/cabinet-papers/2021/approach-to-improving-social-cohesion-and-public-
engagement.html. This concern has developed in considerable part because of apparent
threats to social cohesion through the increasing social complexity produced by immigrant
flows from people of different ethnicities than those currently in New Zealand. Some
indicators for measuring social cohesion was laid out by Spoonley at al. (2005) and revisited
more recently (Peace & Spoonley, 2019). Spoonley et al (2005) developed a framework
particularly focused on immigrants and their social inclusion. More recently with the
concerns raised over terrorism and its effects, there has been a renewed concern with social
cohesion on a broader scale: see MSD (2021) in which it is indicated that beyond
incorporating treaty issues the “..work on social cohesion goes beyond ethnicity and faith,
and includes a broad definition of diversity including ages, cultures, beliefs, disabilities,
family composition, where people live, gender identities, and sexual orientation” and the
approach seeks practical means of intervention to build social cohesion. MSD (2021) has
also reviewed this areas of literature and is actively engaged in developing measures.
7.5 Local Government: Community Well-beings
Concerns for enhancing well-being has also been scaled downwards. Some examples of local
authority-level indicator-sets were mentioned earlier. The Local Government (Community
Well-being) Amendment Act (2019) extended the purposes of local government to promote
Air quality, Animals & human health, Alcohol-related harm, Border health, Children, Climate change,
Hazardous substances, Indoor environment, Population vulnerability, Transport, UV exposure,
Water.
18Aotearoa New Zealand Journal of Social Issues, vol. 1
community well-being: improving the social, economic, environmental and cultural well-
being of our communities. Local Authority Professionals Aotearoa
https://taituara.org.nz/community-well-beings has developed The Taituarā Community
Well-being Service to support local councils with this task.
7.6 Ageing Indicators
The Office for Senior Citizens developed a regular (over 5 years) programme of monitoring
the wellbeing and quality of life of older New Zealanders: https://www.msd.govt.nz/about-
msd-and-our-work/publications-resources/monitoring/positive-ageing-
indicators/index.htm. Guided by the Positive Ageing Strategy, the report for the first
iteration was organised around 10 outcomes domains capturing aspects of wellbeing and
quality of life for older people10. In the current ‘Covid’ period several updates (latest July
2021) were issued of the key indicators being used to track the impact of COVID-19 on older
people. The Office for Seniors has now moved its focus to reporting on the initial Better
Later Life indicators as outlined in the Better Later Life – He Oranga Kaumātua 2019 to 2034
strategy11:
7.7 Children and Young People:
There has long been separate attention to well-being indicators for children and young people, and
several agencies involved – Office of Children’s Commissioner, MSD, Oranga Tamariki, the Ministry
of Youth Development and Prime Ministers and Cabinet department’s children’s units. In 2008 the
second Children and Young People: Indicators of Wellbeing was issued. The Child and Youth
Wellbeing Strategy https://childyouthwellbeing.govt.nz/measuring-success/indicators has an array
of progress indicators. The indicators were developed from expert review together with feedback
from the public consultation. The research literature shows that people's impressions of their
circumstances are usually most predictive of their future wellbeing, and that thus children and young
people are often the best experts about their own wellbeing and that what is measured needs to
reflect children and young people’s experience of the things they said were important to their
wellbeing such as asking them directly about things like feeling safe and the wellbeing of their family
and whānau. A set of 36 indicators was developed12 around 6 outcomes:
.
10
Sections include - Population overview; Health; Care and support; Education; Economic security;
Safety; Civil and political rights; Justice; Cultural identity; Social connectedness; Environment.
11
Achieving financial security and economic participation; Promoting healthy ageing and improving
access to services; Creating diverse housing choices and options; Enhancing opportunities for social
connection; Making environments accessible.
12
“The criteria included a preference for indicators that are strengths-based, relevant and easily
understood, applicable to all children and young people, and aligned with the other government
indicators and measurement frameworks to enable consistency and coherency across Government”.
See https://childyouthwellbeing.govt.nz/measuring-success/indicators. The outcomes are: Loved,
safe and nurtured; Have what they need; Happy and healthy; Learning and developing; Accepted,
respected and connected; Involved and empowered.
19Aotearoa New Zealand Journal of Social Issues, vol. 1
A wide array of data sources have been tapped to provide the measure - comprising
government databases long term and newly established surveys – in particular The Youth
Health and Wellbeing Survey – WhatAboutMe?13
Child Poverty monitoring is an overlapping programme referred to above. There are also
Youth Justice Indicators which s measure volumes and patterns across key stages in the
youth justice system - entry into the system, how young people progress through it, and
reoffending. The resulting infographics summarise data by ethnic group, offence type,
gender and Police District.
7.8 Gender
Gender (now including categories beyond the binary) is common breakdown, but in addition the
Ministry for Women issued a report on Women’s Indicators for Change
https://women.govt.nz/sites/public_files/indicators-for-change.pdf. Many of the indicators
are common but one area provided in more detail is work/life balance.
7.9 Health system indicators
There is a wide range of data on health conditions which from time to time have been
ordered into indicator-sets. The 2021 changes to Heath organisation have been
complemented by a new proposed indicator-set. The indicators framework builds on six
Government priorities and 12 high-level indicators. The new framework replaces health
targets, the previous national performance measures for our health services.
The Health System Indicators framework has been developed by the Ministry of Health and
the Health Quality & Safety Commission. It builds on the System Level easures programme
that was co-designed with health and disability sector. The Commission has developed an
online dashboard for reporting improvements on the Health System Indicators. This new
framework identifies 12 national high level performance indicators while taking into account
that every community has different health challenges. The emphasis is on continuous
improvement at a local level to lift overall health system performance, rather than on
achieving nationally-set performance targets14.
7.10 Social Services Sector Indicators
Each of the various State welfare services has indicators available on their data web-pages,
sometimes in support of particular strategies, but not organised into a more formal system.
13
“This is expected to be the largest survey of young people in a generation and will ask around 14,000 young
people about their experience, health and wellbeing. The WhatAboutMe? survey is intended to be the main
data source for approximately half of the Strategy's indicators, including most of the subjective wellbeing
measures. However, because of COVID-19, data collection has been delayed until 2021”.
14
Government priorities are: Improving child wellbeing, Improving mental health, Improving
wellbeing through prevention, Strong and equitable public health system, Better primary health
care. See https://www.health.govt.nz/new-zealand-health-system/health-system-indicators-
framework.
20Aotearoa New Zealand Journal of Social Issues, vol. 1
7.11 Vulnerability, Risk and Resilience Indicators
Major indicator projects have been sponsored by National Science Challenge research
programmes, both ostensibly on much the same issue – interactions between natural
hazards and disasters and communities.
Social vulnerability indicators (Mason et al., 2021) help identify areas with people who are
more vulnerable to the negative impacts of natural hazards and emergencies. Such
communities may be less able to prepare for, cope with or adapt to a hazard and therefore
are more likely to be affected by a hazard. A set of small-area mainly 2018 census data are
built on an earlier set of social vulnerability indicators for flooding, developed using 2013
Census data. The indicators are intended to inform planning, response, and recovery for
natural hazards and pandemics and cover the three main components of exposure,
susceptibility, and resilience.
Given our disaster-prone natural environment, understanding and enhancing the disaster
resilience of our communities is important and tracking the development of interventions
that enhance communities’ resilience can be measured through a sun-national resilience
assessment tool: the New Zealand Resilience Index (NZRI). Resilience is defined in the
National Disaster Resilience Strategy as: The ability to anticipate and resist the effects of a
disruptive event, minimise adverse impacts, respond effectively post-event, maintain or
recover functionality, and adapt in a way that allows for learning and thriving informed by
New Zealand’s national and international resilience strategies a review was prepared which
then allowed the establishment of a theoretical framework which shows the various
dimensions of resilience and how they relate to each other. Resilience is broken down into
seven community “capital” domains. In the CCF model there are seven different
components of community capital: natural, cultural, human, social, political, financial, and
built. An extensive list of metrics for measuring these is provided.
7.12 Intergenerational mobility/inheritance indicators
An emerging area of indicator work is to convert the array of studies of intergenerational
mobilities into institutionalized indicators. The OECD and more particularly WEF are already
pushing in this area with the former developing some intergenerational measures such as
the number of generations required in each country to reach the median from stating as low
income parental background while the latter has recently a global social l mobility index. For
NZ 4 generations are required (placing NZ amongst a second tier and NZ is 33rd on the GSM
index. It is not yet clear how some of the dimensions of intergenerational persistence –
income, education, occupation, wealth etc – are best combined an.
7.13 Nonorthodox indicators
In addition to the usual indicators built on official book-keeping or survey data non-orthodox
indicators gleaned from big data may be a useful complement. Work on twitter data has
yielded a daily ‘gross national happiness index
https://www.scoop.co.nz/stories/CU2004/S00012/gross-national-happiness-index-shows-
true-mood-of-country.htm
21You can also read